

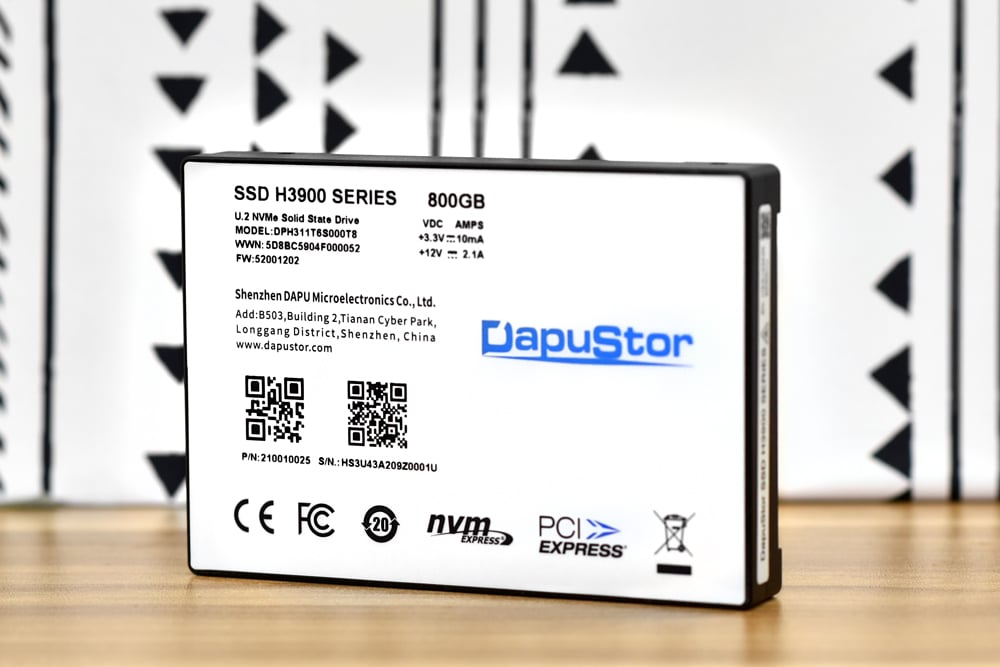
The DapuStor H3900 is an enterprise SSD that is part of the company’s Haishen3-XL line. Unlike the H3100 or the H3200, the DapuStor H3900 is based around KIOXIA XL-FLASH technology (the first drive available on the market with the new technology), hence the name of Haishen3-XL. Being based around storage class memory (SCM), this SSD will share similar use cases to of media of the same class including data cache and acceleration, in-memory database, AI training, and Big Data.
Storage Class Memory has been out for a few years now with Intel’s Optane more or less dominating that segment of the market. It is nice to see some competition to see how they hold up to each other. When there is only one option, of course it is the best. Like other SCM, the DapuStor H3900 SSD will provide ultra-low latency with higher performance. DapuStor quotes up to 3.5GB/3.2GB bandwidth, 830K/300K IOPS at low queue depth workloads with 20μs read latency. On top of performance gains, the drive also has some amazing endurance with up to 30DWPD. The drive leverages the Marvell ZAO controller.
As with other SCM, there is a limit on capacity. The H3900 comes in 400GB, 750GB, 800GB, and 1.6TB capacities. For this review we will be looking at the 800GB version.
DapuStor H3900 SSD Specifications
| Model No | H3900 | ||||
| Capacity (TB) | 0.4 | 0.75 | 0.8 | 1.6 | |
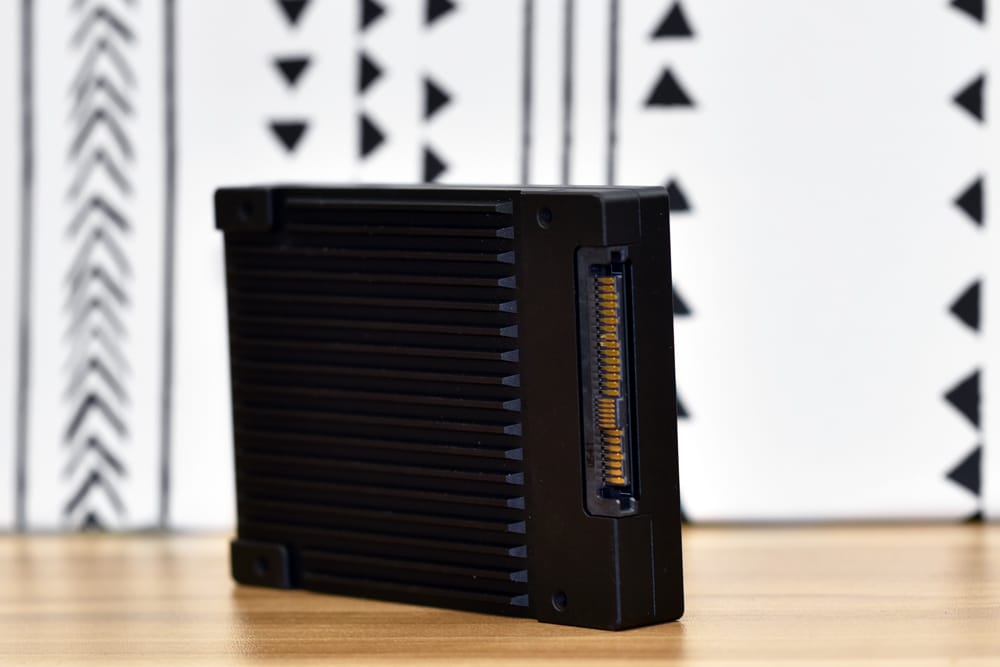
| Form Factor | U.2 & HHHL | ||||
| Interface | PCIe3.0 x 4 NVMe 1.3 | ||||
| Flash Type | 96L 3D XL-FLASH | ||||
| Read Bandwidth (128KB) MB/s | 3500 | 3500 | 3500 | 3500 | |
| Write Bandwidth (128KB) MB/s | 3000 | 3100 | 3100 | 3200 | |
| Random Read (4KB) KIOPS | 830 | 830 | 830 | 830 | |
| Random Write (4KB) KIOPS | 246 | 350 | 300 | 288 | |
| Power Consumption (Typ./Max) Watt | 7.0/8.1 | 7.0/8.5 | 7.0/8.5 | 7.0/9.5 | |
| Lifespan | 30 DWPD | ||||
| 4K Random Latency (Typ. ) R/W μs | 30/17 | 20/09 | ||||
| Uncorrectable Bit Error Rate (UBER) | <10-17 | ||||
| Mean Time Between Failure (MTBF) | 2 million hours | ||||
| Supported OS | RHEL, SLES, CentOS, Ubuntu, Windows Server, VMware ESXi | ||||
| Certification | FCC, CE, ROHS, REACH, WEEE, PCI express, NVM express | ||||
DapuStor H3900 SSD Performance
Testbed
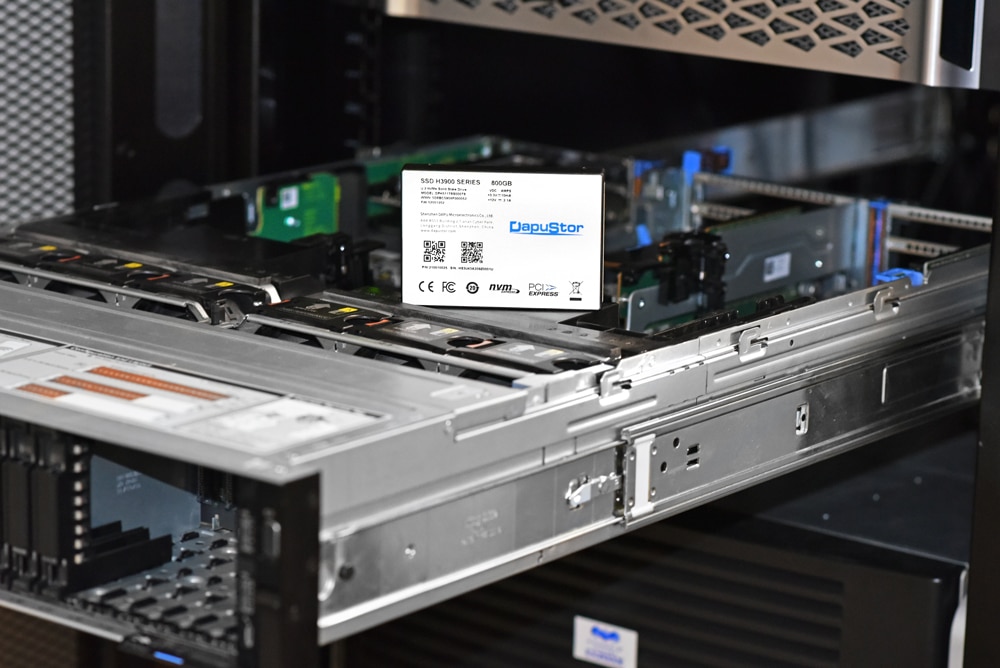
Our Enterprise SSD reviews leverage a Lenovo ThinkSystem SR850 for application tests (Note: we had to use an adapter card instead of a front bay slot due to a compatibility issue) and a Dell PowerEdge R740xd for synthetic benchmarks. The ThinkSystem SR850 is a well-equipped quad-CPU platform, offering CPU power well in excess of what’s needed to stress high-performance local storage. Synthetic tests that don’t require a lot of CPU resources use the more traditional dual-processor server. In both cases, the intent is to showcase local storage in the best light possible that aligns with storage vendor maximum drive specs.
Lenovo ThinkSystem SR850
- 4 x Intel Platinum 8160 CPU (2.1GHz x 24 Cores)
- 16 x 32GB DDR4-2666Mhz ECC DRAM
- 2 x RAID 930-8i 12Gb/s RAID Cards
- 8 NVMe Bays
- VMware ESXI 6.5
Dell PowerEdge R740xd
- 2 x Intel Gold 6130 CPU (2.1GHz x 16 Cores)
- 4 x 16GB DDR4-2666MHz ECC DRAM
- 1x PERC 730 2GB 12Gb/s RAID Card
- Add-in NVMe Adapter
- Ubuntu-16.04.3-desktop-amd64
Testing Background and Comparables
The StorageReview Enterprise Test Lab provides a flexible architecture for conducting benchmarks of enterprise storage devices in an environment comparable to what administrators encounter in real deployments. The Enterprise Test Lab incorporates a variety of servers, networking, power conditioning, and other network infrastructure that allows our staff to establish real-world conditions to accurately gauge performance during our reviews.
We incorporate these details about the lab environment and protocols into reviews so that IT professionals and those responsible for storage acquisition can understand the conditions under which we have achieved the following results. None of our reviews are paid for or overseen by the manufacturer of equipment we are testing. Additional details about the StorageReview Enterprise Test Lab and an overview of its networking capabilities are available on those respective pages.
Application Workload Analysis
In order to understand the performance characteristics of enterprise storage devices, it is essential to model the infrastructure and the application workloads found in live production environments. Our benchmarks for the DapuStor H3100 are therefore the MySQL OLTP performance via SysBench and Microsoft SQL Server OLTP performance with a simulated TCP-C workload. For our application workloads, each drive will be running 2-4 identically configured VMs.
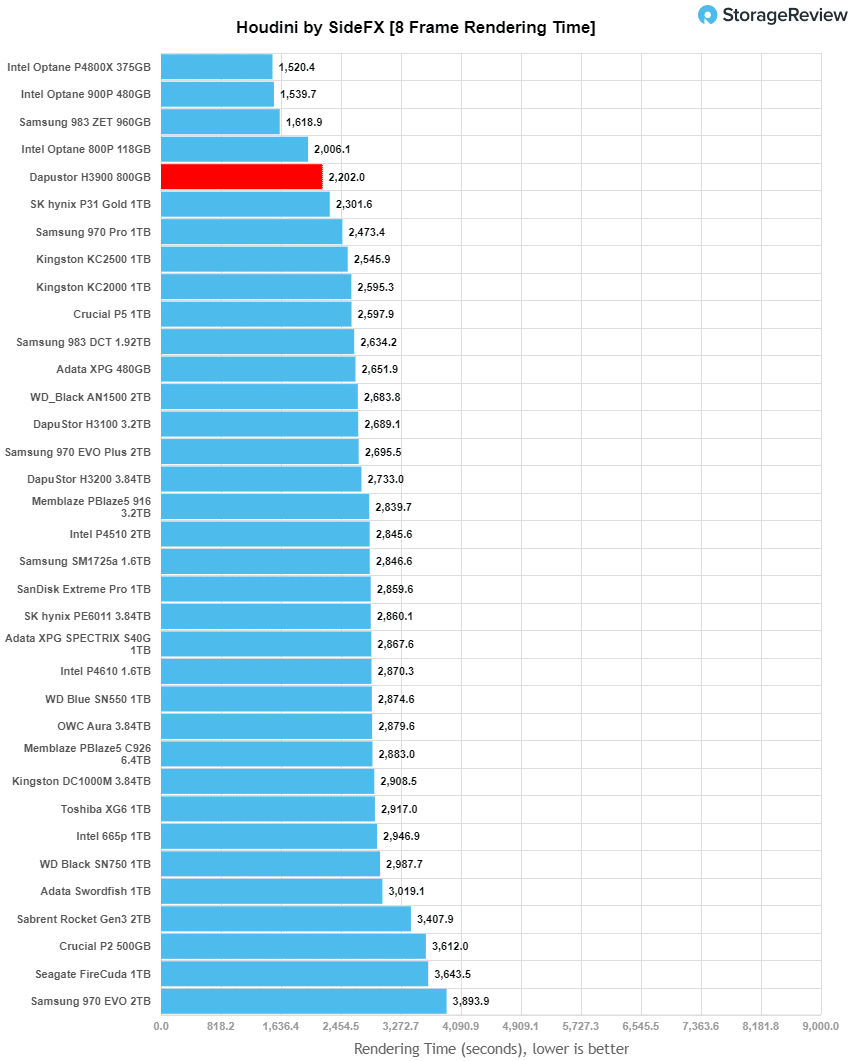
Houdini by SideFX
The Houdini test is specifically designed to evaluate storage performance as it relates to CGI rendering. The testbed for this application is a variant of the core Dell PowerEdge R740xd server type we use in the lab with dual Intel 6130 CPUs and 64GB DRAM. In this case, we installed Ubuntu Desktop (ubuntu-16.04.3-desktop-amd64) running bare metal. Output of the benchmark is measured in seconds to complete, with fewer being better.
The Maelstrom demo represents a section of the rendering pipeline that highlights the performance capabilities of storage by demonstrating its ability to effectively use the swap file as a form of extended memory. The test does not write out the result data or process the points in order to isolate the wall-time effect of the latency impact to the underlying storage component. The test itself is composed of five phases, three of which we run as part of the benchmark, which are as follows:
- Loads packed points from disk. This is the time to read from disk. This is single-threaded, which may limit overall throughput.
- Unpacks the points into a single flat array in order to allow them to be processed. If the points do not have dependency on other points, the working set could be adjusted to stay in-core. This step is multi-threaded.
- (Not Run) Processes the points.
- Repacks them into bucketed blocks suitable for storing back to disk. This step is multi-threaded.
- (Not Run) Writes the bucketed blocks back out to disk.
Here, the DapuStor H3900 was able to hit 2,201.987 seconds putting right in range with the other SCM drives.
VDBench Workload Analysis
When it comes to benchmarking storage devices, application testing is best, and synthetic testing comes in second place. While not a perfect representation of actual workloads, synthetic tests do help to baseline storage devices with a repeatability factor that makes it easy to do apples-to-apples comparison between competing solutions. These workloads offer a range of different testing profiles ranging from “four corners” tests, common database transfer size tests, to trace captures from different VDI environments. All of these tests leverage the common vdBench workload generator, with a scripting engine to automate and capture results over a large compute testing cluster. This allows us to repeat the same workloads across a wide range of storage devices, including flash arrays and individual storage devices. Our testing process for these benchmarks fills the entire drive surface with data, then partitions a drive section equal to 25% of the drive capacity to simulate how the drive might respond to application workloads. This is different than full entropy tests which use 100% of the drive and takes them into steady state. As a result, these figures will reflect higher-sustained write speeds.
Profiles:
- 4K Random Read: 100% Read, 128 threads, 0-120% iorate
- 4K Random Write: 100% Write, 64 threads, 0-120% iorate
- 64K Sequential Read: 100% Read, 16 threads, 0-120% iorate
- 64K Sequential Write: 100% Write, 8 threads, 0-120% iorate
- Synthetic Database: SQL and Oracle
- VDI Full Clone and Linked Clone Traces
Comparables:
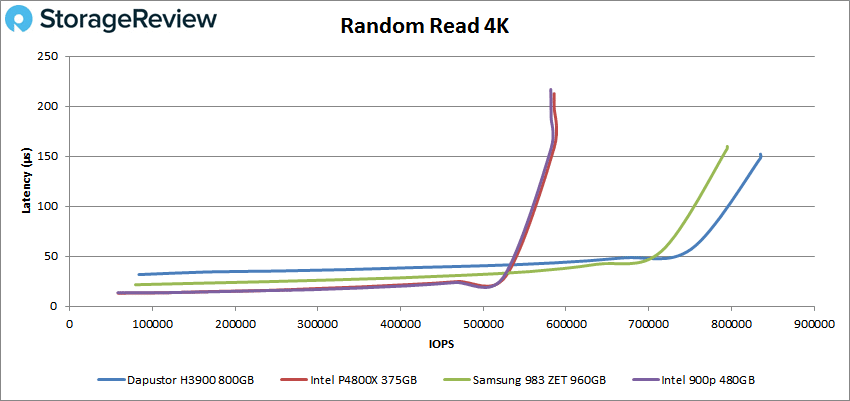
In our first VDBench Workload Analysis, Random 4K Read, the DapuStor stated with performance at a latency of just 31.7µs and went on to peak at 835,064 IOPS with a latency of just 148.2µs before dropping just a bit. This put the drive in first by a comfortable margin.
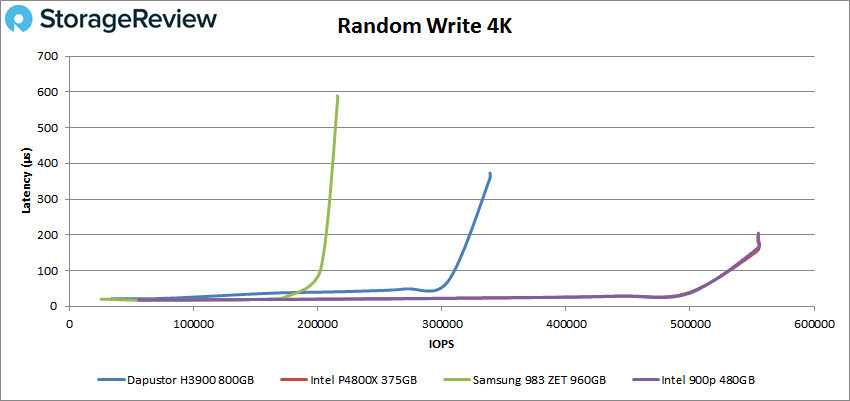
4K random write was a different story for the H3900. Here the drive took third with a peak performance of 338,630 IOPS with a latency of 457.4µs.
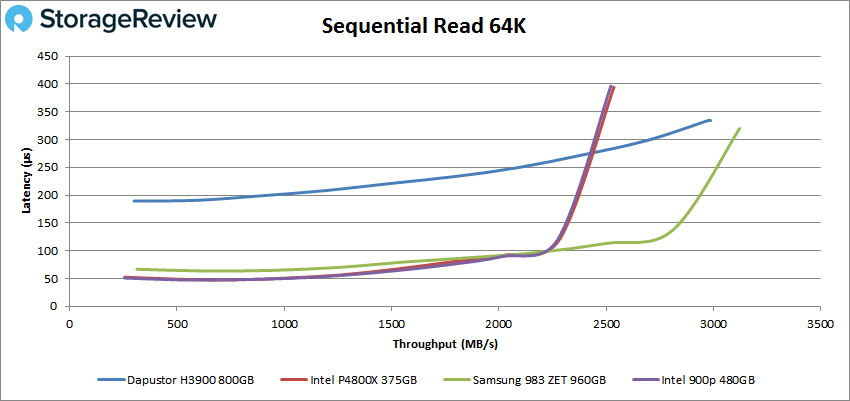
Switching over to sequential workloads we look out our 64K benchmarks. For sequential read the H3900 peaked at 47,707 IOPS or 3GB/s at a latency of 334.3µs for second place.
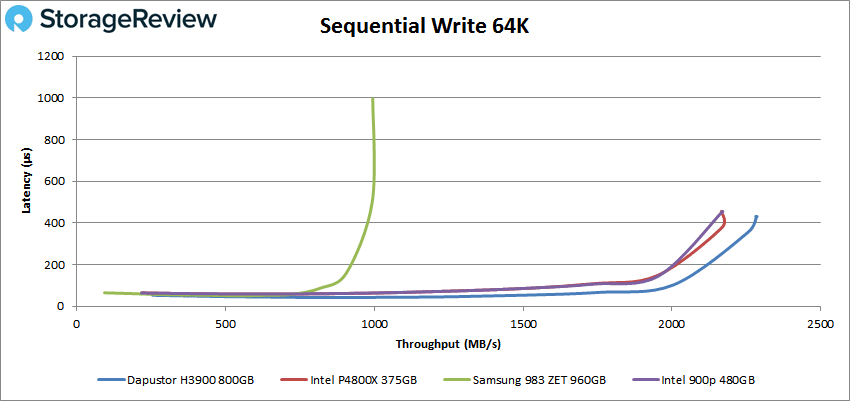
With 64K sequential write the DapuStor came out on top again with a peak of 36,571 IOPS or 2.3GB/s at a latency of 431µs.
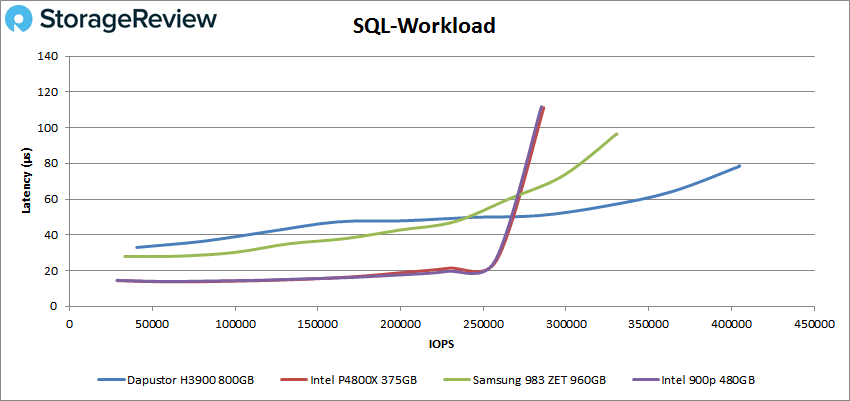
Our next set of tests are our SQL workloads: SQL, SQL 90-10, and SQL 80-20. Starting with SQL, the DapuStor H3900 had an impressive run with its entirety staying under 100µs. The drive peaked at first place with 405,709 IOPS and a latency of just 78.6µs.
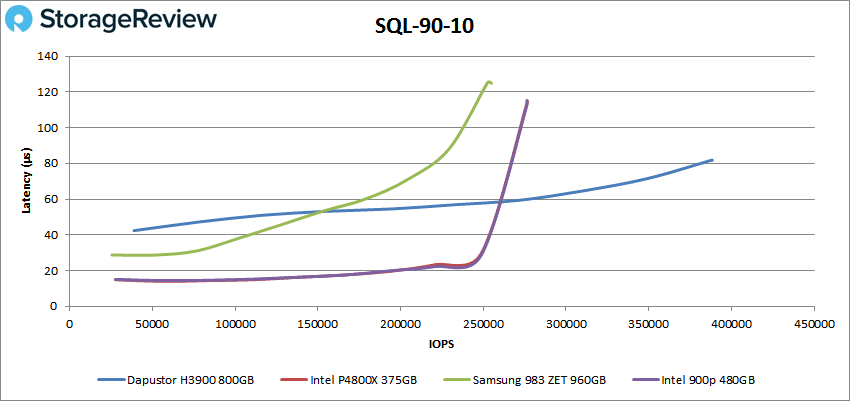
For SQL 90-10 the H3900 repeated its latency trend with a peak score of 388,430 IOPS with a latency of only 81.8µs. The drive easily took first place.
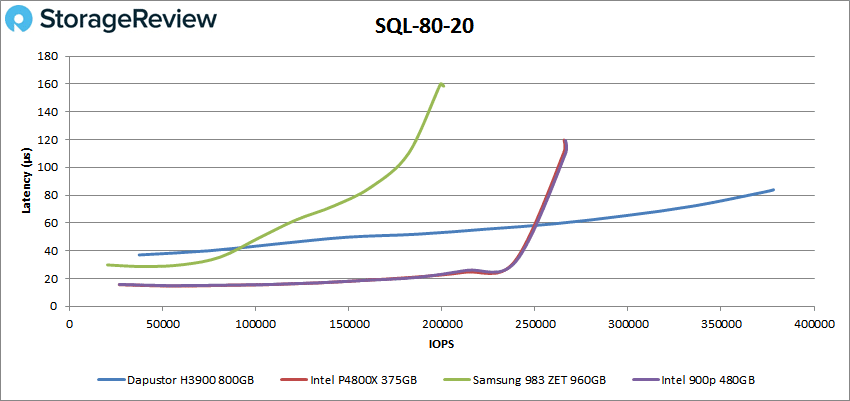
SQL 80-20 showed the H3900’s best placement yet with a peak of 378,175 IOPS at 83.9µs for latency, well ahead of the pack.
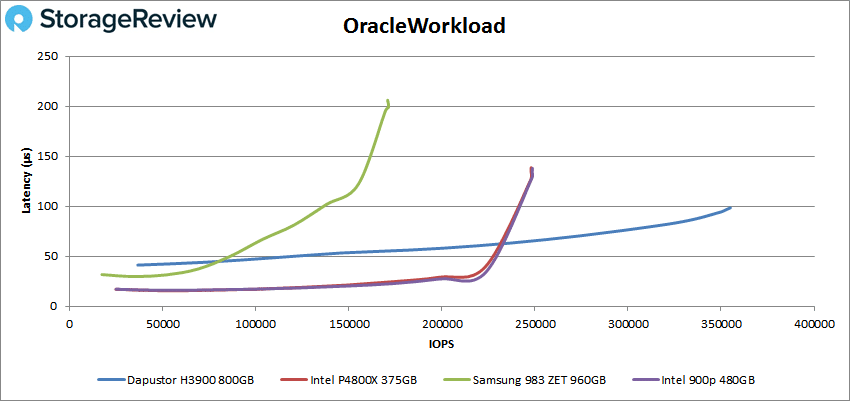
Next up are our Oracle workloads: Oracle, Oracle 90-10, and Oracle 80-20. Starting with Oracle, the DapuStor H3900 continued on with its extremely low latency dominance. The drive took first with a peak of 354,991 IOPS with a latency 98.5µs.
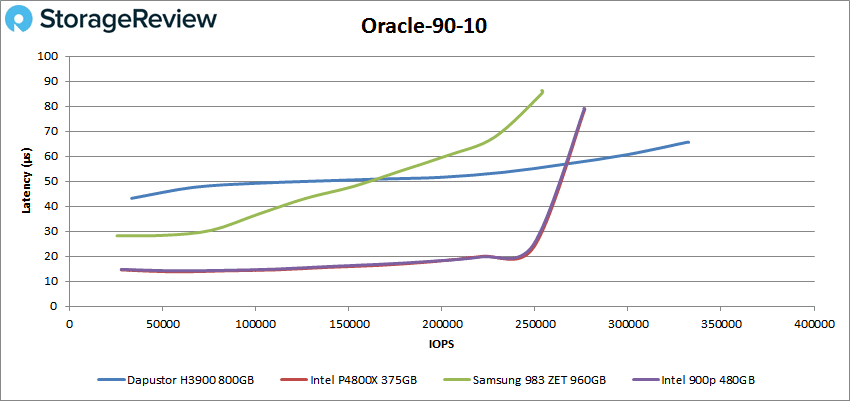
With Oracle 90-10 the H3900 stayed in the first with a peak of 332,320 IOPS and a latency of 65.7µs.
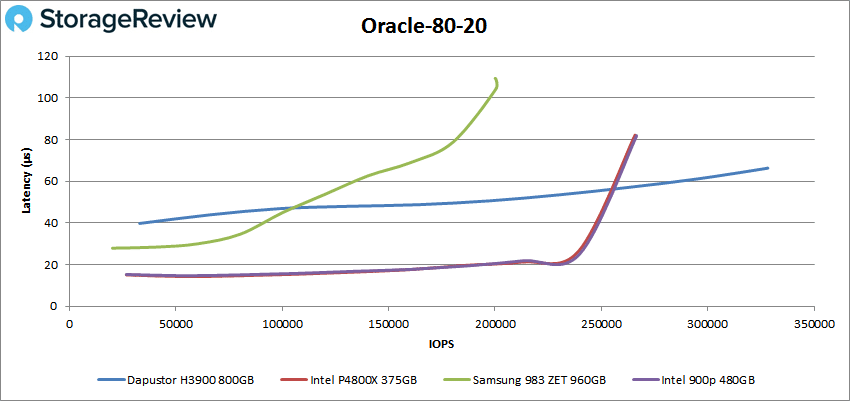
Oracle 80-20 once again had the H3900 on top with 328,103 IOPS and a latency of 66.3µs.
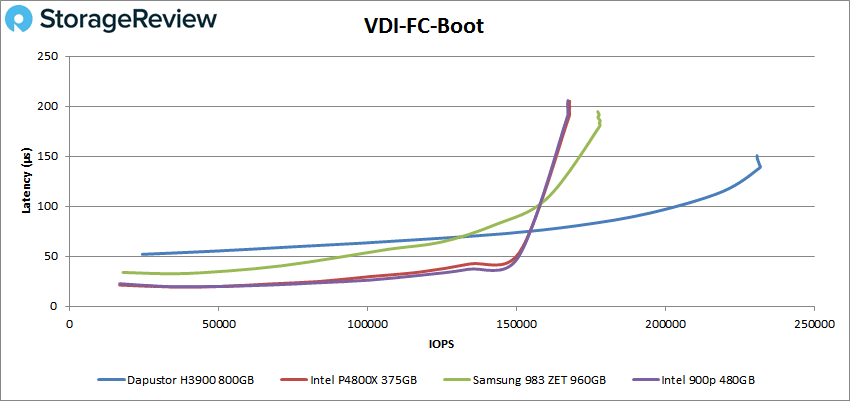
Next, we switched over to our VDI clone test, Full and Linked. For VDI Full Clone (FC) Boot, the DapuStor H3900 was way out in the lead with a peak of 231,866 IOPS with a latency of 138.8µs before dropping off some.
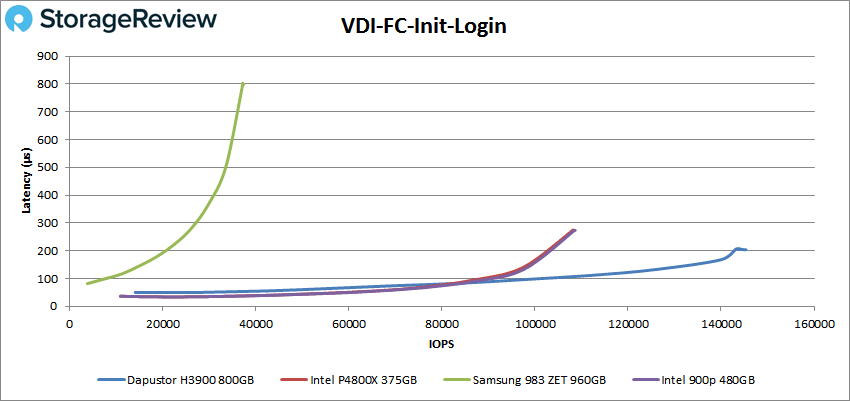
For VDI FC Initial Login the H3900 was on top with a peak of 145,357 IOPS and a latency of 203.4µs.
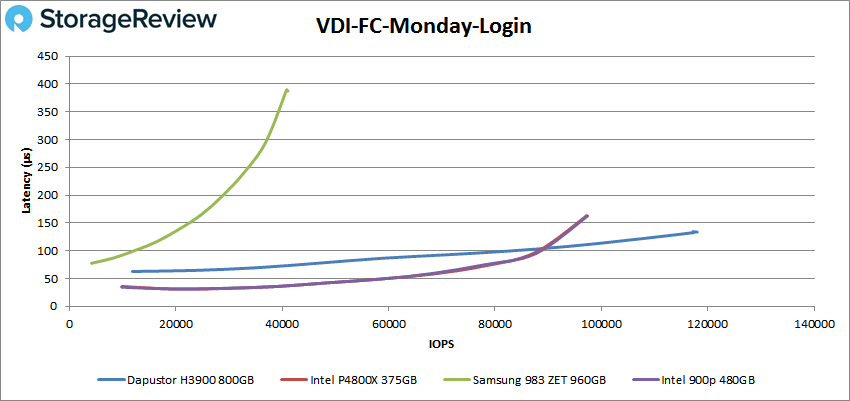
VDI FC Monday Login saw the DapuStor take the stop spot with 118,009 IOPS with a latency of 133.6µs.
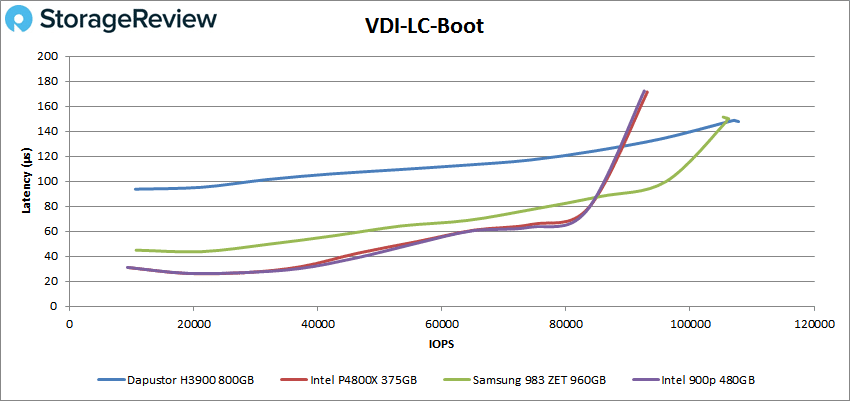
For VDI Linked Clone (LC) Boot, the DapuStor H3900 hit a peak of 107,815 IOPS with a latency of 147.8µs. The drive stayed in first place.
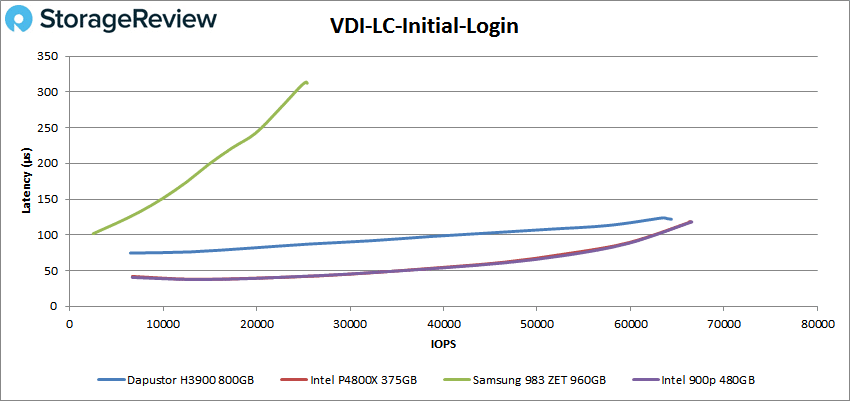
After a long time on top, the H3900 slipped into second behind the Intel 900p in our VDI LC Initial Login with a peak of 64,107 IOPS and a latency of 122µs.
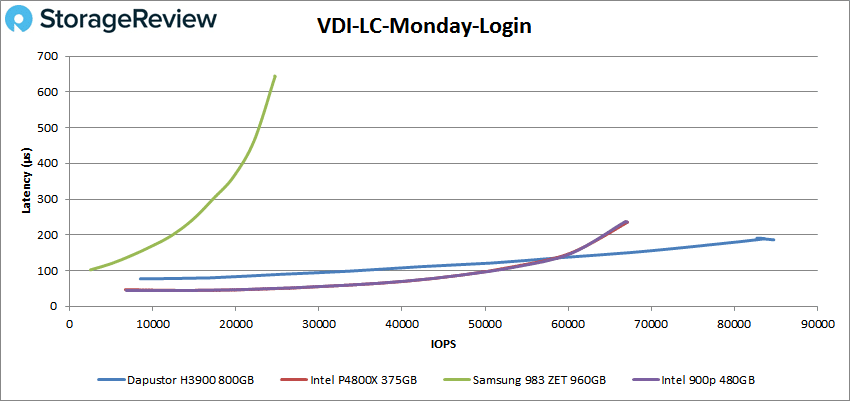
Finally, the H3900 shot way out in front in VDI LC Monday Login with a peak of 84,739 IOPS and a latency of 186.2µs.
Conclusion
The DapuStor H3900 is a storage class memory (SCM) SSD for the enterprise. The drive leverages KIOXIA’s XL-FLASH technology, making it part of DapuStor’s Haishen3-XL line. Being a SCM drive, it is aimed at the same use cases associated with SCM but particularly aimed at data cache and acceleration, in-memory database, AI training, and Big Data. The drive comes in both U.2 and HHHL form factors (we’re looking at the U.2 version). And like other SCM drives the capacity is a bit on the low side but is offered in 400GB, 750GB, 800GB and 1.6TB. For performance, the drive is quoted at hitting up to 3.5GB/3.2GB bandwidth, 830K/300K IOPS at low queue depth workloads with 20μs read latency, with up to 30DWPD.
Looking at performance, we ran both our Application Workload Analysis (Houdini only) and VDBench tests. For Houdini by SideFX the H3900 placed near the top with 2,201.987 seconds. Better than the conventional NAND drives, but at the lower end of the SCM drives.
For VDBench the drive really shined. Highlights include 835K IOPS for 4K read, 339K IOPS for 4K write, 3GB/s for 64K read, and for 64K write, the drive hit 2.3GB/s. With SQL we saw 406K IOPS, 388K IOPS for SQL 90-10, 378K IOPS for SQL 80-20 with peak latency under 100µs in all three tests. For Oracle we saw 355K IOPS, 332K IOPS for Oracle 90-10, 328K IOPS for Oracle 80-20, and again a peak latency under 100µs in all three tests. In our VDI clone tests the H3900 continued to impress and stay at the top or near it. In VDI FC boot the drive had 232K IOPS, in VDI FC initial login the drive had 145K IOPS, in VDI FC Monday login 118K IOPS, in VDI LC boot it hit 108K IOPS, in VDI LC initial login the peak was 64K IOPS, and in VDI LC Monday login the drive hit roughly 85K IOPS.
With Optane being the reigning king for so long in the SCM space it is nice to see a competitor enter the field with an impressive showing. While the DapuStor didn’t take the top spot in Houdini, though close, it did dominate most of our other benchmarks with a tiny amount of latency in several cases. For workloads that need extremely low latency and strong performance, the DapuStor H3900 is the drive you are looking for.


 Amazon