

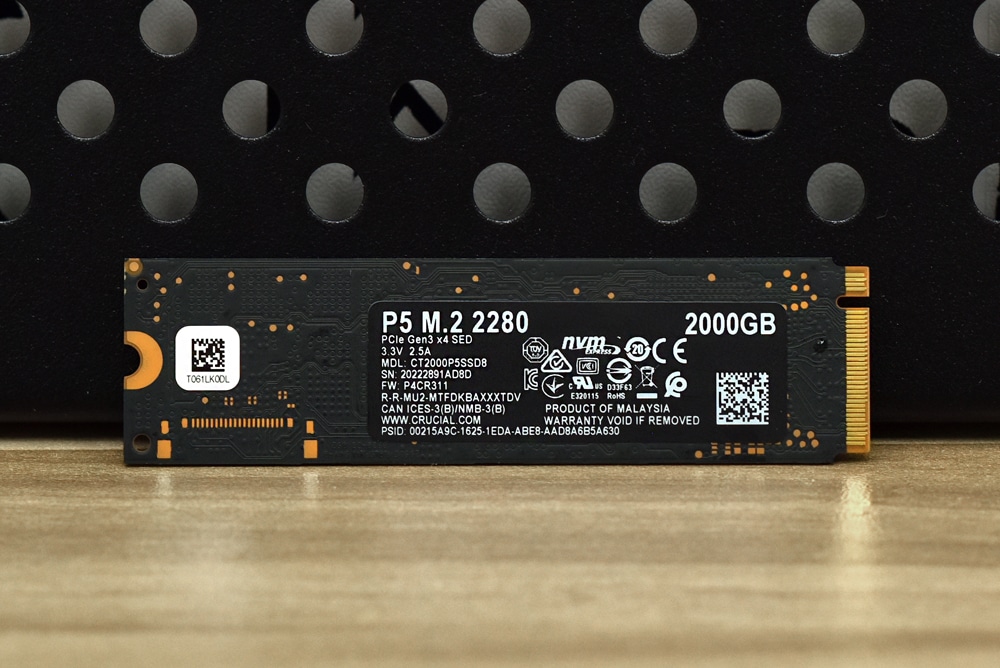
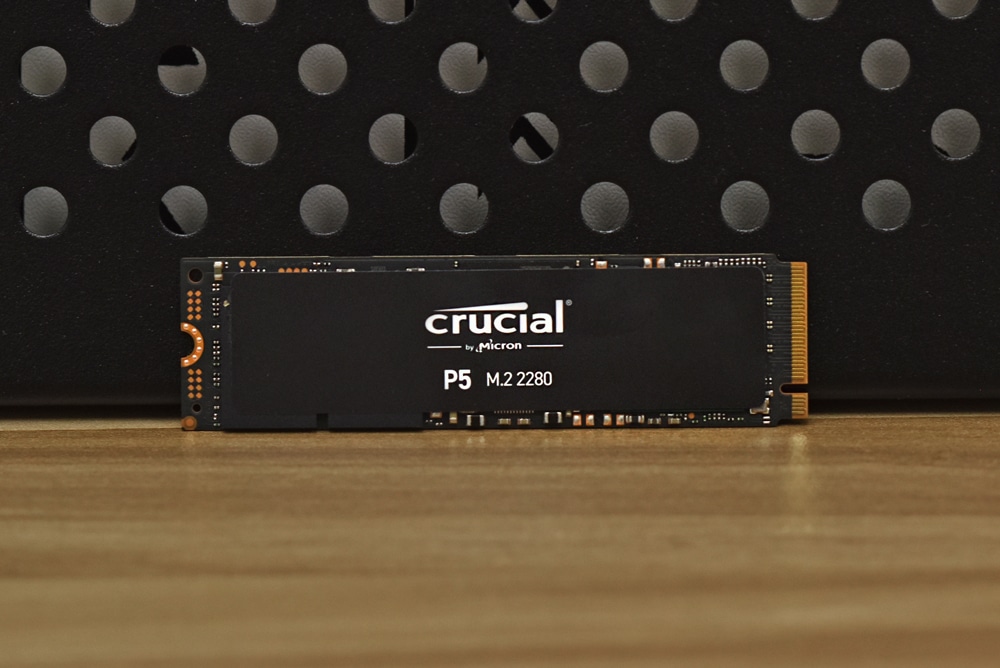
The Crucial P5 is the company’s consumer SSD that leverages the NVMe interface, 3D NAND, and PCIe Gen3. We’ve previously reviewed the P5 in a smaller capacity, the 1TB model. For this review, we will be looking at the 2TB version. Both versions are geared toward enthusiasts and design professionals. The main difference between the two is that the higher capacity version is the higher performant version, so let’s see what the difference is.
For a more in-depth look, feel free to check out our original review here. The main difference is the capacity and the 2TB can be picked up today for about $330.
Crucial P5 2TB SSD Specifications
| Life Expectancy (MTTF) | 1.8 million hours |
| Endurance | 1200TBW |
| Data Transfer Software | Acronis True Image for Crucial cloning software |
| Operating Temperature | 0 °C to 70 °C |
| Compliance | CE, FCC, VCCI, KC, RCM, ICES, Morocco, BSMI, Ukraine, UL, TUV, China RoHS, WEEE, Halogen Free |
| Advanced Features |
|
| Warranty | Limited five-year warranty |
Crucial P5 2TB Performance
Testbed
The test platform leveraged in these tests is a Dell PowerEdge R740xd server. We measure SATA performance through a Dell H730P RAID card inside this server, although we set the card in HBA mode only to disable the impact of RAID card cache. NVMe is tested natively through an M.2 to PCIe adapter card. The methodology used better reflects end-user workflow with the consistency, scalability, and flexibility testing within virtualized server offers. A large focus is put on drive latency across the entire load range of the drive, not just at the smallest QD1 (Queue-Depth 1) levels. We do this because many of the common consumer benchmarks don’t adequately capture end-user workload profiles.
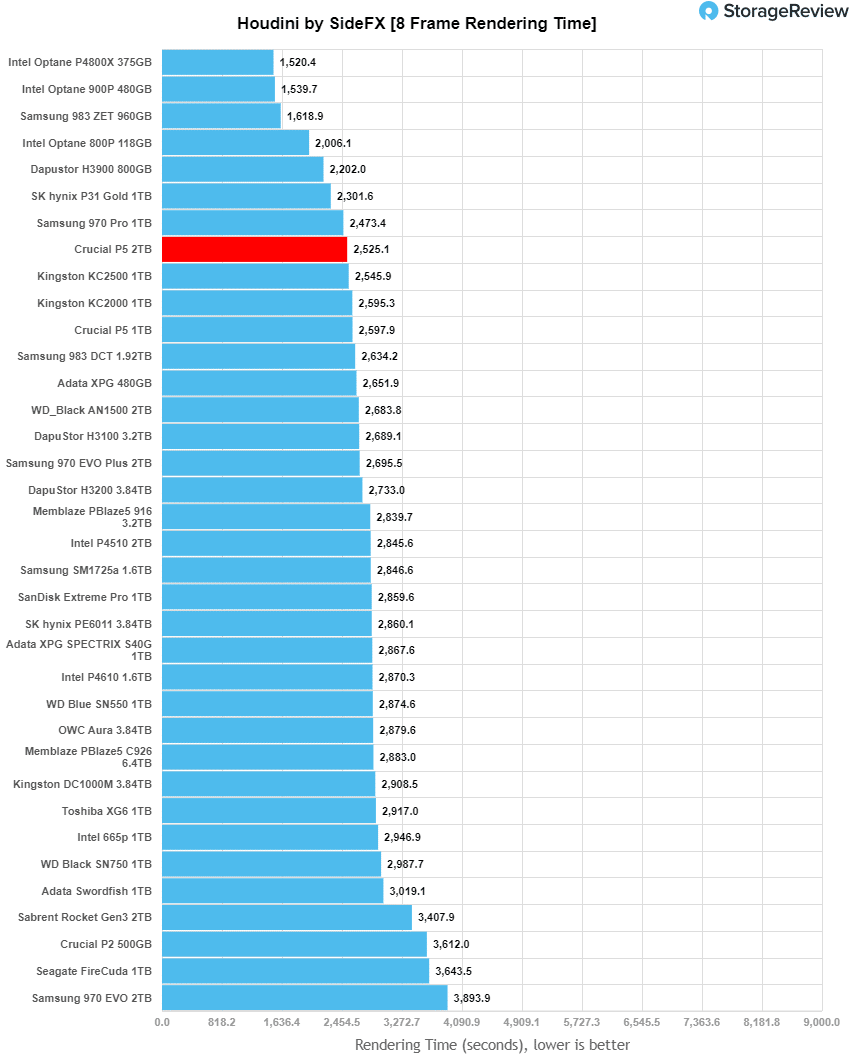
Houdini by SideFX
The Houdini test is specifically designed to evaluate storage performance as it relates to CGI rendering. The testbed for this application is a variant of the core Dell PowerEdge R740xd server type we use in the lab with dual Intel 6130 CPUs and 64GB DRAM. In this case, we installed Ubuntu Desktop (ubuntu-16.04.3-desktop-amd64) running bare metal. Output of the benchmark is measured in seconds to complete, with fewer being better.
The Maelstrom demo represents a section of the rendering pipeline that highlights the performance capabilities of storage by demonstrating its ability to effectively use the swap file as a form of extended memory. The test does not write out the result data or process the points in order to isolate the wall-time effect of the latency impact to the underlying storage component. The test itself is composed of five phases, three of which we run as part of the benchmark, which are as follows:
- Loads packed points from disk. This is the time to read from disk. This is single-threaded, which may limit overall throughput.
- Unpacks the points into a single flat array in order to allow them to be processed. If the points do not have dependency on other points, the working set could be adjusted to stay in-core. This step is multi-threaded.
- (Not Run) Processes the points.
- Repacks them into bucketed blocks suitable for storing back to disk. This step is multi-threaded.
- (Not Run) Writes the bucketed blocks back out to disk.
Here, we see the Crucial P5 2TB SSD with a score of 2525.124 seconds, a bit of an improvement over the 1TB and a fairly good placing for a non-SCM drive.
SQL Server Performance
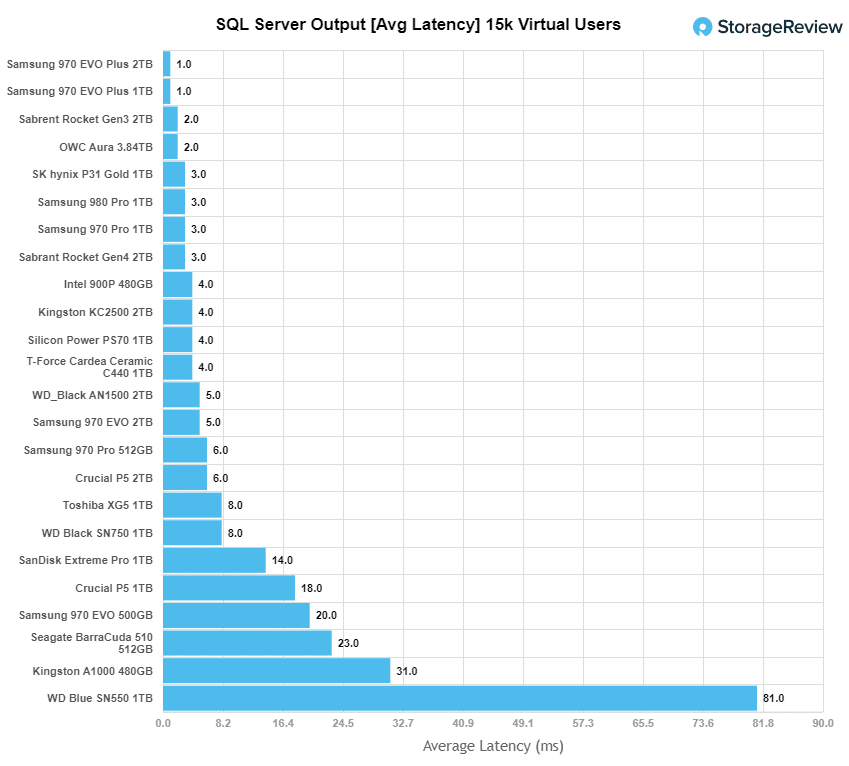
Each SQL Server VM is configured with two vDisks: 100GB volume for boot and a 500GB volume for the database and log files. From a system-resource perspective, we configured each VM with 16 vCPUs, 64GB of DRAM and leveraged the LSI Logic SAS SCSI controller. While our Sysbench workloads tested previously saturated the platform in both storage I/O and capacity, the SQL test is looking for latency performance.
This test uses SQL Server 2014 running on Windows Server 2012 R2 guest VMs, and is stressed by Quest’s Benchmark Factory for Databases. StorageReview’s Microsoft SQL Server OLTP testing protocol employs the current draft of the Transaction Processing Performance Council’s Benchmark C (TPC-C), an online transaction-processing benchmark that simulates the activities found in complex application environments. The TPC-C benchmark comes closer than synthetic performance benchmarks to gauging the performance strengths and bottlenecks of storage infrastructure in database environments. Each instance of our SQL Server VM for this review uses a 333GB (1,500 scale) SQL Server database and measures the transactional performance and latency under a load of 15,000 virtual users.
SQL Server Testing Configuration (per VM)
- Windows Server 2012 R2
- Storage Footprint: 600GB allocated, 500GB used
- SQL Server 2014
- Database Size: 1,500 scale
- Virtual Client Load: 15,000
- RAM Buffer: 48GB
- Test Length: 3 hours
- 2.5 hours preconditioning
- 30 minutes sample period
For our SQL Server latency, we saw 6ms. A third the latency of the 1TB but still in the lower end of the middle of the pack.
VDBench Workload Analysis
When it comes to benchmarking storage devices, application testing is best, and synthetic testing comes in second place. While not a perfect representation of actual workloads, synthetic tests do help to baseline storage devices with a repeatability factor that makes it easy to do apples-to-apples comparison between competing solutions. These workloads offer a range of different testing profiles ranging from “four corners” tests, common database transfer size tests, to trace captures from different VDI environments. All of these tests leverage the common vdBench workload generator, with a scripting engine to automate and capture results over a large compute testing cluster. This allows us to repeat the same workloads across a wide range of storage devices, including flash arrays and individual storage devices. Our testing process for these benchmarks fills the entire drive surface with data, then partitions a drive section equal to 5% of the drive capacity to simulate how the drive might respond to application workloads. This is different than full entropy tests which use 100% of the drive and take them into steady state. As a result, these figures will reflect higher-sustained write speeds.
Profiles:
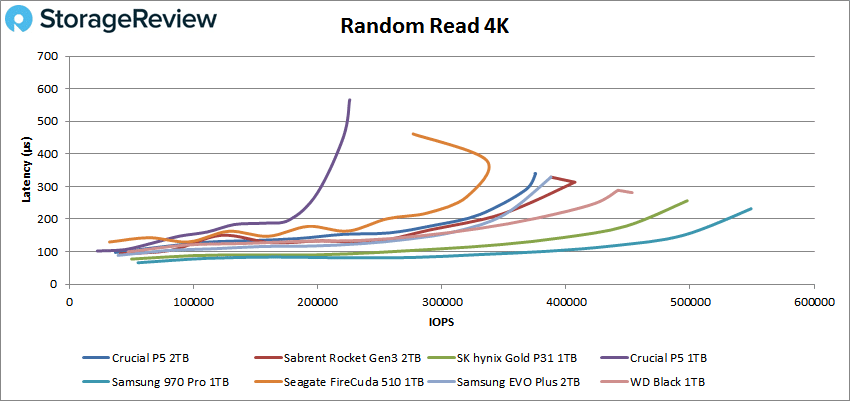
- 4K Random Read: 100% Read, 128 threads, 0-120% iorate
- 4K Random Write: 100% Write, 64 threads, 0-120% iorate
- 64K Sequential Read: 100% Read, 16 threads, 0-120% iorate
- 64K Sequential Write: 100% Write, 8 threads, 0-120% iorate
Comparables for this review:
For 4K performance, the Crucial landed about in the middle of the pack with a peak of 375,545 IOPS and a latency of 340.2µs. This is a big step up from the 1TB version’s 225,819 IOPS and 565.9µs.
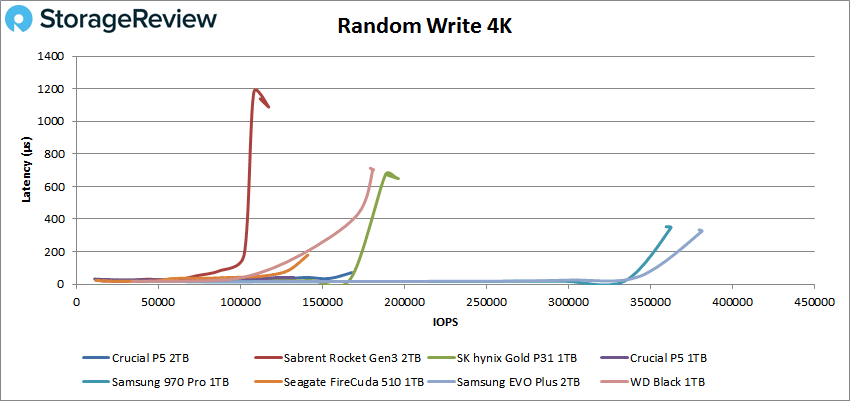
4K write again takes the Crucial P5 2TB into the middle with a peak of 167,959 IOPS and a latency of only 71.9µs. A bit better than the 1TB’s 132,793 IOPS and 41.1µs.
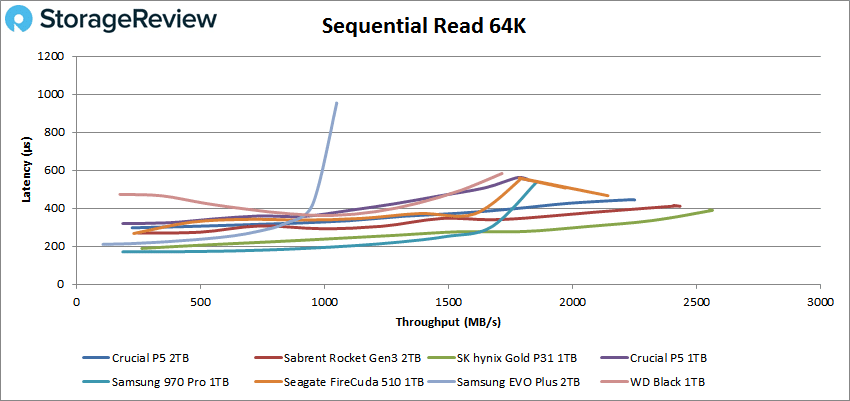
Next up are sequential work with our 64K benchmarks. With read the Crucial P5 2TB came in third place with a peak of 35,989 IOPS or 2.24GB/s with a latency of 444µs. Again, this is a nice improvement over the 1TB scores of 29,173 IOPS (or 1.82GB/s) with 548.3µs.
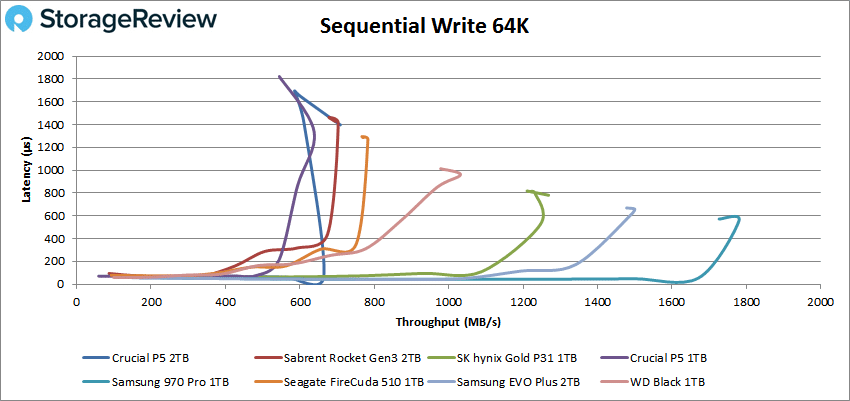
64K write saw the higher capacity Crucial drive drop off to the bottom with the 1TB version. The Drive saw a peak of 11,345 IOPS or 709MB/s at a latency of 1.4ms. While far from stellar, it was still an improvement over the 1TB’s 10k IOPS (or 638.3MB/s) with a latency of 1.3ms.
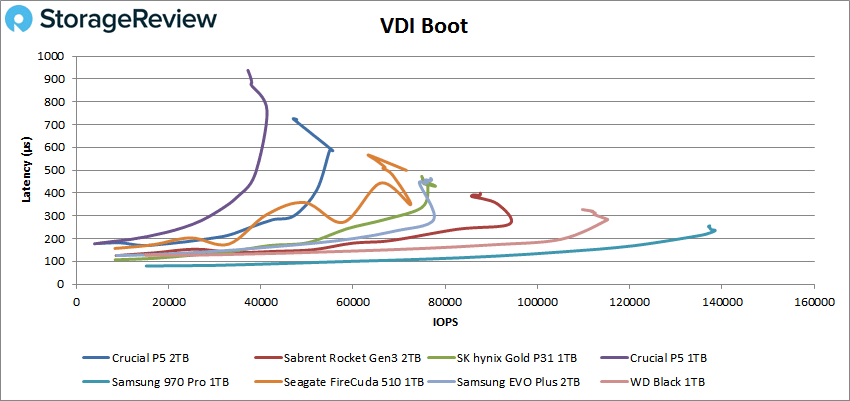
Next, we looked at our VDI benchmarks, which are designed to tax the drives even further. Here, the new Crucial drive struggled to keep up with the other tested drives. In Boot, the P5 2TB was down near the bottom with a peak of 55,562 IOPS at a latency of 587µs before falling off some. While near the bottom it was still better than the 1TB.
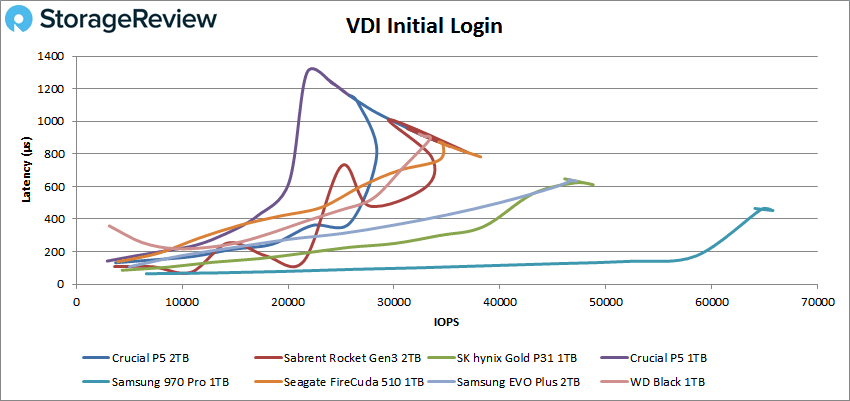
Looking at our VDI Initial Login, the Crucial P5 2TB was again next to last with a peak of 34,048 IOPS with a latency of 878µs. A bit of an improvement over the 1TB’s 25,677 IOPS with a latency of 1.2ms.
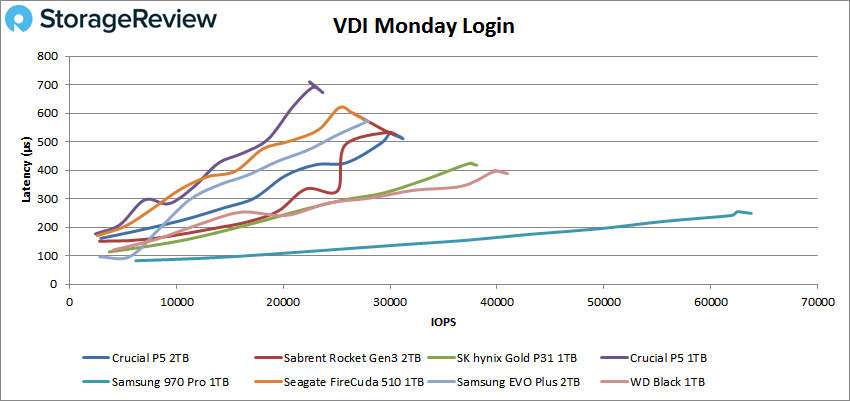
Finally, in our last test, VDI Monday Login showed the Crucial P5 2TB landed in the middle of the pack with a peak of 31,197 IOPS with a latency of 511µs. A good improvement over the smaller capacity’s 23,701 IOPS with 677.2µs latency.
Conclusion
The Crucial P5 is the higher performance PCI3 Gen3 NVMe SSD. The drive comes in an M.2 form factor and ranges in capacity from 250GB up to the one we tested here, the 2TB. While a higher-end drive for the company, it still comes in at a good price point.
Looking at performance, the drive did okay overall but showed a big performance advantage over the smaller 1TB version we tested earlier this year. For this review, we ran SQL Server, Houdini, and our VDBench workloads. For Houdini, the Crucial P5 2TB SSD had a score of 2525.124 seconds about 70 seconds better than the 1TB. SQL Server latency gave us 6ms, while much better than the 1TB was still middle-ish for the pack. For VDBench we saw highlights of 376K IOPS in 4K read, 168K IOPS in 4K write, 2.24GB/s in 64K read, and 709MB/s in 64K write. This represents a performance improvement over the 1TB of roughly 66%, 26%, 23%, and 11% respectively. In our VDI benchmarks the Crucial P5 2TB dropped down in the placing next to last, with the 1TB version being lower. Still, the P5 hit 56K IOPS in boot, 34K IOPS in Initial Login, and 31K IOPS in Monday Login.
For those that want to enjoy the nice price tag of the Crucial P5 series but need a little more performance, the 2TB version is a better option than the 1TB. However, if peak performance or the lowest cost is top of your list, there are several other options out there.


 Amazon