

About two years ago, we did a head-to-head showdown between two popular enterprise-grade SSDs: the Intel P5510 vs. the Samsung PM9A3—both of which have a solid following in the data center. Since then, Intel has spun its SSD business to a new company called Solidigm, a company backed by SK hynix. And now we’re taking a look at the Solidigm P5520 in a renewal of our head-to-head mainstream enterprise SSD showdown.
Historically, we’ve found that the spec sheets for a single enterprise SSD aren’t very helpful, as they focus on single-drive performance for a very small and specific workload. Because of this, we decided to concentrate on the showdown on the performance of systems with multiple drives rather than of a single drive’s bandwidth.
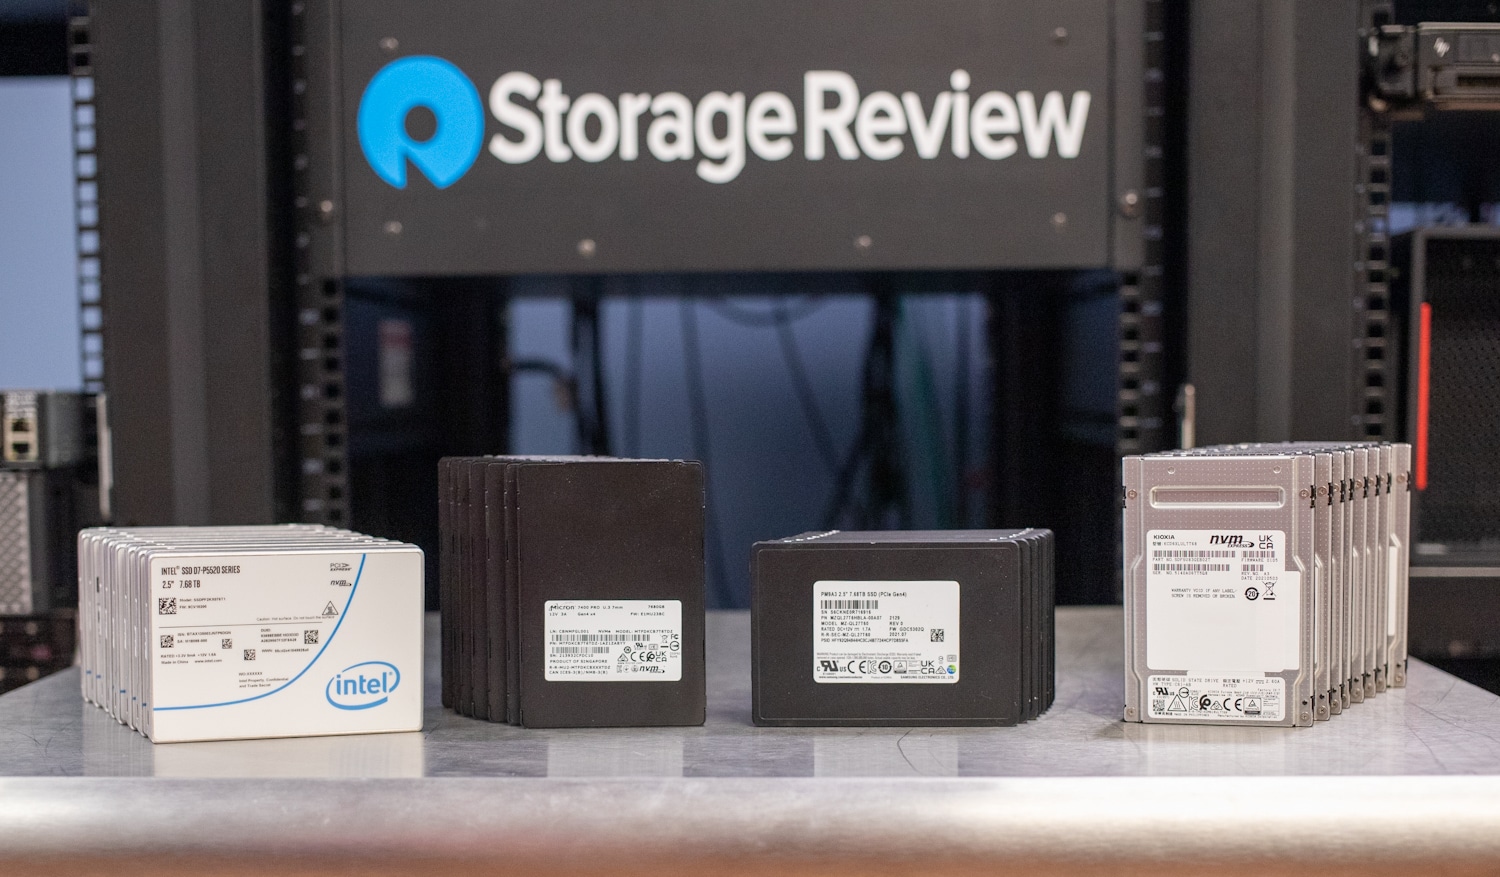
Ultimately, the P5510 edged out the Samsung PM9A3 in our real-world testing scenarios. With this in mind, we wanted to offer these two drives a rematch testing, but this time with the successor of the P5510: the Solidigm P5520. This time around we also included the Micron 7400 Pro and Kioxia CD6 for a more comprehensive data set.
We’ve reviewed all of these drives individually already, so in this report, we will not go in-depth on the single-drive performance. Instead, we will focus on the enterprise deployments of this device where multiple drives are being used in conjunction with each other. Our testing includes mixed workloads, noisy neighbor situations, and high-write workloads.
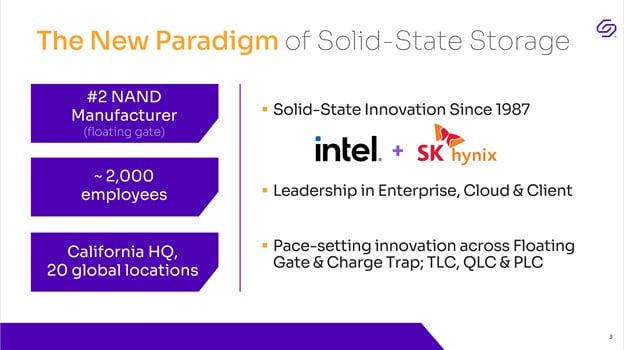
As noted up top, in 2020, the well-respected Korean manufacturer of semiconductor memory and devices, SK hynix, announced that they would be purchasing Intel’s NAND business for $9 billion. From this acquisition, SK hynix created Solidigm, a new US-based company wholly owned by SK hynix. We see this as a win for both companies as it allows each to focus on their core business with the added benefit to SK hynix of adding a highly-regarded existing product line with a loyal following to its portfolio.
Solidigm P5520 vs. P5510
When the P5520 is compared to the P5510, the spec sheet only shows a modest increase in the sequential performance of the P5520. However, we found that the spec sheet only shows part of the story, which is why we are running these tests.
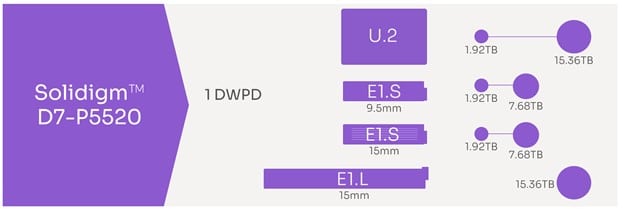
Yet performance numbers are only part of the story; today’s hyperscalers and data centers are demanding density and power efficiency. Solidigm delivers on both in spades with a 44% reduction in overall power compared to its previous-generation P5510 devices. This is thanks to the upswing in maximum capacity from 7.68TB in the P5510 to 15.36TB in the P5520 in the same 2.5″ 15mm drive size. Across a fully populated server, these gains add up very quickly.
The P5520 has implemented many features requested by its customers, including multiple sector sizes, OPAL 2.0, configurable namespace locking, secure erase, improved telemetry logs, dynamic multiple namespaces, and device self-testing.
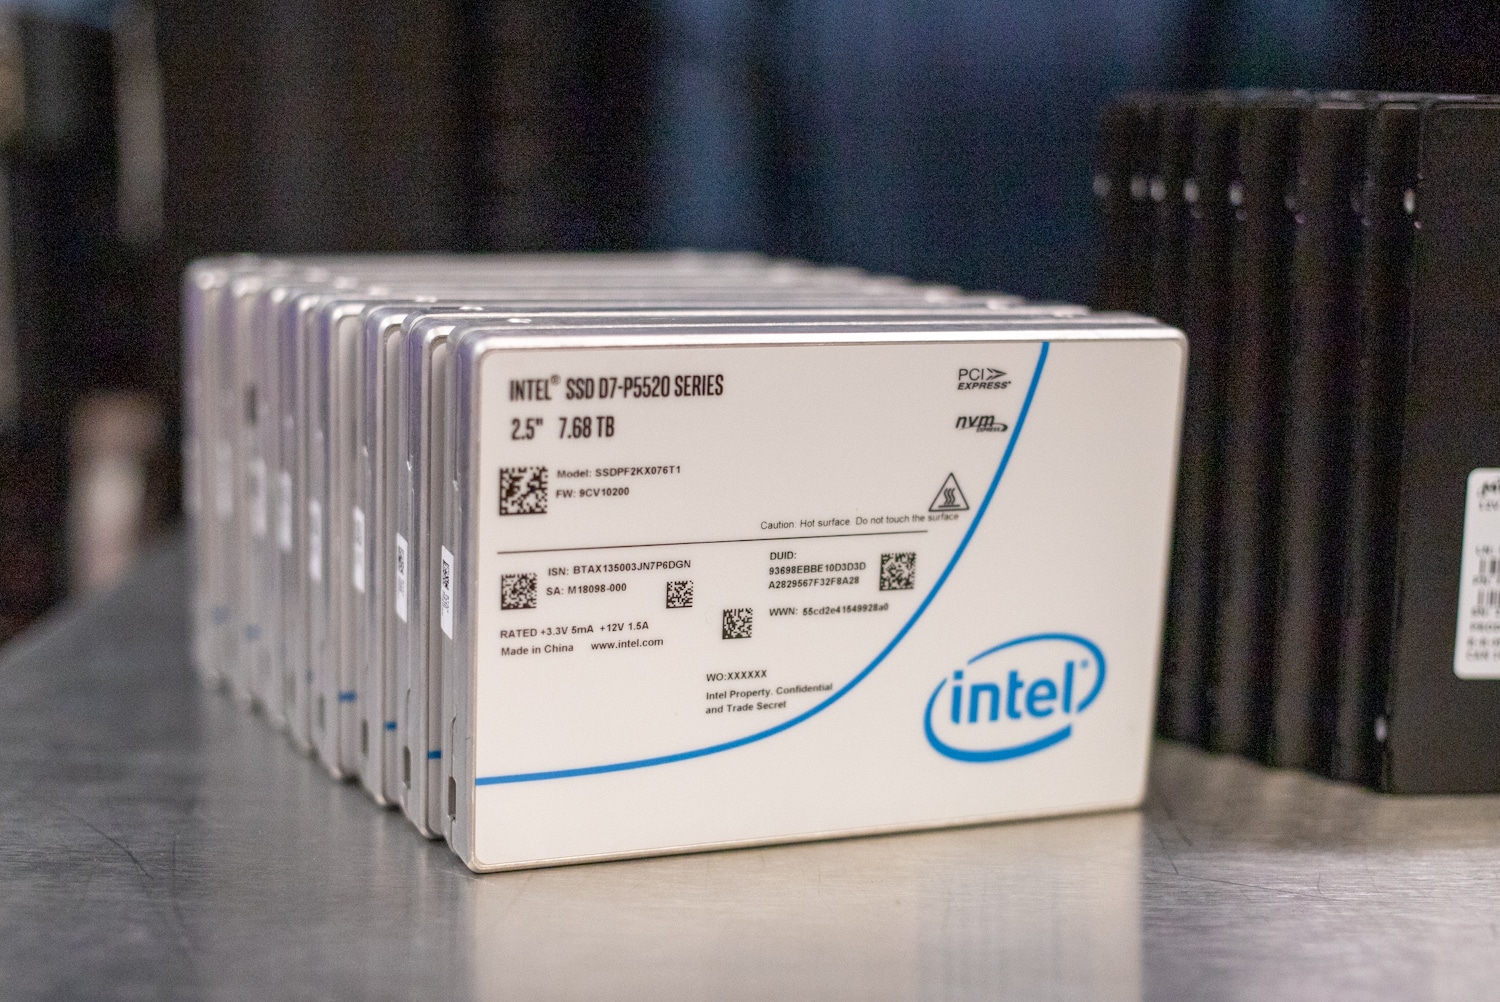
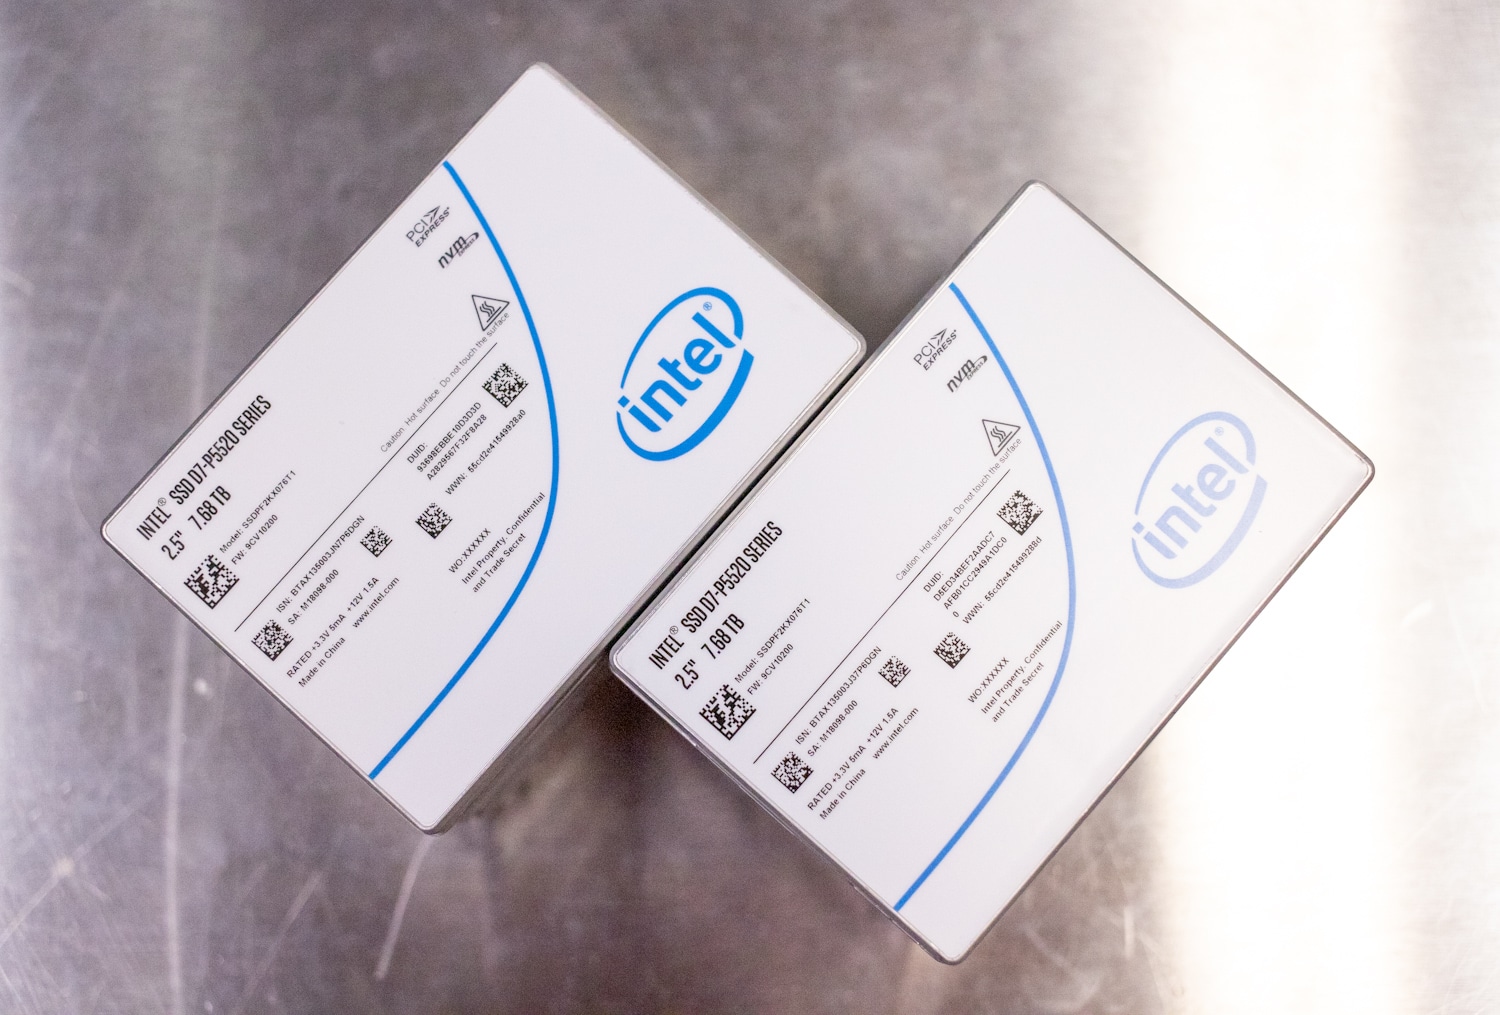
For our testing, we used the U.2 form factor 7.68TB drive, which is a popular capacity point for enterprise use. The P5520 is available with capacities ranging from 1.92TB to 15.36TB. Interestingly, the P5520 is available in a ruler (E1.S and E1.L) format, popular with hyperscalers and some servers. We are a little surprised that it does not come in E3.S, a new format that we’re expecting server OEMs to leverage in their next-generation refreshes. That said, the P5520 has been in development for a long time and it’s likely Solidigm will include an E3.S variation in the P5540, or whatever is next for this category of SSD.
Solidigm P5520 Performance
For this comparison, we selected an Intel OEM server, which supports eight NVMe SSDs in this configuration. All batches of SSDs were tested identically on the same server.
Drives under test, all 7.68TB capacity:
High-level specifications include:
- 2 x Intel Scalable Gen3 8380
- 32 x 32GB DDR4 3200MHz
- Ubuntu 20.04.2 Live Server (Synthetic workloads)
- VMware ESXi 7.0u2 (Application workloads)
- 8 x PCI Gen4 U.2 NVMe Bays
Benchmarks were performed using VDbench and FIO for synthetic benchmarks and Percona Sysbench and Benchmark Factory for SQL Server.
VDbench: Each group of 8 NVMe SSDs is secure-erased, then the entire disk surface is written to with a 64K write operation, followed by a one-hour 64K sequential preconditioning workload. Once finished, each drive is given a partition of 25% of the disk surface (2TB partition for an 8TB SSD).
We then focused on a group of common workload profiles consisting of common mixed workloads. We also used our I/O patterns to replicate SQL, Oracle, and VDI workloads. Before the random I/O patterns started, we performed an additional one hour of 4K random write activity.
Workload Profiles
- Synthetic Database: SQL and Oracle
- VDI Full Clone and Linked Clone Traces
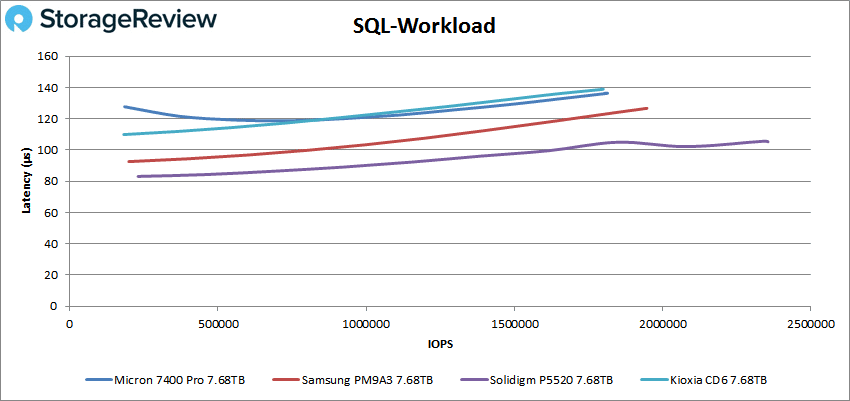
In our SQL Workload, the Solidigm P5520 came out with a strong lead at the lowest latency and finished with the highest performance and lowest latency. We measured a peak of 2.36M IOPS at 105 microseconds from the P5520, with the next closest competitor (PM9A3) measuring 1.95M IOPS at 127 microseconds.
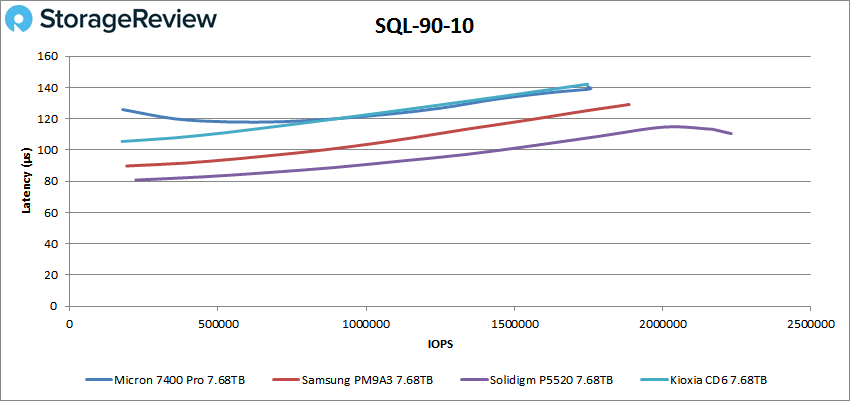
With an increased write percentage in our SQL 90-10 workload, the P5520 again offered a strong lead in front of the competing SSDs. Here we measured a peak of 2.23M IOPS at 111 microseconds, with the PM9A3 coming in behind it with 1.89M IOPS at 129 microseconds.
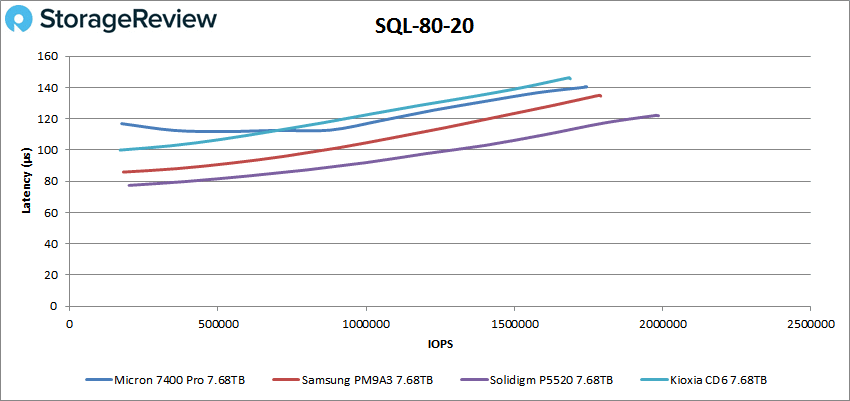
After increasing the write percentage from 10% to 20% in our SQL 80-20 workload, we saw the SSDs get slightly closer in their grouping. Here the P5520 topped out at 1.99M IOPS at 122 microseconds, with the PM9A3 trailing with 1.79M IOPS at 135 microseconds.
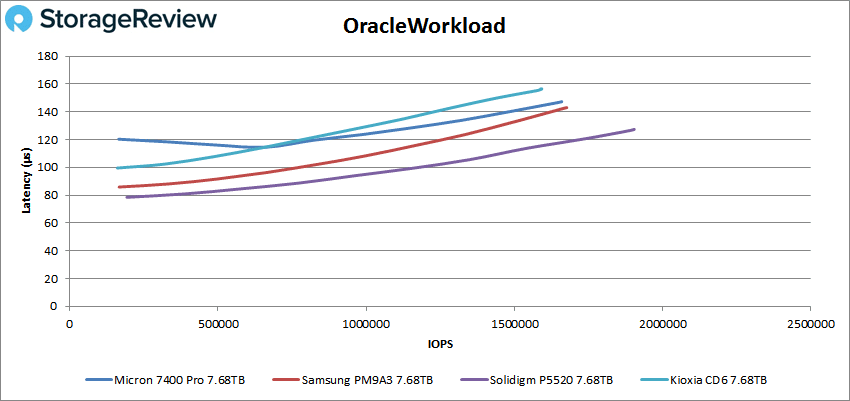
Switching to our Oracle Workload, the Solidigm P5520 maintains a strong lead over the rest of the pack, topping out at 1.9M IOPS at 127 microseconds. Across the board, this compared to 1.68M IOPS at 143 microseconds from the PM9A3, 1.66M IOPS at 147 microseconds from the 7400 Pro, or 1.59M IOPs from the CD6 at 157 microseconds.
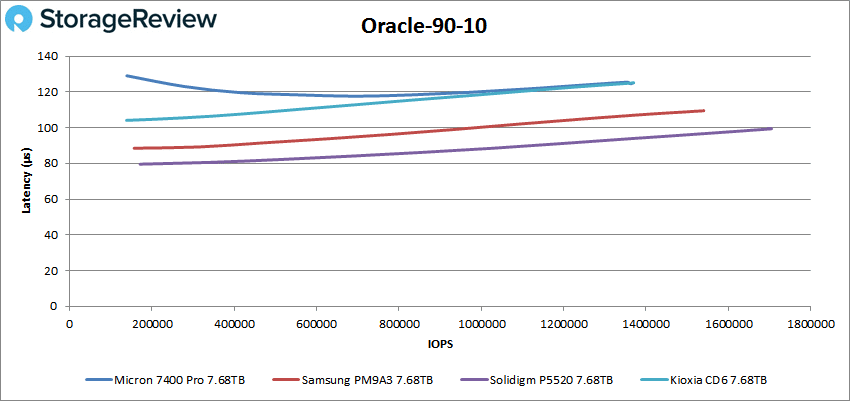
In our Oracle 90-10 workload, the P5520 topped out at 1.7M IOPS at 99 microseconds, with the PM9A3 as the next closest SSD, measuring 1.54M IOPS at 110 microseconds.
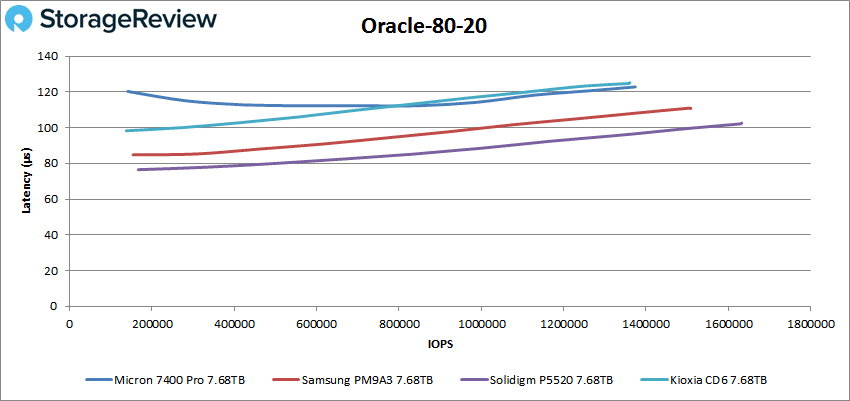
In our final Oracle workload with an 80-20 R/W mix, the Solidigm P5520 still maintained the lead with 1.63M IOPS at 103 microseconds. The Samsung PM9A3 still trailed 2nd with a speed of 1.5M IOPS at 111 microseconds.
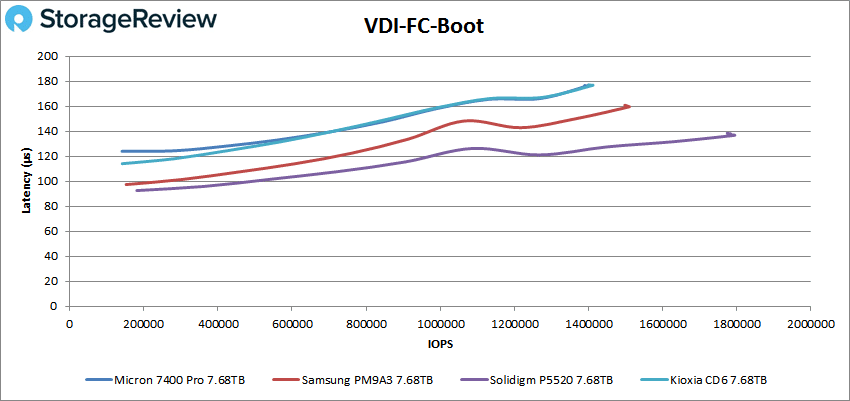
Moving from synthetic database to VDI, we start with our Full Clone Boot workload. Here the Solidigm P5520 started with a slight edge which turned into a significant lead as the workload peaked. The P5520 measured 1.79M IOPS at 137 microseconds at its peak, with the PM9A3 behind it with 1.51M IOPS at 160 microseconds.
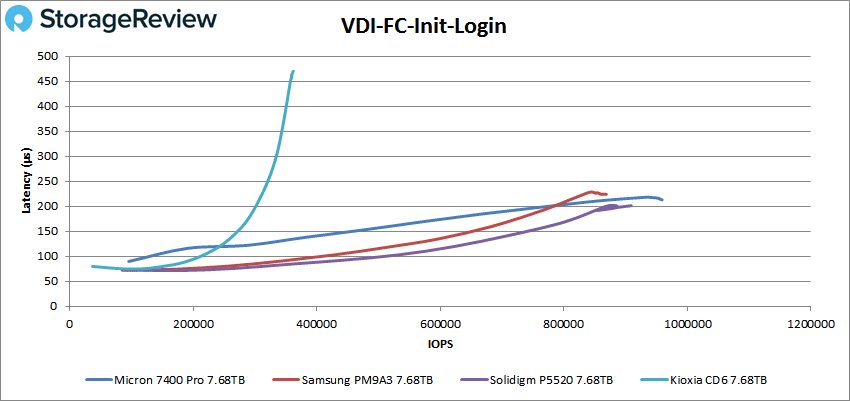
In our VDI Full Clone Initial Login workload, the P5520 offered a latency advantage, although the peak throughput came from the Micron 7400 Pro. Here the P5520 topped out with 909k IOPS at 201 microseconds, with the 7400 Pro ahead of it with 959k IOPS at 213 microseconds.
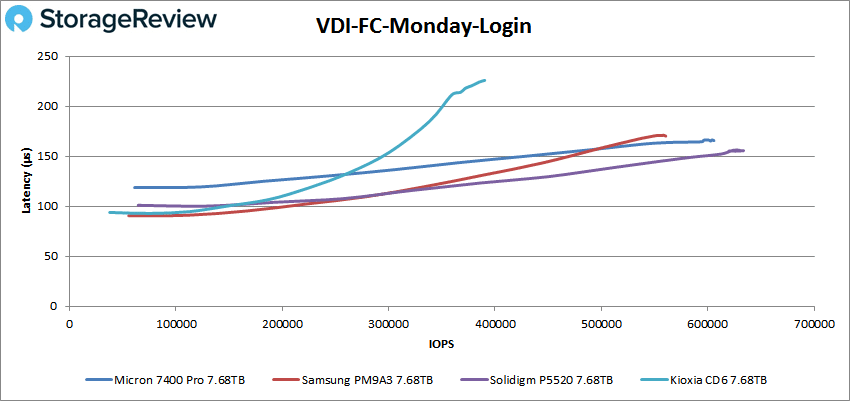
In VDI Full Clone Monday Login, the Solidigm P5520 started with a slightly elevated response time. However, as the workload increased, it offered a higher performance profile than others in the group. Here the P5520 measured 634k IOPS at 156 microseconds, with the 7400 Pro behind it with 606k IOPS at 166 microseconds.
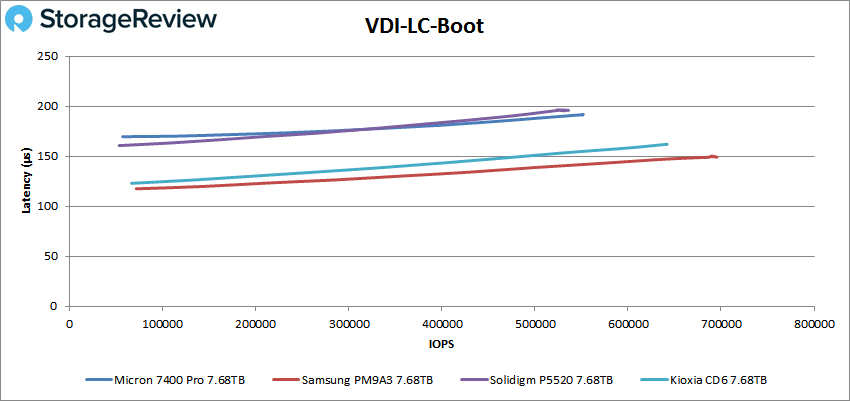
Our last group of synthetic workload profiles focuses on a VDI Linked Clone performance, starting with Boot. In this test, we saw the Samsung PM9A3 in the top spot, measuring 696k IOPS at 149 microseconds, whereas the P5520 measured 534k IOPS at 196 microseconds.
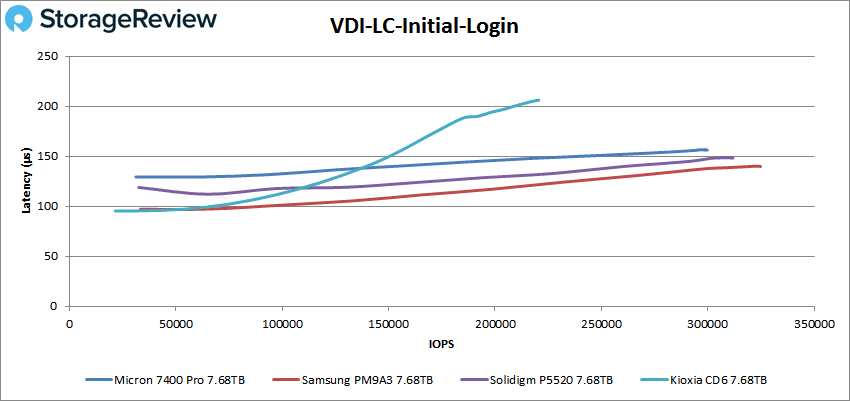
In the VDI Linked Clone Initial Login profile, the Solidigm P5520 came in just behind the PM9A3. The P5520 measured 312k IOPS at 148 microseconds, whereas the PM9A3 measured 325k IOPS at 140 microseconds.
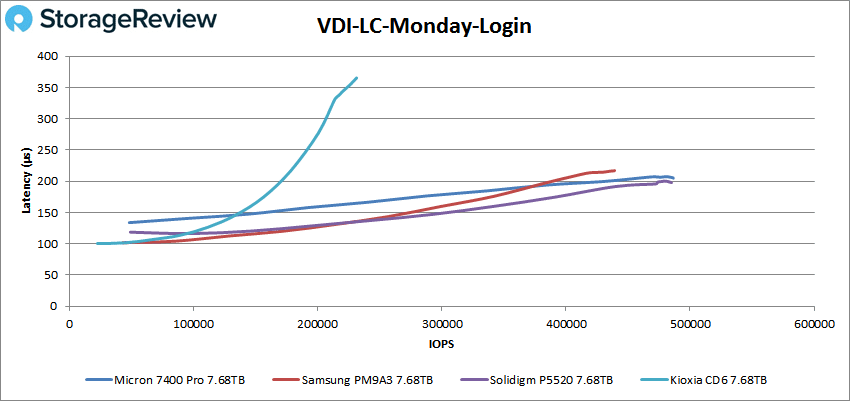
Finally, in our VDI Linked Clone Monday Login workload, we saw the Solidigm P5520 come through with a narrow lead on latency compared to the Micron 7400 Pro. Here the P5520 measured 485k IOPs at 198 microseconds, compared to 487k IOPS at 205 microseconds from the 7400 Pro.
FIO Write Pressure Test
Storage workloads are getting more complex as SSDs keep up with concurrent read/write requests at a peak usage level. The ability to service an IO under concurrent write pressure becomes more interesting than doing reads where no writes exist. Vendors can keep background activity low enough to show a “benchmark” like read response under unloaded conditions. But that’s not how real-world IO works.
This workload demonstrates how the SSD can pause or stage writes and prioritize read at its core firmware and NAND component level. Read Priority can drive the SLA requirement for specific application offerings. So, the motivation of a write pressure test is driven by the need to test out both concurrent IO and the resiliency and QoS of an SSD product.
In our write pressure test, we ran the workload across eight drives in the Solidigm P5520, Samsung PM9A3, Kioxia CD6, and Micron 7400 Pro test groups. When testing flash devices, we’ve seen many cases where individual drive tests don’t always reflect how that drive may respond in a more active system. To show how the performance was reflected, we pulled results from a single drive in each group, which in this case corresponds to drive one in each group. The tests were split into an 8K block size and a 16K block size workload. In each test, we focus on clat (completion latency), 99th percentile latency, and 99.99th percentile latency.
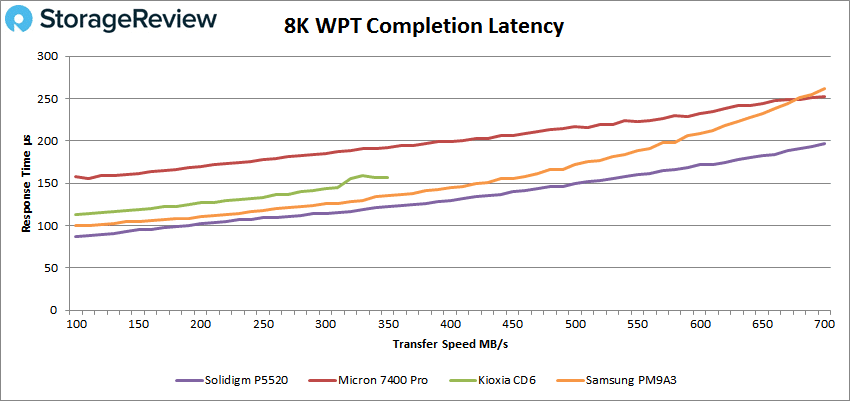
Starting with the 8K blocksize, we looked at the completion latency for each of the four SSD groups, and we saw a dramatic difference forming at the start. Looking at the range of 100MB/s to 700MB/s, the Kioxia CD6 stood out with a line that drops off at 350MB/s. This is because beyond that point, as the test was calling for higher bandwidth, it capped out at 350MB/s while the other drives kept climbing. If we look at the 350MB/s rate, the 5520 measured 122 microseconds, the PM9A3 measured 135, the CD6 came in at 157, and the 7400 Pro measured 192.
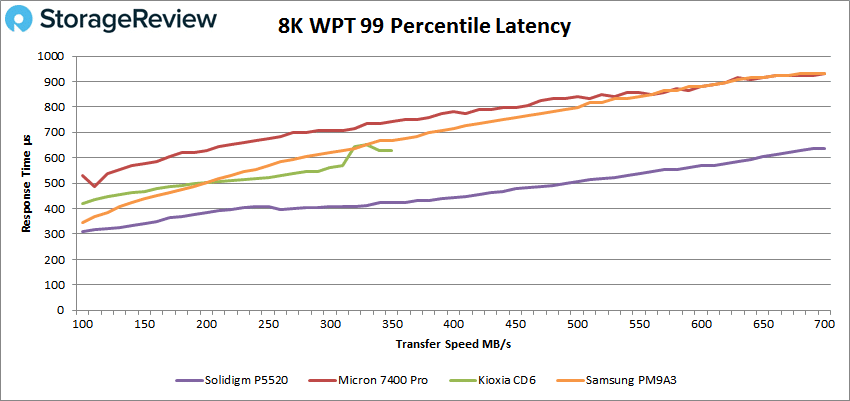
In the 99th percentile group, the Solidigm P5520 continued with a strong lead over the pack. At the 350MB/s mark, we measured 424 microseconds from the P5520, 627 from the CD6, 668 from the PM9A3, and 742 from the 7400 Pro.
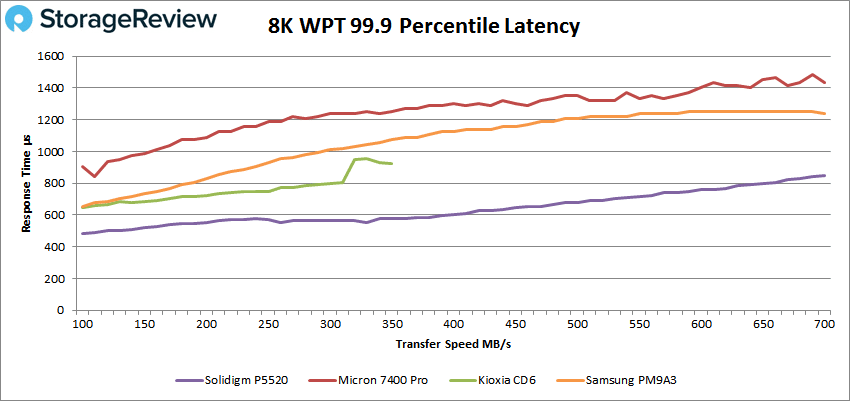
At the 99.9th percentile, we saw a more significant separation between the enterprise SSDs in this group. The P5520 started substantially lower than others in the group and maintained that lead across the test segment. If we look at the 350MB/s point, we measured 578 microseconds from the P5520, 922 from the CD6, 1,074 from the PM9A3, and 1,254 from the 7400 Pro.
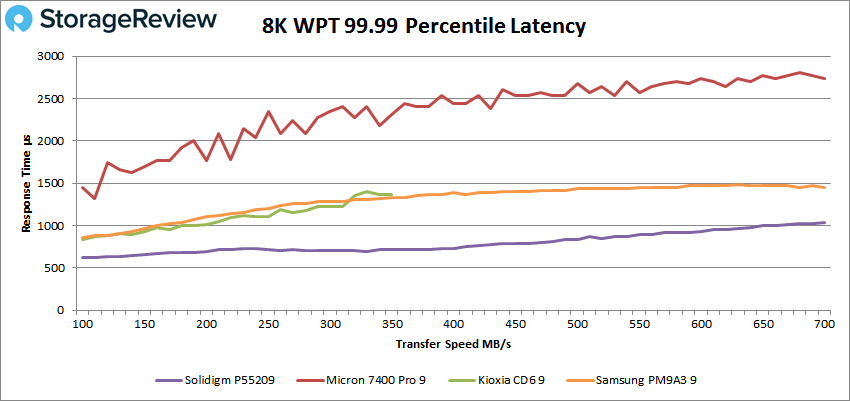
Moving to the 99.99th percentile latency, keeping the 350MB/s mark as the one to compare each drive, the Solidigm P5520 continued to lead the pack. It offered a low latency of 717 microseconds up against the PM9A3 with 1,336 and the CD6 with 1,369. The 7400 Pro trailed significantly with 2,311.
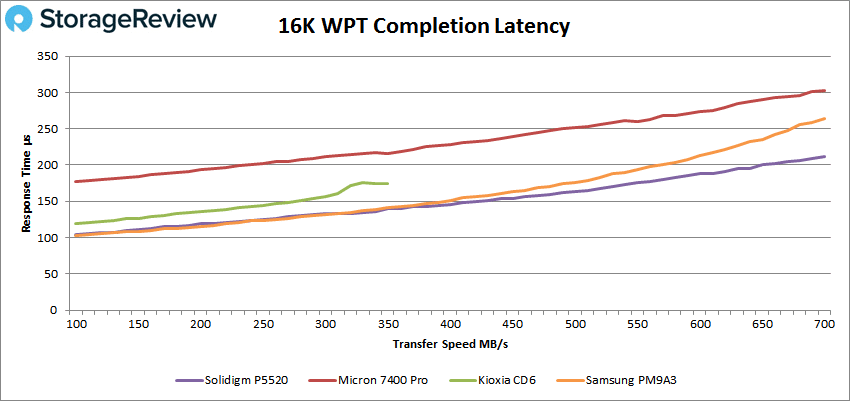
Increasing the block size to 16K in our write pressure test, we again saw a significant difference between the four SSDs in this category regarding response times. As the test started, looking at completion latency, the Solidigm P5520 and Samsung PM9A3 were very close, with diverging paths as the write workload increased. We again see the Kioxia CD6 top out by the 350MB/s, which we will use as our comparison point across the drive group. Here the P5520 measured 139.7 microseconds versus 141 from the PM9A3. The CD6 measured 174 at this stage, and the 7400 Pro above it measured 216.5.
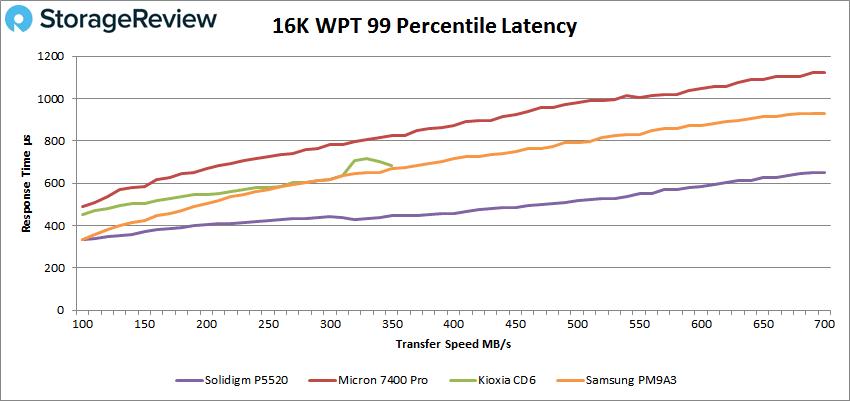
In the 99th percentile measurement, the difference between each SSD becomes more apparent as the bandwidth increases. At the 350MB/s mark, the P5520 measured 445 microseconds, the PM9A3 measured 668, CD6 with 685, and the 7400 Pro at 824.
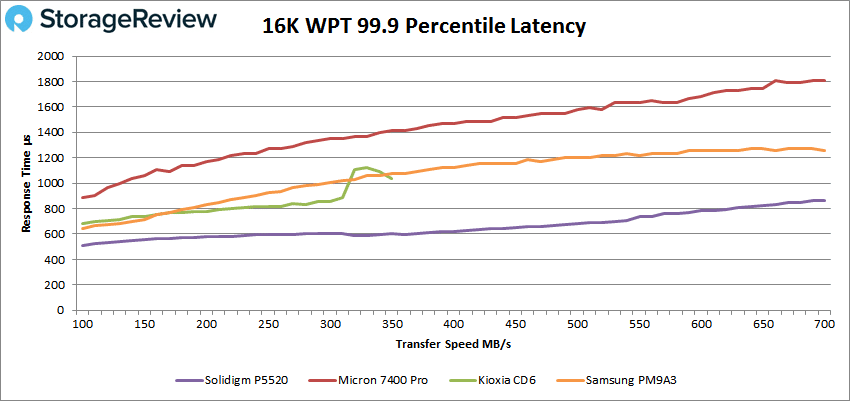
Moving to 99.9 percentile latency, the P5520 maintained its lead while we saw some interesting behavior from the CD6. Initially coming in under the PM9A3 by 300MB/s, the CD6 spiked in latency before reaching saturation. Following the same 350MB/s sample point, we measured the P5520 with 603 microseconds, the CD6 at 1,037, the PM9A3 with 1,074, and the 7400 Pro at 1,418.
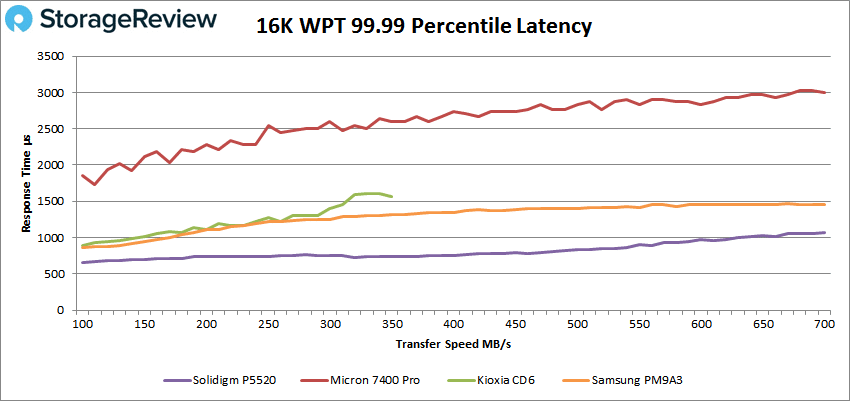
Finally, as we move to the 99.99 percentile portion of the 16K block-size write pressure test, we saw the Solidigm P5520 with the lowest latency and the Micron 7400 Pro at nearly triple the response time. Focusing on the 350MB/s index point, the P5520 measured 734 microseconds, the PM9A3 with 1,319, the CD6 behind it with 1,565, and the 7400 Pro topping out with 2,606.
FIO Noisy Neighbor Test
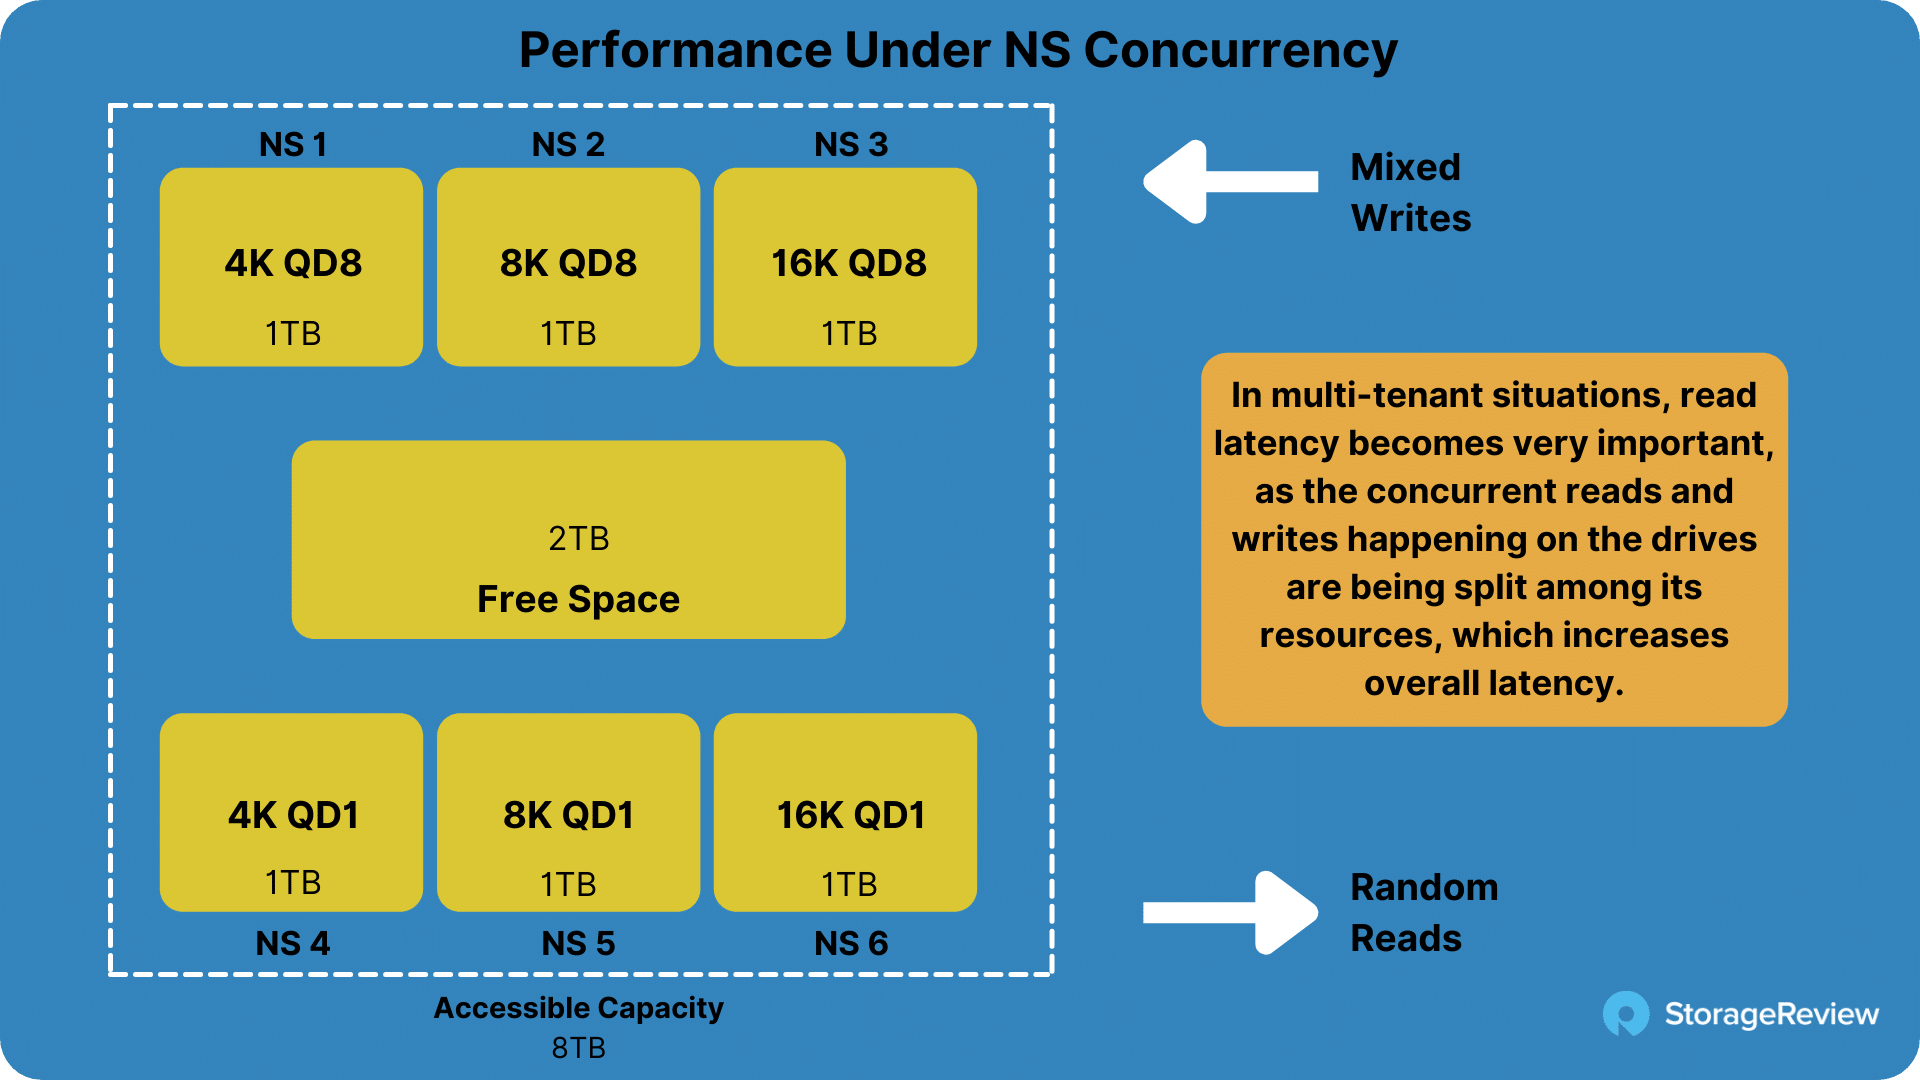
Traditionally, to see how SSDs operate under varying simultaneous workloads, you apply read and write workloads to the device simultaneously. These workloads can also include varying block sizes and other elements. NVMe SSDs brought a new concept into the mix where they can offer multi-tenant namespace provisioning versus common partitioning.
When multiple tenants are all using their provisioned namespaces with different workloads, latency mustn’t increase to the point that the storage is no longer responsive for each tenant. In the noisy neighbor test, we apply mixed write workloads to three of six provisioned namespaces and track the read latency from the remaining three namespaces to see how each drive handles the concurrent write and read activity.
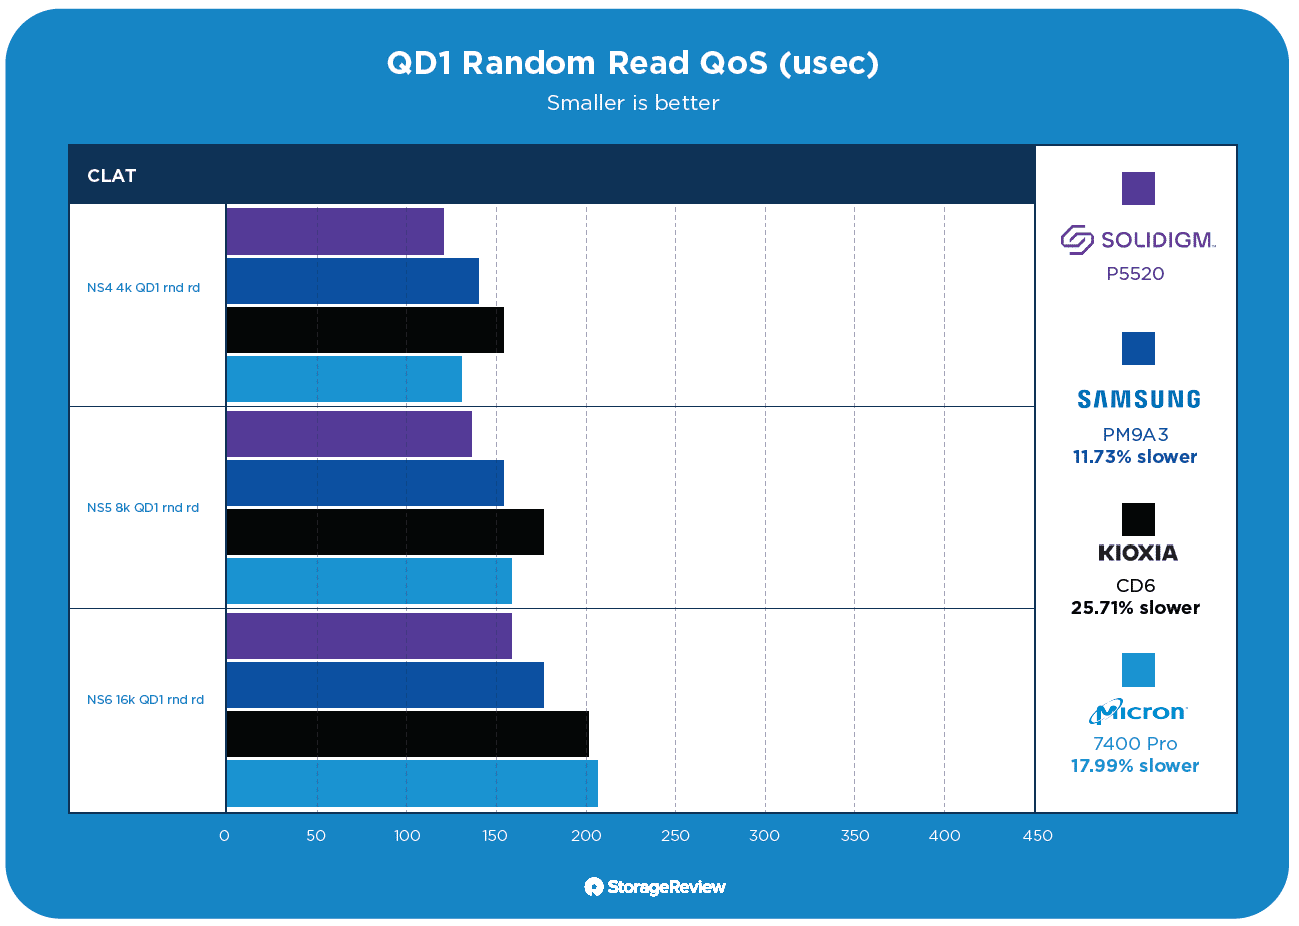
With more devices on the field, the Solidigm P5520 held the lead for completion latency and 99.99 percentile and 99.9999 percentile latencies. Starting with completion latency (clat), the average of the P5520 times across namespace 4-6 measured 141 microseconds, with the next closest being the Samsung PM9A3 with 157, followed by the Micron 7400 Pro with 166, and lastly, the Kioxia CD6 with 177.
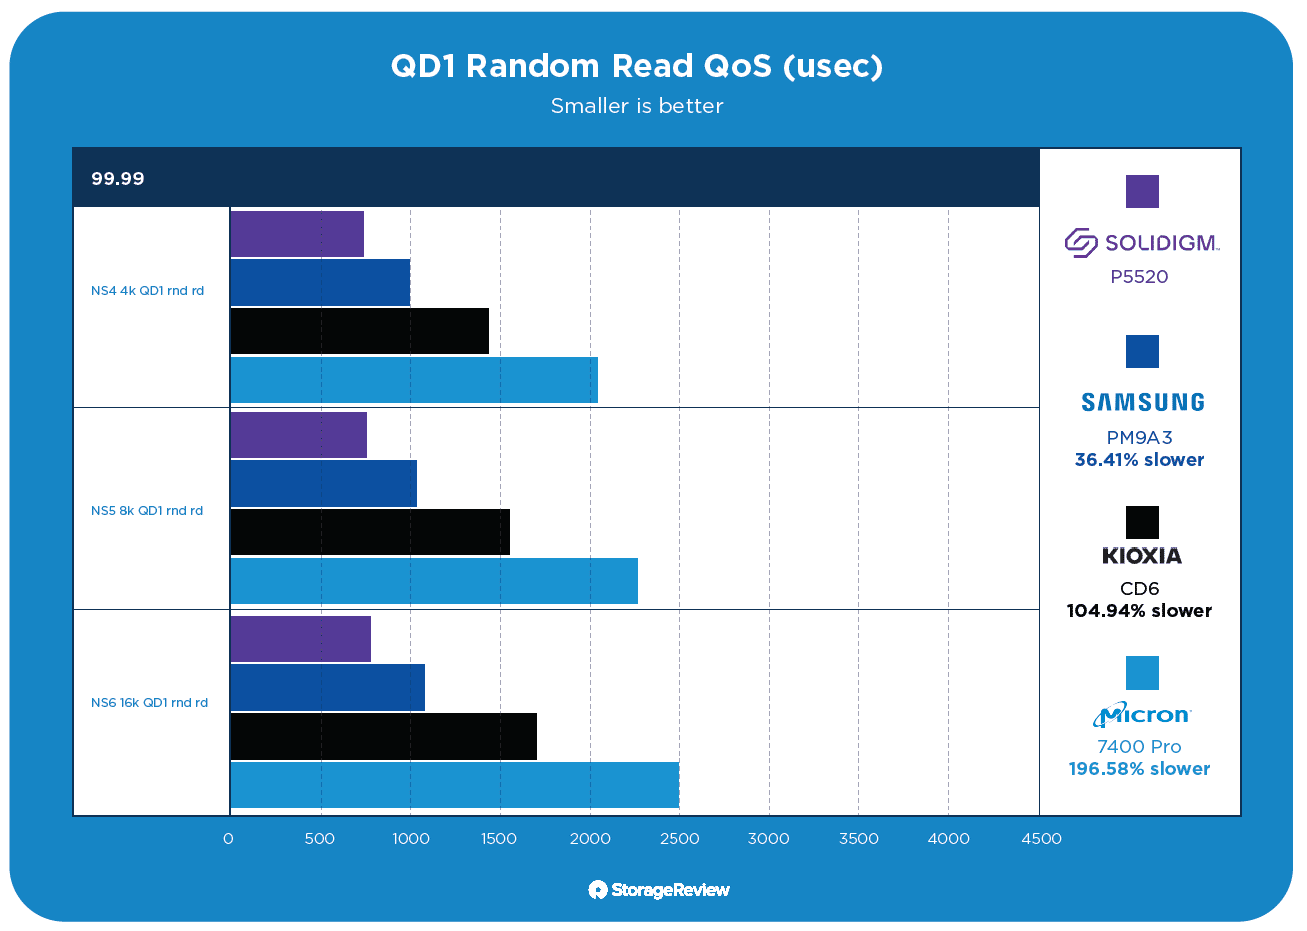
That gap increased, though, moving to the 99.99 percentile, where we started to see competing drives dramatically ramp up response times. Here the Solidigm P5520 measured 769 microseconds, with the Samsung PM9A3 measuring 1,049, the Kioxia CD6 with 1,576, and the Micron 7400 Pro with 2,281.
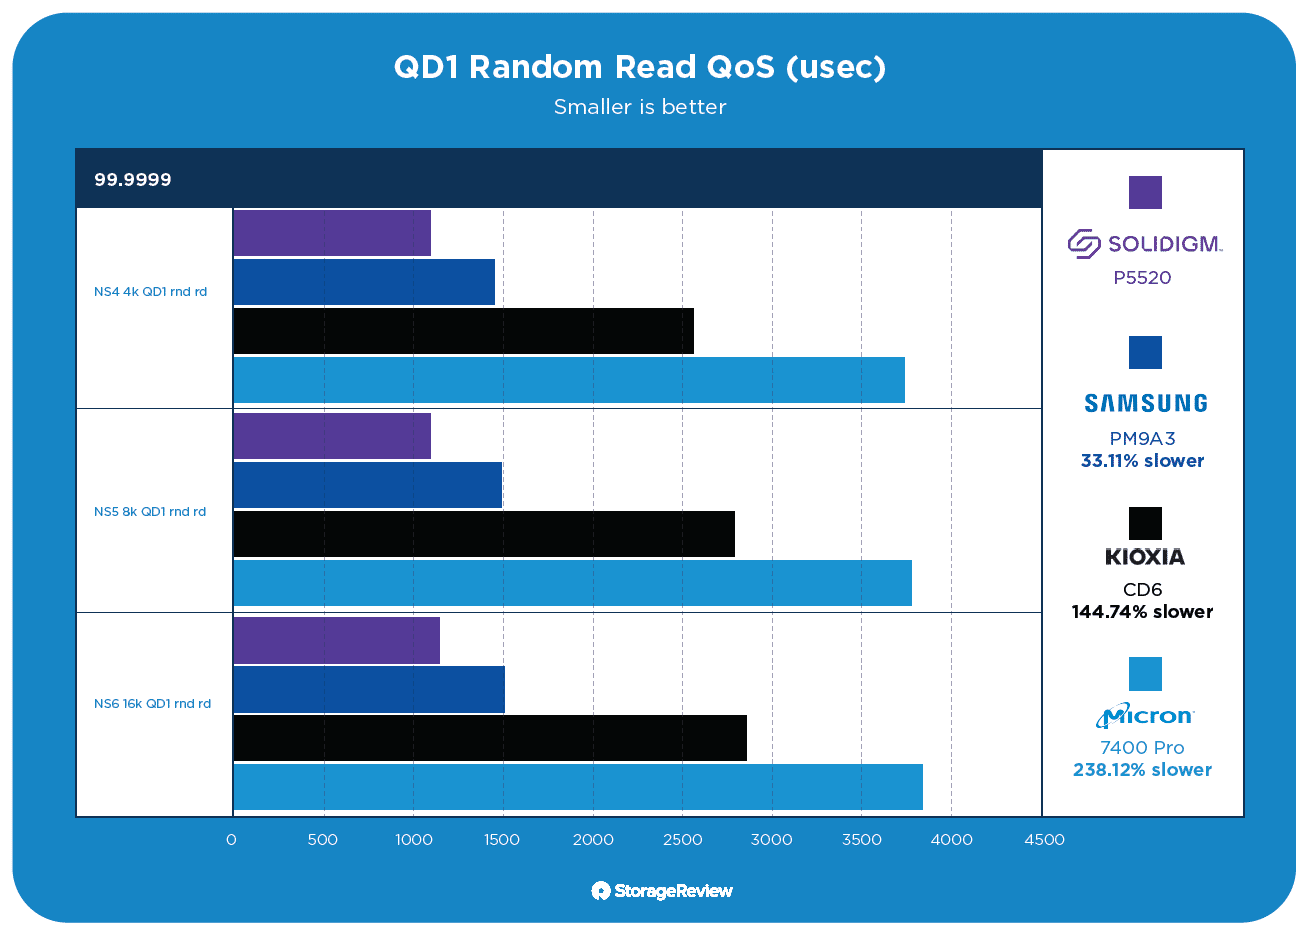
Moving to the six-9s or 99.9999 latency measurement, the P5520 continued its impressive lead over the group, measuring 1,123 microseconds. The Samsung PM9A3 remained in second place, measuring 1,494, the Kioxia CD6 jumped to 2,748, and the Micron 7400 Pro measured a staggering 3,796.
Sysbench MySQL Performance
Our Sysbench test leverages a Percona to drive I/O to a MySQL OLTP database. This test also measures average TPS (Transactions Per Second), average latency, and average 99th percentile latency. Each Sysbench VM is configured with three vDisks: one for boot (~92GB), one with the pre-built database (~447GB), and the third for the database under test (270GB). From a system resource perspective, we configured each VM with 16 vCPUs, and 60GB of DRAM and leveraged the LSI Logic SAS SCSI controller.
Sysbench Testing Configuration (per VM)
- CentOS 6.3 64-bit
- Percona XtraDB 5.5.30-rel30.1
- Database Tables: 100
- Database Size: 10,000,000
- Database Threads: 32
- RAM Buffer: 24GB
- Test Length: 3 hours
- 2 hours preconditioning 32 threads
- 1 hour 32 threads
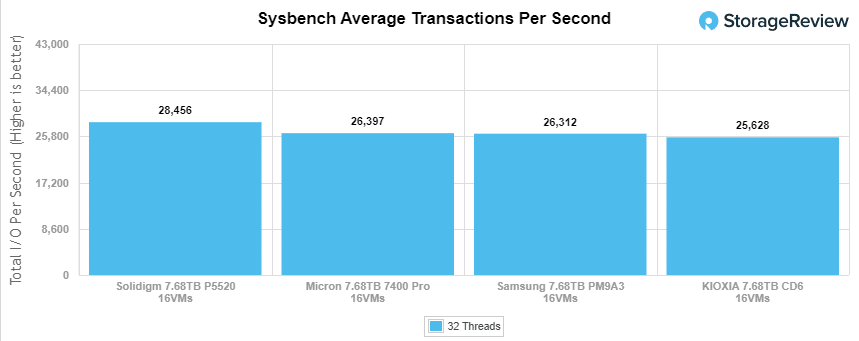
With a 16VM load (8VMs per SSD), we have the storage as the primary constraint on MySQL performance, leaving some CPU headroom. In terms of performance, the Solidigm P5520 came in at the top, measuring 28,455 TPS, followed by the 7400 Pro with 26,397 TPS, the PM9A3 with 26,312, and the CD6 with 25,628.
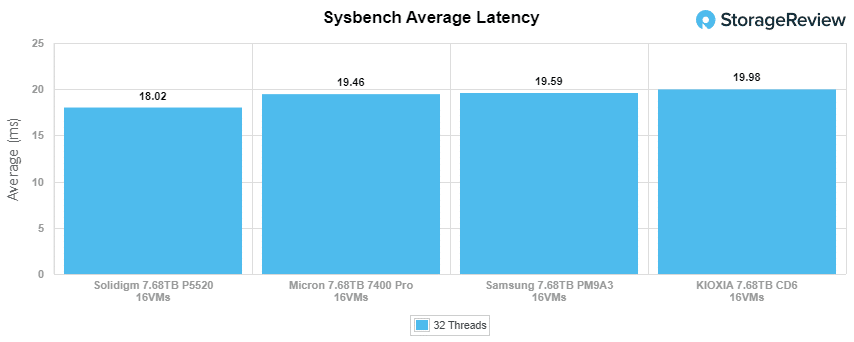
Looking at average latency, the P5520 had the lead with 18.02ms, followed by the 7400 Pro with 19.46ms, the PM9A3 with 19.59ms, and the CD6 with 19.98ms. It is important to note this is database response time, not storage latency, so numbers are higher than just the NVMe I/O layer.
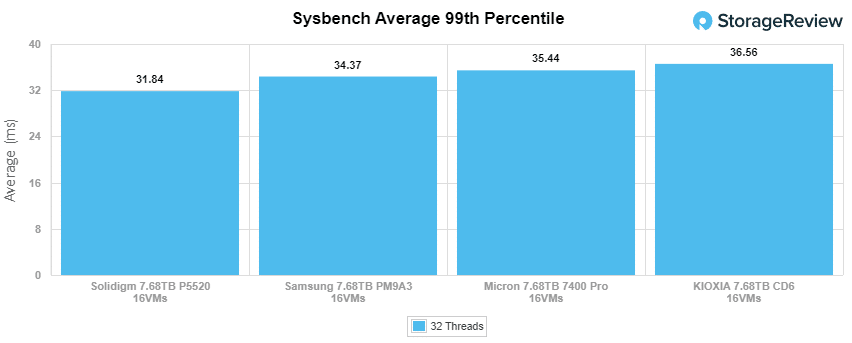
In the last portion, where we measure 99th percentile latency during the Sysbench workload, the P5520 measured 31.84ms, the PM9A3 with 34.37ms, the 7400 Pro at 35.44ms, and the CD6 with 36.56ms.
Conclusion
In our previous deep dive of the P5510, we compared it head-to-head against the PM93A. In that round of testing the P5510 performed very well, besting the Samsung drive. This time around, Solidigm is back with an updated enterprise SSD, so we’ve run the testing again pitting the Solidigm P5520 against the PM9A3. Further, we expanded the scope by including well-respected enterprise SSDs from Micron and KIOXIA in the showdown.
Looking at the spec sheets of the drives, it would have been hard to decipher that these batches of SSDs would perform so differently in our testing, but they did and in a most striking manner. An example of this is our FIO Noisy Neighbor Test where in the 99.99 percentile test the P5520 trounced its nearest competitor by 36%!
The primary trend which is easy to see across a wide range of tests is the Solidigm P5520 offers exceptional performance and very low latency across the board. It leads in many areas compared to the Kioxia CD6, Micron 7400 Pro, and Samsung PM9A3. This can be most visible in the Write Pressure Test where SSDs like the CD6 fully saturate far below others in the same class.
After this exercise, we’re left with the P5520 about where we were with the P5510 – that’s a very good thing. The P5520 is strong across the workloads we threw at it, really shining in the most intensive workloads like extreme write pressure and noisy neighbor scenarios. Solidigm engineering has proven again that in this mainstream enterprise SSD class, there’s a pretty wide chasm and making the right investment in flash is extremely important for application performance.
Solidigm sponsors this report. All views and opinions expressed in this report are based on our unbiased view of the product(s) under consideration.


 Amazon