

Dell’s Pro Max line represents its highest-performing laptops, replacing the outgoing Precision line with new branding and designs. The smallest of these models is the subject of this review: the Pro Max 14 Premium, a 14-inch laptop with a surprising amount of performance.
There are two variants of 14-inch Pro Max laptops. The starting model is the Pro Max 14, available with AMD Ryzen AI and Intel Core Ultra configurations, paired with the NVIDIA RTX PRO 500 graphics card. The pricier Pro Max 14 Premium, under review here, only offers Intel Core Ultra H-class CPUs and a more powerful RTX PRO 2000 GPU. The Premium model also offers an OLED display and superior build quality.
Like other Dell Pro Max laptops, it offers Independent Software Vendor (ISV) certifications for guaranteed compatibility with professional apps. Dell also includes many security features, including Intel vPro Enterprise (with select processors) and its Control Vault 3 software.
Dell Pro Max 14 Premium Specifications
| Processor |
|
| Operating System |
|
| Memory | 16/32/64GB of LPDDR5X-8400 |
| Graphics Card |
|
| Storage | 1x M.2 SSD |
| Display |
|
| Camera | 8MP IR |
| Wireless Networking | Intel Wi-Fi 7 BE200, with or without Bluetooth 5.4 |
| Battery | 4-cell 72Whr |
| Power Adapter | 100W or 130W |
| Security Features |
|
| Dimensions and Weight |
|
| Warranty | Standard three years, next business day onsite repair |
Build and Design
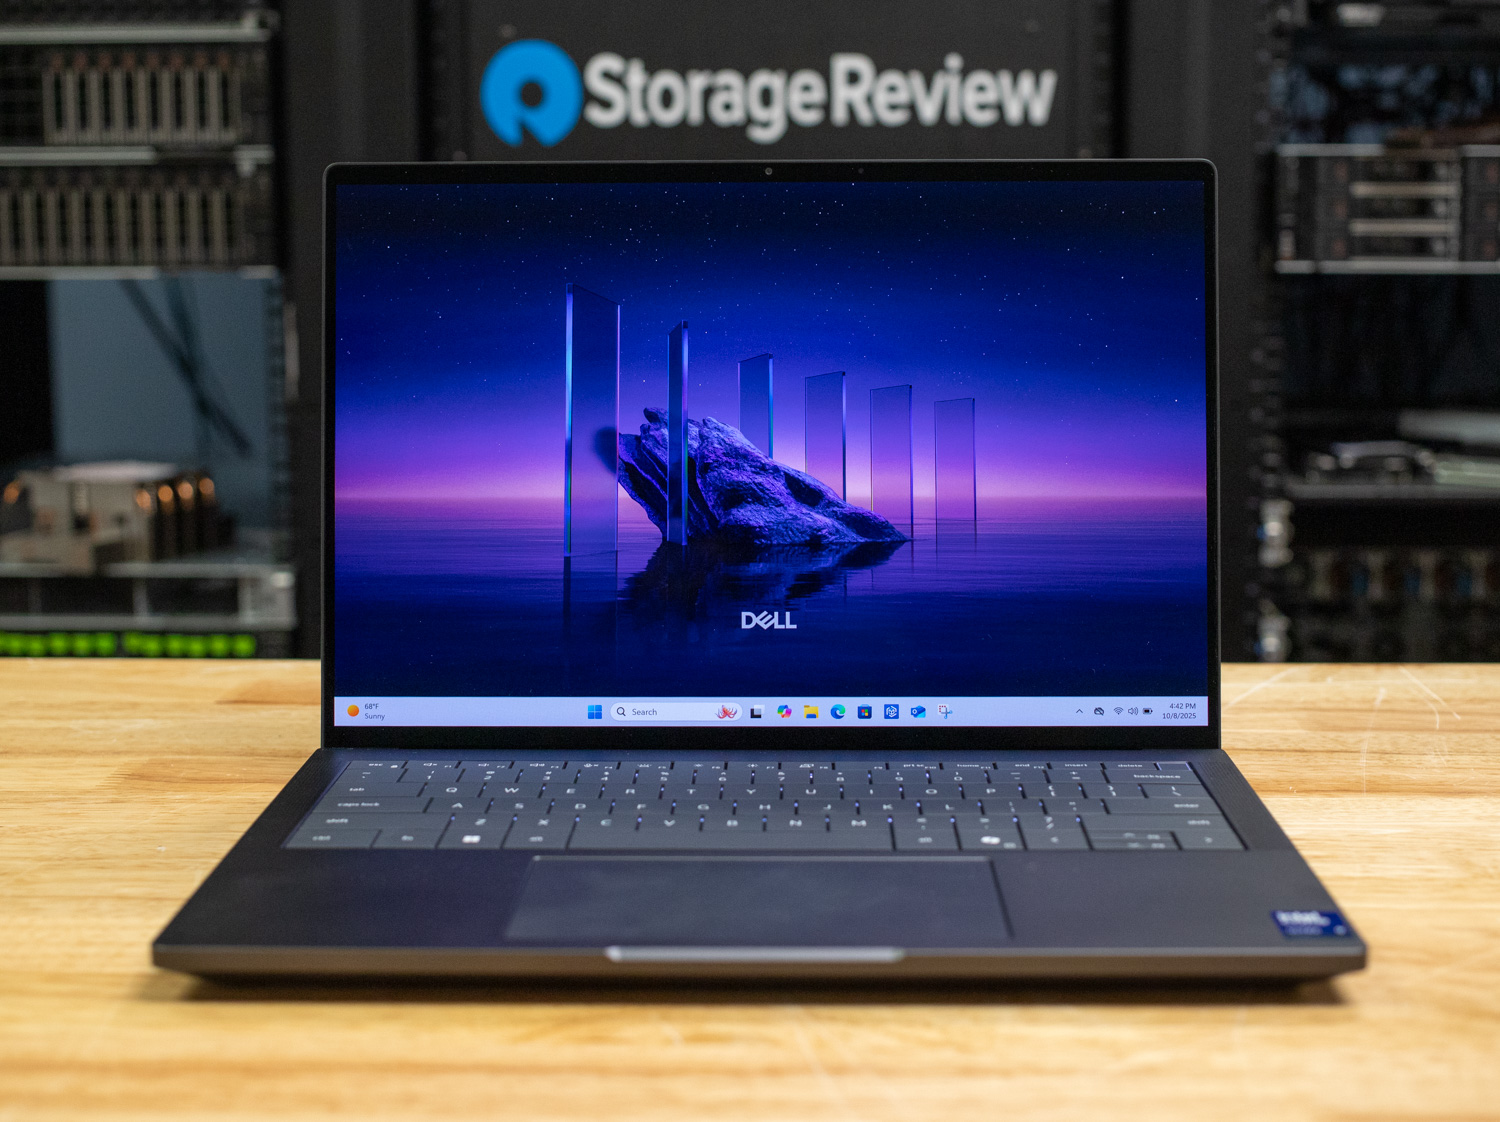
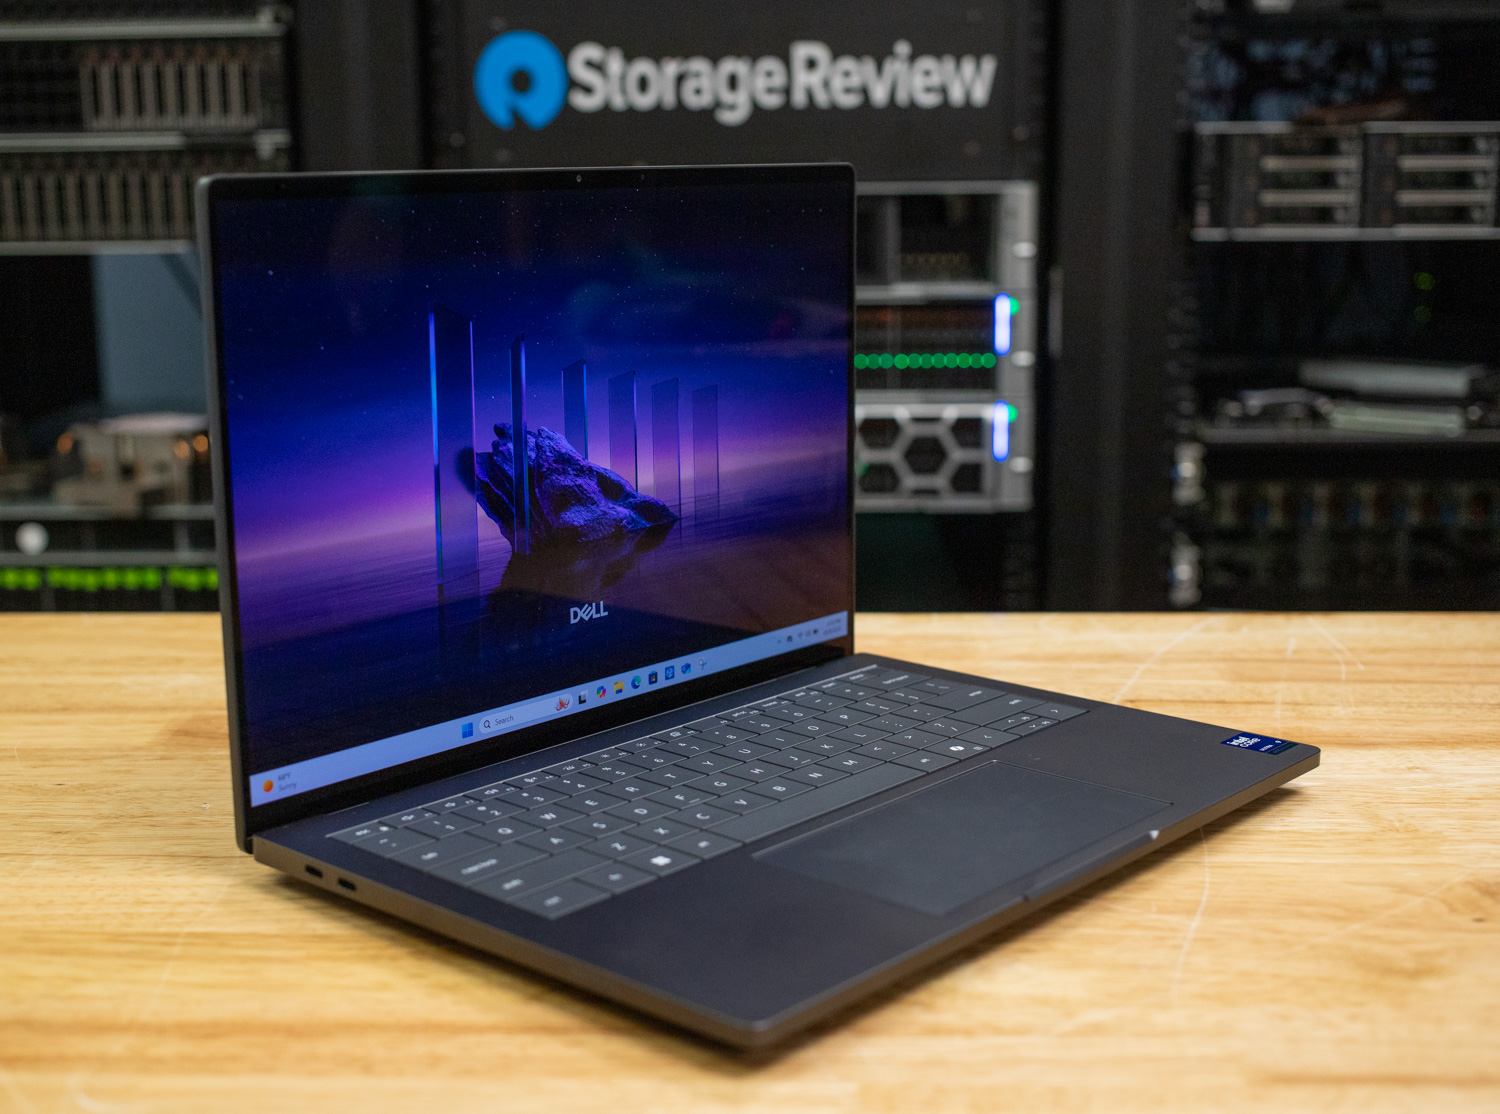
The Pro Max 14 Premium’s build quality is as solid as they come. The laptop’s aluminum and magnesium design feels dense in the hand and is completely solid regardless of how it’s handled. The laptop has passed MIL-STD-810H testing for durability in harsh conditions, including high-temperature environments.
The dark anodized exterior is sleek and ultramodern, further enhanced by the zero-lattice keyboard design. Our OLED-screen model measures 0.78 by 12.23 by 8.36 inches (HWD). While it is thicker than an ultraportable consumer laptop, it remains impressively slim in other dimensions, highlighting minimal display bezels. The laptop’s 3.55-pound weight is also heavier than an ultraportable. For instance, Dell’s Pro 14 Premium is as light as 2.52 pounds. However, the Pro Max 14 Premium is quite respectable considering the power and dedicated graphics card included in this model.
For port selection, the Pro Max 14 Premium is well-equipped, provided you only need USB-C. The two USB-C ports on the left are Thunderbolt 5, while the two ports on the right are Thunderbolt 4. There is also a universal audio jack and a microSD card reader on the right side. Dell also provides a wedge-shaped lock slot for security.
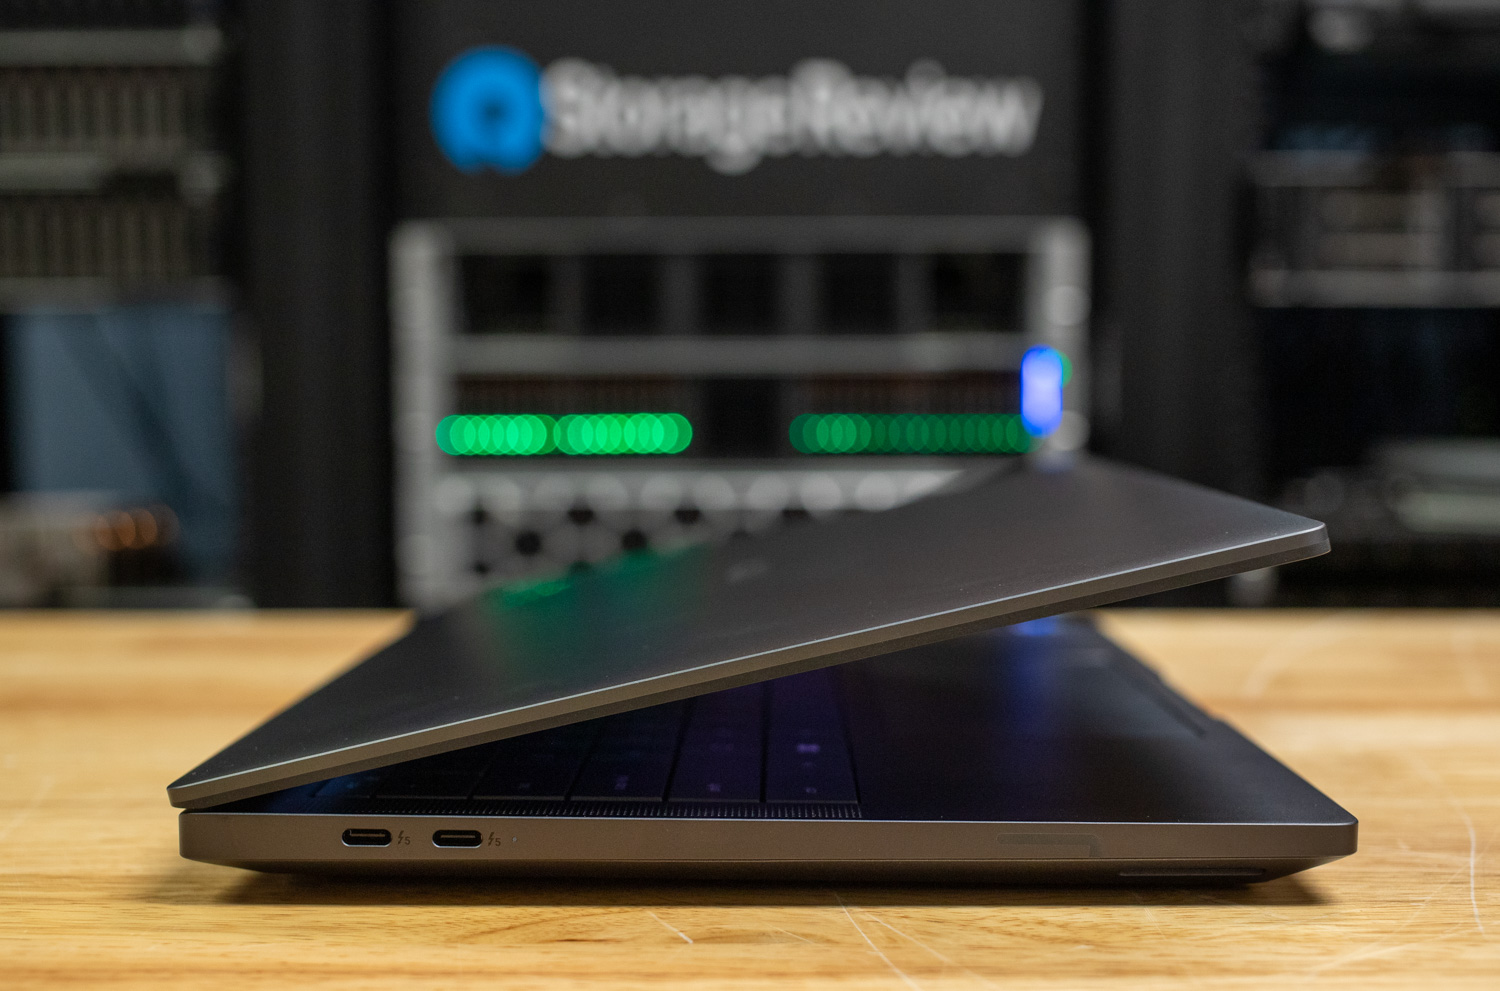
Two Thunderbolt 5 ports reside on the left edge.
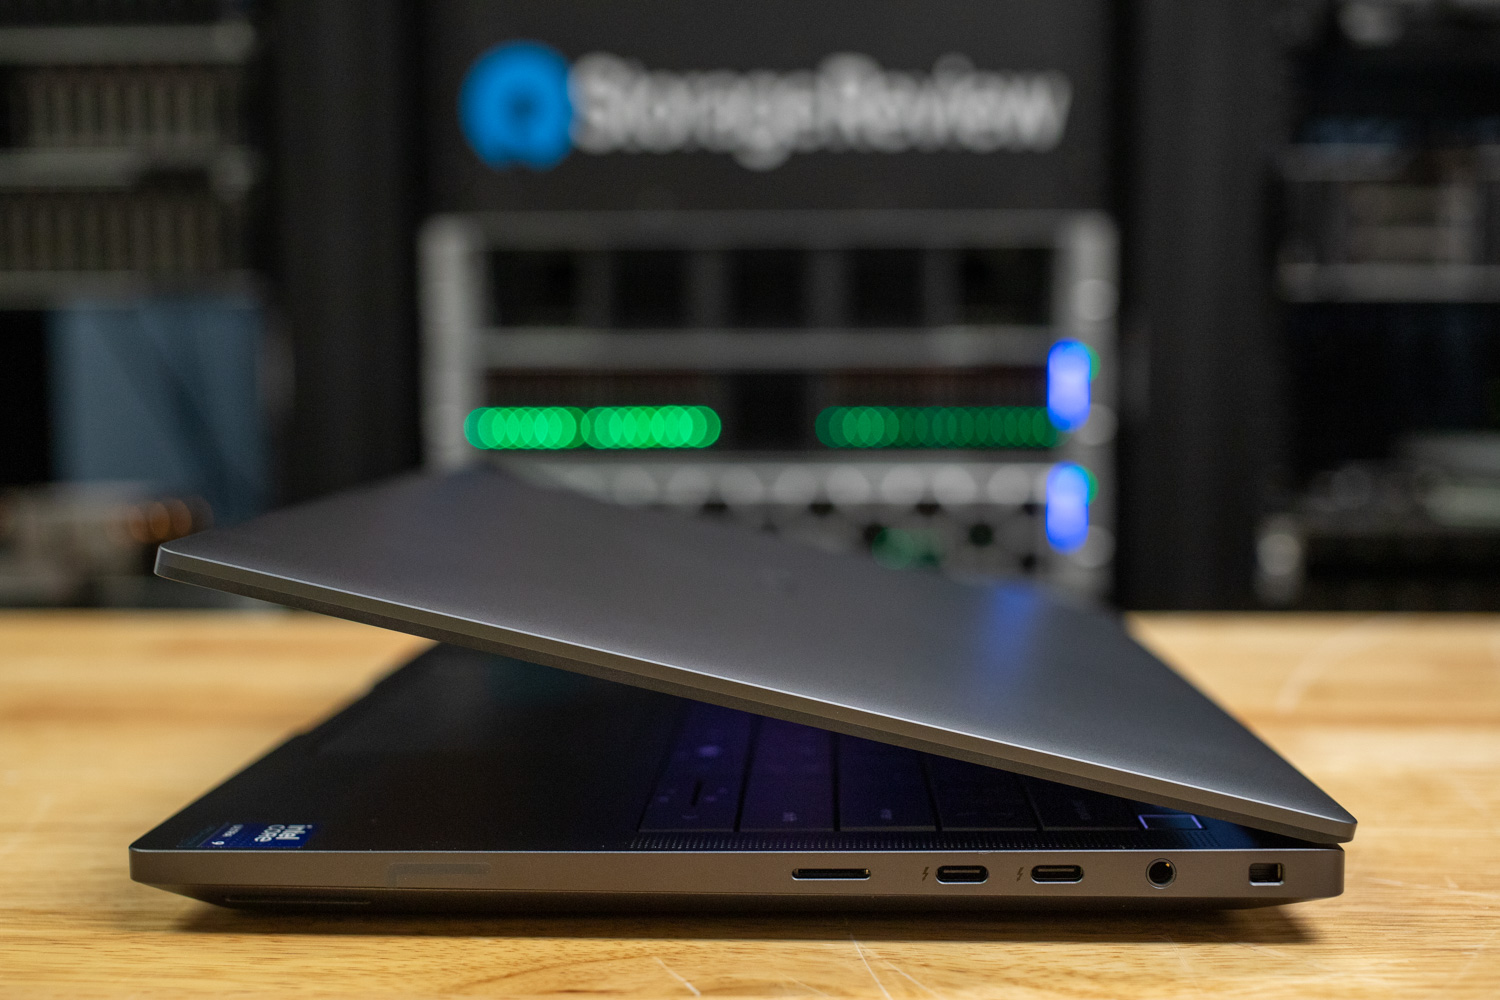
The right edge includes two Thunderbolt 4 ports, a microSD card reader, an audio jack, and a Wedge-shaped lock slot.
Internally, the laptop supports the latest Wi-Fi 7 and Bluetooth 5.4 standards, thanks to its Intel BE200 wireless card. Unfortunately, Dell doesn’t provide an option for mobile broadband.
Screen and Input Devices
Dell offers two 14-inch 16:10 screen choices on the Pro Max 14 Premium. The base panel is a 1920×1200 non-touch IPS panel with 100% sRGB color coverage. Our unit sports the Tandem OLED panel, with a finer 2880×1800 resolution, touch capability, broader 100% DCI-P3 color coverage, and a 400-nit brightness rating.
The Pro Max 14 Premium offers a Tandem OLED screen, which uses two light layers to maximize brightness.
The OLED picture quality is stunning in person. “Tandem” refers to Dell’s technology, which stacks two light-emitting layers in one screen to improve brightness performance. The only downside of this technology is that it’s harder on battery life; users looking for the most unplugged stamina will probably want to stick to the base IPS panel. That said, the luxuriously vibrant colors and exceptional brightness of this OLED panel make it difficult to pass up, particularly since it supports touch.
Dell’s zero-lattice keyboard features mini-LED lighting that the company says improves battery life versus traditional backlighting. With about 1mm of travel, the keyboard offers responsive feedback and is comfortable for long typing sessions. Not having any spacing between the keys takes getting used to—I initially had trouble finding the little bars on the F and J keys to position my hands—but with some usage, I got used to the layout and was able to hit my top typing speed in the MonkeyType online typing test.
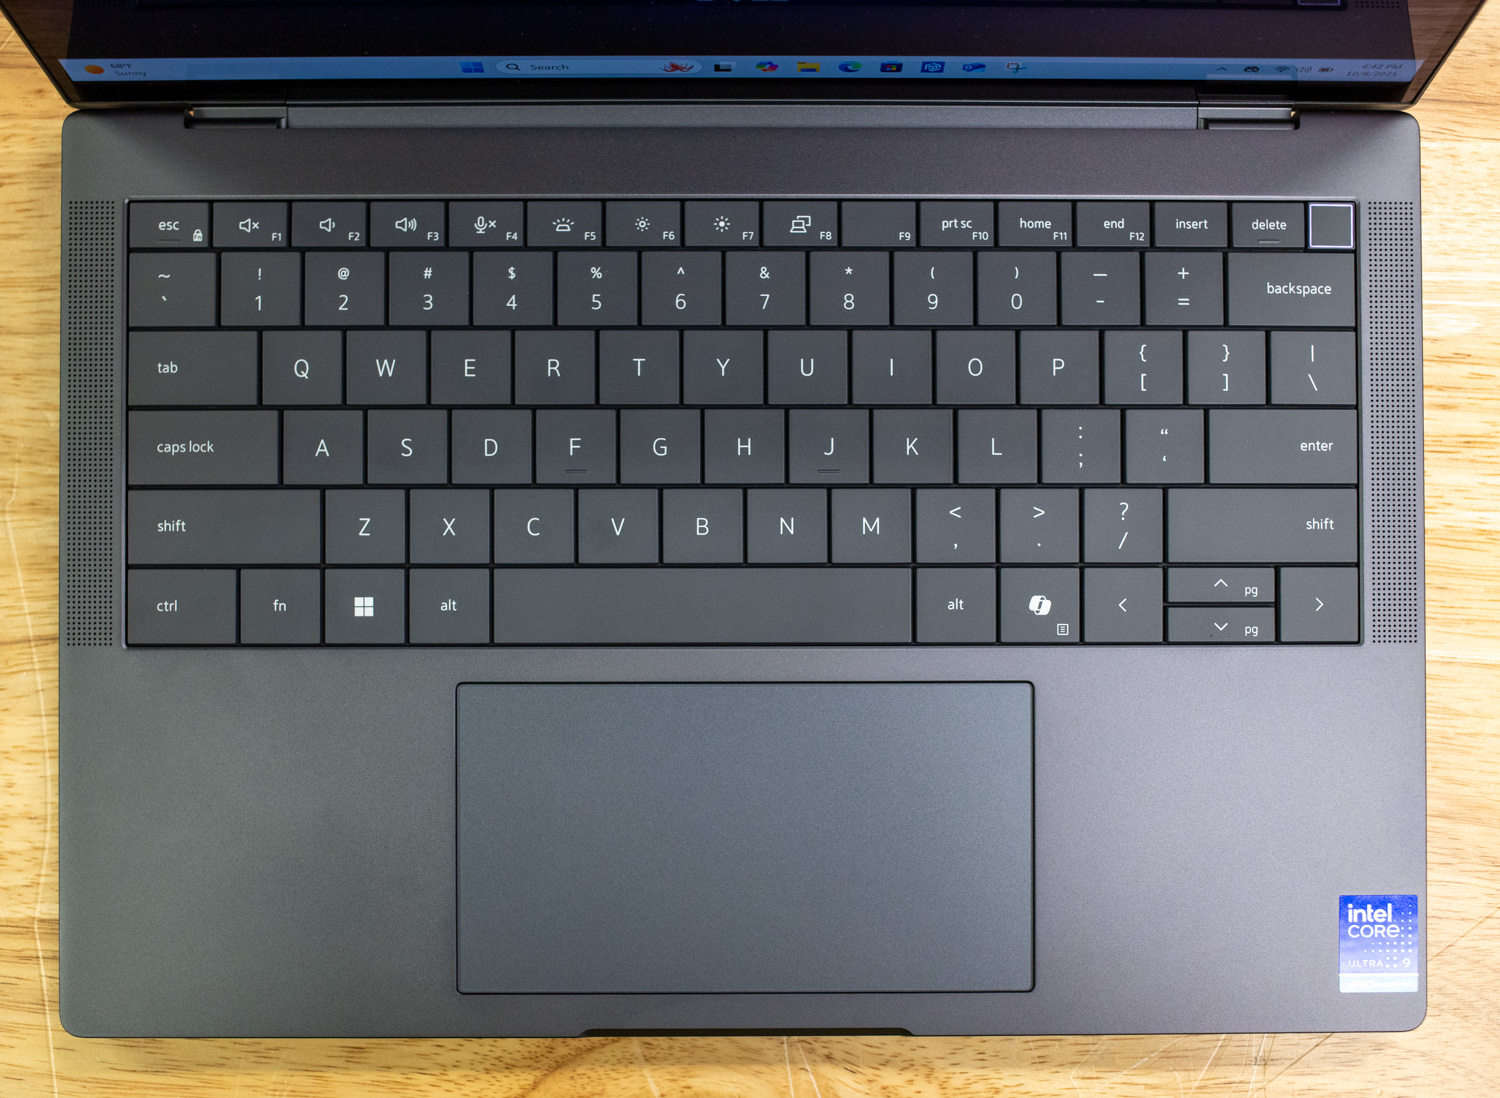
The Pro Max 14 Premium uses a zero-lattice keyboard with no spacing between keys, plus mini-LED backlighting.
My only complaints about this keyboard stem from its layout. For starters, the mismatched arrow key sizes. It features half-height up and down keys paired with full-size left and right keys, causing me to make unintended keypresses. I also wish the Home and End keys were not embedded in the Function row. I typically enable Function Lock to make the F1 through F12 keys primary, but doing so makes Home and End secondary, thus requiring the Fn key to access them. I probably would have gotten used to this layout over time, but it does feel awkward to need to press Fn constantly.
Meanwhile, the Pro Max 14 Premium’s touchpad works very well. The pad itself is not movable, relying on small haptic motors for feedback via tactile bumps. For the uninitiated, the touchpad’s surface doesn’t depress, but you probably wouldn’t know it.
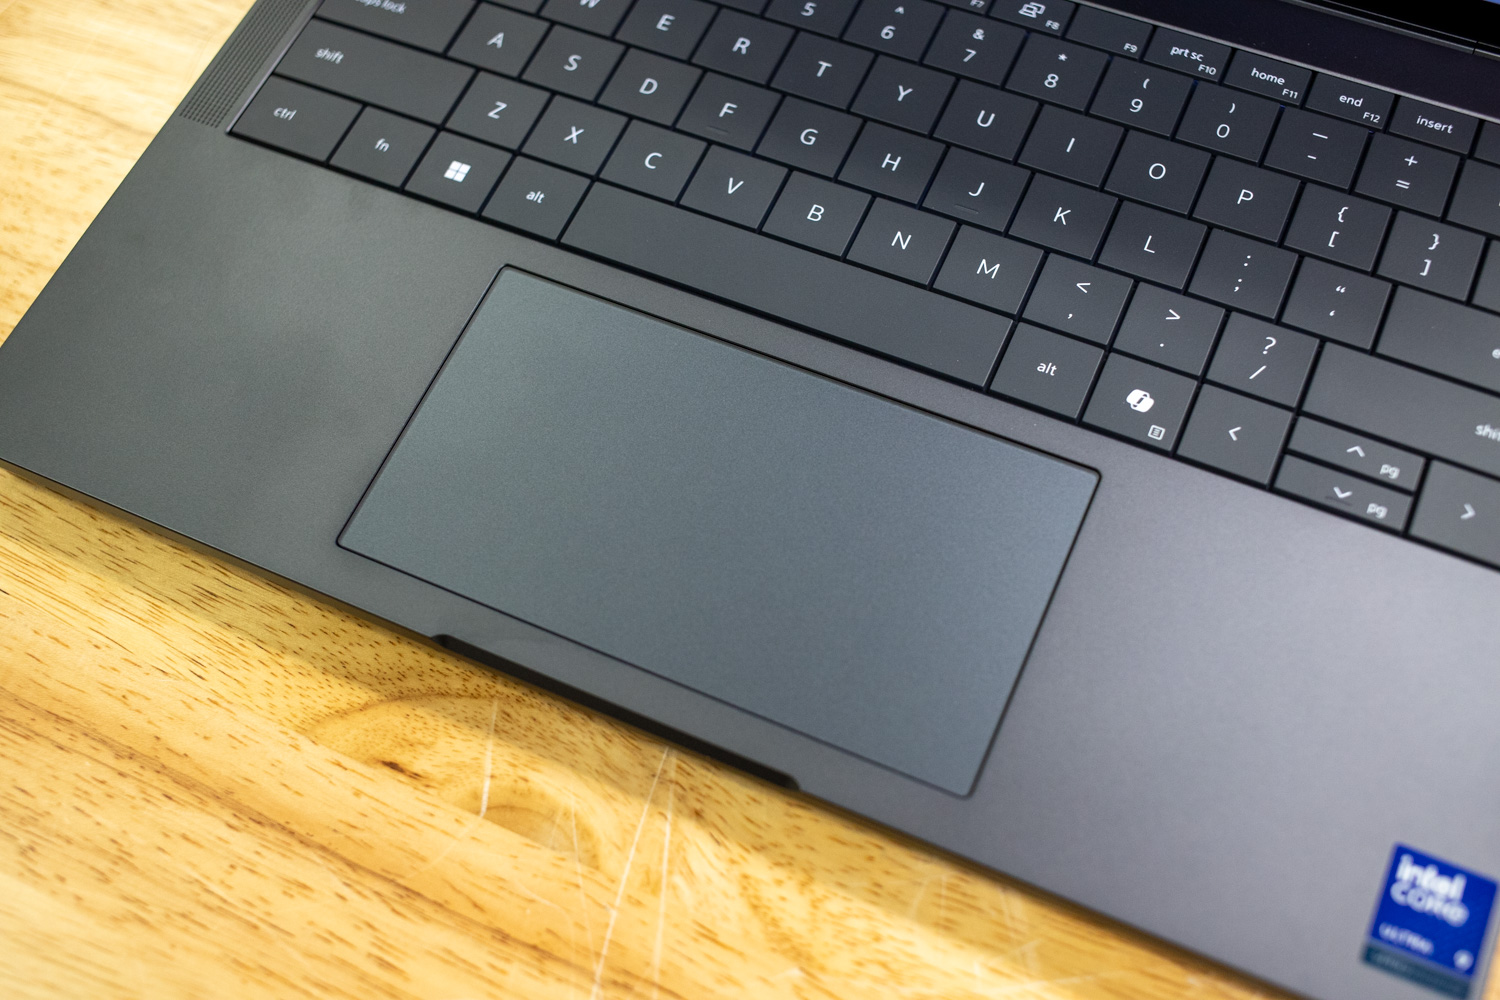
The touchpad has no movable parts, using haptic motors to simulate tactile feedback.
An 8MP webcam over the display looks sharp and shows minimal grain even in suboptimal lighting conditions, though it lacks a privacy shutter. It features an infrared sensor for facial recognition. A fingerprint reader embedded in the power button adds another biometric login option.
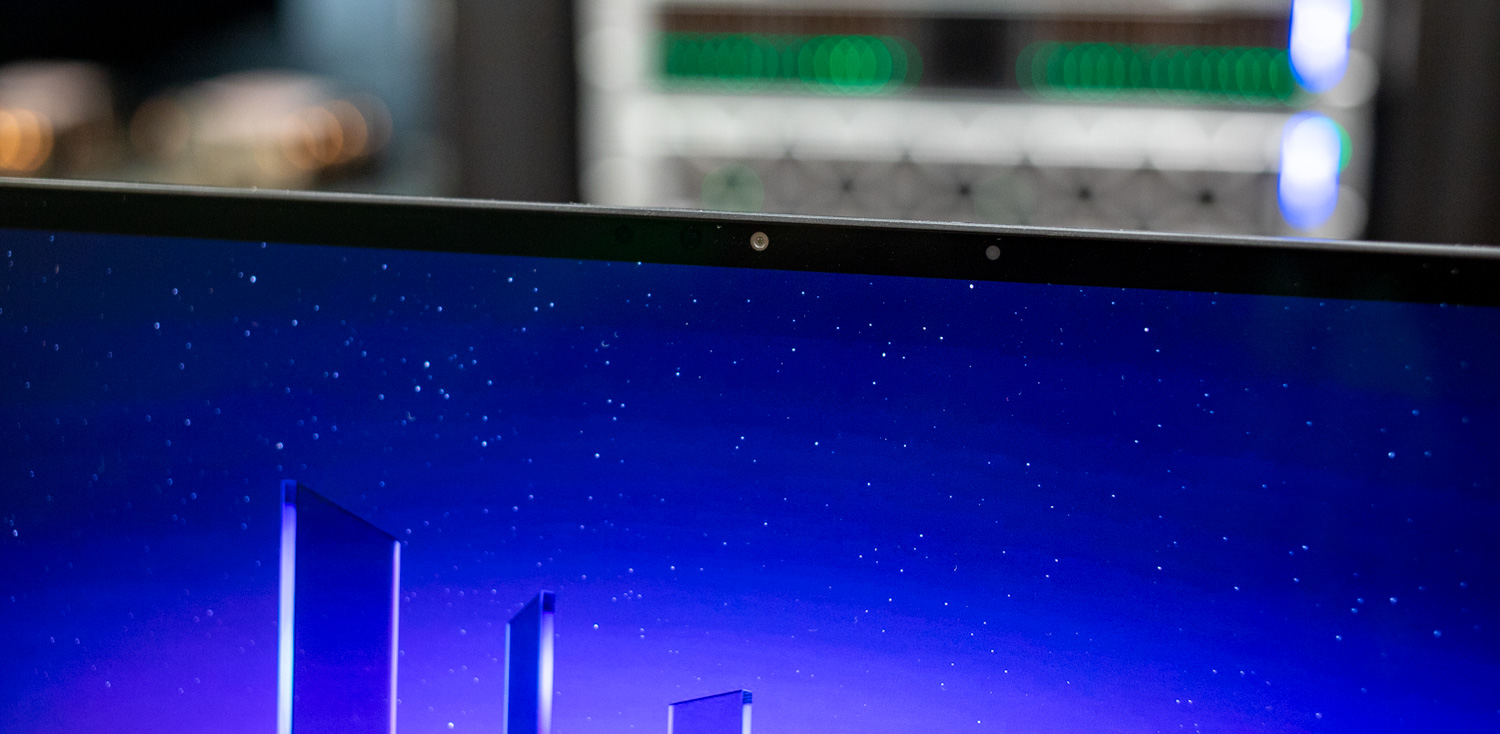
The Pro Max 14 Premium features an 8MP webcam with IR capability.
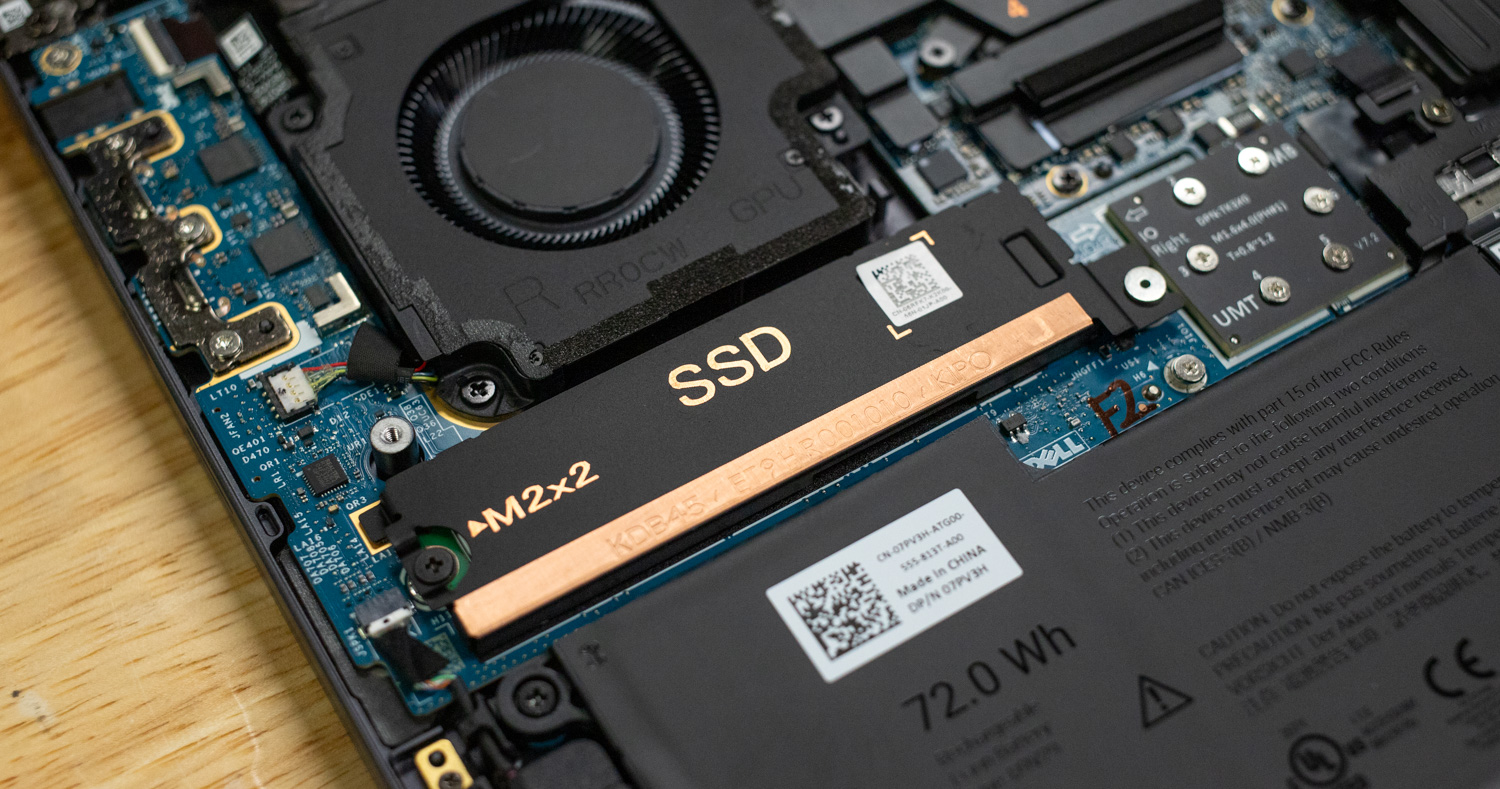
Upgradeability
Upgradeable components in the Pro Max 14 Premium are limited to the battery and the M.2 2280 SSD, as every other component is soldered or non-replaceable. That said, Dell has begun to incorporate more sustainable practices into its laptops, and the results are featured in the Pro Max 14 Premium with a modular mainboard and I/O board, which can be replaced in the event of failure, meaning the entire laptop doesn’t need to be replaced. It’s also nice to see healthy reinforcements over the USB-C ports internally.
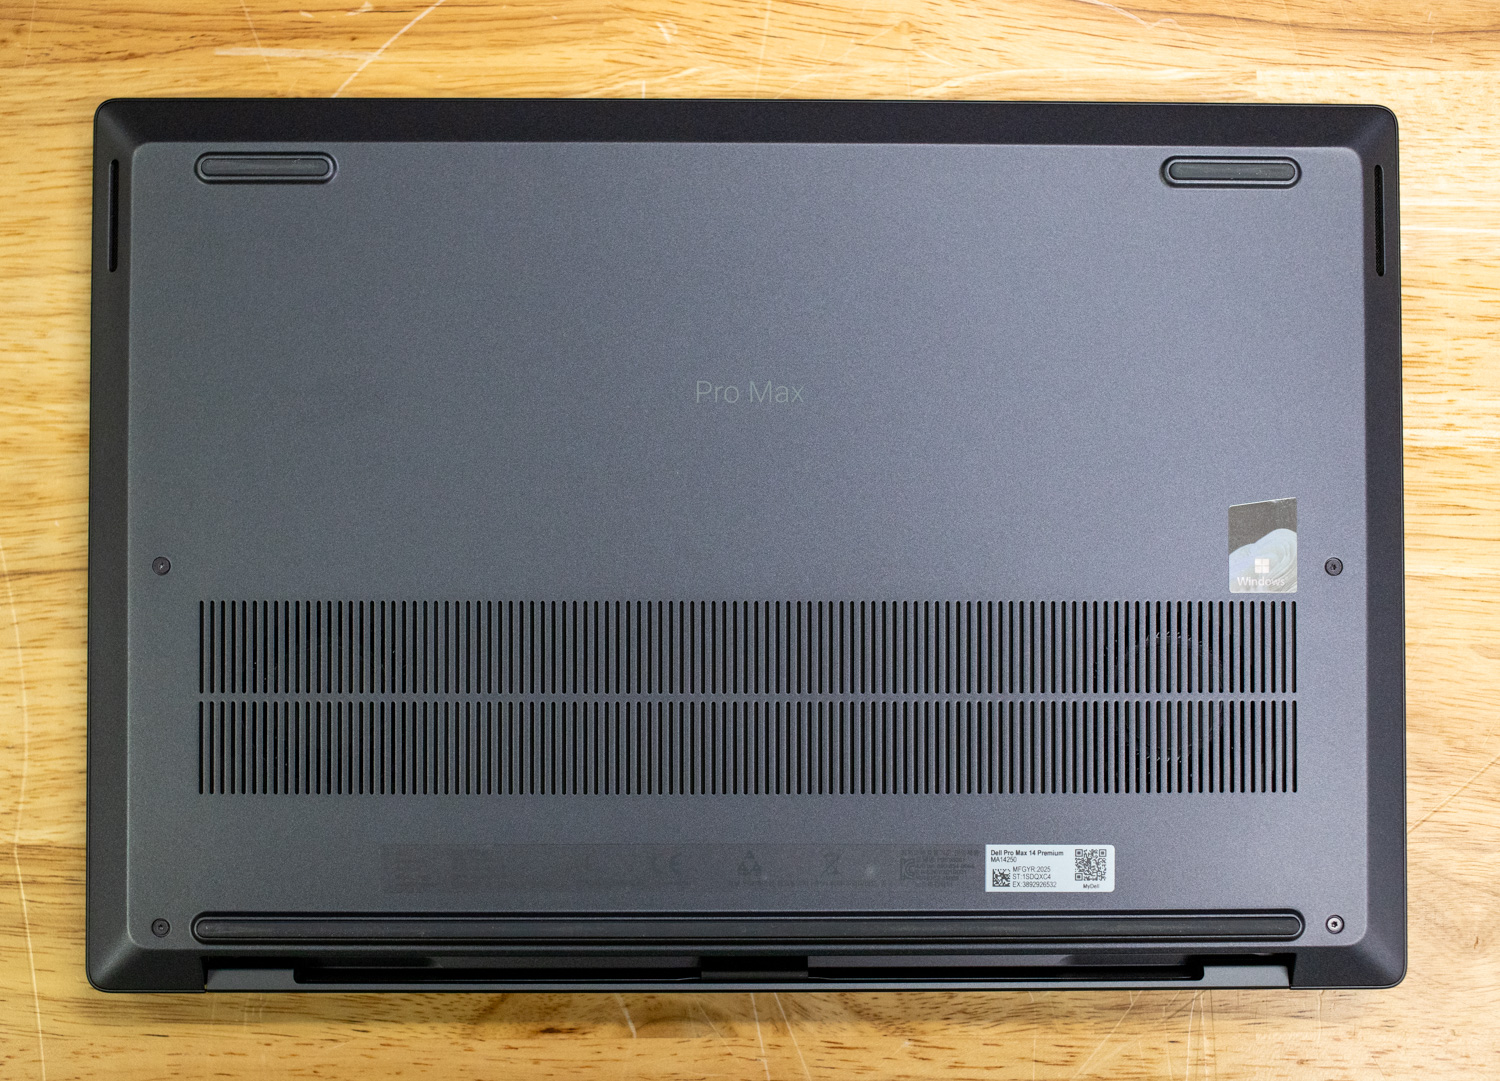
The fans inside the Dell Pro Max 14 Premium handled cooling tasks well, keeping things quiet right up until heavier tasks kicked in. For more mild day-to-day activity, the system was near silent.
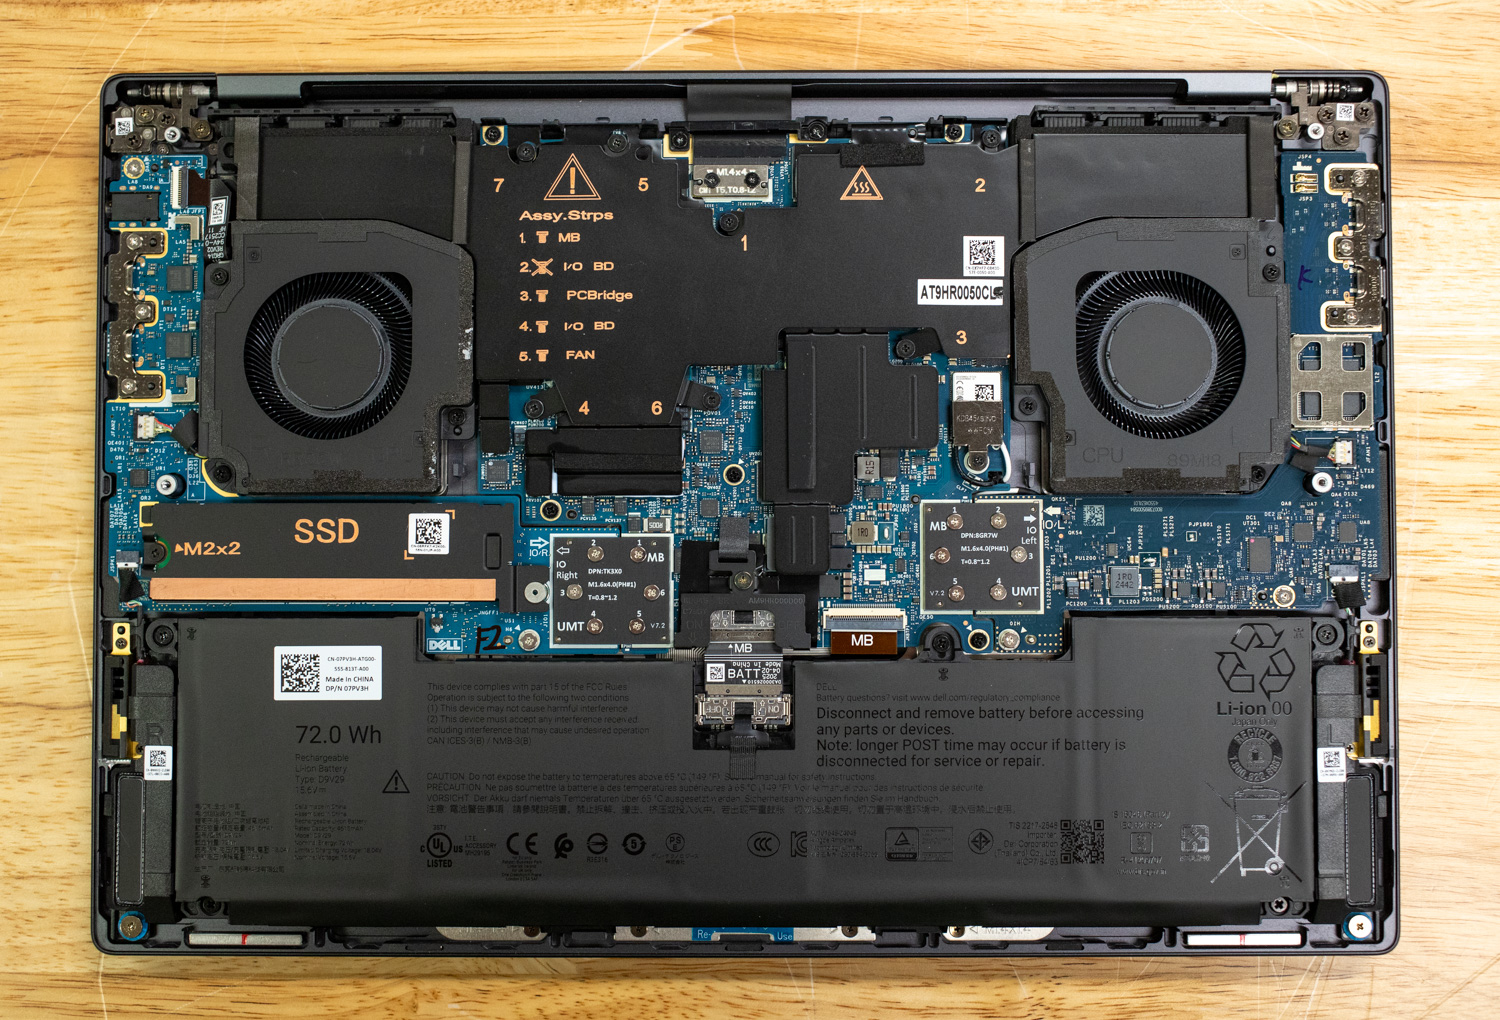
Upgradeable components include the battery and the M.2 2280 SSD, but everything else is soldered.
Performance Benchmarks
Dell sent us a fully loaded Pro Max 14 Premium with the following components:
- Intel Core Ultra 9 285H
- NVIDIA RTX PRO 2000 8GB GDDR7
- 64GB LPDDR5X-8400
- 1TB SSD
The single-unit price is $4,752 through Dell.com, or twice the starting price ($2,191). Businesses buying through channel partners can expect different pricing, particularly with bulk purchases.
As we haven’t tested any other small workstation-focused laptops recently, the Pro Max 14 Premium finds itself against two larger workstation laptops. These include its larger brothers, the Pro Max 16 Plus and the Pro Max 18 Plus. Featuring Core HX-class CPUs and much more powerful NVIDIA RTX PRO graphics, these laptops will, of course, outperform the comparatively tiny Pro Max 14 Premium, but we’ll do our best to keep things relative.
Procyon AI Computer Vision
The Procyon AI Computer Vision Benchmark measures AI inference performance across CPUs, GPUs, and dedicated accelerators using a range of state-of-the-art neural networks. It evaluates tasks such as image classification, object detection, segmentation, and super resolution with models including MobileNet V3, Inception V4, YOLO V3, DeepLab V3, Real ESRGAN, and ResNet 50. Tests are run on multiple inference engines, including NVIDIA TensorRT, Intel OpenVINO, Qualcomm SNPE, Microsoft Windows ML, and Apple Core ML, providing a broad view of hardware and software efficiency. Results are reported for float- and integer-optimized models, offering a consistent and practical measure of machine vision performance for professional workloads.
In the UL Procyon AI Computer Vision benchmark, the Pro Max 14 Premium scored 127 overall, showing strong single-model consistency across inference tasks. While the Pro Max 18 Plus and Pro Max 16 Plus scored higher at 195 and 190, respectively, the 14 Premium remained competitive in lighter models like MobileNet V3, completing runs in just 1.12 ms, nearly identical to the larger systems’ results. On heavier workloads, such as ResNet 50 and Inception V4, the smaller unit achieved 10.55 ms and 31.90 ms, respectively, trailing the Pro 5000-equipped systems but still demonstrating balanced throughput for its class. Even in demanding upscaling tasks like REAL-ESRGAN, the Pro Max 14 Premium finished at 3,318.78 ms, roughly 70 percent slower than the larger siblings, which is an expected result given its midrange GPU configuration.
When relying solely on integrated graphics, the Pro Max 14 Premium actually outperformed the higher-end systems, achieving an overall score of 266, compared to 156 and 149 for the 18 and 16 Plus models. This suggests tighter optimization or less thermal throttling under iGPU load, highlighting Dell’s tuning of the 14 Premium as a well-balanced, efficient mobile platform. It completed models like YOLO V3 in 29.12 ms, versus 54.03 ms and 57.56 ms on the larger systems.
| CPU Results (average time in ms) | Dell Pro Max 14 Premium (Intel Core Ultra 9 285H) (NVIDIA RTX PRO 2000) | Dell Pro Max 18 Plus (Intel Core Ultra 9 285HX) (NVIDIA RTX PRO 5000) | Dell Pro Max 16 Plus (Intel Core Ultra 9 285HX) (NVIDIA RTX PRO 5000) |
| AI Computer Vision Overall Score | 127 | 195 | 190 |
| MobileNet V3 | 1.12 ms | 1.00 ms | 0.97 ms |
| ResNet 50 | 10.55 ms | 6.98 ms | 7.29 ms |
| Inception V4 | 31.90 ms | 19.53 ms | 20.76 ms |
| DeepLab V3 | 37.46 ms | 24.15 ms | 24.02 ms |
| YOLO V3 | 77.49 ms | 44.53 ms | 44.59 ms |
| REAL-ESRGAN | 3,318.78 ms | 1,934.18 ms | 2,043.35 ms |
| CPU Integrated Graphics Results (average time in ms) | |||
| AI Computer Vision Overall Score | 266 | 156 | 149 |
| MobileNet V3 | 1.00 ms | 1.35 ms | 1.35 ms |
| ResNet 50 | 4.54 ms | 8.86 ms | 8.90 ms |
| Inception V4 | 12.07 ms | 22.71 ms | 27.60 ms |
| DeepLab V3 | 26.13 ms | 37.80 ms | 38.68 ms |
| YOLO V3 | 29.12 ms | 54.03 ms | 57.56 ms |
| REAL-ESRGAN | 1,046.98 ms | 1,878.42 ms | 1,910.57 ms |
When transitioning from CPU to GPU-focused workloads, the Dell Pro Max 14 Premium exhibits a significant improvement in AI Computer Vision performance, demonstrating that even with a midrange NVIDIA RTX PRO 2000, it can deliver strong acceleration for most inference tasks. In the UL Procyon AI Computer Vision benchmark, the system achieved an overall score of 489, roughly half of what the larger Pro Max 18 Plus and Pro Max 16 Plus systems produced at 1,032 and 1,023, respectively. This aligns perfectly with its tier and price point, showing that Dell has tuned the smaller model to balance performance efficiency rather than compete directly with top-end workstation configurations.
On lightweight neural network models such as MobileNet V3, the Pro Max 14 Premium completed runs in just 0.82 ms, not far behind the 0.55 ms and 0.54 ms results from the 5000-equipped systems. More intensive networks, including ResNet 50 and Inception V4, achieved times of 3.03 ms and 7.26 ms, respectively, demonstrating respectable throughput for a GPU in this class. The DeepLab V3 and YOLO V3 models, which typically demand more compute and memory bandwidth, returned 18.42 ms and 13.13 ms, remaining well within practical performance ranges for mobile AI workloads. In the most demanding task, REAL-ESRGAN, which tests image restoration and upscaling, the Pro Max 14 Premium recorded 257.17 ms.
| GPU Results (average time in ms) | Dell Pro Max 14 Premium (Intel Core Ultra 9 285H) (NVIDIA RTX PRO 2000) | Dell Pro Max 18 Plus (Intel Core Ultra 9 285HX) (NVIDIA RTX PRO 5000) | Dell Pro Max 16 Plus (Intel Core Ultra 9 285HX) (NVIDIA RTX PRO 5000) |
| AI Computer Vision Overall Score | 489 | 1,032 | 1,023 |
| MobileNet V3 | 0.82 ms | 0.55 ms | 0.54 ms |
| ResNet 50 | 3.03 ms | 1.20 ms | 1.22 ms |
| Inception V4 | 7.26 ms | 3.00 ms | 3.05 ms |
| DeepLab V3 | 18.42 ms | 13.05 ms | 12.82 ms |
| YOLO V3 | 13.13 ms | 5.63 ms | 5.80 ms |
| REAL-ESRGAN | 257.17 ms | 88.56 ms | 90.35 ms |
UL Procyon: AI Text Generation
The Procyon AI Text Generation Benchmark streamlines AI LLM performance testing by providing a concise and consistent evaluation method. It enables repeated testing across multiple LLM models, minimizing the complexity of large model sizes and variable factors. Developed with AI hardware leaders, it optimizes the use of local AI accelerators for more reliable and efficient performance assessments. The results measured below were tested using TensorRT.
The Pro Max 14 Premium scored 1,613 in the Phi test, compared to 4,475 on the Pro Max 18 Plus and 4,083 on the Pro Max 16 Plus. The smaller unit’s time to first token measured 0.533 seconds, roughly double the response latency of the larger models, which completed the same step in 0.237 and 0.274 seconds. While the tokens per second rate for the 14 Premium reached 54.06 tok/s, the higher-end RTX PRO 5000 configurations achieved roughly three times the throughput at 185.12 and 178.61 tok/s, completing their runs in just over 16–17 seconds versus the 53.42 seconds required on the 14 Premium.
A similar pattern was observed across the Mistral and Llama3 tests, with the 14 Premium maintaining steady but proportionally lower performance. In Mistral, it posted 1,579 points with an output rate of 43.21 tok/s, completing the test in 67.56 seconds, while the Plus models reached around 4,000 points and finished in roughly one-third the time. For Llama3, the 14 Premium scored 1,387, generating 37.7 tokens per second, compared to 3,763 and 3,547 from the larger systems. These results reflect the scaling expected from GPU tier differences while showing that Dell’s software and thermal tuning keep the smaller 14 Premium performing predictably within its limits.
| UL Procyon: AI Text Generation | Dell Pro Max 14 Premium (Intel Core Ultra 9 285H) (NVIDIA RTX PRO 2000) | Dell Pro Max 18 Plus (Intel Core Ultra 9 285HX) (NVIDIA RTX PRO 5000) | Dell Pro Max 16 Plus (Intel Core Ultra 9 285HX) (NVIDIA RTX PRO 5000) |
| Phi Overall Score | 1,613 | 4,475 | 4,083 |
| Phi Output Time To First Token | 0.533 s | 0.237 s | 0.274 s |
| Phi Output Tokens Per Second | 54.065 tok/s | 185.118 tok/s | 178.614 tok/s |
| Phi Overall Duration | 53.421 s | 16.314 s | 17.133 s |
| Mistral Overall Score | 1,579 | 4,295 | 3,993 |
| Mistral Output Time To First Token | 0.789 s | 0.347 s | 0.370 s |
| Mistral Output Tokens Per Second | 43.210 tok/s | 140.546 tok/s | 134.228 tok/s |
| Mistral Overall Duration | 67.557 s | 21.665 s | 22.887 s |
| Llama3 Overall Score | 1,387 | 3,763 | 3,547 |
| Llama3 Output Time To First Token | 0.796 s | 0.344 s | 0.370 s |
| Llama3 Output Tokens Per Second | 37.701 tok/s | 119.741 tok/s | 114.741 tok/s |
| Llama3 Overall Duration | 77.103 s | 25.165 s | 26.319 s |
| Llama2 Overall Score | – | 4,155 | 4,044 |
| Llama2 Output Time To First Token | – | 0.546 s | 0.558 s |
| Llama2 Output Tokens Per Second | – | 69.709 tok/s | 67.484 tok/s |
| Llama2 Overall Duration | – | 42.506 s | 43.855 s |
UL Procyon: AI Image Generation
The Procyon AI Image Generation Benchmark provides a consistent and accurate method for measuring AI inference performance across various hardware, ranging from low-power NPUs to high-end GPUs. It includes three tests: Stable Diffusion XL (FP16) for high-end GPUs, Stable Diffusion 1.5 (FP16) for moderately powerful GPUs, and Stable Diffusion 1.5 (INT8) for low-power devices. The benchmark uses the optimal inference engine for each system, ensuring fair and comparable results.
Starting with Stable Diffusion 1.5 (FP16), which focuses on moderately complex GPU inference workloads, the Pro Max 14 Premium achieved an overall score of 1,112, compared to 3,687 and 3,540 on the Plus models. The smaller system completed the full run in 89.88 seconds, generating images at a rate of 5.62 seconds per image. In contrast, the RTX PRO 5000-equipped systems produced images roughly three times faster at about 1.70 seconds per image. While the 14 Premium was not built to rival those results, its consistency across test iterations reinforced that Dell’s thermal management and driver optimization remain strong, even under sustained GPU workloads.
Moving to Stable Diffusion 1.5 (INT8), which represents a more efficiency-oriented test, the Pro Max 14 Premium performed admirably with an overall score of 11,830, compared to 44,101 and 39,329 on the 18 and 16 Plus models. It completed this test in 21.13 seconds, generating images every 2.61 seconds, showing clear benefits from quantized inference optimizations. This result underscores the balance between efficiency and responsiveness on the smaller model, making it well-suited for mobile AI applications where reduced power draw is preferred.
The Stable Diffusion XL (FP16) benchmark, the most demanding of the three, further emphasized the gap in high-end compute throughput. The Pro Max 14 Premium posted a score of 903, completing the run in 663.89 seconds at a rate of 41.49 seconds per image, while the RTX PRO 5000 systems finished in about 190–199 seconds and generated images in roughly 12 seconds each. Although the difference is substantial, this test is designed to stress high-end GPUs, and the 14 Premium’s ability to complete it reliably without stability issues reflects its robust engineering.
| UL Procyon: AI Image Generation | Dell Pro Max 14 Premium (Intel Core Ultra 9 285H) (NVIDIA RTX PRO 2000) | Dell Pro Max 18 Plus (Intel Core Ultra 9 285HX) (NVIDIA RTX PRO 5000) | Dell Pro Max 16 Plus (Intel Core Ultra 9 285HX) (NVIDIA RTX PRO 5000) |
| Stable Diffusion 1.5 (FP16) – Overall Score | 1,112 | 3,687 | 3,540 |
| Stable Diffusion 1.5 (FP16) – Overall Time | 89.883 s | 27.119 s | 28.245 s |
| Stable Diffusion 1.5 (FP16) – Image Generation Speed | 5.618 s/image | 1.695 s/image | 1.765 s/image |
| Stable Diffusion 1.5 (INT8) – Overall Score | 11,830 | 44,101 | 39,329 |
| Stable Diffusion 1.5 (INT8) – Overall Time | 21.132 s | 5.669 s | 6.356 s |
| Stable Diffusion 1.5 (INT8) – Image Generation Speed | 2.614 s/image | 0.709 s/image | 0.795 s/image |
| Stable Diffusion XL (FP16) – Overall Score | 903 | 3,170 | 3,017 |
| Stable Diffusion XL (FP16) – Overall Time | 663.886 s | 189.260 s | 198.869 s |
| Stable Diffusion XL (FP16) – Image Generation Speed | 41.493 s/image | 11.829 s/image | 12.429 s/image |
SPECworkstation 4
The SPECworkstation 4.0 benchmark is a comprehensive tool for evaluating all key aspects of workstation performance. It offers a real-world measure of CPU, graphics, accelerator, and disk performance, ensuring professionals have the data to make informed decisions about their hardware investments. The benchmark includes a dedicated set of tests focusing on AI and ML workloads, including data science tasks and ONNX runtime-based inference tests, reflecting the growing importance of AI/ML in workstation environments. It encompasses seven industry verticals and four hardware subsystems, providing a detailed and relevant measure of the performance of today’s workstations.
In the SPECworkstation 4.0 benchmark, the Dell Pro Max 14 Premium delivered balanced results that reflect its compact design and midrange GPU configuration. In AI & Machine Learning, it scored 1.77, compared to 2.48 on the Pro Max 18 Plus and 2.49 on the Pro Max 16 Plus. The Energy and Financial Services categories came in at 1.40 and 1.07, while the larger models reached 2.49/2.31 and 1.66/1.64, respectively.
In Life Sciences, the 14 Premium posted 1.65, narrowly ahead of the 18 Plus (1.50) but behind the 16 Plus (2.64). Media & Entertainment scored 1.64, compared to 2.66 and 2.23, while Product Design returned 1.28 against 2.35 and 2.39. Lastly, Productivity & Development measured 1.00, versus 1.35 and 1.37 on the larger workstations.
| SPECworkstation 4.0.0 (higher is better) | Dell Pro Max 14 Premium (Intel Core Ultra 9 285H) (NVIDIA RTX PRO 2000) | Dell Pro Max 18 Plus (Intel Core Ultra 9 285HX) (NVIDIA RTX PRO 5000) | Dell Pro Max 16 Plus (Intel Core Ultra 9 285HX) (NVIDIA RTX PRO 5000) |
| AI & Machine Learning | 1.77 | 2.48 | 2.49 |
| Energy | 1.40 | 2.49 | 2.31 |
| Financial Services | 1.07 | 1.66 | 1.64 |
| Life Sciences | 1.65 | 1.50 | 2.64 |
| Media & Entertainment | 1.64 | 2.66 | 2.23 |
| Product Design | 1.28 | 2.35 | 2.39 |
| Productivity & Development | 1.00 | 1.35 | 1.37 |
SPECviewperf 15
SPECviewperf 15 is the industry-standard benchmark for evaluating 3D graphics performance across OpenGL, DirectX, and Vulkan APIs. It introduces new workloads such as blender-01 (Blender 3.6), unreal_engine-01 (Unreal Engine 5.4, DirectX 12), and enscape-01 (Enscape 4.0, Vulkan ray tracing), along with updated traces for 3ds Max, CATIA, Creo, Maya, and Solidworks. With its redesigned GUI, modern application support, and advanced rendering workloads, SPECviewperf 15 provides consistent, real-world insights into professional graphics performance.
In the SPECviewperf 15 benchmark, the Dell Pro Max 14 Premium delivered strong mid-tier professional graphics performance, scaling well against the larger RTX PRO 5000-equipped systems. In 3dsmax-08, it scored 28.50, compared to 98.71 and 97.60 on the 18 Plus and 16 Plus models. In blender-01, the system reached 38.68, while the larger configurations achieved 83.23 and 79.46.
The catia-07 and creo-04 tests showed the 14 Premium at 48.64 and 121.82, versus 113.18/107.91 and 247.79/238.60, respectively, while energy-04 measured 58.10, compared to 170.27 and 161.60. In enscape-01, which leverages Vulkan ray tracing, the 14 Premium reached 29.44, trailing the Plus systems at 86.70 and 84.84.
For content creation and visualization tasks, maya-07 and medical-04 scored 112.22 and 105.84, respectively, which is roughly half of the 18 Plus results (232.48 and 210.51). Solidworks-08 scored 64.01, versus 145.56 and 143.13, while unreal_engine-01 registered 56.10, compared to 93.46 and 87.22.
| SPECviewperf (higher is better) | Dell Pro Max 14 Premium (Intel Core Ultra 9 285H) (NVIDIA RTX PRO 2000) | Dell Pro Max 18 Plus (Intel Core Ultra 9 285HX) (NVIDIA RTX PRO 5000) | Dell Pro Max 16 Plus (Intel Core Ultra 9 285HX) (NVIDIA RTX PRO 5000) |
| 3dsmax-08 | 28.50 | 98.71 | 97.60 |
| blender-01 | 38.68 | 83.23 | 79.46 |
| catia-07 | 48.64 | 113.18 | 107.91 |
| creo-04 | 121.82 | 247.79 | 238.60 |
| energy-04 | 58.10 | 170.27 | 161.60 |
| enscape-01 | 29.44 | 86.70 | 84.84 |
| maya-07 | 112.22 | 232.48 | 224.80 |
| medical-04 | 105.84 | 210.51 | 206.08 |
| solidworks-08 | 64.01 | 145.56 | 143.13 |
| unreal_engine-01 | 56.10 | 93.46 | 87.22 |
LuxMark
LuxMark is a GPU benchmark that utilizes LuxRender, an open-source ray-tracing renderer, to evaluate a system’s performance in handling highly detailed 3D scenes. This benchmark is relevant for assessing the graphical rendering capabilities of servers and workstations, especially for visual effects and architectural visualization applications, where accurate light simulation is crucial.
In LuxMark, the gap between the RTX PRO 2000 and RTX PRO 5000 lines up with their power and memory budgets. The Dell Pro Max 14 Premium with RTX PRO 2000 (about 45 W TGP, 8GB VRAM) scored 15,278 in Hallbench and 5,488 in Food. The Pro Max 18 Plus and 16 Plus, both equipped with RTX PRO 5000 GPUs (approximately 95 W TGP, 24GB VRAM), achieved scores of around 29,605/29,019 in Hallbench and 13,042/12,684 in Food. That works out to roughly 1.9x uplift in Hallbench and 2.3–2.4x in Food. Hallbench is compute-heavy and scales cleanly with the higher sustained clocks you get from the 95 W envelope. Food tends to be more memory sensitive, where 24GB of VRAM helps keep larger textures, BVH data, and ray queues on-GPU more often, reducing stalls and boosting throughput. The 2000s 8GB limit and lower TGP constrain long ray-trace passes under load, which shows up as the wider gap in Food.
| LuxMark (higher is better) | Dell Pro Max 14 Premium (Intel Core Ultra 9 285H) (NVIDIA RTX PRO 2000) | Dell Pro Max 18 Plus (Intel Core Ultra 9 285HX) (NVIDIA RTX PRO 5000) | Dell Pro Max 16 Plus (Intel Core Ultra 9 285HX)(NVIDIA RTX PRO 5000) |
| Hallbench | 15,278 | 29,605 | 29,019 |
| Food | 5,488 | 13,042 | 12,684 |
7-Zip Compression
The 7-Zip Compression Benchmark evaluates CPU performance during compression and decompression tasks, measuring ratings in GIPS (Giga Instructions Per Second) and CPU usage. Higher GIPS and efficient CPU usage indicate superior performance.
In the 7-Zip Compression Benchmark, the Dell Pro Max 14 Premium performed consistently within its design limits, delivering solid throughput for a compact workstation. Focusing on the resulting rating values, the 14 Premium achieved 102.85 GIPS in compression and 89.62 GIPS in decompression, which combine for a total resulting rating of 96.23 GIPS.
By comparison, the Pro Max 18 Plus and Pro Max 16 Plus reached 137.46 GIPS / 163.15 GIPS and 115.53 GIPS / 155.80 GIPS, respectively, producing total scores of 150.30 GIPS and 135.67 GIPS.
| 7-Zip Compression Benchmark (higher is better) | Dell Pro Max 14 Premium (Intel Core Ultra 9 285H)(NVIDIA RTX PRO 2000) | Dell Pro Max 18 Plus (Intel Core Ultra 9 285HX) (NVIDIA RTX PRO 5000) | Dell Pro Max 16 Plus (Intel Core Ultra 9 285HX) (NVIDIA RTX PRO 5000) | ||
| Compression | |||||
| Current CPU Usage | 1,355% | 1,905% | 1,799% | ||
| Current Rating/Usage | 7.824 GIPS | 7.275 GIPS | 6.252 GIPS | ||
| Current Rating | 105.987 GIPS | 138.244 GIPS | 110.594 GIPS | ||
| Resulting CPU Usage | 1,301% | 1,891% | 1,805% | ||
| Resulting Rating/Usage | 7.908 GIPS | 7.270 GIPS | 6.399 GIPS | ||
| Resulting Rating | 102.845 GIPS | 137.459 GIPS | 115.536 GIPS | ||
| Decompression | |||||
| Current CPU Usage | 1,275% | 2,226% | 2,187% | ||
| Current Rating/Usage | 7.108 GIPS | 7.175 GIPS | 7.229 GIPS | ||
| Current Rating | 90.621 GIPS | 159.735 GIPS | 158.102 GIPS | ||
| Resulting CPU Usage | 1,248% | 2,242% | 2,202% | ||
| Resulting Rating/Usage | 7.185 GIPS | 7.276 GIPS | 7.074 GIPS | ||
| Resulting Rating | 89.621 GIPS | 163.149 GIPS | 155.801 GIPS | ||
| Total Rating | |||||
| Total CPU Usage | 1,274% | 2,067% | 2,004% | ||
| Total Rating/Usage | 7.547 GIPS | 7.273 GIPS | 6.737 GIPS | ||
| Total Rating | 96.233 GIPS | 150.304 GIPS | 135.669 GIPS | ||
Blackmagic RAW Speed Test
The Blackmagic RAW Speed Test is a performance benchmarking tool that measures a system’s capabilities for handling video playback and editing using the Blackmagic RAW codec. It evaluates how well a system can decode and play back high-resolution video files, providing frame rates for both CPU- and GPU-based processing.
In the Blackmagic RAW Speed Test, the Dell Pro Max 14 Premium delivered respectable results for its smaller form factor and lower-power GPU. Using CPU-based decoding, the system achieved 64 fps in the 8K test, while the Pro Max 18 Plus and Pro Max 16 Plus nearly doubled that performance at 128 fps and 130 fps, respectively.
When leveraging GPU acceleration via OpenCL, the 14 Premium reached 112 fps, compared to 168 fps and 184 fps on the RTX PRO 5000-equipped models.
| Blackmagic RAW Speed Test | Dell Pro Max 14 Premium (Intel Core Ultra 9 285H) (NVIDIA RTX PRO 2000) | Dell Pro Max 18 Plus (Intel Core Ultra 9 285HX) (NVIDIA RTX PRO 5000) | Dell Pro Max 16 Plus (Intel Core Ultra 9 285HX) (NVIDIA RTX PRO 5000) |
|---|---|---|---|
| 8K CPU | 64 | 128 | 130 |
| 8K OPENCL | 112 | 168 | 184 |
Blackmagic Disk Speed Test
The Blackmagic Disk Speed Test evaluates storage performance by measuring read and write speeds, providing insights into a system’s ability to handle data-intensive tasks, such as video editing and large file transfers.
In the Blackmagic Disk Speed Test, the Dell Pro Max 14 Premium delivered solid storage performance with 4,268.8MB/s read and 5,000.7 MB/s write. These results indicate strong throughput for handling demanding workflows such as high-resolution video editing and large file transfers.
The Pro Max 18 Plus posted 7,776.1MB/s read and 6,022.0 MB/s write, while the Pro Max 16 Plus followed closely with 7,755.6MB/s read and 5,734.7MB/s write. The higher figures from the larger systems reflect their faster internal storage configurations.
| Disk Speed Test (higher is better) | Dell Pro Max 14 Premium (Intel Core Ultra 9 285H) (NVIDIA RTX PRO 2000) | Dell Pro Max 18 Plus (Intel Core Ultra 9 285HX) (NVIDIA RTX PRO 5000) | Dell Pro Max 16 Plus (Intel Core Ultra 9 285HX) (NVIDIA RTX PRO 5000) |
| Read | 4,268.8MB/s | 7,776.1MB/s | 7,755.6MB/s |
| Write | 5,000.7MB/s | 6,022.0MB/s | 5,734.7MB/s |
Blender 4.5
Blender is an open-source 3D modeling application. This benchmark was run using the Blender Benchmark utility. The score is measured in samples per minute, with higher values indicating better performance.
In CPU rendering, the 14 Premium produced 105.8 samples per minute in Monster, 69.1 in Junkshop, and 49.2 in Classroom. The Pro Max 18 Plus led the group with 237.1, 150.7, and 94.5, while the 16 Plus followed with 208.5, 131.2, and 92.3. These results highlight the benefits of higher sustained power and additional cores in the larger models. However, the 14 Premium still provides stable multithreaded rendering performance suitable for modeling, simulation, or preview work.
| Blender CPU (samples per minute, higher is better) | Dell Pro Max 14 Premium (Intel Core Ultra 9 285H) (NVIDIA RTX PRO 2000) | Dell Pro Max 18 Plus (Intel Core Ultra 9 285HX) (NVIDIA RTX PRO 5000) | Dell Pro Max 16 Plus (Intel Core Ultra 9 285HX) (NVIDIA RTX PRO 5000) |
| Monster | 105.8 | 237.1 | 208.48 |
| Junkshop | 69.1 | 150.7 | 131.17 |
| Classroom | 49.2 | 94.5 | 92.26 |
In GPU rendering, powered by the RTX PRO 2000, the 14 Premium reached 1,394.7 samples per minute in Monster, 859.3 in Junkshop, and 755.5 in Classroom. The RTX PRO 5000 systems achieved significantly higher scaling, with the 18 Plus and 16 Plus models delivering approximately 3,900–2,100 samples per minute across the same scenes. This nearly 2.5–3x increase demonstrates how the 5000s’ additional CUDA cores, VRAM, and higher power headroom accelerate complex ray-traced workloads.
| Blender GPU (samples per minute, higher is better) | Dell Pro Max 14 Premium (Intel Core Ultra 9 285H) (NVIDIA RTX PRO 2000) | Dell Pro Max 18 Plus (Intel Core Ultra 9 285HX) (NVIDIA RTX PRO 5000) | Dell Pro Max 16 Plus (Intel Core Ultra 9 285HX) (NVIDIA RTX PRO 5000) |
| Monster | 1,394.7 | 3,928.6 | 3,875.04 |
| Junkshop | 859.3 | 2150.1 | 2,149.53 |
| Classroom | 755.5 | 2010.2 | 2000.89 |
y-cruncher
y-cruncher is a multithreaded and scalable program that can compute Pi and other mathematical constants to trillions of digits. Since its launch in 2009, it has become a popular benchmarking and stress-testing application for overclockers and hardware enthusiasts.
In the y-cruncher benchmark, the Dell Pro Max 14 Premium delivered reliable compute performance that reflects its lower power envelope and compact design. The system completed the 1 billion digit computation in 37.88 seconds, scaling to 110.79 seconds for 2.5 billion, 243.55 seconds for 5 billion, and 539.17 seconds for 10 billion.
The Pro Max 18 Plus and Pro Max 16 Plus systems, powered by the higher-wattage Intel Core Ultra 9 285HX, were considerably faster, finishing the same tests in 20.08 / 22.78 seconds (1 billion), 59.23 / 64.21 seconds (2.5 billion), 142.82 / 150.62 seconds (5 billion), and 311.81 / 332.90 seconds (10 billion).
| Y-Cruncher (Total Computation Time) | Dell Pro Max 14 Premium (Intel Core Ultra 9 285H)(NVIDIA RTX PRO 2000) | Dell Pro Max 18 Plus (Intel Core Ultra 9 285HX)(NVIDIA RTX PRO 5000) | Dell Pro Max 16 Plus (Intel Core Ultra 9 285HX)(NVIDIA RTX PRO 5000) |
|---|---|---|---|
| 1 Billion | 37.877 s | 20.081 s | 22.782 s |
| 2.5 Billion | 110.787 s | 59.228 s | 64.209 s |
| 5 Billion | 243.553 s | 142.822 s | 150.615 s |
| 10 Billion | 539.174 s | 311.805 s | 332.901 s |
Geekbench 6
Geekbench 6 is a cross-platform benchmark that measures overall system performance.
In the Geekbench 6 benchmark, the Dell Pro Max 14 Premium produced well-balanced results that highlight its efficiency-focused design. In the CPU single-core test, it scored 2,841, just behind the Pro Max 18 Plus (2,977) and Pro Max 16 Plus (3,032), showing that the smaller system delivers nearly identical per-core responsiveness for general workloads.
In multi-core performance, the 14 Premium reached 16,732, compared to 20,717 and 20,978 on the HX-based models. The roughly 20% gap reflects the higher sustained power and additional performance cores available in the larger workstations, though the 14 Premium still maintains strong throughput for a mobile form factor.
The most significant difference appeared in the GPU OpenCL test, where the RTX PRO 2000 scored 99,633, while the RTX PRO 5000 configurations achieved 240,530 and 245,286. This aligns with expectations based on CUDA core count, VRAM capacity, and TDP scaling.
| Geekbench 6 (higher is better) | Dell Pro Max 14 Premium (Intel Core Ultra 9 285H) (NVIDIA RTX PRO 2000) | Dell Pro Max 18 Plus (Intel Core Ultra 9 285HX) (NVIDIA RTX PRO 5000) | Dell Pro Max 16 Plus (Intel Core Ultra 9 285HX) (NVIDIA RTX PRO 5000) |
|---|---|---|---|
| CPU Single-Core | 2,841 | 2,977 | 3,032 |
| CPU Multi-Core | 16,732 | 20,717 | 20,978 |
| GPU OpenCL | 99,633 | 240,530 | 245,286 |
V-Ray
The V-Ray Benchmark measures rendering performance for CPUs, NVIDIA GPUs, or both using advanced V-Ray 6 engines. It uses quick tests and a simple scoring system to let users evaluate and compare their systems’ rendering capabilities. It’s an essential tool for professionals seeking efficient performance insights.
In the V-Ray Benchmark, the Dell Pro Max 14 Premium delivered a score of 3,186, reflecting solid rendering performance for a compact workstation powered by the RTX PRO 2000. The larger Pro Max 18 Plus and Pro Max 16 Plus, both equipped with the more powerful RTX PRO 5000, scored 8,191 and 7,804, respectively—showing roughly a 2.5x performance advantage that aligns with the difference in GPU power, CUDA core count, and thermal headroom.
| Vray (higher is better) | Dell Pro Max 14 Premium (Intel Core Ultra 9 285H) (NVIDIA RTX PRO 2000) | Dell Pro Max 18 Plus (Intel Core Ultra 9 285HX) (NVIDIA RTX PRO 5000) | Dell Pro Max 16 Plus (Intel Core Ultra 9 285HX) (NVIDIA RTX PRO 5000) |
|---|---|---|---|
| Score | 3,186 | 8,191 | 7,804 |
Topaz Video AI
Topaz Video AI is a professional application for enhancing and restoring video using advanced AI models. It supports various tasks, including upscaling footage to 4K or 8K, sharpening blurry content, reducing noise, enhancing facial details, colorizing black-and-white footage, and interpolating frames for smoother motion. The suite includes an onboard benchmark that measures system performance across its different video-enhancing algorithms, giving a clear view of how well hardware platforms handle demanding AI video processing workloads.
In the Topaz Video AI Benchmark, the Dell Pro Max 14 Premium delivered respectable results for its size and hardware configuration, showcasing how the RTX PRO 2000 can handle professional AI video enhancement tasks, though with apparent scaling differences compared to the RTX PRO 5000 systems in the Pro Max 18 Plus and Pro Max 16 Plus.
Across the test suite, the Pro Max 14 Premium managed playback rates between 2 and 11 fps in most AI models, depending on the workload intensity and upscaling factor. In the Artemis model, designed for general video restoration, the 14 Premium achieved 5.56 fps (1X), 2.48 fps (2X), and 0.99 fps (4X), while the 18 Plus reached 31.10 / 16.94 / 4.22 fps, and the 16 Plus followed closely behind. With Iris and Proteus, which emphasize fine detail recovery, the 14 Premium ranged from 3–11 fps, compared to roughly 16–28 fps on the higher-end systems.
Heavier models like Gaia and Nyx, which are optimized for extreme upscaling and noise reduction, ran at lower frame rates on the RTX PRO 2000, typically around 2–3 fps, while the 5000-class GPUs handled the same workloads at 5–38 fps, depending on model complexity. Lighter operations such as Aion, APFast, and Chronos showed more parity, with the 14 Premium achieving 25.15 / 20.53 / 3.44 fps, while the 18 Plus reached 25.06 / 43.90 / 20.43 fps.
| Topaz Video AI Benchmark (Frames per second, higher is better) | Dell Pro Max 14 Premium (Intel Core Ultra 9 285H) (NVIDIA RTX PRO 2000) | Dell Pro Max 18 Plus (Intel Core Ultra 9 285HX) (NVIDIA RTX PRO 5000) | Dell Pro Max 16 Plus (Intel Core Ultra 9 285HX) (NVIDIA RTX PRO 5000) | ||||||
|---|---|---|---|---|---|---|---|---|---|
| Model | 1X | 2X | 4X | 1X | 2X | 4X | 1X | 2X | 4X |
| Artemis | 5.56 | 2.48 | 0.99 | 31.10 | 16.94 | 4.22 | 29.50 | 12.34 | 3.36 |
| Iris | 6.65 | 3.46 | 2.94 | 27.77 | 16.07 | 4.16 | 27.25 | 4.40 | 3.74 |
| Proteus | 6.73 | 11.41 | 3.03 | 28.56 | 18.70 | 4.70 | 27.34 | 16.92 | 4.66 |
| Gaia | 2.97 | 1.83 | 0.42 | 38.53 | 5.88 | 4.27 | 7.85 | 5.61 | 3.91 |
| Nyx | 2.50 | 1.93 | – | 0.86 | – | – | 7.86 | – | – |
| Nyx Fast | 5.07 | – | – | 19.64 | – | – | 18.31 | – | – |
| Rhea | – | – | – | – | – | 3.20 | – | – | 3.14 |
| RXL | – | – | – | – | – | 3.06 | – | – | 3.03 |
| Hyperion HDR | 10.99 | – | – | 19.39 | – | – | 19.12 | – | – |
| Apollo | 7.50 | – | – | 33.49 | – | – | 33.14 | – | – |
| Aion | 25.15 | – | – | 25.06 | – | – | 24.35 | – | – |
| APFast | 20.53 | – | – | 43.90 | – | – | 59.29 | – | – |
| Chronos | 3.44 | – | – | 20.43 | – | – | 19.92 | – | – |
| CHFast | 5.75 | – | – | 30.88 | – | – | 27.82 | – | – |
PCMark 10
PCMark 10 is an industry-standard benchmark designed to measure complete system performance for modern office environments. It features updated workloads for Windows 10, evaluating everyday tasks such as productivity, web browsing, video conferencing, and content creation. The benchmark is easy to run, delivers multi-level scoring (from high-level overall to detailed workload scores), and includes dedicated battery life and storage tests. While UL Solutions now recommends Procyon for newer, application-based testing, PCMark 10 remains a reliable and widely used tool for assessing general PC performance.
In the PCMark 10 benchmark, the Dell Pro Max 14 Premium achieved a score of 7,190, reflecting strong all-around performance for daily productivity and office workloads. The Pro Max 18 Plus and Pro Max 16 Plus scored 8,581 and 8,471.
| PCMark 10 (higher is better) | Dell Pro Max 14 Premium (Intel Core Ultra 9 285H) (NVIDIA RTX PRO 2000) | Dell Pro Max 18 Plus (Intel Core Ultra 9 285HX) (NVIDIA RTX PRO 5000) | Dell Pro Max 16 Plus (Intel Core Ultra 9 285HX) (NVIDIA RTX PRO 5000) |
|---|---|---|---|
| Score | 7,190 | 8,581 | 8,471 |
3DMark CPU
The 3DMark CPU Profile evaluates processor performance across six threading levels: 1, 2, 4, 8, 16, and max threads. Each test runs the same boid-based simulation workload to assess how well the CPU scales under different thread counts, with minimal GPU involvement. The benchmark helps identify single-thread efficiency as well as multithreaded potential for tasks like gaming, content creation, and rendering. Scores at eight threads often align with modern DirectX 12 gaming performance, while 1–4 thread results reflect older or esports game scenarios.
In the 3DMark CPU Profile, the Dell Pro Max 14 Premium showed strong scaling across all thread counts, balancing single-thread efficiency with solid multithreaded performance for its power class.
At the max threads level, it scored 11,214, compared to 16,497 and 16,832 on the Pro Max 18 Plus and Pro Max 16 Plus, respectively. The difference reflects the higher sustained power and additional cores available in the larger systems. At 16 threads, the 14 Premium posted 10,536, while the Plus models reached 13,224 and 13,658. At eight threads, which typically aligns with gaming and moderate multitasking workloads, the 14 Premium scored 7,010, close to 7,658, and 9,028 on the higher-end units.
The lower thread scores remained tightly grouped across all systems, with 4-thread results of 4,388, 4,583, and 4,799, and 1-thread results of 1,198, 1,234, and 1,263, showing near-identical single-core responsiveness.
| 3DMark CPU Profile (higher is better) | Dell Pro Max 14 Premium (Intel Core Ultra 9 285H) (NVIDIA RTX PRO 2000) | Dell Pro Max 18 Plus (Intel Core Ultra 9 285HX) (NVIDIA RTX PRO 5000) | Dell Pro Max 16 Plus (Intel Core Ultra 9 285HX) (NVIDIA RTX PRO 5000) |
|---|---|---|---|
| Max Threads | 11,214 | 16,497 | 16,832 |
| 16 Threads | 10,536 | 13,224 | 13,658 |
| 8 Threads | 7,010 | 7,658 | 9,028 |
| 4 threads | 4,388 | 4,583 | 4,799 |
| 2 threads | 2,309 | 2,435 | 2,464 |
| 1 threads | 1,198 | 1,234 | 1,263 |
3DMark Storage
The 3DMark Storage Benchmark tests your SSD’s gaming performance by measuring tasks like loading games, saving progress, installing game files, and recording gameplay. It evaluates how well your storage handles real-world gaming activities and supports the latest storage technologies for accurate performance insights.
In the 3DMark Storage Benchmark, all three systems performed closely, showing minimal variance in real-world gaming and file-handling tasks. The Dell Pro Max 14 Premium scored 2,174, nearly matching the Pro Max 16 Plus at 2,172, while the Pro Max 18 Plus edged slightly ahead with 2,368.
| 3DMark Storage (higher is better) | Dell Pro Max 14 Premium (Intel Core Ultra 9 285H) (NVIDIA RTX PRO 2000) | Dell Pro Max 18 Plus (Intel Core Ultra 9 285HX) (NVIDIA RTX PRO 5000) | Dell Pro Max 16 Plus (Intel Core Ultra 9 285HX) (NVIDIA RTX PRO 5000) |
|---|---|---|---|
| Score | 2,174 | 2,368 | 2,172 |
PCMark battery
To measure the battery life of mobile systems, we leverage PCMark 10. It includes a Modern Office benchmark, providing a realistic assessment of battery life during typical workday tasks. It simulates everyday office activities, such as writing documents, browsing the web, and participating in video conferences, with built-in periods of inactivity to mirror how people use their laptops. This isn’t just about peak performance; it focuses on sustained usage under a moderate workload. It helps you understand how long you can expect a laptop to last through a day of office work.
The test operates in 10-minute cycles, balancing active tasks with periods of inactivity. Specifically, the Writing and Web Browsing workloads involve roughly 4.5 minutes of activity followed by 5.5 minutes of inactivity, while Video Conferencing is lighter, at 2 minutes of busy time and 8 minutes of idle time. This approach provides a more accurate representation of real-world battery drain than running demanding tasks continuously, giving you a better idea of longevity for everyday productivity.
Battery life is where the Pro Max 14 Premium truly excels compared to the larger Pro Max models, providing several more hours of uninterrupted use. While ultraportable non-workstation laptops would offer superior runtime, their performance is nowhere near as potent as that of the Pro Max 14 Premium.
| PCMark Battery (higher is better) | Dell Pro Max 14 Premium (Intel Core Ultra 9 285HX) (NVIDIA RTX PRO 2000) | Dell Pro Max 18 Plus (Intel Core Ultra 9 285HX) (NVIDIA RTX PRO 5000) | Dell Pro Max 16 Plus (Intel Core Ultra 9 285HX) (NVIDIA RTX PRO 5000) |
|---|---|---|---|
| Time Elapsed | 8 Hr 29 Min | 3 Hr 39 Min | 6 Hr 21 Min |
Final Thoughts
Dell’s Pro Max 14 Premium lands in a sweet spot for mobile creators and engineers who need real workstation tools in a 14-inch footprint. With Core Ultra H silicon, RTX PRO 2000, 8GB VRAM, and up to 64GB LPDDR5X, it handles AI inference, viewport work, and mixed media tasks predictably, then settles down to quiet thermals in day-to-day use. The Tandem OLED option is a standout for color work with true 100% DCI-P3 and inky blacks, although the IPS panel will deliver better battery endurance. ISV certifications, optional vPro Enterprise, and Control Vault 3 round out a business-ready platform, supported by Wi-Fi 7, two Thunderbolt 5 ports, two Thunderbolt 4 ports, and a standard three-year onsite warranty.
The trade-offs are clear. Memory is soldered, and there is only one M.2 slot. There is no built-in mobile broadband, and the all-USB-C port mix will push many buyers to a dock. The zero lattice keyboard types well after a short adjustment period, but the arrow cluster and Fn layer choices are not ideal for everyone. Battery life is not ultrabook class, yet it meaningfully outlasts the larger Pro Max 16 Plus and 18 Plus systems in our testing, which matters if you spend time away from power.
If your workflows lean on heavy GPU rendering, massive LLM throughput, or large texture sets, the 16 Plus and 18 Plus with RTX PRO 5000 will finish jobs faster. If you value balance, portability, an excellent OLED, and enterprise features without hauling a 16 or 18-inch chassis, the Pro Max 14 Premium is the right pick. It is a compact, well-built mobile workstation that earns its name with consistent performance and quality build.


 Amazon