

Dell’s Pro Max lineup features its highest-performing models, with screen sizes ranging from 14 to 18 inches. The base models (non-Plus/Premium) emphasize value, while Plus models focus on performance, and Premium models combine style and performance in the most portable designs. The Pro Max 16 Premium reviewed here targets business professionals and power users who need to combine high performance with mobility.
The Pro Max 16 Premium offers an OLED screen and Intel Core Ultra 2 Series H-class CPUs.
Key features for this 16-inch mobile workstation include an available OLED touch display, desktop-grade performance with its Core Ultra 2 H-class processors up to the Core Ultra 9 285H, and available NVIDIA RTX PRO 1000, RTX PRO 2000, and RTX PRO 3000 “Blackwell” series professional GPUs. ISV certifications for professional apps are included, as is Dell’s security suite, including Intel vPro Enterprise (with select CPUs) and Control Vault 3.
Of note, the base model only includes Intel Arc 140T integrated graphics, which doesn’t qualify it as a workstation. However, this laptop is significantly more potent than the Dell Pro 16 and Pro Plus 16, making it a better choice for those seeking enhanced performance.
Dell Pro Max 16 Premium Specifications
| Processor |
|
| Operating System |
|
| Memory | 16/32/64GB of LPDDR5X-8400 |
| Graphics Card |
|
| Storage | 2x M.2 SSD |
| Display |
|
| Camera | 8MP IR |
| Ports | 2x Thunderbolt 5, Thunderbolt 4, HDMI 2.1 audio, SD card reader |
| Wireless Networking | Intel Wi-Fi 7 BE201, with or without Bluetooth 5.4 |
| Battery | 6-cell 96Whr |
| Power Adapter | 100W or 165W |
| Security Features |
|
| Dimensions and Weight |
|
| Warranty | Standard three years, next business day onsite repair |
Build and Design
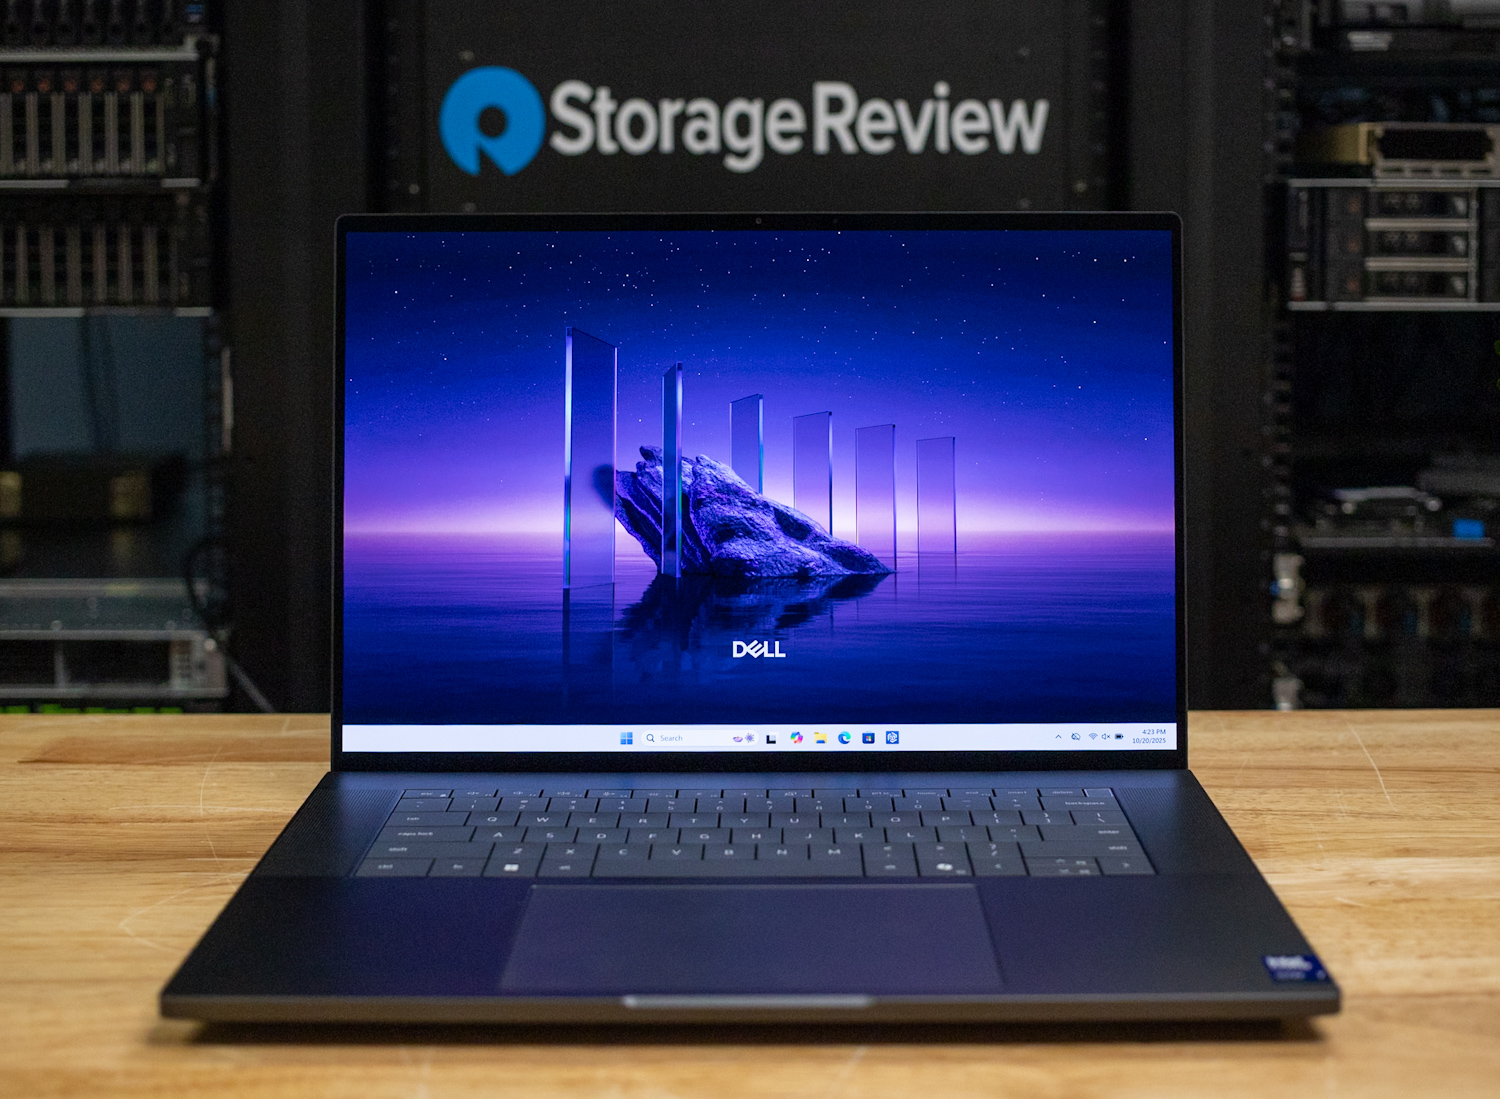
Dell models with a Premium designation offer the highest standard of build quality. The Pro Max 16 Premium leaves no doubt it’s worthy of the name, constructed from metal top and bottom. The chassis is as sturdy as they come, exhibiting no flex and perfectly smooth edges. Branding is minimal, with only a Dell logo on the lid. This laptop would look acceptable in any professional environment.
The Pro Max 16 Premium offers a stylish metal design with excellent strength.
Measuring 0.8 x 13.93 x 9.46 inches, the Pro Max 16 Premium occupies about as small a footprint as its 16:10 screen allows. While it’s not lightweight—the minimum configuration weighs 4.82 pounds—the performance it delivers is commendable. Dell’s Pro Plus 16 laptop, for example, is less powerful and weighs 4.06 pounds.
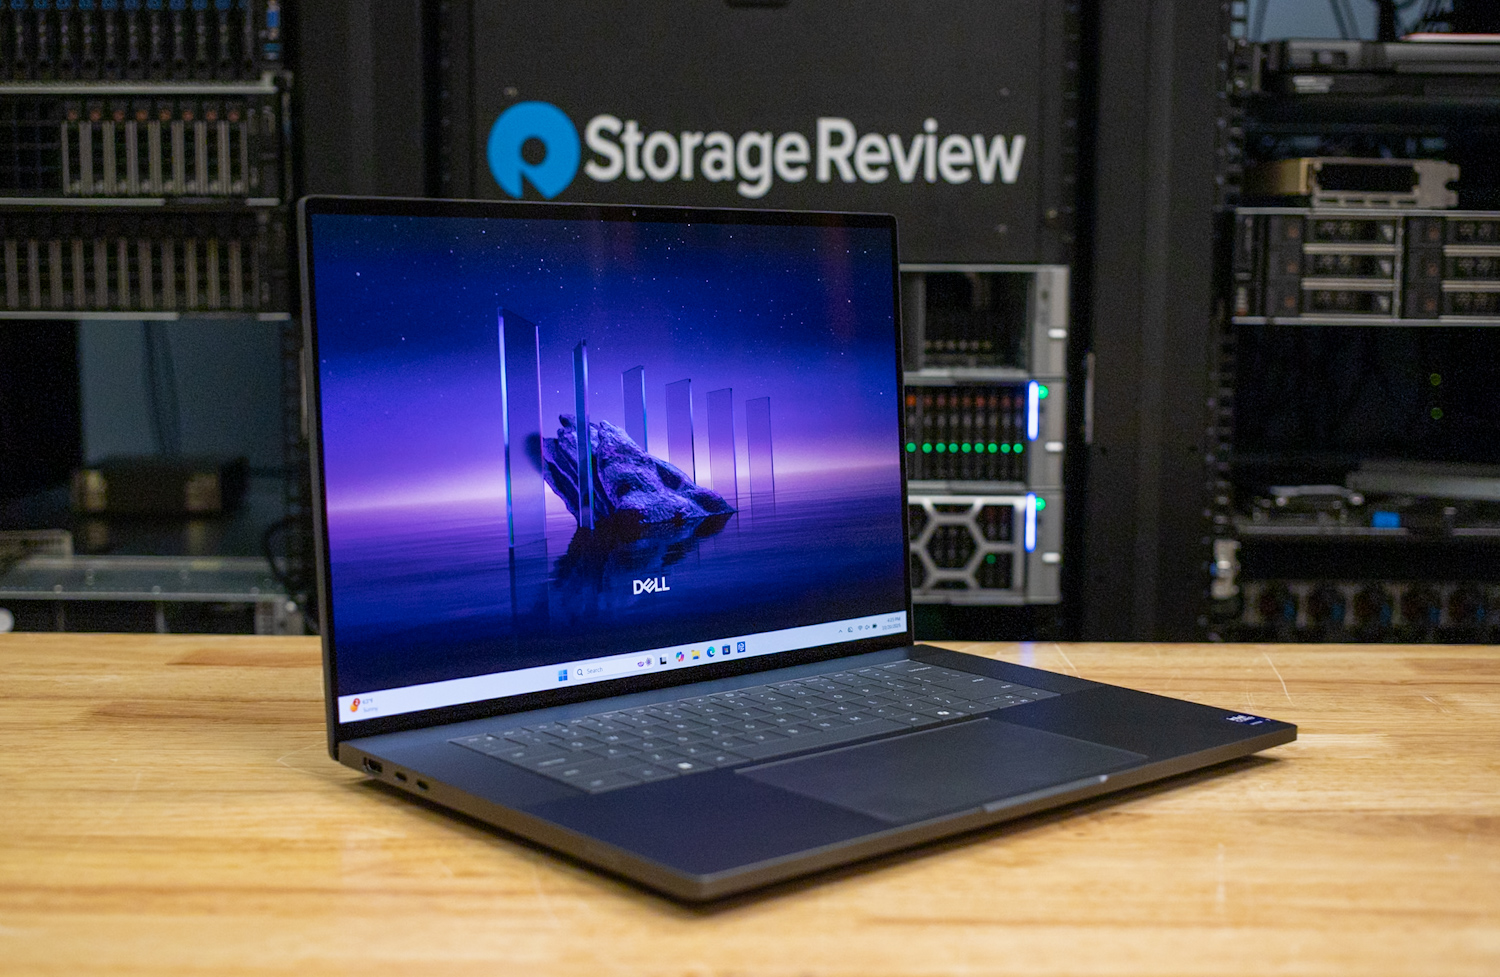
The port selection includes two Thunderbolt 5 (USB-C) ports on the left edge and a Thunderbolt 4 (USB-C) on the right. There’s also an HDMI 2.1 video output, an audio jack, and a full-size SD card reader. The lack of USB-A is notable and still a sore point given the proliferation of devices that use that standard, though Dell offers USB-C-to-USB-A adapters at minimal cost. (You’ll need to remember to take them with you, of course.)

Ports on the right include an SD card reader, a Thunderbolt 4 (USB-C) port, an audio port, and a Wedge lock slot.

The right ports include two Thunderbolt 5 (USB-C) ports and an HDMI 2.1 output.
The included power adapter (100 watts for the integrated GPU or 165 watts for the discrete GPU) connects to any USB-C port. The right-side wedge lock slot adds a layer of physical security.
Networking includes a standard Intel BE201 card supporting Wi-Fi 7 and Bluetooth 5.4. WWAN is not an option on this laptop or the Pro Max 14 Premium; however, it is available in the Plus models.
Screen
The Pro Max 16 Premium uses a 16-inch screen with a 16:10 aspect ratio in modern fashion. The 1920×1200 base screen uses IPS technology, features 500 nits of brightness, a 120Hz variable refresh rate, and claims 100% sRGB coverage. In other words, it should be a solid option for most buyers, particularly in businesses where standard resolutions are more important.
More ambitious users can step up to the 3840×2400 Tandem OLED screen as seen on our review unit, which has superior picture quality. The OLED panel boasts an impressive brightness rating of 500 nits, which is significantly higher than the typical 400 nits for most displays. It offers 100% DCI-P3 color coverage, ensuring that visuals are vibrant and well-saturated, whether you’re working on documents or watching movies. Additionally, the panel features touch capability and a 120Hz Variable Refresh Rate (VRR). While battery life may not be its strongest suit, the display’s performance is difficult to criticize.
The 8MP webcam delivers solid image quality with effective grain reduction in low light. It features an IR sensor for biometric capability with Windows Hello. However, it doesn’t have a privacy shutter or an e-shutter.

The 8MP IR webcam delivers a sharp, well-balanced picture and biometric capabilities.
Input Devices
The Pro Max 16 Premium shares its keyboard with the Pro Max 14 Premium, so I’ll echo much of what was conveyed in that review. It offers satisfying tactile feedback, with no flex and plenty of cushion at the bottom of the keystroke. The lack of spacing between the keys—Dell calls this a zero-lattice design—required some adjustment on my part, as my fingers initially had trouble finding the bars on the F and J keys, but I eventually adapted. The white mini-LED backlighting contrasts nicely with the dark gray keys. The typeface is large and easy to read.
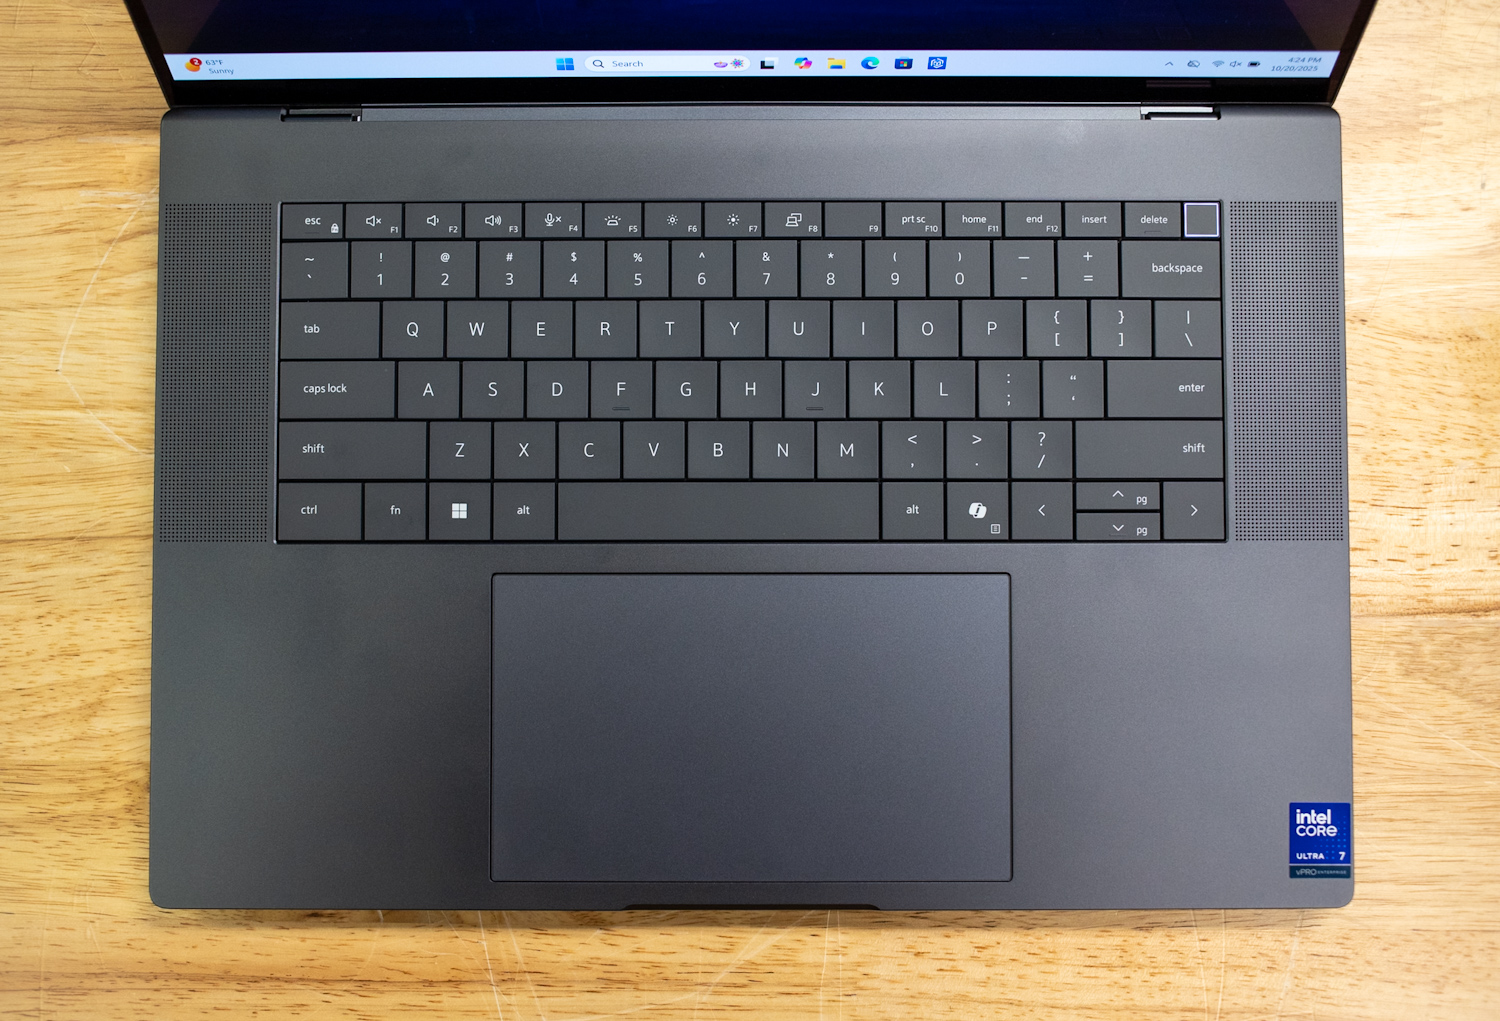
The zero-lattice keyboard features minimal key spacing and mini-LED backlighting.
Layout challenges include an unintuitive arrow key cluster that pairs half-height up/down keys with full-size left/right keys. And while the keyboard features dedicated Home and End keys on the top row, these keys become secondary functions when Fn-Lock is enabled, making the F1-F12 keys primary and requiring the Fn key to access them. As an avid touch typist, I found this setup counterintuitive because I couldn’t use F1-F12 or the Home and End keys without pressing Fn for either set. Biometric features include a fingerprint reader built into the power button.
At least Dell nailed the touchpad, which contains no moving parts. Instead, it uses small haptic motors to simulate feedback. The pad’s large size complements the 16-inch screen.
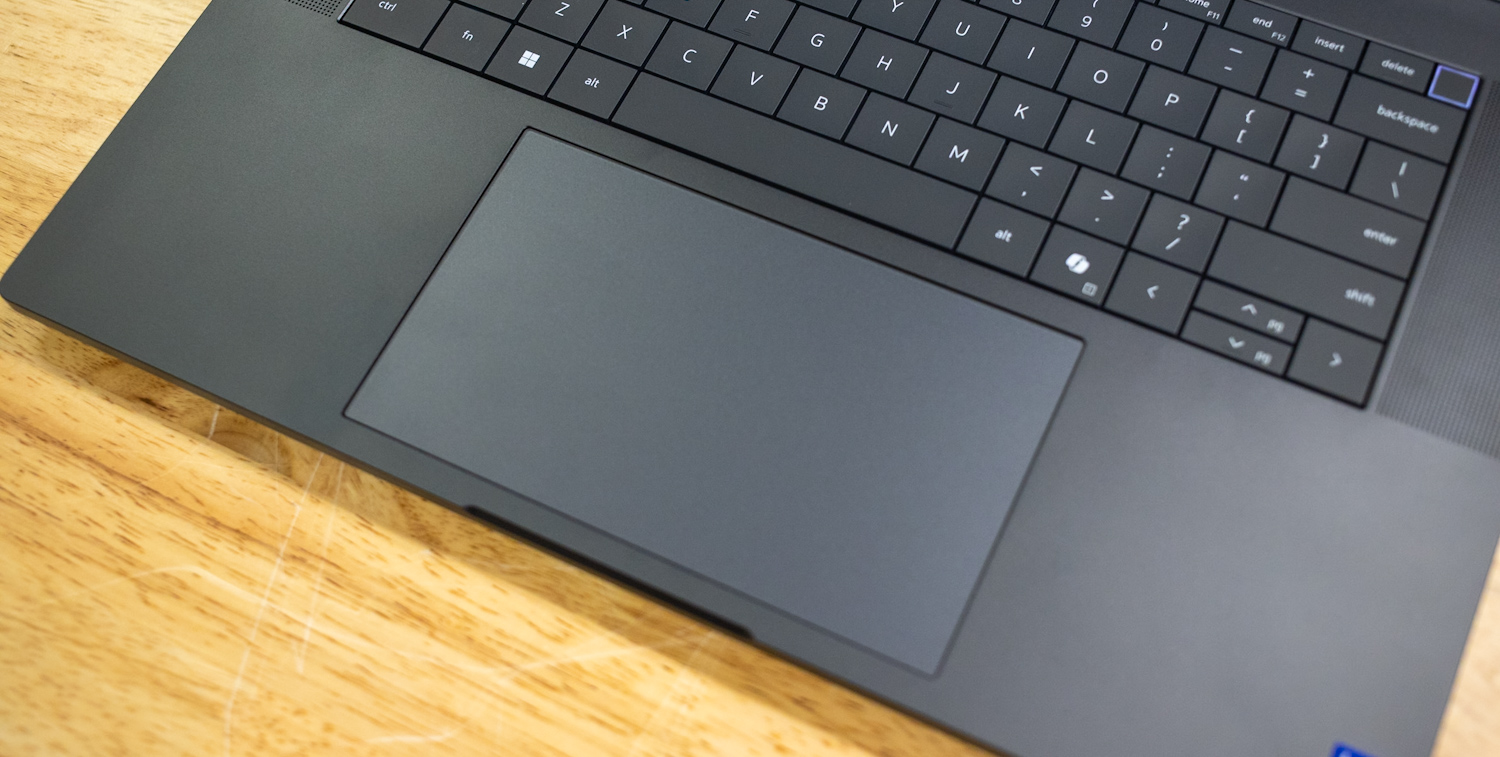
The touchpad uses small haptic motors to simulate feedback despite having no moving parts.
Upgradeability
Secured by four screws, the Pro Max 16 Premium’s bottom panel is relatively easy to remove.
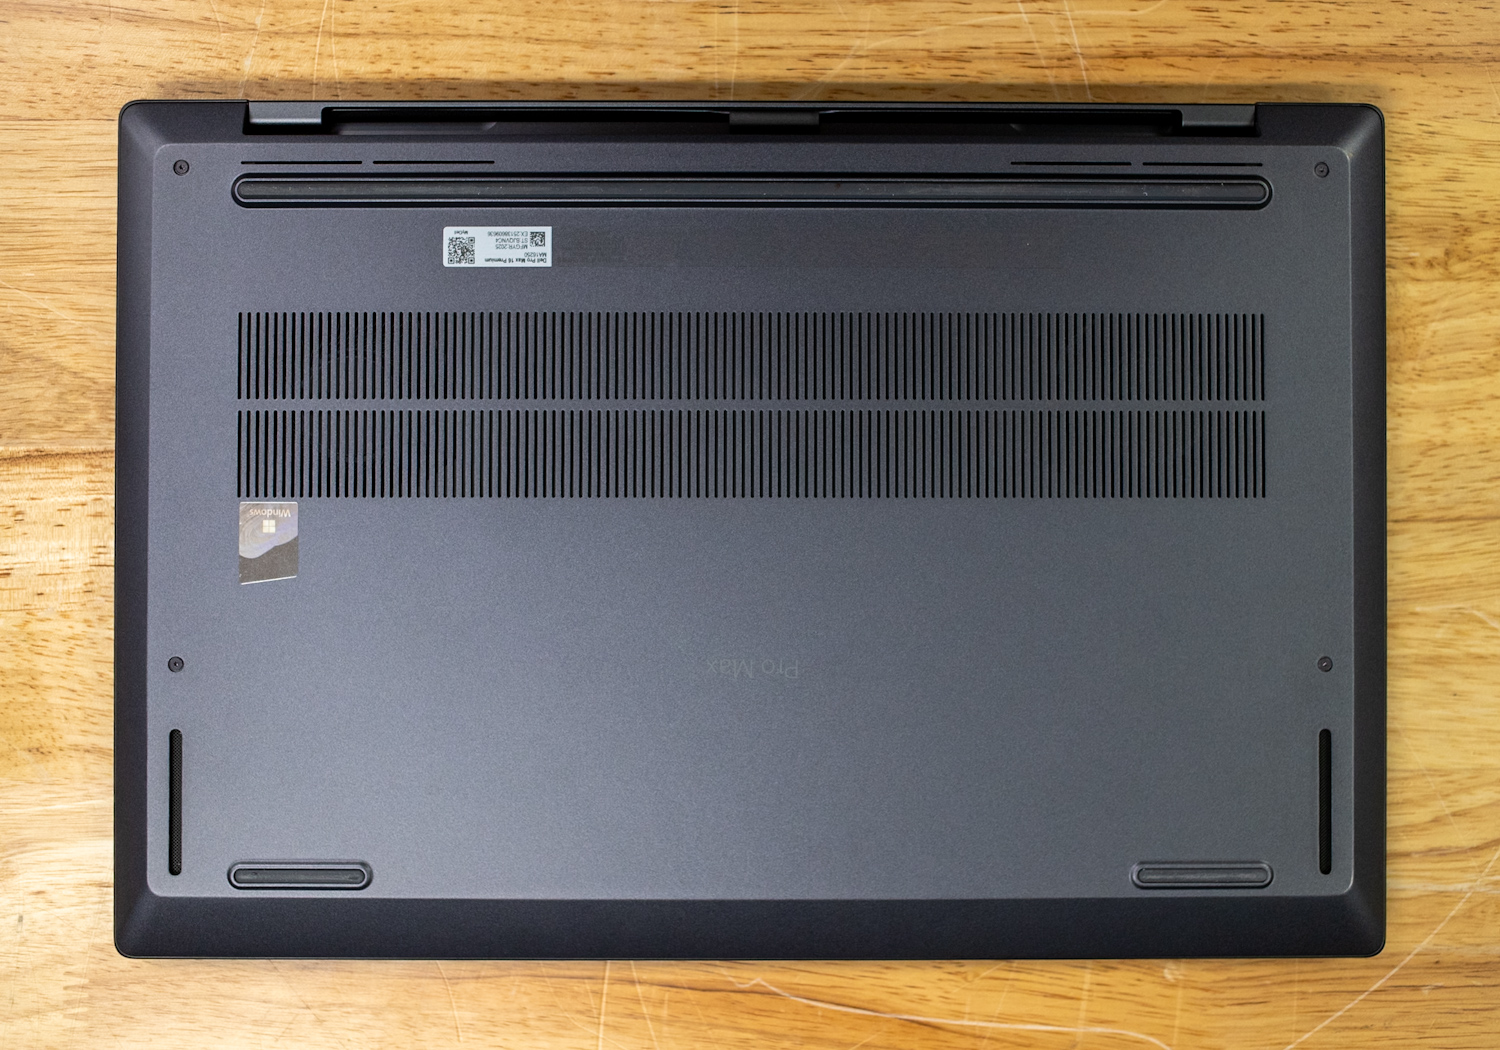
Four screws secure the bottom panel of the Pro Max 16 Premium.
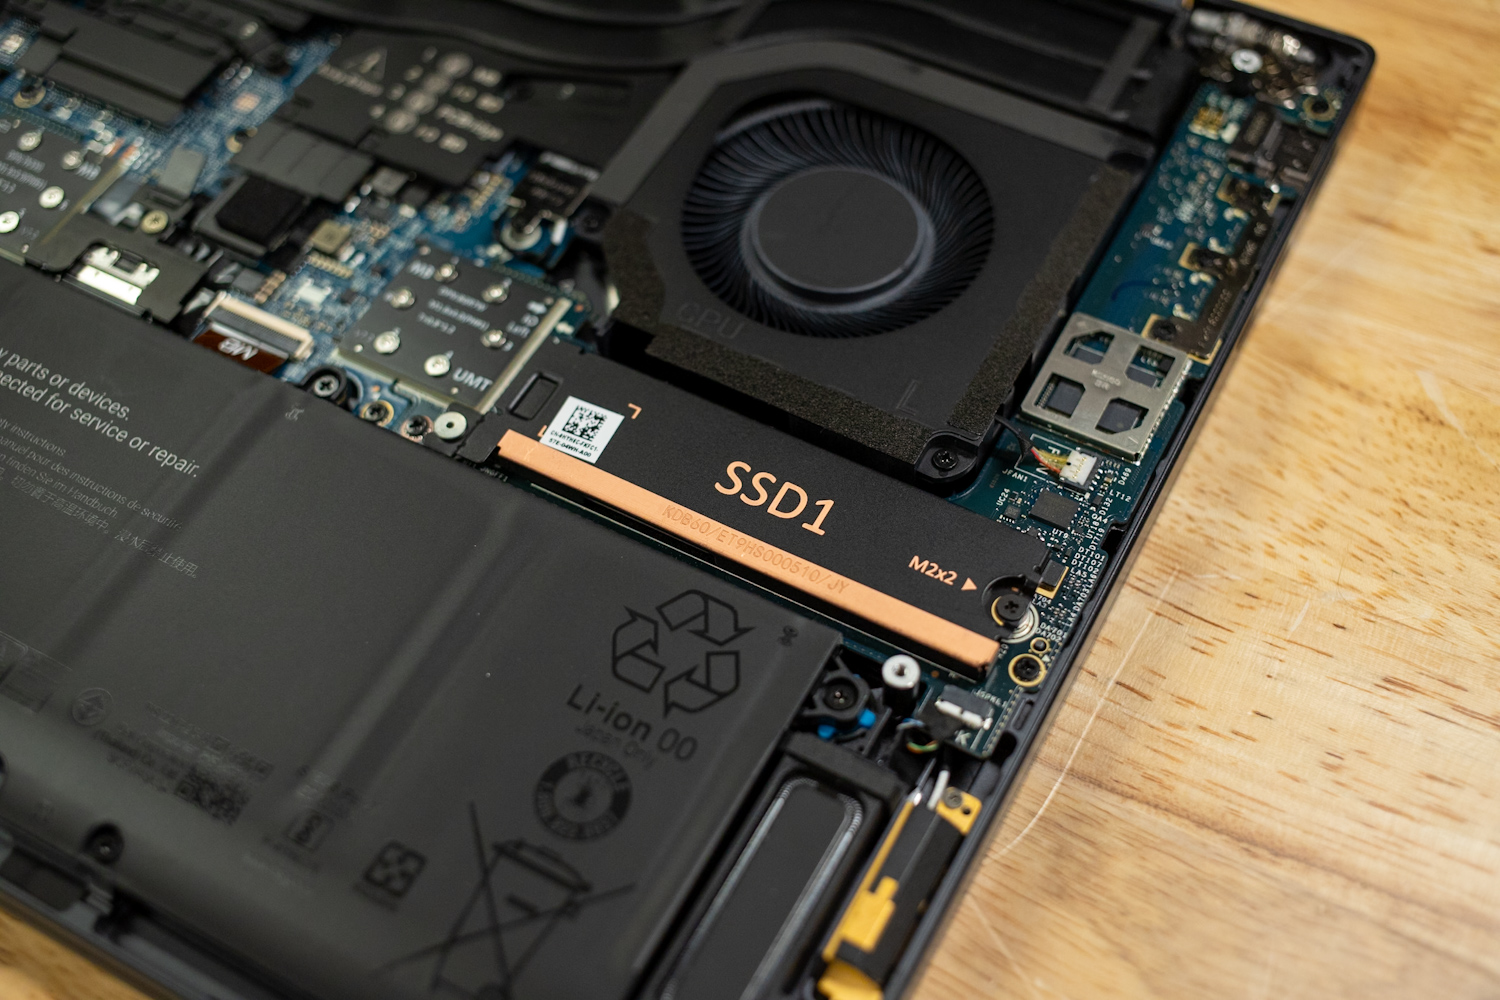
User-changeable components include the two M.2 SSDs and the 96Whr battery. With two SSDs, the laptop supports RAID 0 and 1 configurations.
Although most other components are soldered, including the wireless card and memory, the mainboard and I/O board can be swapped out, avoiding the need to replace the entire laptop if either fails. As we saw on the Pro Max 14 Premium, the USB-C ports also have sound reinforcement to prevent damage.
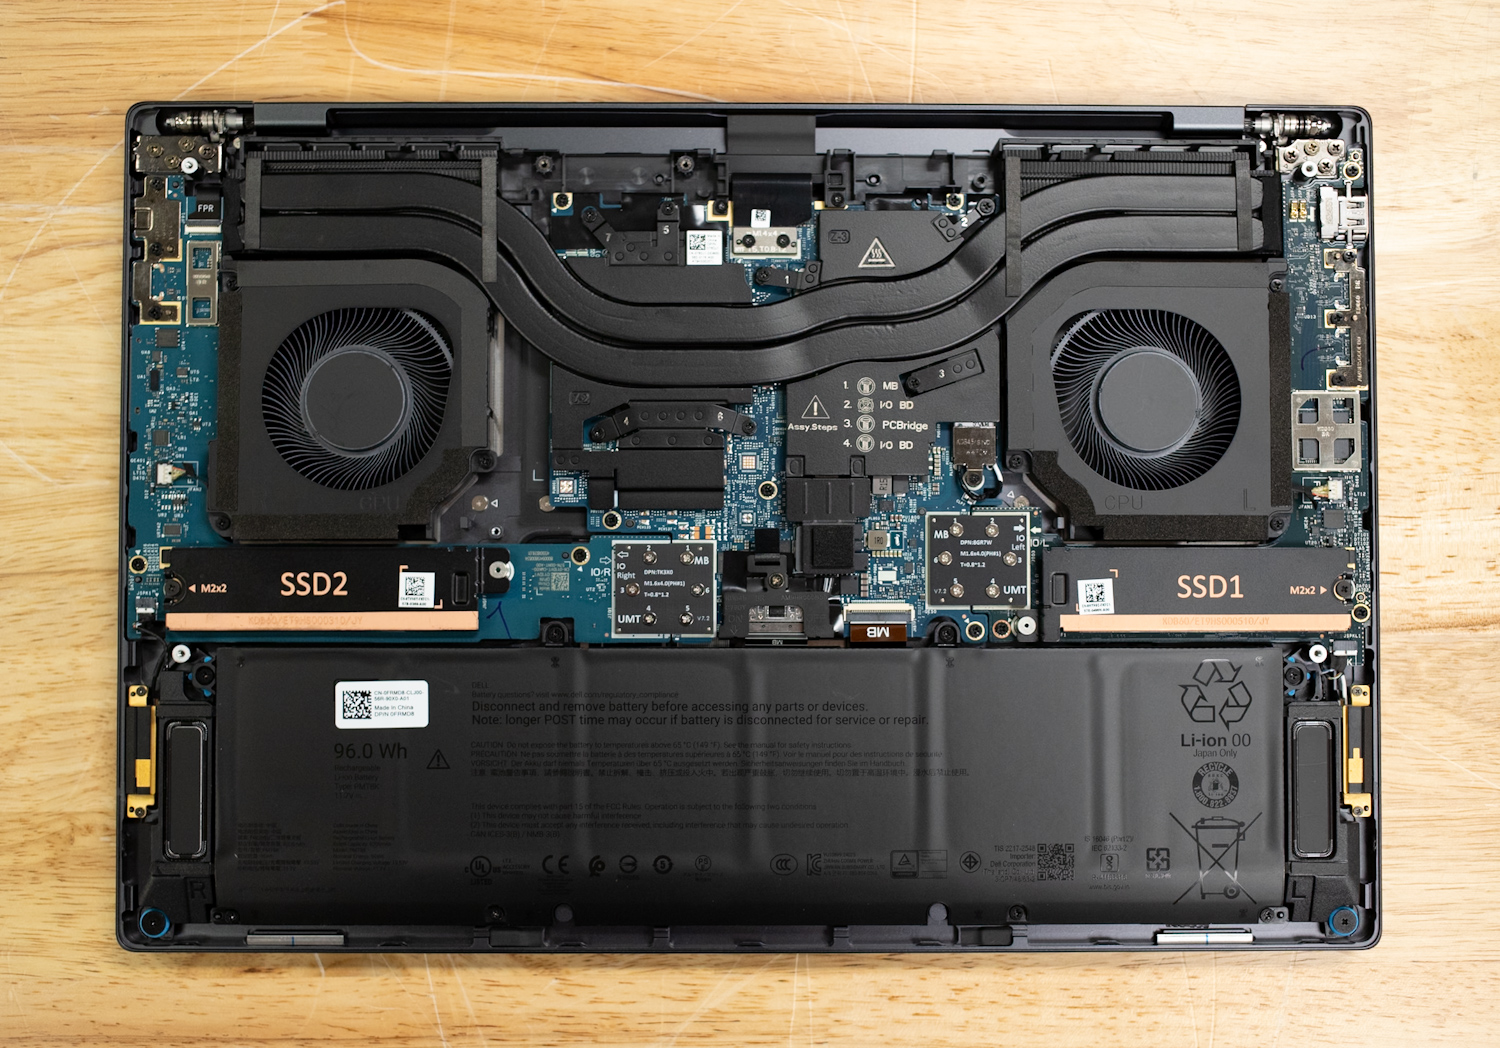
Upgradeable components include the battery and two M.2 SSDs.
Internally, the dual fans inside the chassis stay pretty calm under heavy use. They keep the system relatively cool, and it also helps that the platform uses only integrated graphics. In more performant configurations, Dell does leverage three-fan setups. The Dell Pro Max 16 Plus, equipped with an NVIDIA RTX Pro 5000, has a three-fan configuration.
Performance Benchmarks
Dell provided us with a Pro Max 16 Premium configured as follows:
- Intel Core Ultra 7 265H w/ Intel vPro Enterprise
- Intel Arc 140T integrated graphics
- 32GB LPDDR5X-8400
- 2x 1TB SSD in RAID 0
This unit retails for $3,822 on Dell.com, though most businesses buy through channel partners rather than online. Prices will vary, particularly if the system is purchased in bulk.
Our model has only modest upgrades from the Core Ultra 7 255H base model. We don’t classify this particular configuration as a workstation since it lacks dedicated graphics; Dell offers NVIDIA RTX PRO 1000, 2000, and 3000 cards with the Core Ultra 7 265H or Core Ultra 9 285H processors. For a glimpse of what performance it may deliver, we’ll compare it to the Pro Max 14 Premium, which we reviewed with the RTX PRO 2000.
Our all-Dell comparison lineup includes the smaller Pro Max 14 Premium (Core Ultra 9 285H, RTX PRO 2000) and two Pro Max Plus models: the Pro Max 16 Plus (Core Ultra 9 285HX, RTX PRO 5000) and the Pro Max 18 Plus (Core Ultra 9 285HX, RTX PRO 5000). Think of the Pro Max 14 Premium as a scaled-down version of the Pro Max 16 Premium (or vice versa). In contrast, the Plus models are in a different league entirely, with Core HX-class processors and higher-wattage RTX PRO GPUs. We expect the Pro Max 16 Premium to perform better than the Pro Max 14 Premium thanks to its slightly higher-capacity cooling system, though it’s unlikely to match either Plus model. The Pro Max 18 Plus should offer the highest performance of the group, thanks to its extensive cooling system.
Procyon AI Computer Vision
The Procyon AI Computer Vision Benchmark measures AI inference performance across CPUs, GPUs, and dedicated accelerators using a range of state-of-the-art neural networks. It evaluates tasks such as image classification, object detection, segmentation, and super-resolution using models that include MobileNet V3, Inception V4, YOLO V3, DeepLab V3, Real ESRGAN, and ResNet 50. Tests are run on multiple inference engines, including NVIDIA TensorRT, Intel OpenVINO, Qualcomm SNPE, Microsoft Windows ML, and Apple Core ML, providing a broad view of hardware and software efficiency. Results are reported for float- and integer-optimized models, providing a consistent, practical measure of machine vision performance for professional workloads.
In CPU testing, the Pro Max 16 Premium outperformed the Pro Max 14 Premium, scoring 153 points to 127. Although the Pro Max 14 Premium’s Core Ultra 9 285H is theoretically faster than our Pro Max 16 Premium’s Core Ultra 7 265H, it likely has less cooling capacity, so its performance is more limited. We see a similar trend with the Pro Max 16 Plus and Pro Max 18 Plus; despite using the same Core Ultra 9 285HX—which is in an entirely different performance league than the H-class chips in the Premium models—the Pro Max 18 Plus scored slightly better, with 195 points to the Pro Max 16 Plus’ 190 points. Overall, though, these numbers indicate that the Pro Max 16 Premium is capable of localized CPU-based AI operations.
Testing on the CPU’s integrated graphics, we see similar numbers between the Dell Pro Max 16 Premium (275 points) and the Pro Max 14 Premium (266 points), which feature stronger Arc 140T integrated graphics on their H-class CPUs than the more basic Intel Graphics on the Core Ultra 9 285HX featured in the Pro Max 16 Plus and Pro Max 18 Plus, which had respective scores of 149 and 156 points.
| CPU Results (average time in ms) | Dell Pro Max 16 Premium (Intel Core Ultra 7 265H) | Dell Pro Max 14 Premium (Intel Core Ultra 9 285H) (NVIDIA RTX PRO 2000) | Dell Pro Max 18 Plus (Intel Core Ultra 9 285HX) (NVIDIA RTX PRO 5000) | Dell Pro Max 16 Plus (Intel Core Ultra 9 285HX) (NVIDIA RTX PRO 5000) |
| AI Computer Vision Overall Score | 153 | 127 | 195 | 190 |
| MobileNet V3 | 0.98 ms | 1.12 ms | 1.00 ms | 0.97 ms |
| ResNet 50 | 8.83 ms | 7.05 ms | 6.98 ms | 7.29 ms |
| Inception V4 | 25.53 ms | 10.55 ms | 19.53 ms | 20.76 ms |
| DeepLab V3 | 31.94 ms | 37.46 ms | 24.15 ms | 24.02 ms |
| YOLO V3 | 63.71 ms | 77.49 ms | 44.53 ms | 44.59 ms |
| REAL-ESRGAN | 2,683.72 ms | 3,318.78 ms | 1,934.18 ms | 2,043.35 ms |
| CPU Integrated Graphics Results (average time in ms) | ||||
| AI Computer Vision Overall Score | 275 | 266 | 156 | 149 |
| MobileNet V3 | 1.05 ms | 1.00 ms | 1.35 ms | 1.35 ms |
| ResNet 50 | 4.18 ms | 4.54 ms | 8.86 ms | 8.90 ms |
| Inception V4 | 10.69 ms | 12.07 ms | 22.71 ms | 27.60 ms |
| DeepLab V3 | 25.38 ms | 26.13 ms | 37.80 ms | 38.68 ms |
| YOLO V3 | 28.91 ms | 29.12 ms | 54.03 ms | 57.56 ms |
| REAL-ESRGAN | 1,033.83 ms | 1,046.98 ms | 1,878.42 ms | 1,910.57 ms |
UL Procyon: AI Text Generation
The Procyon AI Text Generation Benchmark streamlines AI LLM performance testing by providing a concise and consistent evaluation method. It enables repeated testing across multiple LLM models, minimizing the complexity of large model sizes and variable factors. Developed with AI hardware leaders, it optimizes the use of local AI accelerators to deliver more reliable, efficient performance assessments. The results measured below were tested using TensorRT.
This test’s reliance on a dedicated GPU puts our Pro Max 16 Premium at a severe disadvantage, as it only features integrated graphics. Its overall scores—1,057 points in Phi, 1,001 in Mistral, 914 in Llama3, and 937 in Llama2—are about one-third lower than the Pro Max 14 Premium, which, despite its RTX PRO 2000, doesn’t perform much better because its GPU has a low maximum graphics power rating. In contrast, the Pro Max Plus models vastly outperform both Premium models, thanks to their high-wattage RTX PRO 5000 GPUs. For example, the Pro Max 16 Plus achieved scores approximately four times higher in Phi (4,083 compared to 1,057), Mistral (3,993 compared to 1,001), Llama3 (3,547 compared to 914), and Llama2 (4,044 compared to 937).
| UL Procyon: AI Text Generation | Dell Pro Max 16 Premium (Intel Core Ultra 7 265H) | Dell Pro Max 14 Premium (Intel Core Ultra 9 285H) (NVIDIA RTX PRO 2000) | Dell Pro Max 18 Plus (Intel Core Ultra 9 285HX) (NVIDIA RTX PRO 5000) | Dell Pro Max 16 Plus (Intel Core Ultra 9 285HX) (NVIDIA RTX PRO 5000) |
| Phi Overall Score | 1,057 | 1,613 | 4,475 | 4,083 |
| Phi Output Time To First Token | 0.578 s | 0.533 s | 0.237 s | 0.274 s |
| Phi Output Tokens Per Second | 25.202 tok/s | 54.065 tok/s | 185.118 tok/s | 178.614 tok/s |
| Phi Overall Duration | 110.643 s | 53.421 s | 16.314 s | 17.133 s |
| Mistral Overall Score | 1,001 | 1,579 | 4,295 | 3,993 |
| Mistral Output Time To First Token | 0.742 s | 0.789 s | 0.347 s | 0.370 s |
| Mistral Output Tokens Per Second | 16.311 tok/s | 43.210 tok/s | 140.546 tok/s | 134.228 tok/s |
| Mistral Overall Duration | 169.883 s | 67.557 s | 21.665 s | 22.887 s |
| Llama3 Overall Score | 914 | 1,387 | 3,763 | 3,547 |
| Llama3 Output Time To First Token | 0.682 s | 0.796 s | 0.344 s | 0.370 s |
| Llama3 Output Tokens Per Second | 14.034 tok/s | 37.701 tok/s | 119.741 tok/s | 114.741 tok/s |
| Llama3 Overall Duration | 196.199 s | 77.103 s | 25.165 s | 26.319 s |
| Llama2 Overall Score | 937 | – | 4,155 | 4,044 |
| Llama2 Output Time To First Token | 1.341 s | – | 0.546 s | 0.558 s |
| Llama2 Output Tokens Per Second | 8.712 tok/s | – | 69.709 tok/s | 67.484 tok/s |
| Llama2 Overall Duration | 316.035 s | – | 42.506 s | 43.855 s |
UL Procyon: AI Image Generation
The Procyon AI Image Generation Benchmark provides a consistent and accurate method for measuring AI inference performance across a range of hardware, from low-power NPUs to high-end GPUs. It includes three tests: Stable Diffusion XL (FP16) for high-end GPUs, Stable Diffusion 1.5 (FP16) for moderately powerful GPUs, and Stable Diffusion 1.5 (INT8) for low-power devices. The benchmark uses the optimal inference engine for each system, ensuring fair and comparable results.
The Pro Max 16 Premium shows low comparative performance throughout this test because of its integrated graphics. Unlike in AI Text Generation, this Image Generation test can leverage GPU resources far more effectively. The Pro Max 14 Premium outgunned it by about a factor of three in 1.5 FP16 (334 versus 1,112 points) and over five in 1.5 INT8 (1,934 versus 11,830). Meanwhile, the Pro Max Plus models performed about four times better than the Pro Max 14 Premium, showcasing the RTX PRO 5000’s prowess. For instance, the Pro Max 16 Plus’ score of 39,329 in 1.5 INT8 was nearly four times higher than the Pro Max 14 Premium’s 11,830 points.
| UL Procyon: AI Image Generation | Dell Pro Max 16 Premium (Intel Core Ultra 7 265H) | Dell Pro Max 14 Premium (Intel Core Ultra 9 285H) (NVIDIA RTX PRO 2000) | Dell Pro Max 18 Plus (Intel Core Ultra 9 285HX) (NVIDIA RTX PRO 5000) | Dell Pro Max 16 Plus (Intel Core Ultra 9 285HX) (NVIDIA RTX PRO 5000) |
| Stable Diffusion 1.5 (FP16) – Overall Score | 334 | 1,112 | 3,687 | 3,540 |
| Stable Diffusion 1.5 (FP16) – Overall Time | 298.677 s | 89.883 s | 27.119 s | 28.245 s |
| Stable Diffusion 1.5 (FP16) – Image Generation Speed | 18.667 s/image | 5.618 s/image | 1.695 s/image | 1.765 s/image |
| Stable Diffusion 1.5 (INT8) – Overall Score | 1,934 | 11,830 | 44,101 | 39,329 |
| Stable Diffusion 1.5 (INT8) – Overall Time | 129.216 s | 21.132 s | 5.669 s | 6.356 s |
| Stable Diffusion 1.5 (INT8) – Image Generation Speed | 16.152 s/image | 2.614 s/image | 0.709 s/image | 0.795 s/image |
| Stable Diffusion XL (FP16) – Overall Score | 356 | 903 | 3,170 | 3,017 |
| Stable Diffusion XL (FP16) – Overall Time | 1683.796 s | 663.886 s | 189.260 s | 198.869 s |
| Stable Diffusion XL (FP16) – Image Generation Speed | 105.237 s/image | 41.493 s/image | 11.829 s/image | 12.429 s/image |
SPECworkstation 4
The SPECworkstation 4.0 benchmark is a comprehensive tool for evaluating all key aspects of workstation performance. It provides a real-world measure of CPU, graphics, accelerator, and disk performance, enabling professionals to make informed decisions about their hardware investments. The benchmark includes a dedicated set of tests focused on AI/ML workloads, including data science tasks and ONNX runtime-based inference tests, reflecting the growing importance of AI/ML in workstation environments. It encompasses seven industry verticals and four hardware subsystems, providing a detailed and relevant measure of the performance of today’s workstations.
The GPU plays a significant role in this test, which enables the smaller Pro Max 14 Premium to outperform the Pro Max 16 Premium by about 20% across the test. The Pro Max Plus models also have a clear advantage here, boosted by the RTX PRO 5000. The Pro Max 18 Plus continues to show minor but effective performance improvements versus the Pro Max 16 Plus despite featuring the same hardware, which we can only attribute to better thermals.
| SPECworkstation 4.0.0 (higher is better) | Dell Pro Max 16 Premium (Intel Core Ultra 7 265H) | Dell Pro Max 14 Premium (Intel Core Ultra 9 285H) (NVIDIA RTX PRO 2000) | Dell Pro Max 18 Plus (Intel Core Ultra 9 285HX) (NVIDIA RTX PRO 5000) | Dell Pro Max 16 Plus (Intel Core Ultra 9 285HX) (NVIDIA RTX PRO 5000) |
| AI & Machine Learning | 1.42 | 1.77 | 2.48 | 2.49 |
| Energy | 1.13 | 1.40 | 2.49 | 2.31 |
| Financial Services | 0.91 | 1.07 | 1.66 | 1.64 |
| Life Sciences | 1.38 | 1.65 | 1.50 | 2.64 |
| Media & Entertainment | 1.29 | 1.64 | 2.66 | 2.23 |
| Product Design | 1.13 | 1.28 | 2.35 | 2.39 |
| Productivity & Development | 0.93 | 1.00 | 1.35 | 1.37 |
SPECviewperf 15
SPECviewperf 15 is the industry-standard benchmark for evaluating 3D graphics performance across OpenGL, DirectX, and Vulkan APIs. It introduces new workloads such as blender-01 (Blender 3.6), unreal_engine-01 (Unreal Engine 5.4, DirectX 12), and enscape-01 (Enscape 4.0, Vulkan ray tracing), along with updated traces for 3ds Max, CATIA, Creo, Maya, and Solidworks. With its redesigned GUI, modern application support, and advanced rendering workloads, SPECviewperf 15 provides consistent, real-world insights into professional graphics performance.
Heavily GPU-reliant, the CPU plays a minor role in these tests. The integrated graphics in the Pro Max 16 Premium outperformed the Pro Max 14 Premium by several factors; for instance, in creo-04, it scored 23.65 fps, compared with the smaller model’s 121.82 fps. As has become expected, the Pro Max Plus laptops performed far better; in creo-04, the Pro Max 16 Plus scored a staggering 238.60 fps. Overall, for 3D modeling, integrated graphics won’t do the job.
| SPECviewperf (higher is better) | Dell Pro Max 16 Premium (Intel Core Ultra 7 265H) | Dell Pro Max 14 Premium (Intel Core Ultra 9 285H) (NVIDIA RTX PRO 2000) | Dell Pro Max 18 Plus (Intel Core Ultra 9 285HX) (NVIDIA RTX PRO 5000) | Dell Pro Max 16 Plus (Intel Core Ultra 9 285HX) (NVIDIA RTX PRO 5000) |
| 3dsmax-08 | 8.50 | 28.50 | 98.71 | 97.60 |
| blender-01 | 6.55 | 38.68 | 83.23 | 79.46 |
| catia-07 | 9.86 | 48.64 | 113.18 | 107.91 |
| creo-04 | 23.65 | 121.82 | 247.79 | 238.60 |
| energy-04 | 8.09 | 58.10 | 170.27 | 161.60 |
| enscape-01 | 2.98 | 29.44 | 86.70 | 84.84 |
| maya-07 | 27.67 | 112.22 | 232.48 | 224.80 |
| medical-04 | 14.50 | 105.84 | 210.51 | 206.08 |
| solidworks-08 | 12.06 | 64.01 | 145.56 | 143.13 |
| unreal_engine-01 | 17.17 | 56.10 | 93.46 | 87.22 |
LuxMark
LuxMark is a GPU benchmark that utilizes LuxRender, an open-source ray-tracing renderer, to evaluate a system’s performance in handling highly detailed 3D scenes. This benchmark is relevant for assessing the graphical rendering capabilities of servers and workstations, especially for visual effects and architectural visualization applications, where accurate light simulation is crucial.
Scoring 5,116 points in hall and 2,055 in food, the Pro Max 16 Premium was well behind the Pro Max 14 Premium, which scored 15,278 and 5,488 points, respectively. Meanwhile, the Pro Max 16 Plus and Pro Max 18 Plus performed similarly; the former scored 29,019 and 12,684 points, again illustrating the RTX PRO 5000’s dominant performance.
| LuxMark (higher is better) | Dell Pro Max 16 Premium (Intel Core Ultra 7 265H) | Dell Pro Max 14 Premium (Intel Core Ultra 9 285H) (NVIDIA RTX PRO 2000) | Dell Pro Max 18 Plus (Intel Core Ultra 9 285HX) (NVIDIA RTX PRO 5000) | Dell Pro Max 16 Plus (Intel Core Ultra 9 285HX)(NVIDIA RTX PRO 5000) |
| Hallbench | 5,116 | 15,278 | 29,605 | 29,019 |
| Food | 2,055 | 5,488 | 13,042 | 12,684 |
7-Zip Compression
The 7-Zip Compression Benchmark evaluates CPU performance during compression and decompression, measuring GIPS (Giga Instructions Per Second) and CPU usage. Higher GIPS and efficient CPU usage indicate superior performance.
The Pro Max 16 Premium, equipped with the Core Ultra 7 265H, noticeably outperforms the Core Ultra 9 285H-equipped Pro Max 14 Premium, with a total rating of 107.229 to 96.223 GIPS. This suggests that the larger laptop’s cooling system has a higher capacity. While the Core Ultra 9 285HX chips in the Plus laptops are superior performers, the difference isn’t as substantial as one might expect, with the Plus laptops showing about one-third better overall performance than the Pro Max 16 Premium.
| 7-Zip Compression Benchmark (higher is better) | Dell Pro Max 16 Premium (Intel Core Ultra 7 265H) | Dell Pro Max 14 Premium (Intel Core Ultra 9 285H) (NVIDIA RTX PRO 2000) | Dell Pro Max 18 Plus (Intel Core Ultra 9 285HX) (NVIDIA RTX PRO 5000) | Dell Pro Max 16 Plus (Intel Core Ultra 9 285HX) (NVIDIA RTX PRO 5000) | |
| Compression | |||||
| Current CPU Usage | 1,307% | 1,355% | 1,905% | 1,799% | |
| Current Rating/Usage | 8.284 GIPS | 7.824 GIPS | 7.275 GIPS | 6.252 GIPS | |
| Current Rating | 108.266 GIPS | 105.987 GIPS | 138.244 GIPS | 110.594 GIPS | |
| Resulting CPU Usage | 1,310% | 1,301% | 1,891% | 1,805% | |
| Resulting Rating/Usage | 8.649 GIPS | 7.908 GIPS | 7.270 GIPS | 6.399 GIPS | |
| Resulting Rating | 113.252 GIPS | 102.845 GIPS | 137.459 GIPS | 115.536 GIPS | |
| Decompression | |||||
| Current CPU Usage | 1,248% | 1,275% | 2,226% | 2,187% | |
| Current Rating/Usage | 7.745 GIPS | 7.108 GIPS | 7.175 GIPS | 7.229 GIPS | |
| Current Rating | 96.626 GIPS | 90.621 GIPS | 159.735 GIPS | 158.102 GIPS | |
| Resulting CPU Usage | 1,257% | 1,248% | 2,242% | 2,202% | |
| Resulting Rating/Usage | 8.057 GIPS | 7.185 GIPS | 7.276 GIPS | 7.074 GIPS | |
| Resulting Rating | 101.205 GIPS | 89.621 GIPS | 163.149 GIPS | 155.801 GIPS | |
| Total Rating | |||||
| Total CPU Usage | 1,283% | 1,274% | 2,067% | 2,004% | |
| Total Rating/Usage | 8.353 GIPS | 7.547 GIPS | 7.273 GIPS | 6.737 GIPS | |
| Total Rating | 107.229 GIPS | 96.233 GIPS | 150.304 GIPS | 135.669 GIPS | |
Blackmagic RAW Speed Test
The Blackmagic RAW Speed Test is a performance benchmarking tool that measures a system’s capabilities for handling video playback and editing using the Blackmagic RAW codec. It evaluates how well a system decodes and plays back high-resolution video files, reporting frame rates for both CPU- and GPU-based processing.
The integrated graphics in the Pro Max 16 Premium aren’t quite up to the task of 8K playback, at least for OpenCL, where it produced 54 fps; the Pro Max 14 Premium did much better, at 112 fps, while the Pro Max 16 Plus led the group with 184 fps.
| Blackmagic RAW Speed Test | Dell Pro Max 16 Premium (Intel Core Ultra 7 265H) | Dell Pro Max 14 Premium (Intel Core Ultra 9 285H) (NVIDIA RTX PRO 2000) | Dell Pro Max 18 Plus (Intel Core Ultra 9 285HX) (NVIDIA RTX PRO 5000) | Dell Pro Max 16 Plus (Intel Core Ultra 9 285HX) (NVIDIA RTX PRO 5000) |
|---|---|---|---|---|
| 8K CPU | 82 | 64 | 128 | 130 |
| 8K OPENCL | 54 | 112 | 168 | 184 |
Blackmagic Disk Speed Test
The Blackmagic Disk Speed Test evaluates storage performance by measuring read and write speeds, providing insights into a system’s ability to handle data-intensive tasks, such as video editing and large file transfers.
We won’t spend much time on these results since the included drives can vary, but the Pro Max 16 Premium did quite well here, with nearly 7GB/s read for an OEM Gen4 drive. It also had the highest write speed in the group, at 6,684 MB/s, outpacing the drives in the Plus models.
| Disk Speed Test (higher is better) | Dell Pro Max 16 Premium (Intel Core Ultra 7 265H) | Dell Pro Max 14 Premium (Intel Core Ultra 9 285H) (NVIDIA RTX PRO 2000) | Dell Pro Max 18 Plus (Intel Core Ultra 9 285HX) (NVIDIA RTX PRO 5000) | Dell Pro Max 16 Plus (Intel Core Ultra 9 285HX) (NVIDIA RTX PRO 5000) |
| Read | 6,938.6MB/s | 4,268.8MB/s | 7,776.1MB/s | 7,755.6MB/s |
| Write | 6,684.1MB/s | 5,000.7MB/s | 6,022.0MB/s | 5,734.7MB/s |
Blender 4.5
Blender is an open-source 3D modeling application. This benchmark was run using the Blender Benchmark utility. The score is measured in samples per minute, with higher values indicating better performance.
This CPU test is intense and rewards the stronger Core HX chips found in the Pro Max Plus laptops. The Pro Max 16 Premium’s numbers were slightly better than the Pro Max 14 Premium, though just over half as good as the Pro Max 16 Plus.
| Blender CPU (samples per minute, higher is better) | Dell Pro Max 16 Premium (Intel Core Ultra 7 265H) | Dell Pro Max 14 Premium (Intel Core Ultra 9 285H) (NVIDIA RTX PRO 2000) | Dell Pro Max 18 Plus (Intel Core Ultra 9 285HX) (NVIDIA RTX PRO 5000) | Dell Pro Max 16 Plus (Intel Core Ultra 9 285HX) (NVIDIA RTX PRO 5000) |
| Monster | 107.9 | 105.8 | 237.1 | 208.48 |
| Junkshop | 73.1 | 69.1 | 150.7 | 131.17 |
| Classroom | 53.8 | 49.2 | 94.5 | 92.26 |
y-cruncher
y-cruncher is a multithreaded and scalable program that can compute Pi and other mathematical constants to trillions of digits. Since its launch in 2009, it has become a popular benchmarking and stress-testing application for overclockers and hardware enthusiasts.
The Pro Max 16 Premium practically tied the Pro Max 14 Premium in these tests, completing the 2.5-billion-test in 109.487s, versus 110.787s. Note that our review model couldn’t complete the 5- and 10-billion-test runs because it only had 32GB of memory. There’s no substitute for a beastly CPU for this test, though, with the Core Ultra 9 285HX in the Pro Max 16 Plus completing the test in just 64.209s.
| Y-Cruncher (Total Computation Time) | Dell Pro Max 16 Premium (Intel Core Ultra 7 265H) | Dell Pro Max 14 Premium (Intel Core Ultra 9 285H)(NVIDIA RTX PRO 2000) | Dell Pro Max 18 Plus (Intel Core Ultra 9 285HX)(NVIDIA RTX PRO 5000) | Dell Pro Max 16 Plus (Intel Core Ultra 9 285HX)(NVIDIA RTX PRO 5000) |
|---|---|---|---|---|
| 1 Billion | 40.370 s | 37.877 s | 20.081 s | 22.782 s |
| 2.5 Billion | 109.487 s | 110.787 s | 59.228 s | 64.209 s |
| 5 Billion | – | 243.553 s | 142.822 s | 150.615 s |
| 10 Billion | – | 539.174 s | 311.805 s | 332.901 s |
Geekbench 6
Geekbench 6 is a cross-platform benchmark that measures overall system performance.
The CPU tests show the Pro Max 16 Premium again slightly outdoing the Pro Max 14 Premium, posting 2,844 in single-core and 17,310 in multi-core versus 2,841 and 16,732 points for the Pro Max 14 Premium. Higher core counts and turbo boost clocks on the Core Ultra 9 285HX chips in the Plus models resulted in better scores; the Pro Max 16 Plus posted 3,032 and 20,978 points. Meanwhile, the GPU-focused OpenCL tests naturally heavily favored the dedicated GPU models, with our Pro Max 16 Premium putting 43,255 points, or less than half the score of the Pro Max 14 Premium.
| Geekbench 6 (higher is better) | Dell Pro Max 16 Premium (Intel Core Ultra 7 265H) | Dell Pro Max 14 Premium (Intel Core Ultra 9 285H) (NVIDIA RTX PRO 2000) | Dell Pro Max 18 Plus (Intel Core Ultra 9 285HX) (NVIDIA RTX PRO 5000) | Dell Pro Max 16 Plus (Intel Core Ultra 9 285HX) (NVIDIA RTX PRO 5000) |
|---|---|---|---|---|
| CPU Single-Core | 2,844 | 2,841 | 2,977 | 3,032 |
| CPU Multi-Core | 17,310 | 16,732 | 20,717 | 20,978 |
| GPU OpenCL | 43,255 | 99,633 | 240,530 | 245,286 |
Topaz Video AI
Topaz Video AI is a professional application for enhancing and restoring video using advanced AI models. It supports various tasks, including upscaling footage to 4K or 8K, sharpening blurry content, reducing noise, enhancing facial details, colorizing black-and-white footage, and interpolating frames for smoother motion. The suite includes an onboard benchmark that measures system performance across its different video-enhancing algorithms, giving a clear view of how well hardware platforms handle demanding AI video processing workloads.
Not all laptops were able to complete every model. The Pro Max 16 Premium noticeably trailed the Pro Max 14 Premium, with its relatively strong integrated graphics unable to keep pace with the latter’s RTX PRO 2000. As expected, the Plus models performed several magnitudes better than either Premium model, owing to their higher-wattage RTX PRO 5000 cards.
| Topaz Video AI Benchmark (Frames per second, higher is better) | Dell Pro Max 16 Premium (Intel Core Ultra 7 265H) | Dell Pro Max 14 Premium (Intel Core Ultra 9 285H) (NVIDIA RTX PRO 2000) | Dell Pro Max 18 Plus (Intel Core Ultra 9 285HX) (NVIDIA RTX PRO 5000) | Dell Pro Max 16 Plus (Intel Core Ultra 9 285HX) (NVIDIA RTX PRO 5000) | ||||||||
|---|---|---|---|---|---|---|---|---|---|---|---|---|
| Model | 1X | 2X | 4X | 1X | 2X | 4X | 1X | 2X | 4X | 1X | 2X | 4X |
| Artemis | 4.81 | 3.35 | 1.20 | 5.56 | 2.48 | 0.99 | 31.10 | 16.94 | 4.22 | 29.50 | 12.34 | 3.36 |
| Iris | 3.87 | 2.37 | 0.75 | 6.65 | 3.46 | 2.94 | 27.77 | 16.07 | 4.16 | 27.25 | 4.40 | 3.74 |
| Proteus | 4.96 | 3.71 | 1.47 | 6.73 | 11.41 | 3.03 | 28.56 | 18.70 | 4.70 | 27.34 | 16.92 | 4.66 |
| Gaia | 1.95 | 1.33 | 0.93 | 2.97 | 1.83 | 0.42 | 38.53 | 5.88 | 4.27 | 7.85 | 5.61 | 3.91 |
| Nyx | .93 | 0.73 | – | 2.50 | 1.93 | – | 0.86 | – | – | 7.86 | – | – |
| Nyx Fast | 1.71 | – | – | 5.07 | – | – | 19.64 | – | – | 18.31 | – | – |
| Rhea | – | – | 0.56 | – | – | – | – | – | 3.20 | – | – | 3.14 |
| RXL | – | – | 0.58 | – | – | – | – | – | 3.06 | – | – | 3.03 |
| Hyperion HDR | 2.04 | – | – | 10.99 | – | – | 19.39 | – | – | 19.12 | – | – |
| Apollo | 4.23 | – | – | 7.50 | – | – | 33.49 | – | – | 33.14 | – | – |
| Aion | – | – | – | 25.15 | – | – | 25.06 | – | – | 24.35 | – | – |
| APFast | 13.47 | – | – | 20.53 | – | – | 43.90 | – | – | 59.29 | – | – |
| Chronos | 2.88 | – | – | 3.44 | – | – | 20.43 | – | – | 19.92 | – | – |
| CHFast | 4.04 | – | – | 5.75 | – | – | 30.88 | – | – | 27.82 | – | – |
PCMark 10
PCMark 10 is an industry-standard benchmark that measures overall system performance for modern office environments. It features updated Windows 10 workloads that evaluate everyday tasks, including productivity, web browsing, video conferencing, and content creation. The benchmark is easy to run, delivers multi-level scoring (from high-level overall to detailed workload scores), and includes dedicated battery life and storage tests. While UL Solutions now recommends Procyon for newer, application-based testing, PCMark 10 remains a reliable and widely used tool for assessing general PC performance.
Scoring 7,646 points, the Pro Max 16 Premium is a speedy everyday machine, surpassing the Pro Max 14 Premium’s 7,190 points. Although it trailed the Plus models by about 800 points, the difference is unlikely to be noticeable in everyday use.
| PCMark 10 (higher is better) | Dell Pro Max 16 Premium (Intel Core Ultra 7 265H) | Dell Pro Max 14 Premium (Intel Core Ultra 9 285H) (NVIDIA RTX PRO 2000) | Dell Pro Max 18 Plus (Intel Core Ultra 9 285HX) (NVIDIA RTX PRO 5000) | Dell Pro Max 16 Plus (Intel Core Ultra 9 285HX) (NVIDIA RTX PRO 5000) |
|---|---|---|---|---|
| Score | 7,646 | 7,190 | 8,581 | 8,471 |
3DMark CPU
The 3DMark CPU Profile evaluates processor performance across six threading levels: 1, 2, 4, 8, 16, and max threads. Each test runs the same boid-based simulation workload to assess how well the CPU scales under different thread counts, with minimal GPU involvement. The benchmark helps identify single-thread efficiency and multithreaded potential for tasks such as gaming, content creation, and rendering. Scores across 8 threads often align with modern DirectX 12 gaming performance, while 1–4-thread results reflect older or esports game scenarios.
These laptops performed similarly across four threads, as each has at least four performance cores in its CPU. The dropoff begins at eight cores, where the Pro Max 16 Premium scored 7,984 points with its six-P-core Core Ultra 7 265H versus the 9,028 points from the Pro Max 16 Plus; its Core Ultra 9 285HX has a full eight P-cores. The scores diverge further from there, with the Pro Max 16 Premium scoring 11,593 with max threads versus 16,832 for the Pro Max 16 Plus.
| 3DMark CPU Profile (higher is better) | Dell Pro Max 16 Premium (Intel Core Ultra 7 265H) | Dell Pro Max 14 Premium (Intel Core Ultra 9 285H) (NVIDIA RTX PRO 2000) | Dell Pro Max 18 Plus (Intel Core Ultra 9 285HX) (NVIDIA RTX PRO 5000) | Dell Pro Max 16 Plus (Intel Core Ultra 9 285HX) (NVIDIA RTX PRO 5000) |
|---|---|---|---|---|
| Max Threads | 11,593 | 11,214 | 16,497 | 16,832 |
| 16 Threads | 11,658 | 10,536 | 13,224 | 13,658 |
| 8 Threads | 7,984 | 7,010 | 7,658 | 9,028 |
| 4 threads | 4,604 | 4,388 | 4,583 | 4,799 |
| 2 threads | 2,391 | 2,309 | 2,435 | 2,464 |
| 1 threads | 1,225 | 1,198 | 1,234 | 1,263 |
3DMark Storage
The 3DMark Storage Benchmark tests your SSD’s gaming performance by measuring tasks like loading games, saving progress, installing game files, and recording gameplay. It evaluates how well your storage performs in real-world gaming and supports the latest storage technologies to provide accurate performance insights.
The earlier Blackmagic Disk Speed test showed the Pro Max 16 Premium posting some of the highest read and write scores among this group, but not so here, where it had the lowest score of 1,014 points—all the others scored over 2,000 points, with the Pro Max 18 Plus leading at 2,368.
| 3DMark Storage (higher is better) | Dell Pro Max 16 Premium (Intel Core Ultra 7 265H) | Dell Pro Max 14 Premium (Intel Core Ultra 9 285H) (NVIDIA RTX PRO 2000) | Dell Pro Max 18 Plus (Intel Core Ultra 9 285HX) (NVIDIA RTX PRO 5000) | Dell Pro Max 16 Plus (Intel Core Ultra 9 285HX) (NVIDIA RTX PRO 5000) |
|---|---|---|---|---|
| Score | 1,014 | 2,174 | 2,368 | 2,172 |
PCMark battery
To measure battery life in mobile systems, we use PCMark 10. It includes a Modern Office benchmark, providing a realistic assessment of battery life during typical workday tasks. It simulates everyday office activities, such as writing documents, browsing the web, and participating in video conferences, with built-in periods of inactivity to mirror how people use their laptops. This isn’t just about peak performance; it focuses on sustained usage under a moderate workload. It helps you understand how long you can expect a laptop to last through a day of office work.
The test operates in 10-minute cycles, balancing active tasks with periods of inactivity. Specifically, the Writing and Web Browsing workloads involve roughly 4.5 minutes of activity followed by 5.5 minutes of inactivity, while Video Conferencing is lighter, at 2 minutes of busy time and 8 minutes of idle time. This approach provides a more accurate representation of real-world battery drain than running demanding tasks continuously, giving you a better idea of longevity for everyday productivity.
The Dell Pro Max 16 Premium lasted 10 hours 2 minutes in the PCMark battery test, the longest of the tested models.
| PCMark Battery (higher is better) | Dell Pro Max 16 Premium (Intel Core Ultra 7 265H) | Dell Pro Max 14 Premium (Intel Core Ultra 9 285HX) (NVIDIA RTX PRO 2000) | Dell Pro Max 18 Plus (Intel Core Ultra 9 285HX) (NVIDIA RTX PRO 5000) | Dell Pro Max 16 Plus (Intel Core Ultra 9 285HX) (NVIDIA RTX PRO 5000) |
|---|---|---|---|---|
| Time Elapsed | 10 Hr 2 Min | 8 Hr 29 Min | 3 Hr 39 Min | 6 Hr 21 Min |
Final Thoughts
The Dell Pro Max 16 Premium hits a compelling balance of performance, mobility, and professional polish. Core Ultra 2 H-class processors keep everyday work and CPU-heavy tasks moving, while the OLED option delivers excellent color and contrast for creative review or client-facing work. With ISV certifications, Intel vPro Enterprise on select CPUs, and Dell’s Control Vault 3, it fits cleanly into managed enterprise fleets. Two M.2 bays with RAID 0 or 1, Thunderbolt 5 alongside Thunderbolt 4, HDMI 2.1, Wi-Fi 7, and a 96Whr battery that can break the 10-hour mark create a practical platform for travel days and mixed office work.
Our configuration relied on Intel Arc integrated graphics, which, of course, limits GPU-accelerated workflows. Buyers who need CAD, 3D, or heavy AI inference should step up to the NVIDIA RTX PRO 1000, 2000, or 3000. Those discrete GPUs, combined with the OLED panel, turn this chassis into a credible mobile workstation for design, modeling, and media tasks without resorting to the larger, heavier Plus models. The Plus line with HX-class CPUs and RTX PRO 5000 will remain the performance leader, but it also comes with higher power draw and more mass. For many teams, the Premium’s thermal behavior, battery longevity, and lighter travel weight will be the better trade.
There are drawbacks. The keyboard layout can slow down power users who lean on function, Home, and End keys, and the absence of USB-A means living the dongle life. WWAN is not available on this model, which matters for some field workflows. None of these issues outweighs the fundamentals. If you want a 16-inch system that feels premium in hand, runs quietly under load, and offers a clean upgrade path to professional graphics, the Pro Max 16 Premium is an easy recommendation.


 Amazon