

Intel’s Core Ultra 7 265K sits in the middle of the Arrow Lake-S desktop stack, pairing 20 cores with a much larger architectural change than you might expect. The layout consists of 8 Lion Cove P-cores and 12 Skymont E-cores, for 20 cores and 20 threads, with Hyper-Threading removed in this generation. The P-cores have a 3.9GHz base frequency and reach 5.4GHz, with Turbo Boost Max 3.0 taking the chip to 5.5GHz. The E-cores run from 3.3GHz to 4.6GHz, and the CPU carries 30MB of L3 cache.
Intel launched the 265K with a recommended customer price (RCP) of $394-$404, while the 265KF, which drops integrated graphics, came in at a lower price of $379-$389. As of this review, the 265K is commonly selling well below RCP, with retail listings in the $290-$343 range, depending on the store and availability.
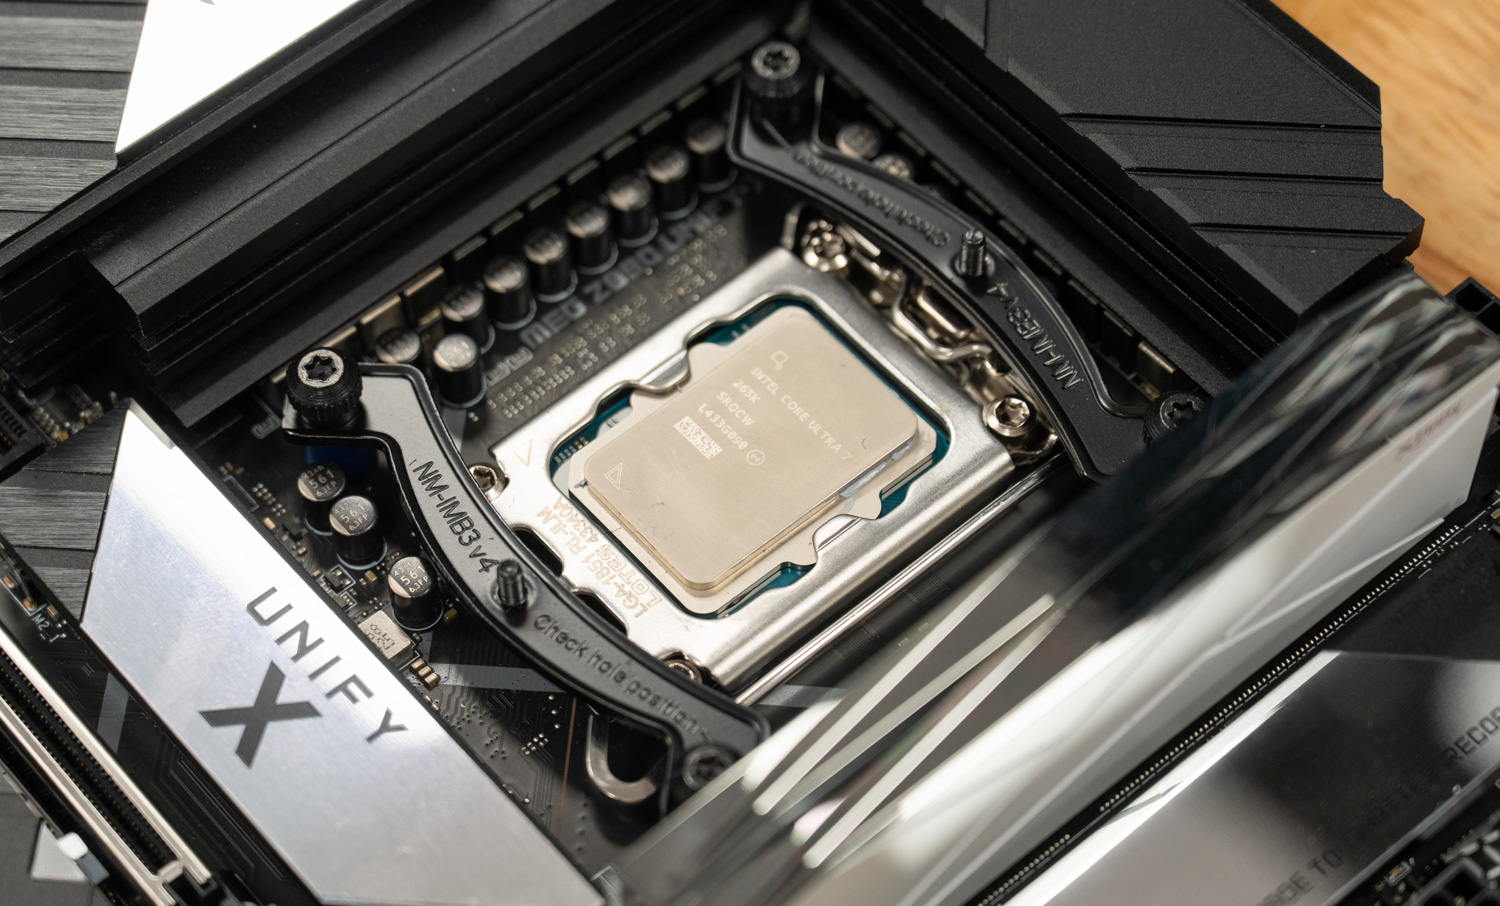
Architecturally, this is not just another Raptor Lake refresh. Arrow Lake-S moves Intel’s desktop K-series to a disaggregated design, with the compute tile built on TSMC’s N3B process and separate graphics, SoC, and I/O tiles linked via Intel’s advanced packaging. The platform also transitions to the LGA1851 socket, so there is no motherboard carryover from LGA1700. For unlocked desktop builds, the Z890 chipset is the natural pairing.
The platform adds official DDR5-6400 support, more headroom for high-speed XMP kits, and a modernized I/O layout with up to 20 PCIe Gen 5 lanes directly from the CPU. The 265K also includes an integrated NPU rated at 13 TOPS. That is well below the 40 TOPS requirement for Copilot+ branding, but it still marks Intel’s push to bring dedicated AI acceleration to enthusiast desktop CPUs. Still, most AI activity on this system will be browser-based.
The main reason to look closely at the 265K is efficiency, not peak throughput. Compared with the Core i7-14700K it effectively replaces, Arrow Lake is designed to deliver similar or better productivity performance while drawing less power in everyday workloads. The trade-off is gaming, and it’s worth calling that out before we get to the benchmarks. Arrow Lake’s higher memory latency, platform changes, and the removal of Hyper-Threading leave the 265K roughly on par with, or slightly behind, the 14700K at 1080p in many launch reviews. At the same time, AMD’s X3D chips still hold an advantage in games that lean heavily on cache. This is a cooler, more efficient desktop CPU, but not one that reshapes the gaming hierarchy.
Our results align with that framing. We tested the 265K on an MSI MEG Z890 Unify-X with 48GB of DDR5 and an NVIDIA RTX 4090, running Windows 11. In Cinebench R23, the chip posted 35,905 multi-core points and 2,267 single-core points. In Cinebench 2024, it scored 2,000 multi-core and 136 single-core. Geekbench 6.4 came in at 3,092 single-core and 20,019 multi-core. The 3DMark CPU Profile shows where the no-Hyper-Threading design lands across thread counts, peaking at 17,269 in the max-threads test while holding a strong 1,343 in single-thread. Threaded compression also scaled well in 7-Zip, with a total rating of 128.9 GIPS across 20 threads, and y-cruncher computed Pi to 5 billion digits in 113 seconds at 89% multi-core efficiency. Against the Ryzen 9 9950X3D and Ryzen 7 9800X3D reference numbers our team pulled, the 265K trades well in threaded work and holds its own in single-thread performance, while the X3D parts keep the gaming cache advantage. As the pricing above shows, those are all costlier chips, so the 265K is holding this ground a full tier down on price.
The full details of the CPU’s performance follow below.
Intel Core Ultra 7 265K Specifications
| Specification | Intel Core Ultra 7 265K |
|---|---|
| General | |
| Processor Family | Intel® Core™ Ultra Processors (Series 2) |
| Model | Intel® Core™ Ultra 7 265K |
| Code Name | Arrow Lake |
| Market Segment | Desktop |
| Launch Date | Q4 2024 |
| MSRP | $394–$404 USD |
| CPU Specifications | |
| Total Cores | 20 (8 Performance + 12 Efficient) |
| Total Threads | 20 |
| Max Turbo Frequency | 5.5 GHz |
| Turbo Boost Max 3.0 | 5.5 GHz |
| P-Core Turbo | 5.4 GHz |
| E-Core Turbo | 4.6 GHz |
| P-Core Base Clock | 3.9 GHz |
| E-Core Base Clock | 3.3 GHz |
| L3 Cache | 30MB Intel Smart Cache |
| L2 Cache | 36MB |
| Processor Base Power | 125W |
| Maximum Turbo Power | 250W |
| CPU AI Performance | 33 TOPS (Overall), Intel AI Boost |
| Memory | |
| Maximum Memory | 256GB |
| Memory Support | DDR5-6400 |
| Memory Channels | 2 |
| ECC Support | Yes |
| Integrated Graphics | |
| GPU | Intel® Graphics |
| Xe-Cores | 4 |
| GPU Frequency | 300 MHz Base / 2.0 GHz Max |
| GPU AI Performance | 8 TOPS (INT8) |
| Display Support | HDMI 2.1, DisplayPort 2.1 UHBR20, eDP 1.4b |
| Maximum Displays | 4 |
| Media Engine | H.264, H.265/HEVC, AV1 Encode/Decode, Intel Quick Sync Video |
| NPU | |
| NPU | Intel® AI Boost |
| NPU Performance | 13 TOPS (INT8) |
| Sparsity Support | Yes |
| Windows Studio Effects | Supported |
| Platform | |
| Socket | FCLGA1851 |
| DMI Revision | 4.0 (8 Lanes) |
| PCI Express | PCIe 5.0 & PCIe 4.0 |
| PCIe Lanes | 24 |
| PCIe Configurations | 1×16+2×4, 2×8+2×4, 1×8+4×4 |
| Thunderbolt Support | Intel Thunderbolt 4 |
| Maximum Operating Temperature | 105°C |
| Package Size | 45 × 37.5 mm |
Intel Core Ultra 7 265K Performance
For testing, the Intel Core Ultra 7 265K was installed in a high-end Z890 desktop platform with a discrete RTX 4090. Full specifications include:
- CPU: Intel Core Ultra 7 265K
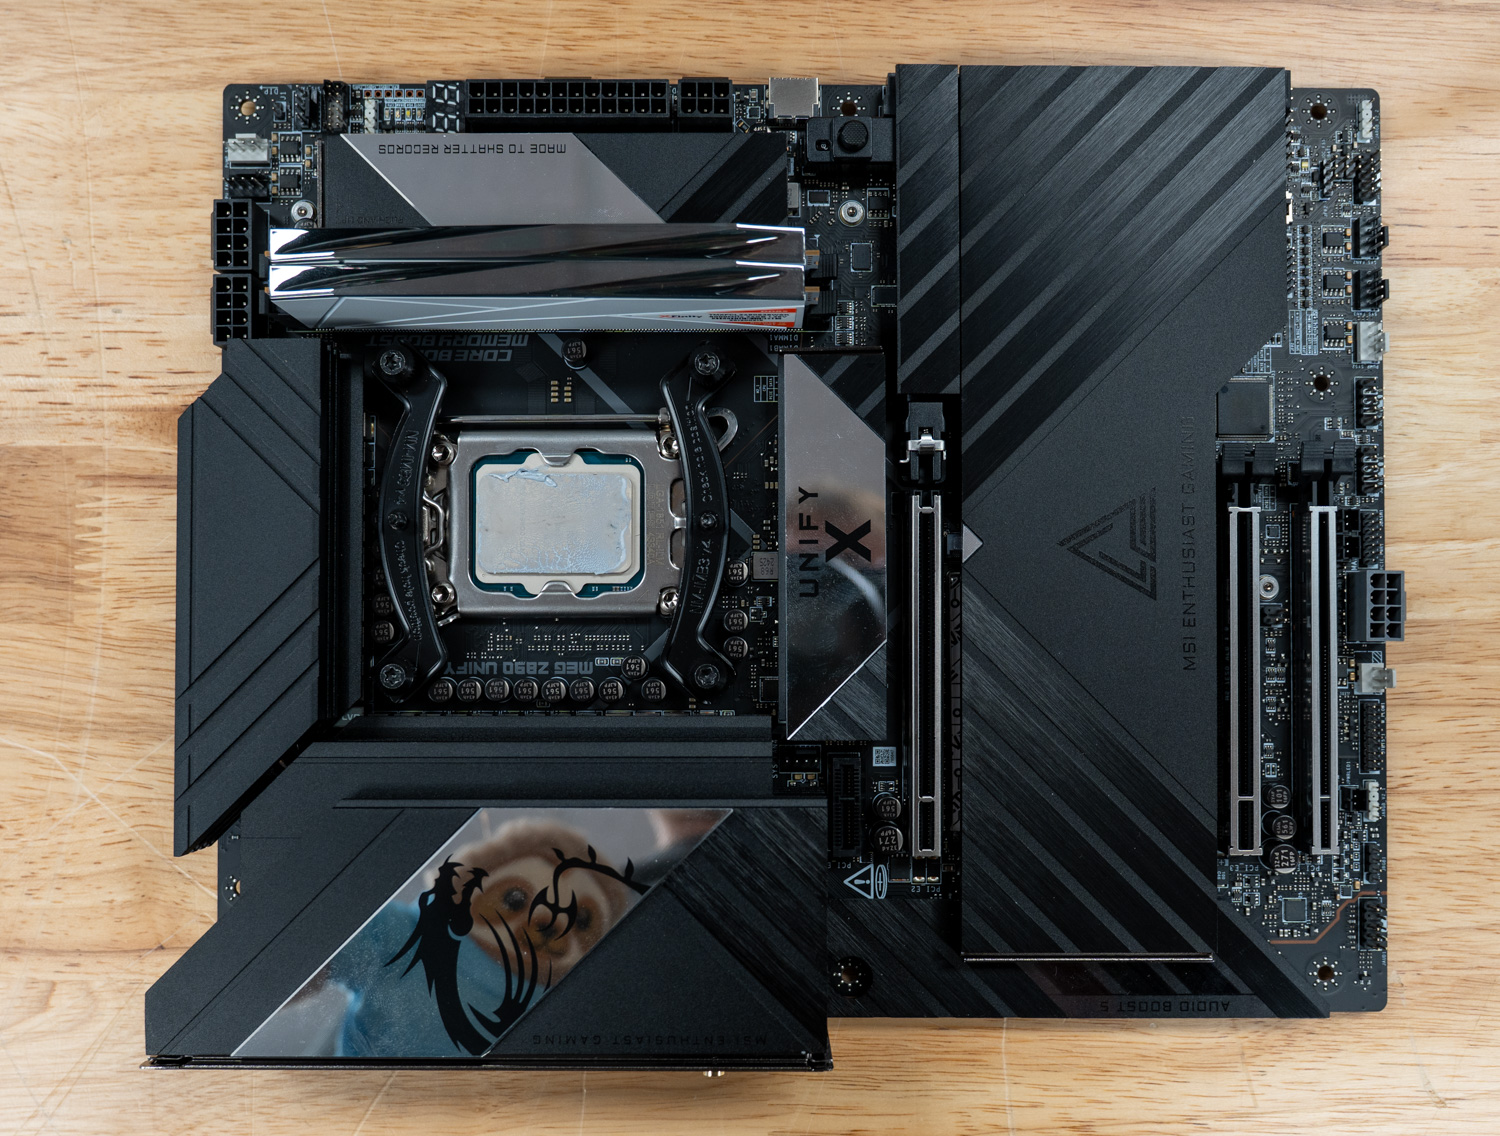
- Motherboard: MSI MEG Z890 Unify-X
- Memory: 48GB DDR5
- Graphics: NVIDIA RTX 4090
- Operating system: Windows 11
To put the 265K’s numbers in context, we compared it against four AMD X3D processors we have run through the same StorageReview CPU test suite: the Ryzen 7 9800X3D, the Ryzen 7 9850X3D, the flagship Ryzen 9 9950X3D, and the dual-cache Ryzen 9 9950X3D2 Dual Edition. All four are gaming-focused parts built around AMD’s stacked 3D V-Cache, and all sit above the $ 265K price point, from the $479 9800X3D up to the $899 9950X3D2. The 265K, by contrast, streets around $300, so it is competing against chips that cost roughly 1.5x to 3x as much. The results below are worth reading with that gap in mind.
| Processor | Price |
|---|---|
| Intel Core Ultra 7 265K | $394–$404 RCP (~$290–$343 street) |
| AMD Ryzen 7 9800X3D | $479 MSRP (~$450 street) |
| AMD Ryzen 7 9850X3D | $499 |
| AMD Ryzen 9 9950X3D | $699 MSRP (~$675 street) |
| AMD Ryzen 9 9950X3D2 Dual Edition | $899 |
3DMark CPU Profile
The 3DMark CPU Profile measures CPU performance across different workloads by testing 1, 2, 4, 8, 16, and max threads. It highlights how the CPU handles single-threaded tasks, gaming workloads, and multithreaded applications such as 3D rendering. The benchmark minimizes GPU impact, providing a clear view of CPU performance across various scenarios.
The Core Ultra 7 265K performs very well in 3DMark CPU Profile, especially at lower thread counts. Its 17,269 max-thread score puts it just behind the stronger Ryzen 9 9950X3D result, while staying ahead of the other 9950X3D run and far ahead of the 8-core X3D chips. The 16-thread result trails both Ryzen 9 samples, which is where the lack of Hyper-Threading shows up, but the 265K takes the lead at 8, 2, and 1 threads. Overall, that is a good result for Arrow Lake, with strong single-thread and lightly threaded scores helping balance out the weaker scaling at 16 threads.
| 3DMark CPU Profile (higher is better) | Intel Core Ultra 7 265K | AMD Ryzen 9 9950X3D2 | AMD Ryzen 9 9950X3D | AMD Ryzen 7 9850X3D | AMD Ryzen 7 9800X3D |
|---|---|---|---|---|---|
| Max Threads | 17,269 | 17,672 | 16,690 | 10,261 | 10,018 |
| 16 Threads | 14,968 | 16,956 | 15,983 | 10,285 | 10,034 |
| 8 Threads | 9,567 | 9,141 | 9,070 | 8,611 | 8,269 |
| 4 Threads | 4,973 | 4,980 | 4,846 | 4,867 | 4,646 |
| 2 Threads | 2,626 | 2,508 | 2,521 | 2,487 | 2,394 |
| 1 Threads | 1,343 | 1,274 | 1,264 | 1,267 | 1,213 |
y-cruncher
y-cruncher is a popular benchmarking and stress-testing application launched in 2009. This multithreaded, scalable test computes Pi and other constants to trillions of digits. Faster is better in this test.
Results were a bit more mixed for the 265K with y-cruncher. Compared to the fastest Ryzen 9 9950X3D result, the Intel chip is quite a bit slower, taking 17.979 seconds at 1 billion digits, 50.679 seconds at 2 billion digits, and 113.078 seconds at 5 billion digits. It is much closer to the other 9950X3D sample, though, and it stays ahead of the Ryzen 7 9800X3D across all three runs. The 9950X3D2 result is the outlier, but against the rest of the group, the 265K is still decent for heavier compute work.
| y-cruncher (lower time is better) | Intel Core Ultra 7 265K | AMD Ryzen 9 9950X3D2 | AMD Ryzen 9 9950X3D | AMD Ryzen 7 9850X3D | AMD Ryzen 7 9800X3D |
|---|---|---|---|---|---|
| 1 Billion | 17.979 s | 12.605 s | 16.450 s | 18.503 s | 21.487 s |
| 2 Billion | 50.679 s | 34.925 s | 48.047 s | 52.589 s | 64.273 s |
| 5 Billion | 113.078s | 77.370 s | 109.343 s | 115.581 s | 143.891 s |
y-cruncher BBP
This y-cruncher benchmark uses the Bailey-Borwein-Plouffe (BBP) formulas to compute a large number of hexadecimal digits of Pi and measures the CPU’s total computation time, utilization, and multi-core efficiency.
At 1 BBP, 10 BBP, and 100 BBP, the Intel Core Ultra 7 265K trails every Ryzen chip in the table, with the gap widening over the long run. At 100 BBP, the Intel chip takes 104.952 seconds, compared with 50.291 seconds for the regular Ryzen 9 9950X3D and just 47.070 seconds for the fastest 9950X3D result. This is one of the weaker results for the 265K, especially compared with how competitive it looked in the regular y-cruncher Pi tests.
| y-cruncher BBP (lower time is better) | Intel Core Ultra 7 265K | AMD Ryzen 9 9950X3D2 | AMD Ryzen 9 9950X3D | AMD Ryzen 7 9850X3D | AMD Ryzen 7 9800X3D |
|---|---|---|---|---|---|
| 1 BBP | 0.876 s | 0.384 s | 0.426 s | 0.669 s | 0.671 s |
| 10 BBP | 9.654 s | 4.173 s | 4.538 s | 7.501 s | 7.497 s |
| 100 BBP | 104.952 s | 47.070 s | 50.291 s | 83.719 s | 83.345 s |
Maxon Cinebench
Cinebench is a widely used benchmarking tool that measures CPU and GPU performance by rendering in Maxon Cinema 4D. It provides a score that lets you compare the performance of different systems and components. We ran R23 and R24, both popular Cinebench versions, so you can compare the results with those on popular online leaderboards.
Cinebench R23
The Core Ultra 7 265K performed well here, posting 35,905 multi-core points in R23. This put it behind the two Ryzen 9 9950X3D results but well ahead of both Ryzen 7 X3D chips. The single-core score is even better, with the 265K taking the top spot at 2,267 points.
| Cinebench R23 (higher is better) | Intel Core Ultra 7 265K | AMD Ryzen 9 9950X3D2 | AMD Ryzen 9 9950X3D | AMD Ryzen 7 9850X3D | AMD Ryzen 7 9800X3D |
|---|---|---|---|---|---|
| Multi-Core | 35,905 | 42,555 | 39,993 | 21,382 | 22,718 |
| Single-Core | 2,267 | 2,248 | 2,200 | 2,216 | 2,089 |
Cinebench R24
Cinebench 2024 follows a similar pattern, with the 265K behind the Ryzen 9 parts in multi-core but ahead of the Ryzen 7 chips. Its 136-point single-core score is near the top of the group. For rendering-style CPU work, the 265K does not beat the 16-core Ryzen 9 chips, but it performs well given its core and thread layout.
| Cinebench R24 (higher is better) | Intel Core Ultra 7 265K | AMD Ryzen 9 9950X3D2 | AMD Ryzen 9 9950X3D | AMD Ryzen 7 9850X3D | AMD Ryzen 7 9800X3D |
|---|---|---|---|---|---|
| Multi-Core | 2,000 | 2,508 | 2,246 | 1,366 | 1,338 |
| Single-Core | 136 | 143 | 134 | 142 | 130 |
7-Zip Compression
The 7-Zip Compression Benchmark evaluates CPU performance during compression and decompression by measuring GIPS (Giga Instructions Per Second) and CPU usage. Higher GIPS and efficient CPU usage indicate superior performance.
Overall, 7-Zip shows the 265K performing better at decompression than at compression. Its compression rating of 109.475 GIPS trails the Ryzen 9 chips and also falls behind the Ryzen 7 9850X3D and 9800X3D, even though its CPU usage is higher than on the 8-core parts. Decompression is stronger, with the 265K reaching 148.292 GIPS and beating both Ryzen 7 X3D chips, though it is still far behind the Ryzen 9 9950X3D results. The total rating of 128.883 GIPS puts it slightly ahead of the 9800X3D, just behind the 9850X3D, and well behind the 16-core Ryzen parts.
| 7-Zip Compression | Intel Core Ultra 7 265K | AMD Ryzen 9 9950X3D2 | AMD Ryzen 9 9950X3D | AMD Ryzen 7 9850X3D | AMD Ryzen 7 9800X3D |
|---|---|---|---|---|---|
| Compressing | |||||
| Current CPU Usage | 1,538% | 2,736% | 2,737% | 1,394% | 1,387% |
| Current Rating/Usage | 7.098 GIPS | 7.132 GIPS | 6.565 GIPS | 8.864 GIPS | 8.488 GIPS |
| Current Rating | 109.161 GIPS | 195.145 GIPS | 179.648 GIPS | 123.563 GIPS | 117.745 GIPS |
| Resulting CPU Usage | 1,541% | 2,717% | 2,727% | 1,390% | 1,393% |
| Resulting Rating/Usage | 7.106 GIPS | 7.186 GIPS | 6.531 GIPS | 8.852 GIPS | 8.466 GIPS |
| Resulting Rating | 109.475 GIPS | 195.272 GIPS | 178.094 GIPS | 123.073 GIPS | 117.895 GIPS |
| Decompressing | |||||
| Current CPU Usage | 1,870% | 3,148% | 3,034% | 1,564% | 1,570% |
| Current Rating/Usage | 7.992 GIPS | 8.674 GIPS | 8.207 GIPS | 8.821 GIPS | 8.365 GIPS |
| Current Rating | 149.435 GIPS | 273.103 GIPS | 248.987 GIPS | 137.919 GIPS | 135.527 GIPS |
| Resulting CPU Usage | 1,854% | 3,134% | 3,036% | 1,567% | 1,564% |
| Resulting Rating/Usage | 8.000 GIPS | 8.643 GIPS | 8.242 GIPS | 8.820 GIPS | 8.663 GIPS |
| Resulting Rating | 148.292 GIPS | 270.917 GIPS | 250.233 GIPS | 138.223 GIPS | 135.448 GIPS |
| Total Rating | |||||
| Total CPU Usage | 1,697% | 2,926% | 2,882% | 1,479% | 1,478% |
| Total Rating/Usage | 7.553 GIPS | 7.915 GIPS | 7.387 GIPS | 8.836 GIPS | 8.564 GIPS |
| Total Rating | 128.883 GIPS | 233.094 GIPS | 214.163 GIPS | 130.648 GIPS | 126.671 GIPS |
UL Procyon
UL Procyon AI Inference is designed to gauge a workstation’s performance in professional applications. This test does not leverage multiple CPU capabilities. Specifically, this tool benchmarks the workstation’s ability to handle AI-driven tasks and workflows, providing a detailed assessment of its efficiency and speed in processing complex AI algorithms and applications.
The 265K delivers a middle-of-the-pack result in UL Procyon AI Computer Vision, with an overall score of 216. That places it just behind the regular Ryzen 9 9950X3D at 220 and ahead of both Ryzen 7 X3D chips, but behind the faster 9950X3D2 score of 271. The individual model results vary a fair bit, as well. MobileNet V3 is quick on the 265K, and YOLO V3 is stronger than the regular 9950X3D and both Ryzen 7 chips, but ResNet 50, DeepLab V3, and REAL-ESRGAN favor the Ryzen 9 results. It is a respectable CPU-based AI result, but the 265K doesn’t stand out from the group.
| UL Procyon (higher score & lower ms is better) | Intel Core Ultra 7 265K | AMD Ryzen 9 9950X3D2 | AMD Ryzen 9 9950X3D | AMD Ryzen 7 9850X3D | AMD Ryzen 7 9800X3D |
|---|---|---|---|---|---|
| Overall AI Computer Vision Score | 216 | 271 | 220 | 209 | 188 |
| MobileNet V3 | 0.84 ms | 0.97 ms | 0.94 ms | 0.70 ms | 0.61 ms |
| ResNet 50 | 5.95 ms | 3.76 ms | 5.33 ms | 5.95 ms | 7.01 ms |
| Inception V4 | 17.25 ms | 13.90 ms | 17.12 ms | 19.34 ms | 22.28 ms |
| DeepLab V3 | 22.75 ms | 19.26 ms | 21.70 ms | 20.40 ms | 23.98 ms |
| YOLO V3 | 28.30 ms | 24.93 ms | 35.27 ms | 48.17 ms | 56.07 ms |
| REAL-ESRGAN | 2034.57 ms | 1,593.81 ms | 2,037.51 ms | 2,348.97 ms | 2,728.62 ms |
PCMark10
PCMark 10 evaluates CPU performance by simulating real-world office productivity tasks such as word processing, web browsing, video conferencing, and spreadsheet calculations. The benchmark combines workloads that reflect modern workplace demands, providing a comprehensive assessment of how a CPU handles day-to-day applications.
The 265K delivered modest results on its PCMark 10 test system, producing an overall score of 9,940. That places it behind all comparable Ryzen chips, including both Ryzen 7 X3D parts. While the gap isn’t huge, it’s still the lowest score in the group, with the Ryzen 9 9950X3D reaching 10,849 and the Ryzen 7 9800X3D scoring 10,250. For general productivity testing, the 265K is still fast, but the AMD chips have the edge in this benchmark.
| PCMark10 (higher is better) | Intel Core Ultra 7 265K | AMD Ryzen 9 9950X3D2 | AMD Ryzen 9 9950X3D | AMD Ryzen 7 9850X3D | AMD Ryzen 7 9800X3D |
|---|---|---|---|---|---|
| Overall Score | 9,940 | 10,650 | 10,849 | 10,461 | 10,250 |
SPECworkstation 4.4.0
SPECworkstation 4 specializes in benchmarks that test all key aspects of workstation performance. It uses over 30 workloads to evaluate CPU, graphics, I/O, and memory bandwidth. The workloads fall into broader categories, including Media and Entertainment, Financial Services, Product Development, Energy, Life Sciences, and General Operations. We will list each broad-category result rather than the individual workloads. The results are averages across all individual workloads in each category.
SPECworkstation gives the 265K a solid set of results, with its best showings in Life Sciences and Product Design. In Life Sciences, it scores 2.70, essentially matching the regular Ryzen 9 9950X3D at 2.71 and beating the faster 9950X3D2 result. Product Design is also strong at 2.54, ahead of the regular 9950X3D and both Ryzen 7 chips, though still behind the 9950X3D2. The weaker areas are AI and Machine Learning, Financial Services, and Media and Entertainment, where the Ryzen 9 chips pull ahead. The 265K is competitive in several workstation categories, but the 16-core Ryzen 9 parts still have the bigger advantage across the full SPECworkstation set.
| SPECworkstation 4.4.0 (higher is better) | Intel Core Ultra 7 265K | AMD Ryzen 9 9950X3D2 | AMD Ryzen 9 9950X3D | AMD Ryzen 7 9850X3D | AMD Ryzen 7 9800X3D |
|---|---|---|---|---|---|
| AI & Machine Learning | 2.75 | 3.96 | 3.30 | 2.95 | 2.92 |
| Energy | 2.59 | 3.22 | 2.66 | 2.20 | 2.13 |
| Financial Services | 1.99 | 2.63 | 2.48 | 1.42 | 1.42 |
| Life Sciences | 2.70 | 2.62 | 2.71 | 2.11 | 2.15 |
| Media & Entertainment | 3.05 | 3.39 | 3.34 | 2.56 | 2.57 |
| Product Design | 2.54 | 2.75 | 2.43 | 2.14 | 2.08 |
| Productivity & Development | 1.27 | 1.39 | 1.28 | 1.14 | 1.12 |
Conclusion
The Core Ultra 7 265K is the clearest example yet of what Arrow Lake is for. In our testing, it delivered strong single-thread performance, solid lightly threaded results, and respectable multi-core output for a 20-core, 20-thread design, all while running cooler and drawing less power than the Core i7-14700K it replaces. Gaming and the most heavily threaded workloads remain the weak spots, where AMD’s cache-heavy X3D parts still lead. The context that matters is price: those X3D chips run from roughly 1.5x to 3x the 265K’s street cost, so it is losing those specific contests to processors in a different price class. Judged where it actually competes, around $300, the 265K is an easy recommendation for productivity, content creation, efficiency, and platform features, and a harder sell only for buyers building strictly around top-end frame rates.

For those who want more from Intel, the Core Ultra 200S Plus refresh sits directly above it on the same LGA1851 platform. The Core Ultra 7 270K Plus adds four E-cores for 24 total, raises die-to-die frequency by up to 900 MHz to trim system latency, supports DDR5-7200, and includes Intel’s Binary Optimization Tool for select games, a higher-performance option without changing motherboards. But priced well below its $394-$404 launch RCP, the 265K is the value anchor of the lineup and the CPU that makes Arrow Lake’s efficiency argument the easiest to accept.


 Amazon