

AMD silicon arguably got here first: Strix Halo mini PCs and laptops were shipping with 128GB of unified memory well before NVIDIA entered the picture. But the local-AI desktop as a category is one NVIDIA effectively created when it put a Grace Blackwell superchip in a one-liter box and called it DGX Spark. The pitch was simple: a developer-class machine with enough unified memory to hold capable models, sitting on a desk instead of metered in the cloud. The AMD Ryzen AI Halo is AMD’s answer to that machine. AMD announced it alongside the Ryzen AI Max PRO 400 Series in May 2026; pre-orders opened in June exclusively through Micro Center, with in-store availability July 10th. Ryzen AI Halo arrives with a similar footprint, 128GB of unified memory, a $3,999 price, and a short list of decisions that make it a significantly different proposition than the Spark.
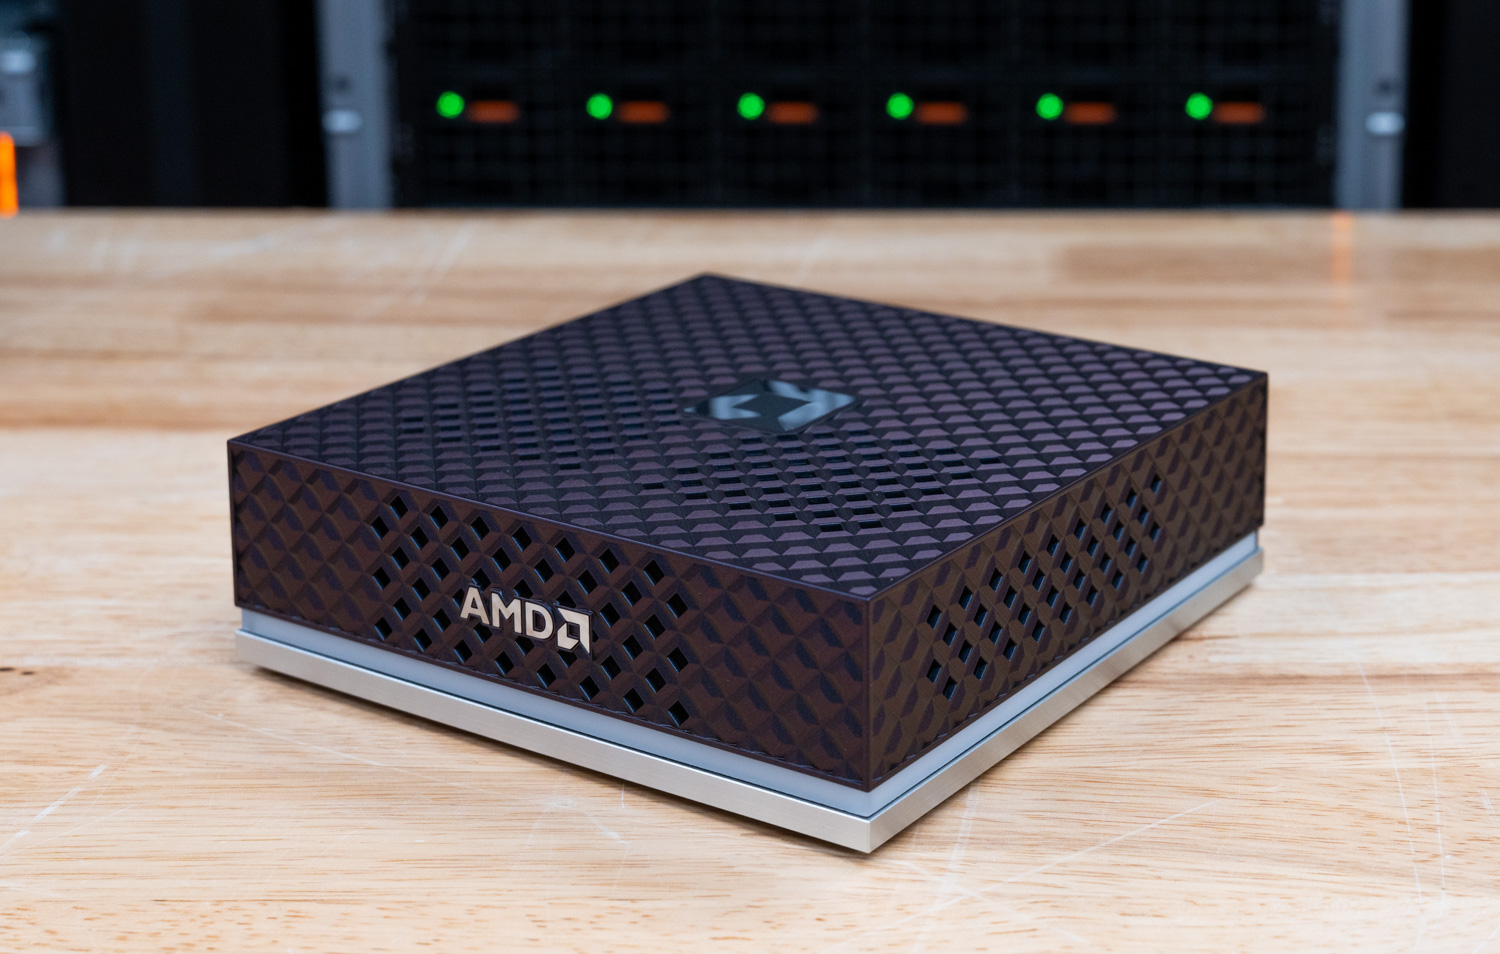
AMD bills the Halo as its first AI developer platform, giving developers a fast, low-friction path to build and run AI locally. Under the hood is the Ryzen AI Max+ 395, a 16-core, 32-thread “Zen 5” part with Radeon 8060S integrated graphics (40 RDNA 3.5 compute units) and an XDNA 2 NPU rated at 50 TOPS, all within a platform AMD markets at up to 126 TOPS of combined AI throughput. The 128GB of LPDDR5x runs at 8000 MT/s, delivering 256 GB/s of bandwidth, and the whole platform draws power from a single USB-C input rated at 120W. AMD says the memory pool is sufficient to hold models with up to 200 billion parameters in device memory. It is a complete x86 mini-workstation, which is the root of the difference that matters most.
That difference is Windows. The Spark runs NVIDIA’s Linux-based DGX OS and nothing else; the Halo boots Windows 11 or AMD’s Linux developer image on the same hardware. Native Windows support was the single most common request we heard from people eyeing a Spark, and it reshapes who the box is for. AMD’s own positioning makes the same point: Windows and Linux versus Spark’s Linux-only (as of today, anyway).
Three more decisions separate the Halo from the Spark, and each addresses a complaint we have heard about the incumbent. The Halo uses a standard M.2 2280 SSD rather than the less common 2242 drive the Spark fits, which opens up a much larger pool of aftermarket options, including 8TB capacities, for anyone who wants to replace the drive. It ships with Variable Graphics Memory pre-set to its maximum allocation on both operating systems, so large models load without manual tuning. It also wraps the chassis in a lit status ring, a small correction to the dark, lightless Spark units some buyers received, depending on the OEM. The cost of AMD’s approach shows up at the back of the box, where there is no high-speed fabric, only 10GbE, which caps what you can do with multi-node clustering. Those are the trade-offs, and they define the workloads this machine is built for before any benchmark runs.
On price, the nuance matters. The Halo lists at $3,999 with a 2TB SSD, placing it right at the going rate for a base Spark-class system. The comparison depends on which Spark you mean. NVIDIA’s own DGX Spark with the larger drive now runs closer to $4,700, a move tied to the LPDDR5X and NAND supply crunch. Base Grace Blackwell systems from ASUS and others still sell around $4,000 and are listed on Amazon today (affiliate link). Measured against the category baseline, the Halo is at parity, and its case rests on the decisions above rather than on undercutting the field.
We ran the Halo through StorageReview’s local AI suite on both Windows and Linux, and the results are presented alongside the design and software analysis throughout this review.
Key Takeaways
- The dual-OS x86 alternative: Ryzen AI Halo is the only box in the Spark’s category that boots Windows 11 or Linux on a full x86 platform, at $3,999 with a 2TB SSD against the DGX Spark Founders Edition’s $4,699.
- Memory to hold big models: 128GB of LPDDR5x-8000 unified memory at 256GB/s supports models up to 200 billion parameters locally, with Variable Graphics Memory pre-tuned so large models load without manual configuration.
- The strongest Ryzen AI Max+ 395 we’ve tested: The Halo topped the HP Z2 Mini G1a and ZBook Ultra G1a in nearly every Windows workload, including 37,316 in Cinebench R23 multi-core, 184.2 GIPS in 7-Zip, and the leading Procyon AI text generation (Phi 1,192) and image generation (SD 1.5 FP16 937) scores.
- CPU wins, inference losses vs. Spark: On Linux the Halo beat the DGX Spark outright in CPU work, compressing 11% faster and decompressing 38% faster in 7-Zip and finishing the LLVM compile 14% sooner, but trailed 2x to 4x in most vLLM serving scenarios at higher concurrency, stretching to 8.8x in prefill-heavy GPT OSS 120B work.
- Serviceable storage, modest networking: A standard M.2 2280 bay opens aftermarket upgrades to 8TB, though the platform negotiates the included Gen5 Micron 4600 down to Gen4 by design, and the single 10GbE port with no high-speed fabric rules out the multi-node clustering the Spark’s 200G ConnectX-7 enables.
Specifications
| Specification | AMD Ryzen AI Halo System |
|---|---|
| Processor | |
| CPU | AMD Ryzen™ AI Max+ 395 Processor 16 Cores / 32 Threads (Zen 5 Architecture) |
| GPU | AMD Radeon™ 8060S Integrated Graphics 40 Compute Units (RDNA™ 3.5 Architecture) |
| NPU | AMD XDNA™ 2 NPU |
| Memory | |
| Memory Type | LPDDR5x |
| Memory Capacity | 128GB |
| Memory Speed | 8000MT/s |
| Memory Bandwidth | 256GB/s |
| Storage | |
| Storage | 2TB M.2 NVMe SSD (SED) |
| Networking & Connectivity | |
| Ethernet | 1 × 10GbE |
| Wi-Fi | Wi-Fi 7 |
| Bluetooth | Bluetooth 5.4 |
| I/O | |
| USB | 3 × USB-C, 1 × USB-C (Power Input) |
| Display Output | 1 × HDMI 2.1b |
| System | |
| TDP | 120W |
| Operating System | Linux or Windows 11 |
| Dimensions | 150 × 150 × 45.4 mm (5.9 × 5.9 × 1.79 in) |
| Weight | Less than 1.2 kg (2.65 lbs) |
AMD Ryzen AI Halo Build and Design
The AMD Ryzen AI Halo system uses a compact, “NVIDIA Spark”-like form factor, measuring just 150 × 150 × 45.4mm and weighing less than 1.2kg (2.65lbs). The aluminum chassis features an aggressive geometric ventilation pattern across the top and front, giving the system a distinctive appearance while maximizing airflow into the cooling system. Despite its small footprint, the platform is designed as a full desktop AI workstation capable of handling workstation applications, local LLM inference, and AI development workloads.
Front
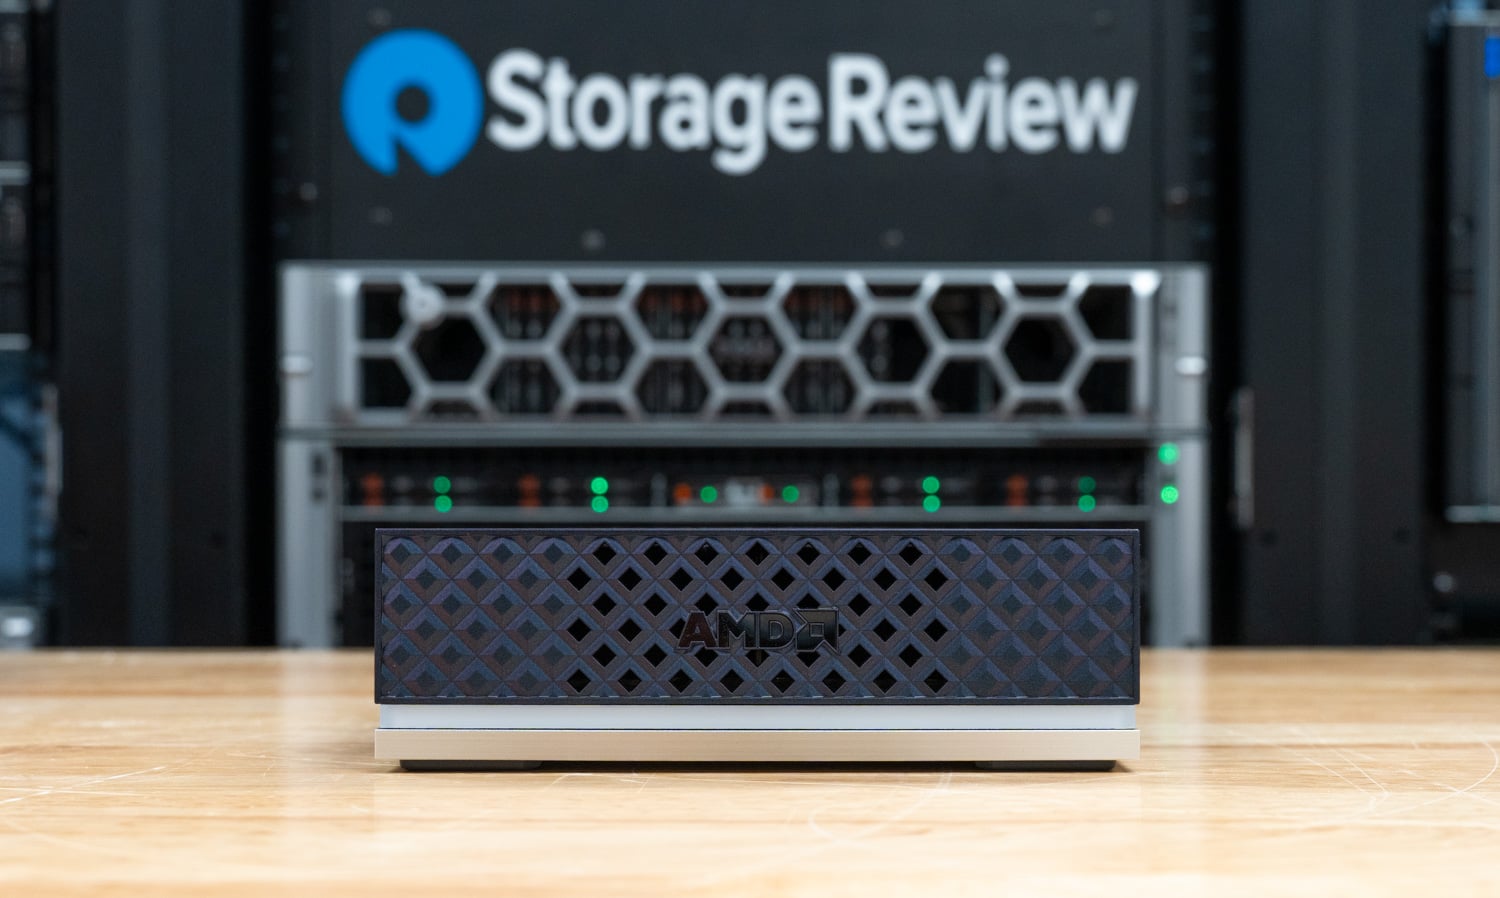
The front of the system is intentionally clean, consisting almost entirely of a large mesh ventilation grille that spans the chassis width. Rather than placing ports on the front, AMD dedicates this area to airflow, allowing cool air to enter the system through the large patterned intake while keeping the front uncluttered. A silver accent along the bottom of the chassis provides subtle visual contrast to the otherwise matte black enclosure.
Rear I/O
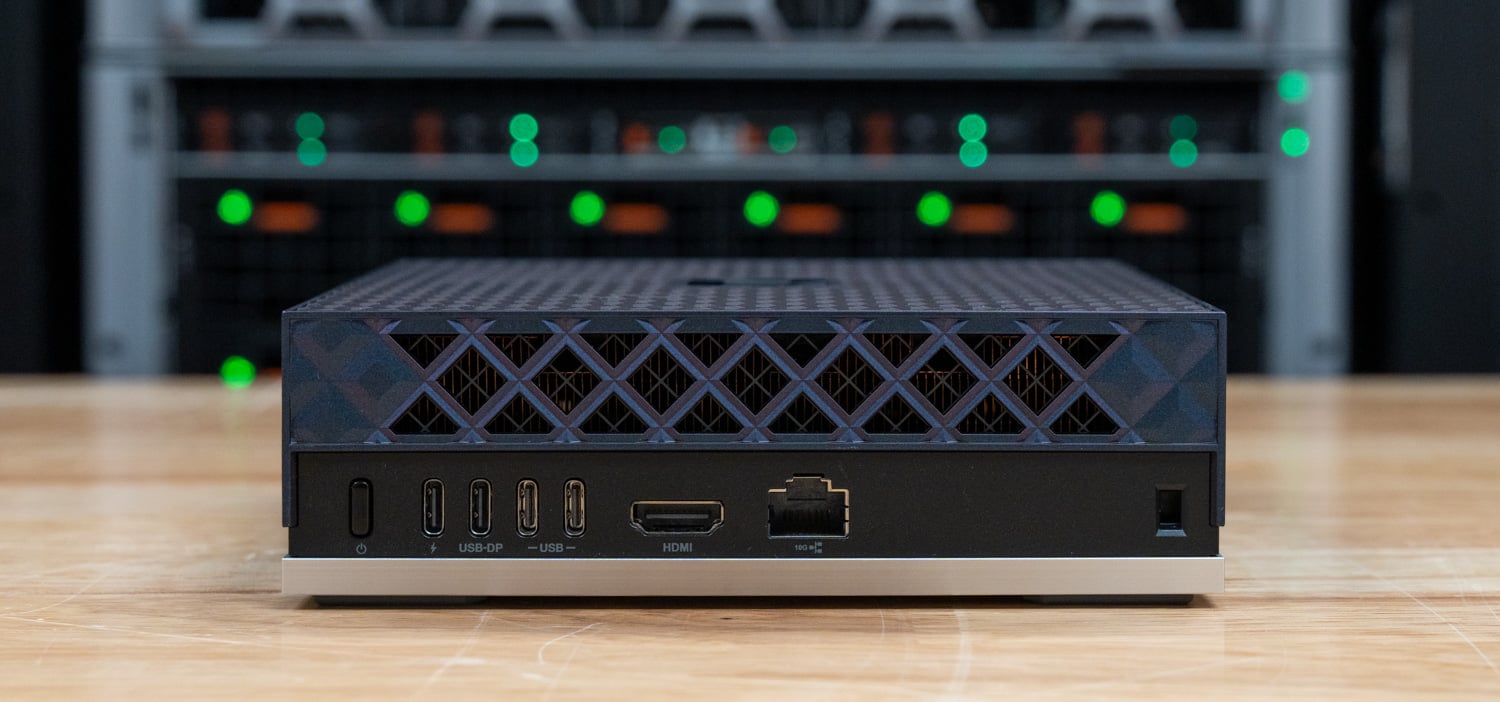
All external connectivity is located on the rear of the system. From left to right, the rear panel includes the following:
- USB-C power input
- USB-C port with DisplayPort Alt Mode
- Two additional USB-C ports
- HDMI 2.1b output
- 10GbE RJ45 Ethernet
- Kensington security lock slot
The system provides three USB-C data ports alongside a dedicated USB-C power connector, enabling multiple high-speed peripherals and displays to connect simultaneously. HDMI 2.1b provides native display output, while the integrated 10GbE Ethernet interface makes the platform well suited for high-speed NAS connectivity, AI dataset transfers, and local development environments.
Internal Design
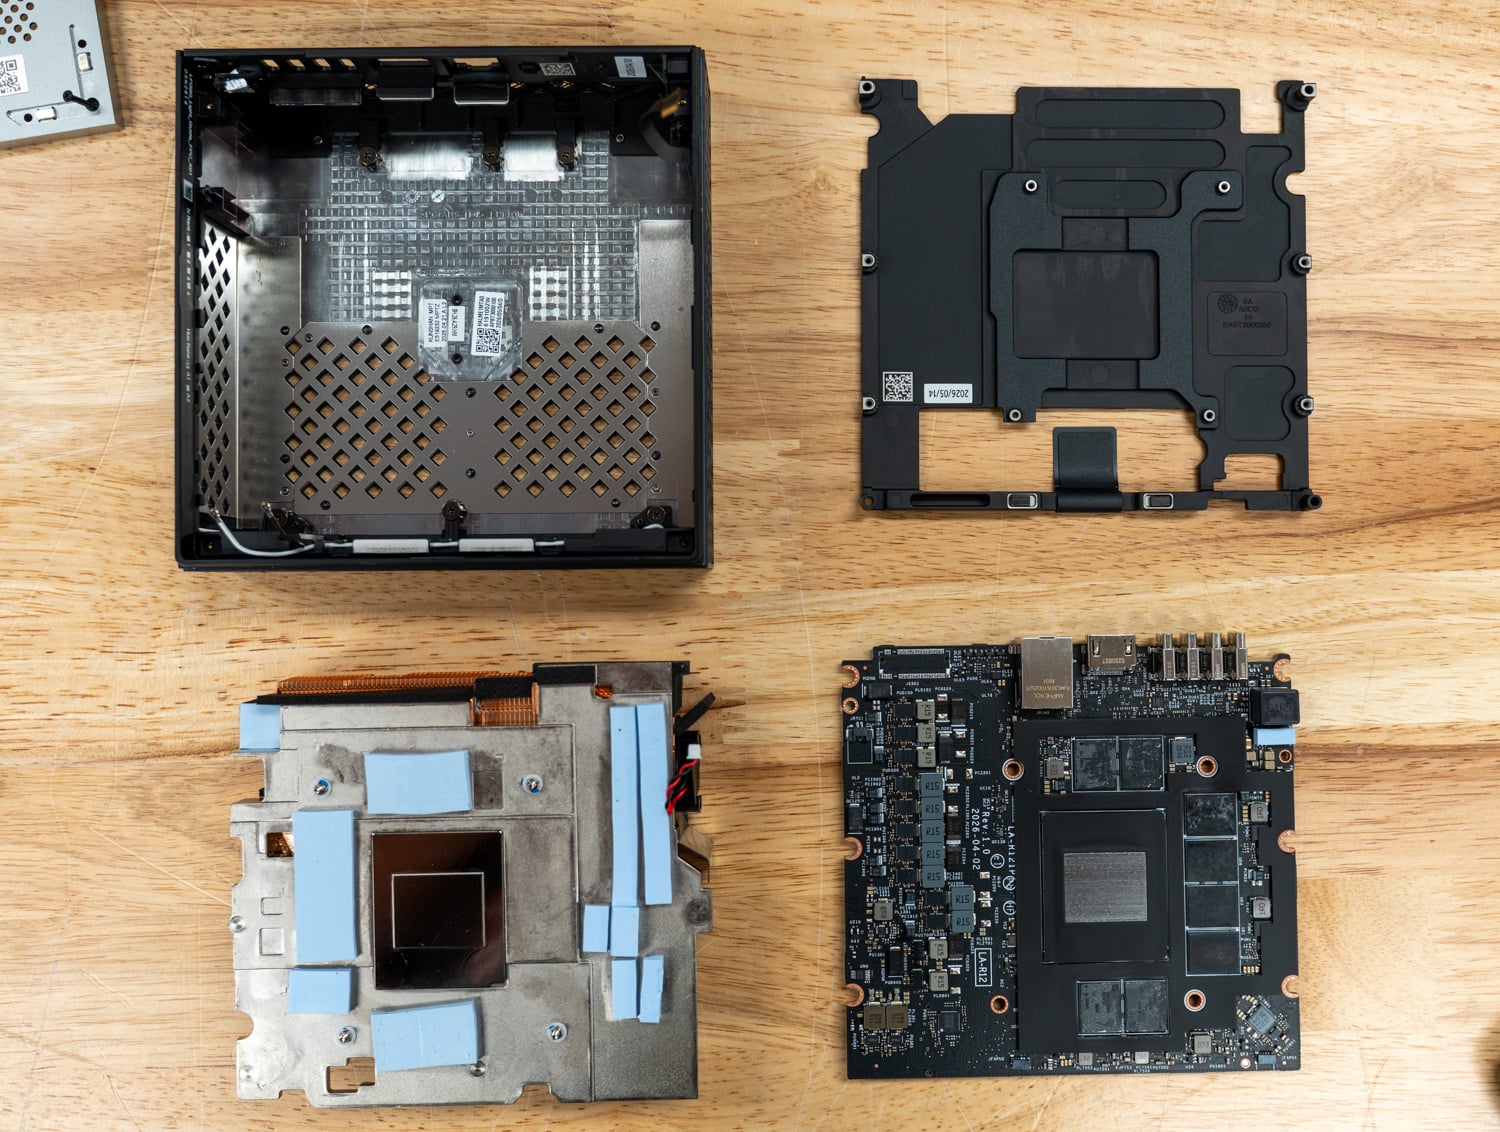
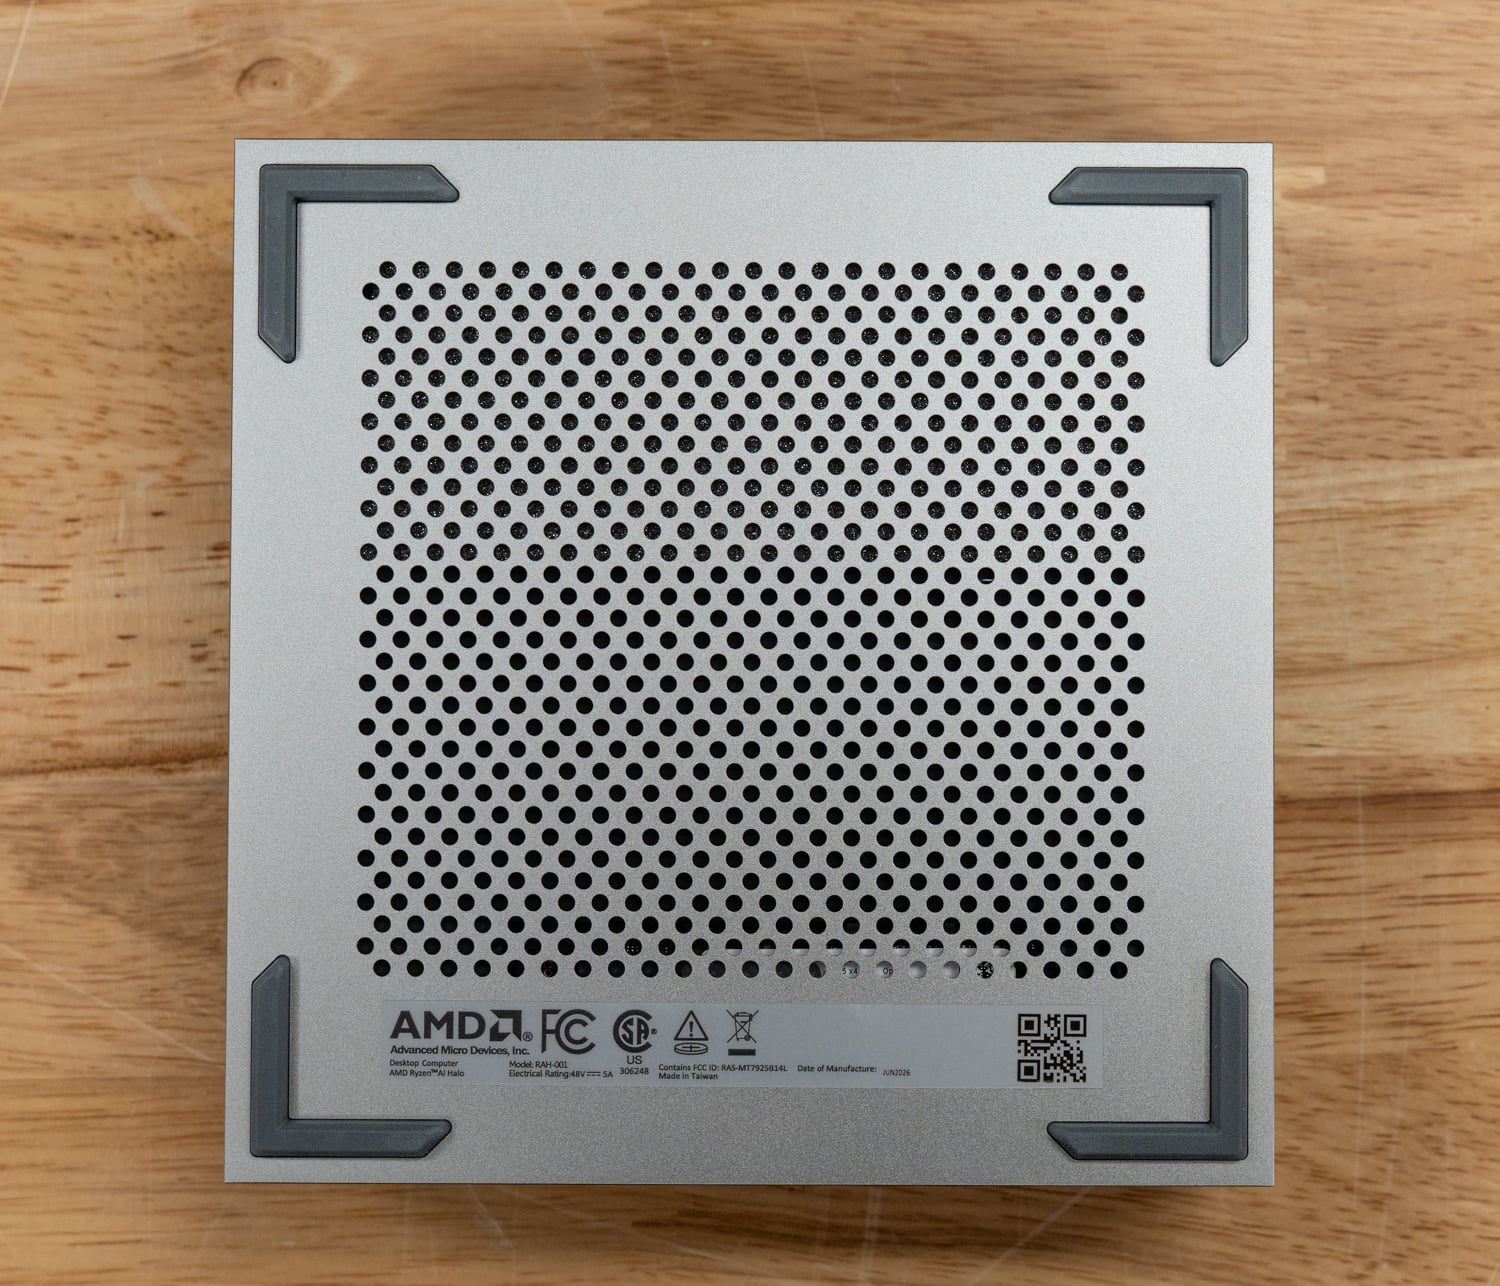
The underside of the Ryzen AI Halo features a large perforated vent that draws in air to cool the components mounted along the bottom of the board, and four rubber feet at the corners keep the unit stable on a desk or shelf.
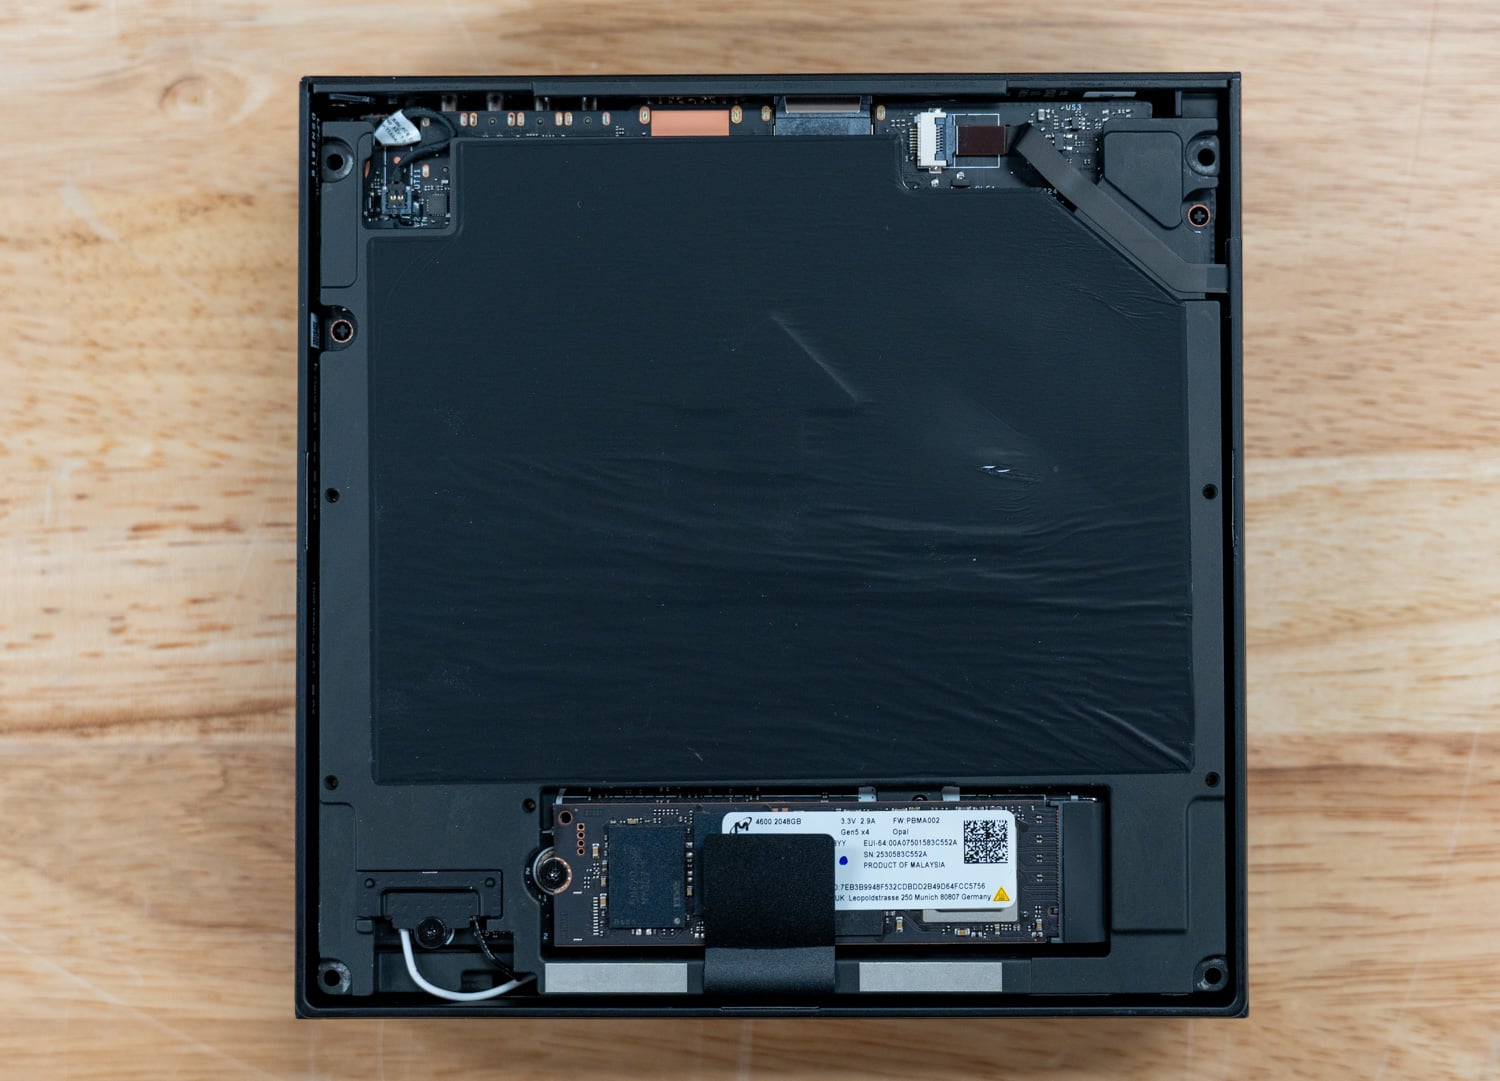
Removing the four screws securing the bottom panel reveals the M.2 SSD bay and a few of the system’s lower-board components, including the Wi-Fi card connector. In our review unit, that slot holds a Micron 4600 2TB Gen5 x4 SSD, while a black adhesive sheet shields the rest of the board from the exposed underside.
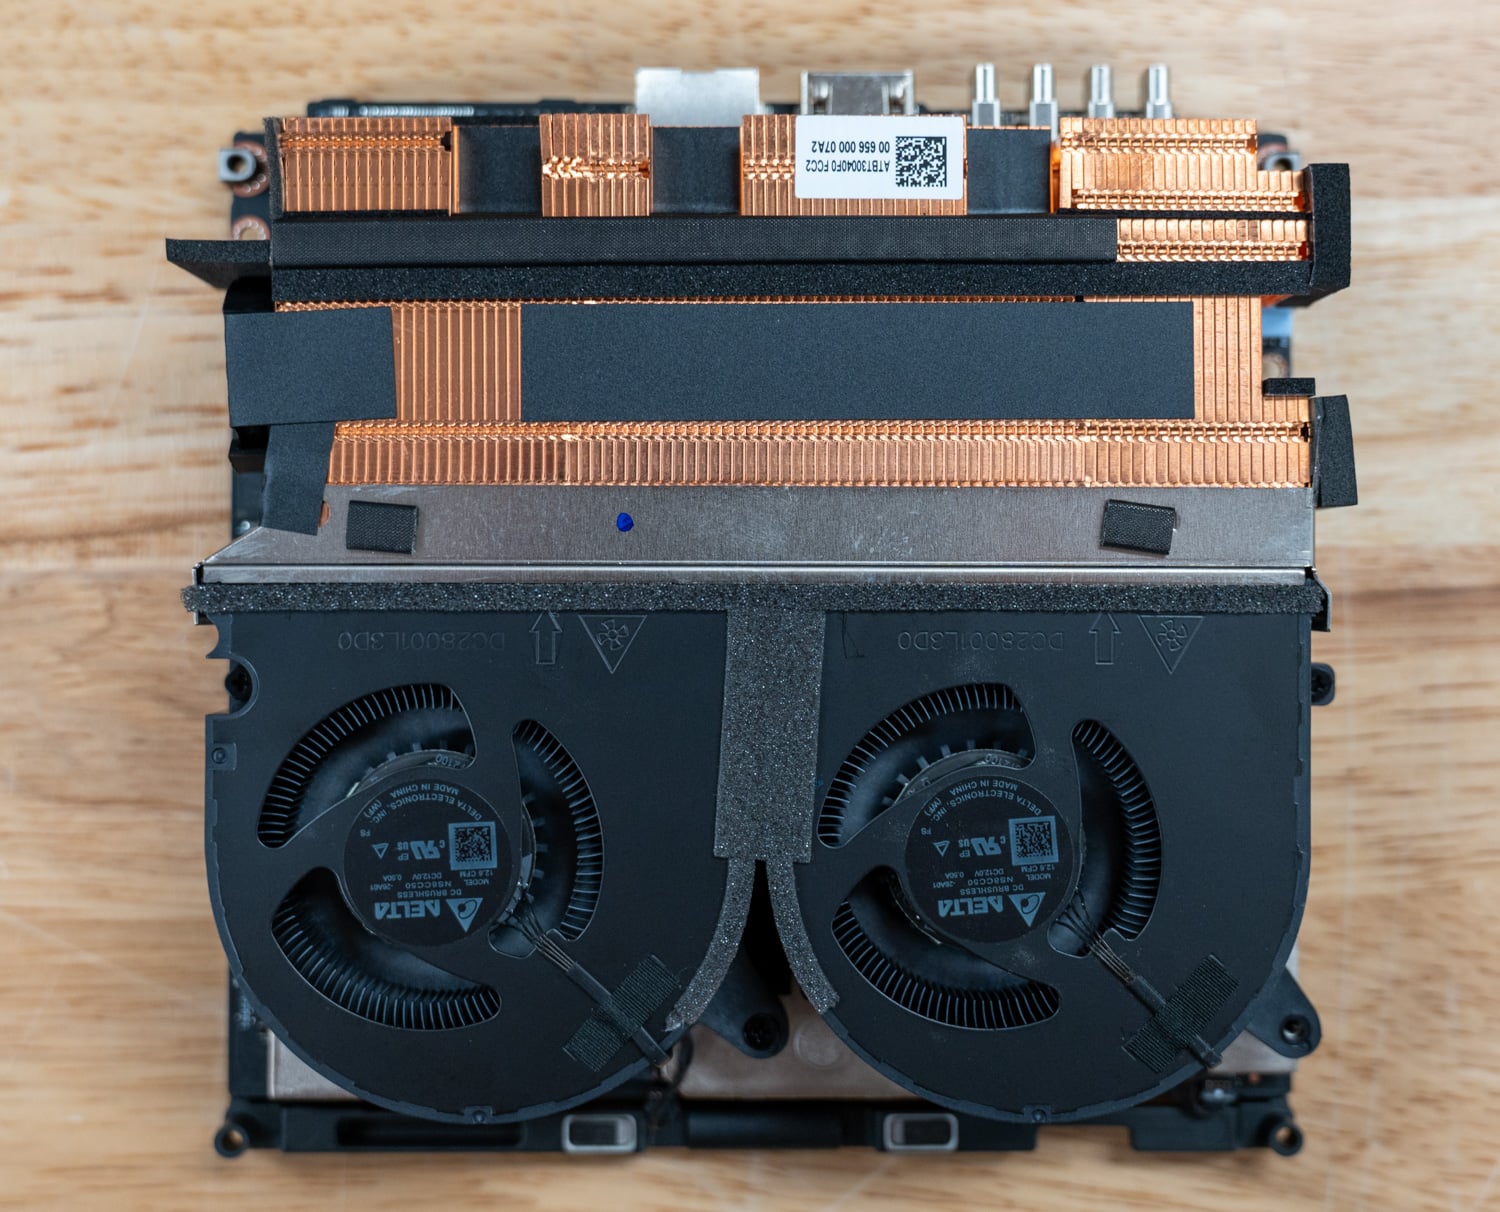
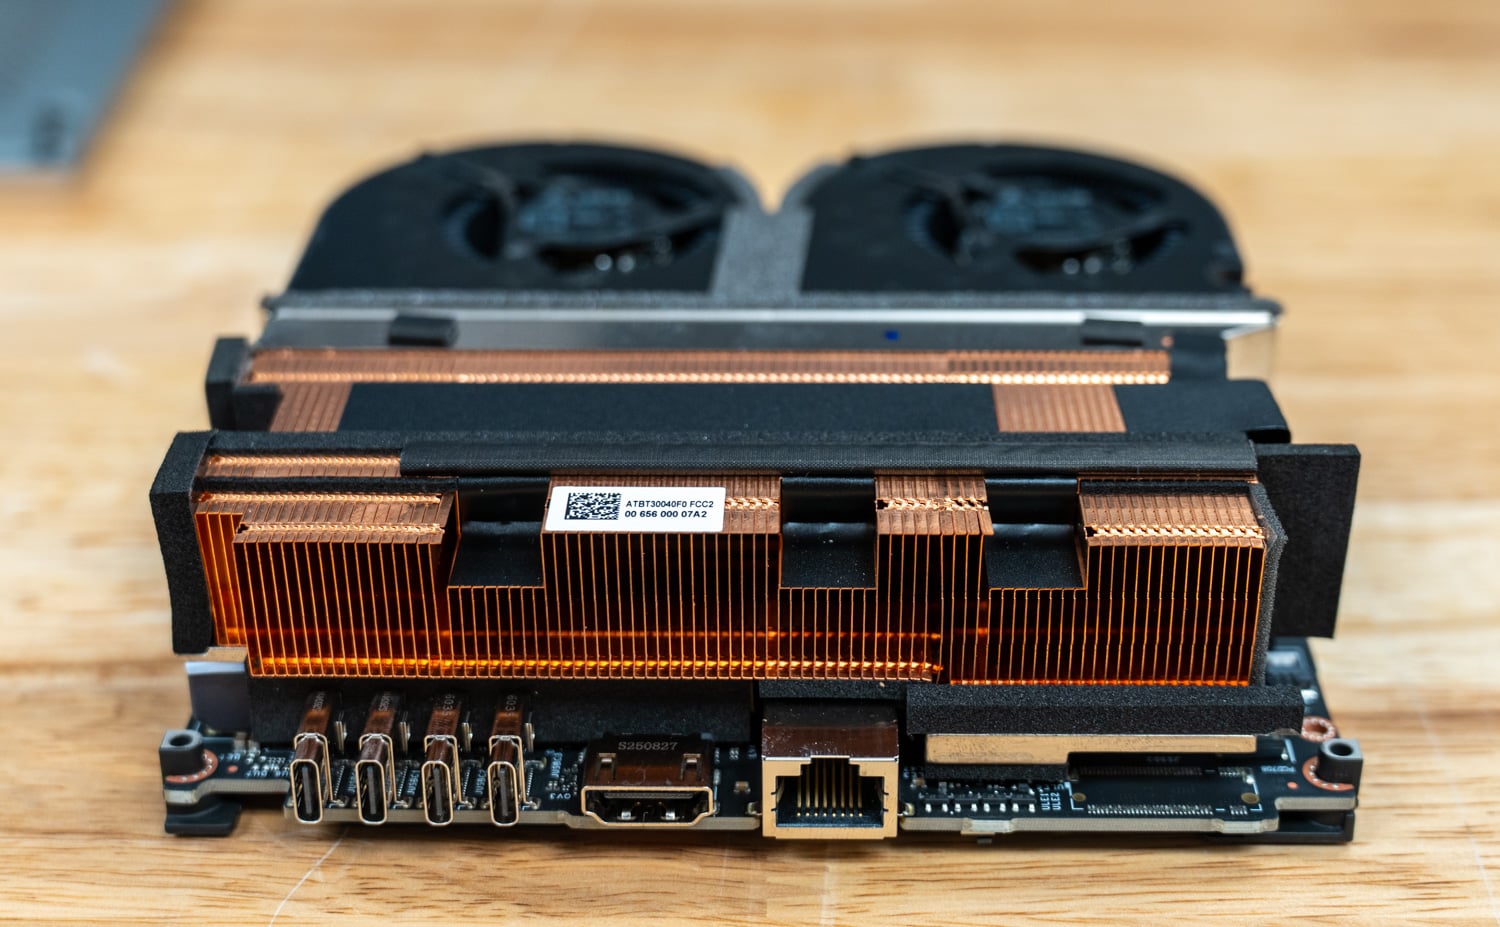
For cooling, AMD took a similar approach to NVIDIA’s DGX Spark, using dual fans that pull air across a finned heatsink and exhaust it out the rear of the chassis.
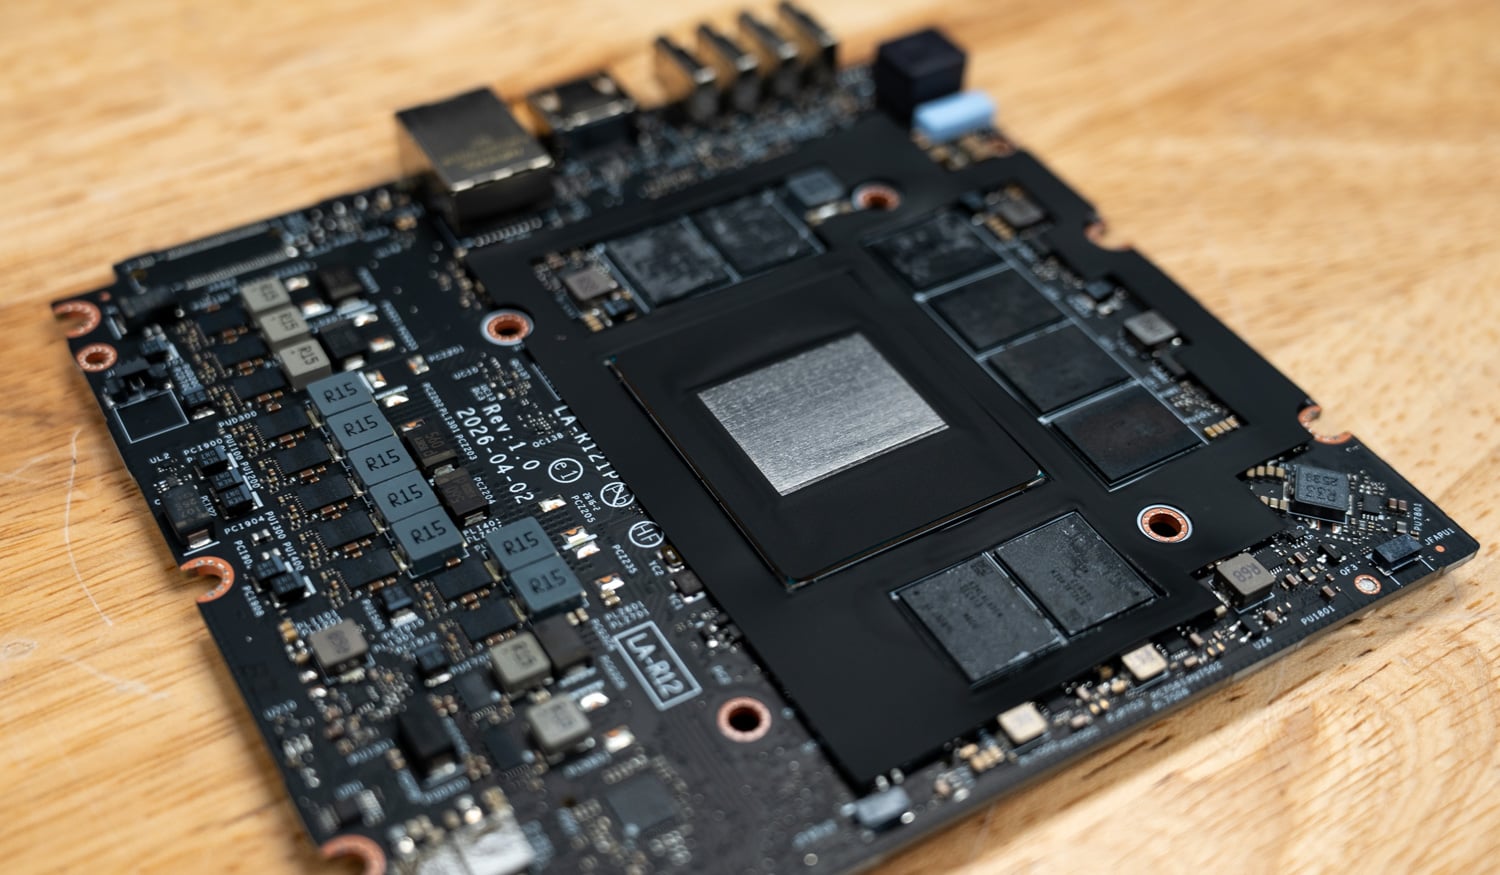
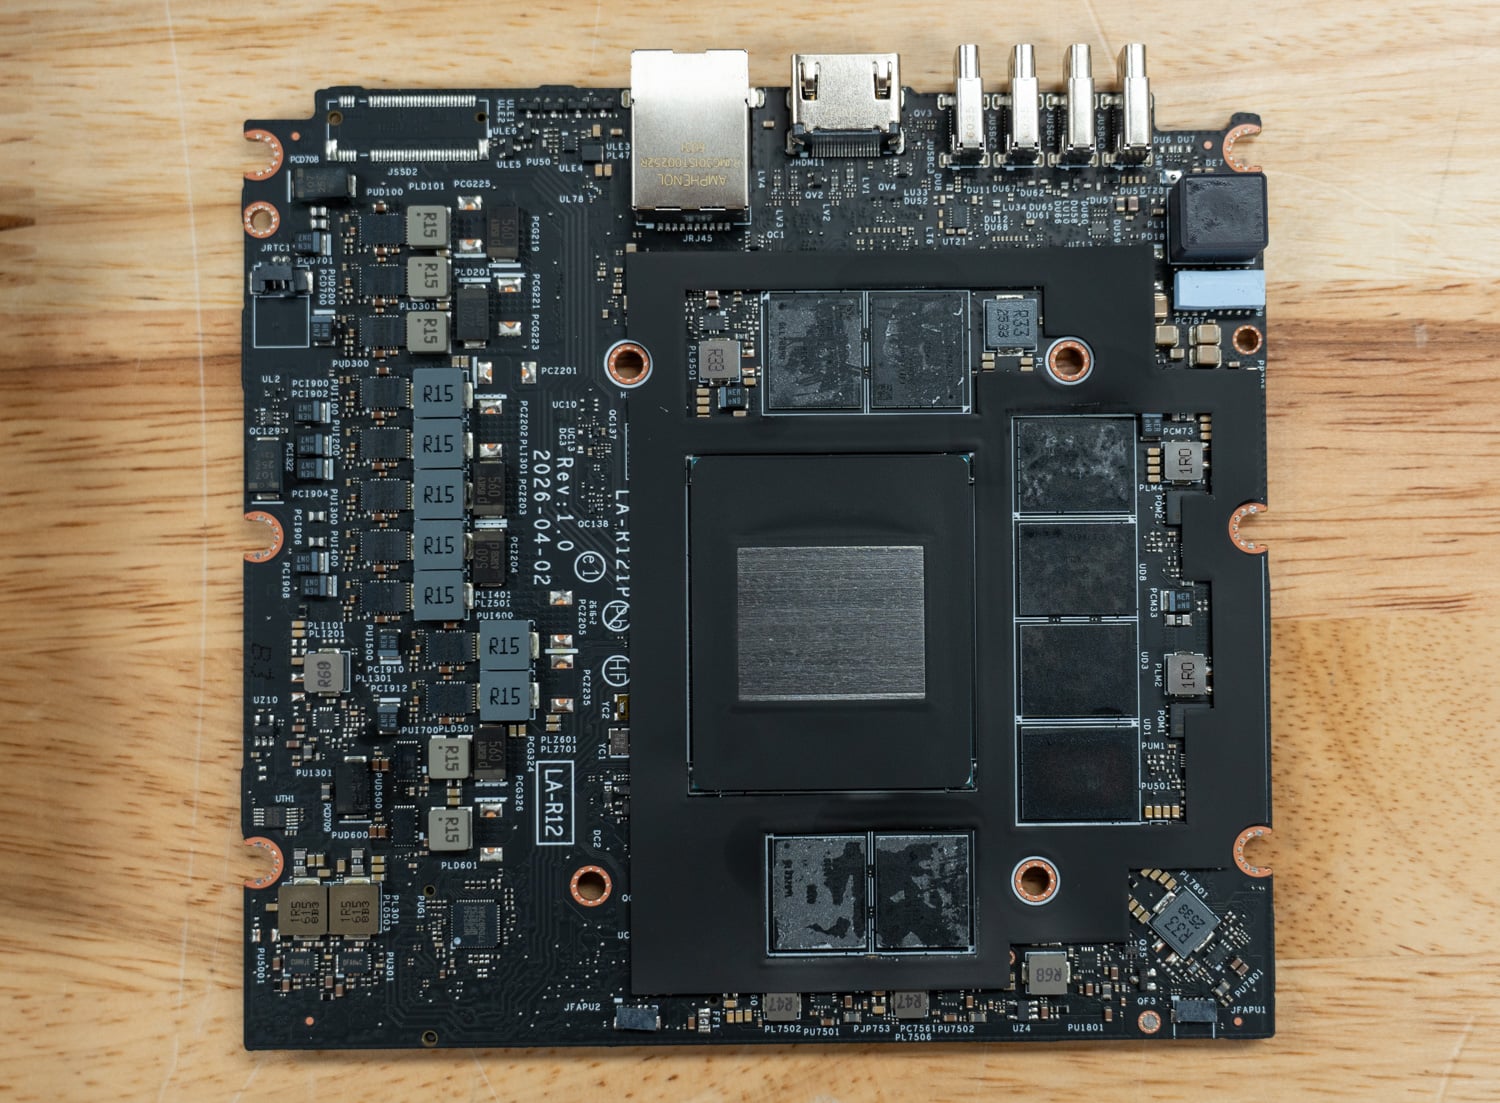
With the cooling assembly lifted away, the main board comes into view, revealing the APU die at the center, flanked by memory packages on either side and VRM circuitry running down the left edge. The silver square visible on the die isn’t liquid metal or a paste-based compound; it’s the residue of a solid thermal pad or coating AMD applied as the die-to-heatsink interface, which explains its uniform, dry appearance rather than the wet, smeared look paste or liquid metal typically leaves behind.
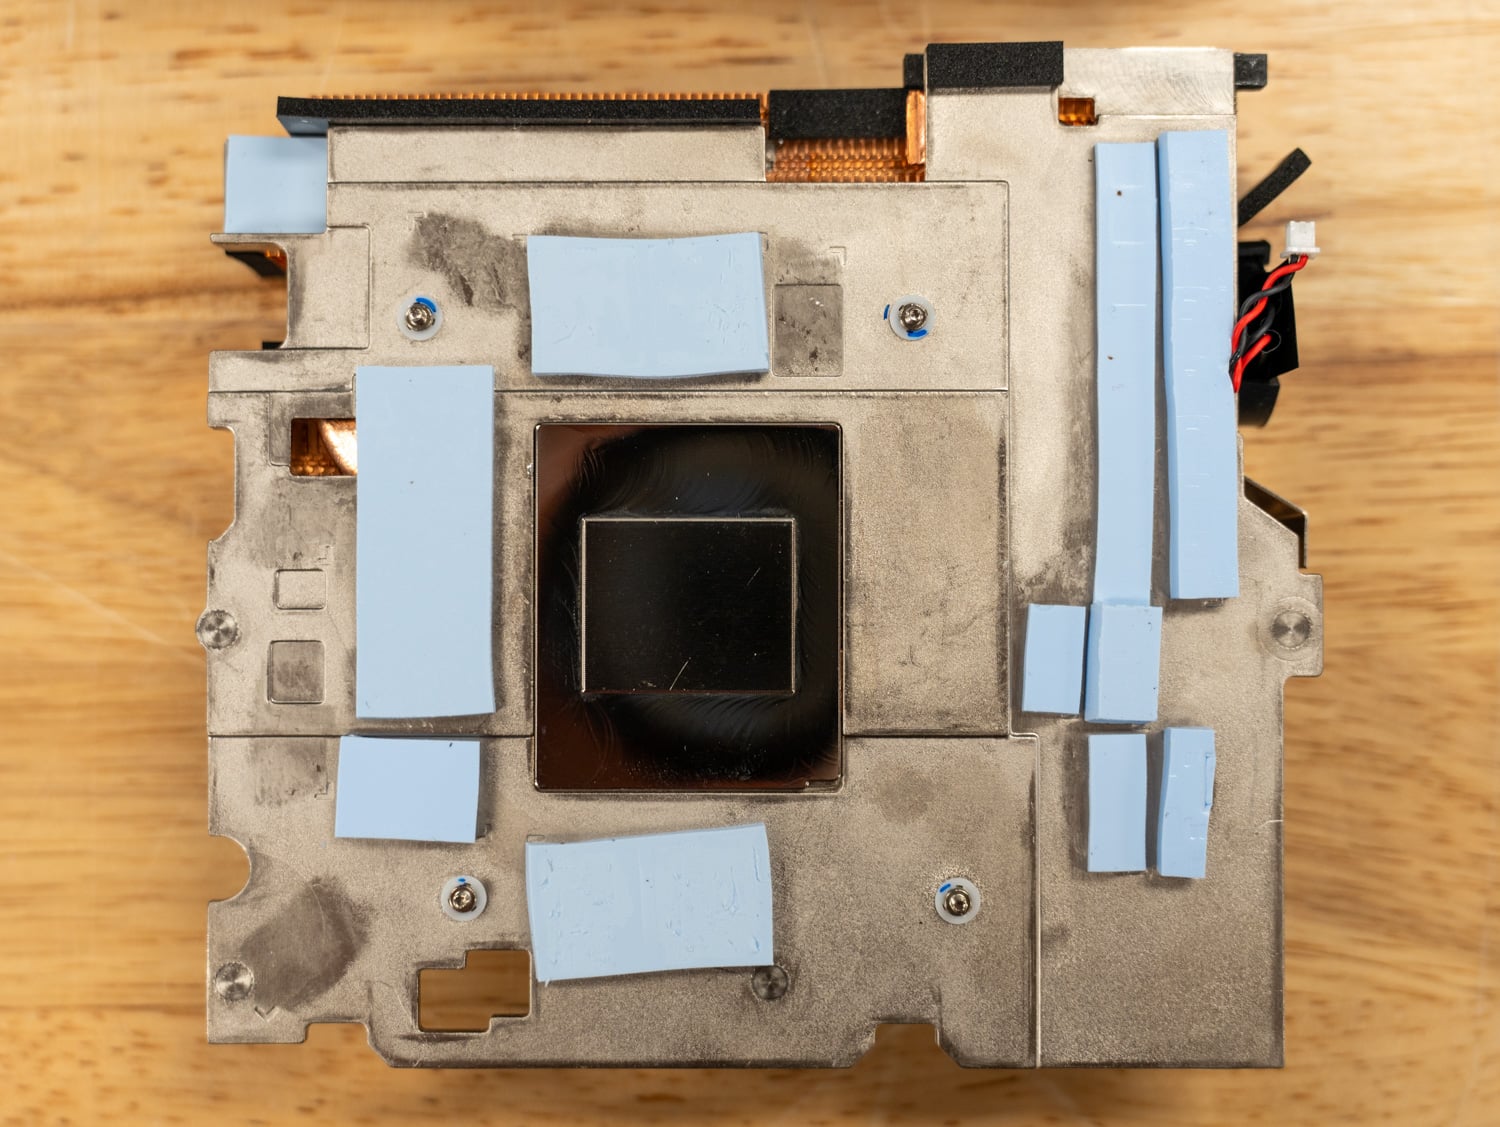
Flipping the heatsink over reveals the underside of its cold plate, where a mirror-polished section makes direct contact with the die. At the same time, the surrounding memory and power-delivery zones are covered with pre-applied thermal pads of varying thickness.
AMD Ryzen AI Halo Performance Testing
We evaluated the AMD Ryzen AI Halo platform on Windows and Linux to assess its performance in workstation applications and AI-focused workloads. For Windows testing, the AMD Ryzen AI Halo system was compared with two commercially available systems powered by the Ryzen AI Max+ PRO 395: the HP Z2 Mini G1a, a compact desktop workstation, and the HP ZBook Ultra G1a 14-inch, a mobile workstation. Because all three systems share the same underlying processor architecture and Radeon 8060S integrated graphics, these comparisons highlight how the Halo platform performs across different thermal envelopes and system designs.
For Linux testing, we shifted to AI development and storage workloads, comparing the Ryzen AI Halo system with the NVIDIA DGX Spark. These tests focused on FIO storage benchmarking and vLLM inference performance, comparing AMD’s Ryzen AI Halo-based developer platform with NVIDIA’s purpose-built AI development system for local large-language-model inference.
Tested Units
UL Procyon: AI Computer Vision
The Procyon AI Computer Vision Benchmark provides detailed insights into how AI inference engines perform at a professional level. By incorporating engines from multiple vendors, it delivers performance scores that accurately reflect a device’s capabilities. The benchmark evaluates state-of-the-art neural network models by comparing their AI acceleration performance across hardware types—including CPU, GPU, and NPU—enabling users to assess relative efficiency across a range of workloads and conditions.
To reflect real-world AI workloads, the benchmark uses six diverse neural network models, each selected for its relevance to modern computer vision tasks. MobileNet V3 is a compact, mobile-focused model designed for subject identification in images, whereas Inception V4 performs the same task with a deeper, more complex architecture.
YOLO V3 (You Only Look Once) specializes in real-time object detection by estimating object probabilities. DeepLab V3, built on MobileNet V2, focuses on semantic image segmentation and pixel clustering. Real-ESRGAN, the most computationally demanding test, upscales images from 250×250 to 1,000×1,000 resolution. Finally, ResNet 50 is a robust classification model that enables more effective training of deep neural networks.
The Ryzen AI Halo platform delivered consistently strong AI inference performance across CPU and GPU workloads. On the CPU tests, it posted an overall score of 216, narrowly trailing the HP Z2 Mini’s 227 and comfortably outperforming the HP ZBook Ultra’s 186. GPU inference was even more impressive, with the Halo system earning the highest overall score at 553, ahead of the ZBook Ultra (528) and the Z2 Mini (528). It also recorded the fastest MobileNet V3 inference at 0.38ms and completed the demanding REAL-ESRGAN workload in 185.08ms, compared with 211.76ms on the Z2 Mini and 200.40ms on the ZBook Ultra.
| UL Procyon: AI Computer Vision Inference (Lower is better) | AMD Ryzen AI Halo (Ryzen AI Max+ 395 | Radeon 8060S) | HP Z2 Mini G1a (Ryzen AI Max+ PRO 395 | Radeon 8060S) | HP ZBook Ultra G1a 14″ (Ryzen AI Max+ PRO 395 | Radeon 8060S) |
|---|---|---|---|
| CPU Times | |||
| AI Computer Vision Overall Score (higher is better) | 216 | 227 | 186 |
| MobileNet V3 | 0.73 ms | 0.75 ms | 1.09 ms |
| ResNet 50 | 6.02 ms | 5.99 ms | 6.84 ms |
| Inception V4 | 17.18 ms | 17.12 ms | 19.80 ms |
| DeepLab V3 | 29.21 ms | 21.20 ms | 28.27 ms |
| YOLO V3 | 35.60 ms | 36.58 ms | 41.64 ms |
| REAL-ESRGAN | 1,931.13 ms | 1,892.10 ms | 2,138.97 ms |
| GPU Times | |||
| AI Computer Vision Overall Score (higher is better) | 553 | 528 | 583 |
| MobileNet V3 | 0.38 ms | 0.42 ms | 0.46 ms |
| ResNet 50 | 4.04 ms | 3.85 ms | 3.27 ms |
| Inception V4 | 13.26 ms | 15.15 ms | 11.62 ms |
| DeepLab V3 | 12.72 ms | 10.98 ms | 10.72 ms |
| YOLO V3 | 11.17 ms | 12.64 ms | 10.57 ms |
| REAL-ESRGAN | 185.08 ms | 211.76 ms | 200.40 ms |
UL Procyon: AI Text Generation
The Procyon AI Text Generation Benchmark streamlines AI LLM performance testing by providing a concise, consistent evaluation method. It enables repeated testing across multiple LLM models while minimizing the complexity of large model sizes and variable factors. Developed with AI hardware leaders, it optimizes the use of local AI accelerators for more reliable and efficient performance assessments. The results below were measured using TensorRT.
The Ryzen AI Halo reference platform led all tested language models in Procyon AI Text Generation. It achieved the highest overall Phi score at 1,192, compared with 965 for the HP Z2 Mini and 922 for the HP ZBook Ultra. Mistral followed a similar trend with a score of 998, ahead of 850 and 829, while Llama3 finished at 847, outperforming the competing systems at 766 and 756, respectively. The Halo platform also reduced time-to-first-token across every model, producing the first Phi token in just 0.996 seconds, nearly half the latency of the HP systems. Although token generation throughput occasionally favored the Z2 Mini, the Halo platform’s significantly lower startup latency resulted in the best overall benchmark scores.
| UL Procyon: AI Text Generation | AMD Ryzen AI Halo (Ryzen AI Max+ 395 | Radeon 8060S) |
HP Z2 Mini G1a (Ryzen AI Max+ PRO 395 | Radeon 8060S) | HP ZBook Ultra G1a 14″ (Ryzen AI Max+ PRO 395 | Radeon 8060S) |
|---|---|---|---|
| Phi Overall Score | 1,192 | 965 | 922 |
| Phi Output Time To First Token | 0.996 seconds | 1.898 seconds | 1.956 seconds |
| Phi Output Tokens Per Second | 55.271 tokens/s | 68.967 tokens/s | 64.986 tokens/s |
| Phi Overall Duration | 56.237 seconds | 52.666 seconds | 55.501 seconds |
| Mistral Overall Score | 998 | 850 | 829 |
| Mistral Output Time To First Token | 1.603 seconds | 2.734 seconds | 2.783 seconds |
| Mistral Output Tokens Per Second | 35.027 tokens/s | 43.358 tokens/s | 41.992 tokens/s |
| Mistral Overall Duration | 88.582 seconds | 81.716 seconds | 84.065 seconds |
| Llama3 Overall Score | 847 | 766 | 756 |
| Llama3 Output Time To First Token | 1.963 seconds | 2.545 seconds | 2.578 seconds |
| Llama3 Output Tokens Per Second | 34.630 tokens/s | 36.752 tokens/s | 36.243 tokens/s |
| Llama3 Overall Duration | 92.026 seconds | 91.987 seconds | 93.200 seconds |
| Llama2 Overall Score | N/A | 936 | 929 |
| Llama2 Output Time To First Token | N/A seconds | 3.813 seconds | 3.860 seconds |
| Llama2 Output Tokens Per Second | N/A tokens/s | 24.685 tokens/s | 24.619 tokens/s |
| Llama2 Overall Duration | N/A seconds | 136.077 seconds | 136.720 seconds |
UL Procyon: AI Image Generation
The Procyon AI Image Generation Benchmark offers a consistent, accurate way to measure AI inference performance across hardware ranging from low-power NPUs to high-end GPUs. It includes three tests: Stable Diffusion XL (FP16) for high-end GPUs, Stable Diffusion 1.5 (FP16) for moderately powerful GPUs, and Stable Diffusion 1.5 (INT8) for low-power devices. The benchmark uses the optimal inference engine for each system, ensuring fair and comparable results.
Image generation proved to be one of Ryzen AI Halo’s strongest workloads. On Stable Diffusion 1.5 FP16, the Halo platform achieved an overall score of 937, compared with 725 for the Z2 Mini and 648 for the ZBook Ultra, while reducing generation time to 106.7 seconds, compared with 137.8 and 154.2 seconds, respectively. Stable Diffusion XL showed an equally strong lead, with the Halo system finishing in 878.5 seconds, approximately 174 seconds faster than the Z2 Mini and more than 450 seconds faster than the ZBook Ultra. The platform also completed the Stable Diffusion 1.5 INT8 benchmark with an overall score of 9,158, a workload unavailable on either HP comparison system.
| UL Procyon: AI Image Generation | AMD Ryzen AI Halo (Ryzen AI Max+ 395 | Radeon 8060S) |
HP Z2 Mini G1a (Ryzen AI Max+ PRO 395 | Radeon 8060S) | HP ZBook Ultra G1a 14″ (Ryzen AI Max+ PRO 395 | Radeon 8060S) |
|---|---|---|---|
| Stable Diffusion 1.5 (FP16) – Overall Score | 937 | 725 | 648 |
| Stable Diffusion 1.5 (FP16) – Overall Time | 106.7 seconds | 137.815 seconds | 154.203 seconds |
| Stable Diffusion 1.5 (FP16) – Image Generation Speed | 6.670 s/image | 8.613 s/image | 9.638 s/image |
| Stable Diffusion 1.5 (INT8) – Overall Score | 9,158 | N/A | N/A |
| Stable Diffusion 1.5 (INT8) – Overall Time | 27.298 seconds | N/A | N/A |
| Stable Diffusion 1.5 (INT8) – Image Generation Speed | 3.412 s/image | N/A | N/A |
| Stable Diffusion XL (FP16) – Overall Score | 682 | 570 | 451 |
| Stable Diffusion XL (FP16) – Overall Time | 878.493 seconds | 1,052.468 seconds | 1,329.592 seconds |
| Stable Diffusion XL (FP16) – Image Generation Speed | 54.906 s/image | 65.779 s/image | 83.100 s/image |
SPECworkstation 4
The SPECworkstation 4.0 benchmark is a comprehensive tool for evaluating all key aspects of workstation performance. It provides a real-world measure of CPU, graphics, accelerator, and disk performance, giving professionals the data needed to make informed decisions about their hardware investments. The benchmark includes a dedicated set of tests focused on AI and ML workloads, such as data science tasks and ONNX Runtime-based inference tests, reflecting the growing importance of AI/ML in workstation environments. It covers seven industry verticals and four hardware subsystems, providing a detailed and relevant measure of today’s workstations’ performance.
SPECworkstation 4 highlighted the balanced workstation capabilities of the Ryzen AI Halo platform. It posted the highest scores in Financial Services (2.92), Media & Entertainment (2.97), Product Design (2.22), and Productivity & Development (1.27), outperforming both the HP Z2 Mini and HP ZBook Ultra in those categories. The Z2 Mini held a slight lead in Energy (2.50 vs. 2.35) and Life Sciences (2.60 vs. 2.33). Overall, the Halo reference platform demonstrated strong performance across the benchmark’s professional workloads and remained competitive in every category tested.
| SPECworkstation 4.0.0 (Higher is better) | AMD Ryzen AI Halo (Ryzen AI Max+ 395 | Radeon 8060S) |
HP Z2 Mini G1a (Ryzen AI Max+ PRO 395 | Radeon 8060S)
|
HP ZBook Ultra G1a 14″ (Ryzen AI Max+ PRO 395 | Radeon 8060S) |
|---|---|---|---|
| Energy | 2.35 | 2.50 | 2.20 |
| Financial Services | 2.92 | 2.35 | 1.60 |
| Life Sciences | 2.33 | 2.60 | 2.20 |
| Media & Entertainment | 2.97 | 2.22 | 1.90 |
| Product Design | 2.22 | 2.00 | 1.74 |
| Productivity & Development | 1.27 | 1.00 | 1.03 |
Luxmark
Luxmark is a GPU benchmark that uses LuxRender, an open-source ray-tracing renderer, to evaluate a system’s performance with highly detailed 3D scenes. This benchmark is useful for assessing the graphical rendering capabilities of servers and workstations, especially for visual effects and architectural visualization applications, where accurate light simulation is crucial.
Luxmark results showed minimal separation among the three Ryzen AI Max+ 395 platforms. The Halo reference system posted the highest Food score at 4,158, edging out the Z2 Mini (3,943) and ZBook Ultra (3,915). In the Hallbench workload, it scored 8,014, slightly behind the Z2 Mini’s 8,477 but ahead of the ZBook Ultra’s 7,833. Overall, the results suggest that systems built around the Radeon 8060S deliver very similar ray-tracing performance regardless of form factor.
| Luxmark (Higher is better) | AMD Ryzen AI Halo (Ryzen AI Max+ 395 | Radeon 8060S) |
HP Z2 Mini G1a (Ryzen AI Max+ PRO 395 | Radeon 8060S) | HP ZBook Ultra G1a 14″ (Ryzen AI Max+ PRO 395 | Radeon 8060S) |
|---|---|---|---|
| Hallbench | 8,014 | 8,477 | 7,833 |
| Food | 4,158 | 3,943 | 3,915 |
7-Zip Compression
The 7-Zip Compression Benchmark evaluates CPU performance during compression and decompression, measuring performance in GIPS (Giga Instructions Per Second) and CPU usage. Higher GIPS and efficient CPU usage indicate superior performance.
The Ryzen AI Halo platform led every major category in the 7-Zip benchmark. It achieved a compression rating of 176.7 GIPS, compared to 139.3 GIPS on the HP Z2 Mini and 139.6 GIPS on the ZBook Ultra. Decompression performance remained equally strong at 191.6 GIPS, exceeding the Z2 Mini’s 164.0 GIPS and the ZBook Ultra’s 174.0 GIPS. Combined, the Halo platform achieved the highest overall rating of 184.2 GIPS, outperforming competing systems by roughly 20% and demonstrating excellent integer throughput for archive creation and extraction workloads.
| 7-Zip Compression Benchmark (Higher is Better) | AMD Ryzen AI Halo (Ryzen AI Max+ 395 | Radeon 8060S) |
HP Z2 Mini G1a (Ryzen AI Max+ PRO 395 | Radeon 8060S) | HP ZBook Ultra G1a 14″ (Ryzen AI Max+ PRO 395 | Radeon 8060S) | |||
|---|---|---|---|---|---|---|
| Compressing | ||||||
| Current CPU Usage | 2,741% | 2,734% | 2,868% | |||
| Current Rating/Usage | 6.370 GIPS | 5.136 GIPS | 4.883 GIPS | |||
| Current Rating | 174.589 GIPS | 140.405 GIPS | 140.061 GIPS | |||
| Resulting CPU Usage | 2,751% | 2,718% | 2,855% | |||
| Resulting Rating/Usage | 6.424 GIPS | 5.126 GIPS | 4.890 GIPS | |||
| Resulting Rating | 176.742 GIPS | 139.298 GIPS | 139.617 GIPS | |||
| Decompressing | ||||||
| Current CPU Usage | 2,568% | 2,343% | 2,904% | |||
| Current Rating/Usage | 7.670 GIPS | 6.805 GIPS | 6.029 GIPS | |||
| Current Rating | 196.986 GIPS | 159.451 GIPS | 175.104 GIPS | |||
| Resulting CPU Usage | 2,469% | 2,414% | 2,887% | |||
| Resulting Rating/Usage | 7.766 GIPS | 6.793 GIPS | 6.028 GIPS | |||
| Resulting Rating | 191.645 GIPS | 163.969 GIPS | 174.046 GIPS | |||
| Total Rating | ||||||
| Total CPU Usage | 2,610% | 2,566% | 2,871% | |||
| Total Rating/Usage | 7.095 GIPS | 5.959 GIPS | 5.459 GIPS | |||
| Total Rating | 184.194 GIPS | 151.634 GIPS | 156.832 GIPS | |||
Blender Benchmark
Blender is an open-source 3D modeling application. This benchmark was run with the Blender Benchmark utility. The score is measured in samples per minute, with higher values indicating better performance.
CPU rendering was another area where Ryzen AI Halo excelled. In the Monster scene, it achieved 244.7 samples per minute, ahead of the HP Z2 Mini (224.3) and HP ZBook Ultra (189.3). Junkshop followed with 159.4 samples per minute, compared with 149.5 and 129.4, while Classroom completed at 131.6 samples per minute, outperforming the Z2 Mini (116.3) by roughly 13% and the ZBook Ultra (94.1) by nearly 40%. These results demonstrate that the Ryzen AI Max+ 395 delivers excellent multithreaded rendering performance despite its compact workstation footprint.
| Blender Benchmark CPU (Samples per minute, Higher is better) | AMD Ryzen AI Halo (Ryzen AI Max+ 395 | Radeon 8060S) |
HP Z2 Mini G1a (Ryzen AI Max+ PRO 395 | Radeon 8060S) | HP ZBook Ultra G1a 14″ (Ryzen AI Max+ PRO 395 | Radeon 8060S) |
|---|---|---|---|
| Monster | 244.7 samples/m | 224.3 samples/m | 189.29 samples/m |
| Junkshop | 159.4 samples/m | 149.5 samples/m | 129.42 samples/m |
| Classroom | 131.6 samples/m | 116.3 samples/m | 94.14 samples/m |
GPU rendering results were much closer across systems. The Halo reference platform rendered the Monster scene at 704.2 samples per minute, trailing the Z2 Mini (745.6) but ahead of the ZBook Ultra (661.5). Junkshop was effectively tied between the Halo platform (366.6) and the Z2 Mini (366.5). At the same time, the Halo system posted the highest Classroom score at 361.5 samples per minute, narrowly exceeding the Z2 Mini (359.0) and the ZBook Ultra (333.3). The results indicate that the Radeon 8060S delivers remarkably consistent GPU rendering performance across implementations.
| Blender Benchmark GPU (Samples per minute, Higher is better) | AMD Ryzen AI Halo (Ryzen AI Max+ 395 | Radeon 8060S) |
HP Z2 Mini G1a (Ryzen AI Max+ PRO 395 | Radeon 8060S) | HP ZBook Ultra G1a 14″ (Ryzen AI Max+ PRO 395 | Radeon 8060S) |
|---|---|---|---|
| Monster | 704.2 samples/m | 745.55 samples/m | 661.50 samples/m |
| Junkshop | 366.6 samples/m | 366.54 samples/m | 341.92 samples/m |
| Classroom | 361.51 samples/m | 359.01 samples/m | 333.26 samples/m |
y-cruncher
y-cruncher is a multithreaded, scalable program capable of computing Pi and other mathematical constants to trillions of digits. Since its launch in 2009, it has become a popular benchmarking and stress-testing tool for overclockers and hardware enthusiasts.
The y-cruncher results split along computation size. At the 1-billion- and 2.5-billion-digit runs, all three systems finished within a few tenths of a second of one another, with the HP systems fractionally ahead. As the workload scaled, the Halo pulled away, completing the 5-billion-digit computation in 71.948 seconds, compared with 75.021 seconds for the Z2 Mini and 78.19 seconds for the ZBook Ultra. At 10 billion digits, the Halo finished in 151.409 seconds, roughly 6% ahead of the Z2 Mini and 12% ahead of the ZBook Ultra, suggesting the desktop chassis sustains heavy multithreaded load better as run times stretch out.
| Y-Cruncher (Total Computation Time) | AMD Ryzen AI Halo (Ryzen AI Max+ 395 | Radeon 8060S) |
HP Z2 Mini G1a (Ryzen AI Max+ PRO 395 | Radeon 8060S) | HP ZBook Ultra G1a 14″ (Ryzen AI Max+ PRO 395 | Radeon 8060S) |
|---|---|---|---|
| 1 Billion | 13.193 seconds | 12.965 seconds | 12.93 seconds |
| 2.5 Billion | 34.578 seconds | 34.533 seconds | 34.91 seconds |
| 5 Billion | 71.948 seconds | 75.021 seconds | 78.19 seconds |
| 10 Billion | 151.409 seconds | 160.252 seconds | 171.72 seconds |
Geekbench 6
Geekbench 6 is a cross-platform benchmark measuring overall system performance.
Geekbench 6 reinforced the Halo platform’s balanced performance profile. It achieved the highest single-core score of 2,986, ahead of the HP Z2 Mini (2,862) and ZBook Ultra (2,825). Multi-core performance also led the comparison with 18,068. The Radeon 8060S recorded the highest OpenCL GPU score at 92,883, narrowly exceeding the Z2 Mini (91,591) and comfortably outperforming the ZBook Ultra (85,337). The consistent leads across CPU and GPU testing illustrate the well-rounded performance of the Ryzen AI Max+ 395 platform.
| Geekbench 6 (Higher is better) | AMD Ryzen AI Halo (Ryzen AI Max+ 395 | Radeon 8060S) |
HP Z2 Mini G1a (Ryzen AI Max+ PRO 395 | Radeon 8060S) | HP ZBook Ultra G1a 14″ (Ryzen AI Max+ PRO 395 | Radeon 8060S) |
|---|---|---|---|
| CPU Single-Core | 2,986 | 2,862 | 2,825 |
| CPU Multi-Core | 18,068 | 17,210 | 17,562 |
| GPU OpenCL | 92,883 | 91,591 | 85,337 |
Cinebench R23
Cinebench R23 is a widely recognized benchmark for evaluating CPU performance in 3D rendering workloads. Powered by the Cinema 4D engine, it measures how well a processor handles single-threaded and multithreaded tasks, offering insight into overall responsiveness and parallel processing capabilities.
Cinebench R23 showed a very close race between the two Ryzen AI Max+ 395 desktop implementations. The Halo reference platform posted a multi-core score of 37,316, edging out the HP Z2 Mini’s 37,156, while both comfortably surpassed the HP ZBook Ultra’s 29,112. Single-core performance followed the same pattern, with the Halo platform scoring 2,047, compared to 2,020 on the Z2 Mini and 1,984 on the ZBook Ultra. Although the margins over the Z2 Mini were small, the Halo system consistently finished at the top of the benchmark.
| Cinebench R23 (Higher is better) | AMD Ryzen AI Halo (Ryzen AI Max+ 395 | Radeon 8060S) |
HP Z2 Mini G1a (Ryzen AI Max+ PRO 395 | Radeon 8060S) | HP ZBook Ultra G1a 14″ (Ryzen AI Max+ PRO 395 | Radeon 8060S) |
|---|---|---|---|
| Multi-Core | 37,316 | 37,156 | 29,112 |
| Single-Core | 2,047 | 2,020 | 1,984 |
Cinebench 2024
Cinebench 2024 builds on the foundation of R23 by introducing GPU-based rendering tests while maintaining its focus on CPU performance. For this segment, we examine only the CPU scores, which offer updated insight into how well each system handles modern 3D rendering tasks.
The newer Cinebench 2024 benchmark mirrored the R23 results. Ryzen AI Halo recorded the highest multi-core score at 1,916, narrowly ahead of the HP Z2 Mini (1,906) and maintaining a sizable lead over the HP ZBook Ultra (1,579). Single-core performance also favored the Halo platform, with 116 points compared with 112 for the Z2 Mini and 111 for the ZBook Ultra. While the differences between the desktop systems remained small, the results reinforce the Ryzen AI Max+ 395’s ability to deliver consistently top-tier CPU rendering performance.
| Cinebench 2024 (Higher is better) | AMD Ryzen AI Halo (Ryzen AI Max+ 395 | Radeon 8060S) |
HP Z2 Mini G1a (Ryzen AI Max+ PRO 395 | Radeon 8060S) | HP ZBook Ultra G1a 14″ (Ryzen AI Max+ PRO 395 | Radeon 8060S) |
|---|---|---|---|
| Multi-Core | 1,916 | 1,906 | 1,579 |
| Single-Core | 116 | 112 | 111 |
Phoronix Benchmarks
Phoronix Test Suite is an open-source, automated benchmarking platform that supports over 450 test profiles and more than 100 test suites via OpenBenchmarking.org. It handles everything from installing dependencies to running tests and collecting results, making it ideal for performance comparisons, hardware validation, and continuous integration. We will look at performance in Stream, 7-Zip, and LLVM tests.
Looking at the Phoronix benchmark suite, we observed a fairly even split between the AMD Ryzen AI Halo platform and NVIDIA DGX Spark. The Ryzen AI Halo system consistently led CPU-centric workloads, outperforming the DGX Spark by 11% in 7-Zip compression, 38% in 7-Zip decompression, and completing the LLVM compile test 14% faster. The DGX Spark, on the other hand, showed stronger sustained memory bandwidth, leading the STREAM Scale, Triad, and Add tests by 17%, 13%, and 15%, respectively. Halo retained an 18% advantage in the STREAM Copy benchmark, illustrating that while both systems are highly capable, the Ryzen AI Halo platform favors general-purpose compute performance, whereas the DGX Spark demonstrates higher throughput in memory-bandwidth-focused workloads.
| Test | AMD Ryzen AI Halo | NVIDIA DGX Spark | Winner |
|---|---|---|---|
| 7-Zip Compression (MIPS) | 186,921 | 169,052 | Halo (+11%) |
| 7-Zip Decompression (MIPS) | 146,109 | 106,084 | Halo (+38%) |
| STREAM Copy (MB/s) | 145,363 | 123,730 | Halo (+18%) |
| STREAM Scale (MB/s) | 110,611 | 128,970 | Spark (+17%) |
| STREAM Triad (MB/s) | 107,105 | 121,433 | Spark (+13%) |
| STREAM Add (MB/s) | 107,022 | 122,815 | Spark (+15%) |
| LLVM Compile (Make, Seconds) | 431.8 | 504.3 | Halo (14% Faster) |
FIO Performance Benchmark
To measure storage performance across common industry metrics, we use fio. Our traditional SSD test preconditions each drive with two full drive fills as a secondary drive; here, we tested each drive in-system, through the filesystem. We previously tested the NVIDIA systems with GDSIO, but AMD doesn’t offer a comparable GPU-direct storage test, so running filesystem-level fio on both platforms puts them on a level playing field, which matters more than benchmarking the drives discretely.
Both the NVIDIA DGX Spark (Founders Edition) and the AMD Ryzen AI Halo ship with a PCIe Gen5 drive, so on paper the two platforms have identical ceilings for raw drive bandwidth. In practice, though, the Halo’s drive runs at PCIe Gen4 link speeds in this system, which caps the available bandwidth well below what the drive itself is capable of. That link-speed limitation is worth keeping in mind throughout this section, as it accounts for a meaningful portion of the bandwidth gap between the two platforms.
In this section, we focus on the following FIO benchmarks:
- 128K Sequential
- 64K Random
- 16K Sequential
- 16K Random
- 4K Random
128K Sequential Read
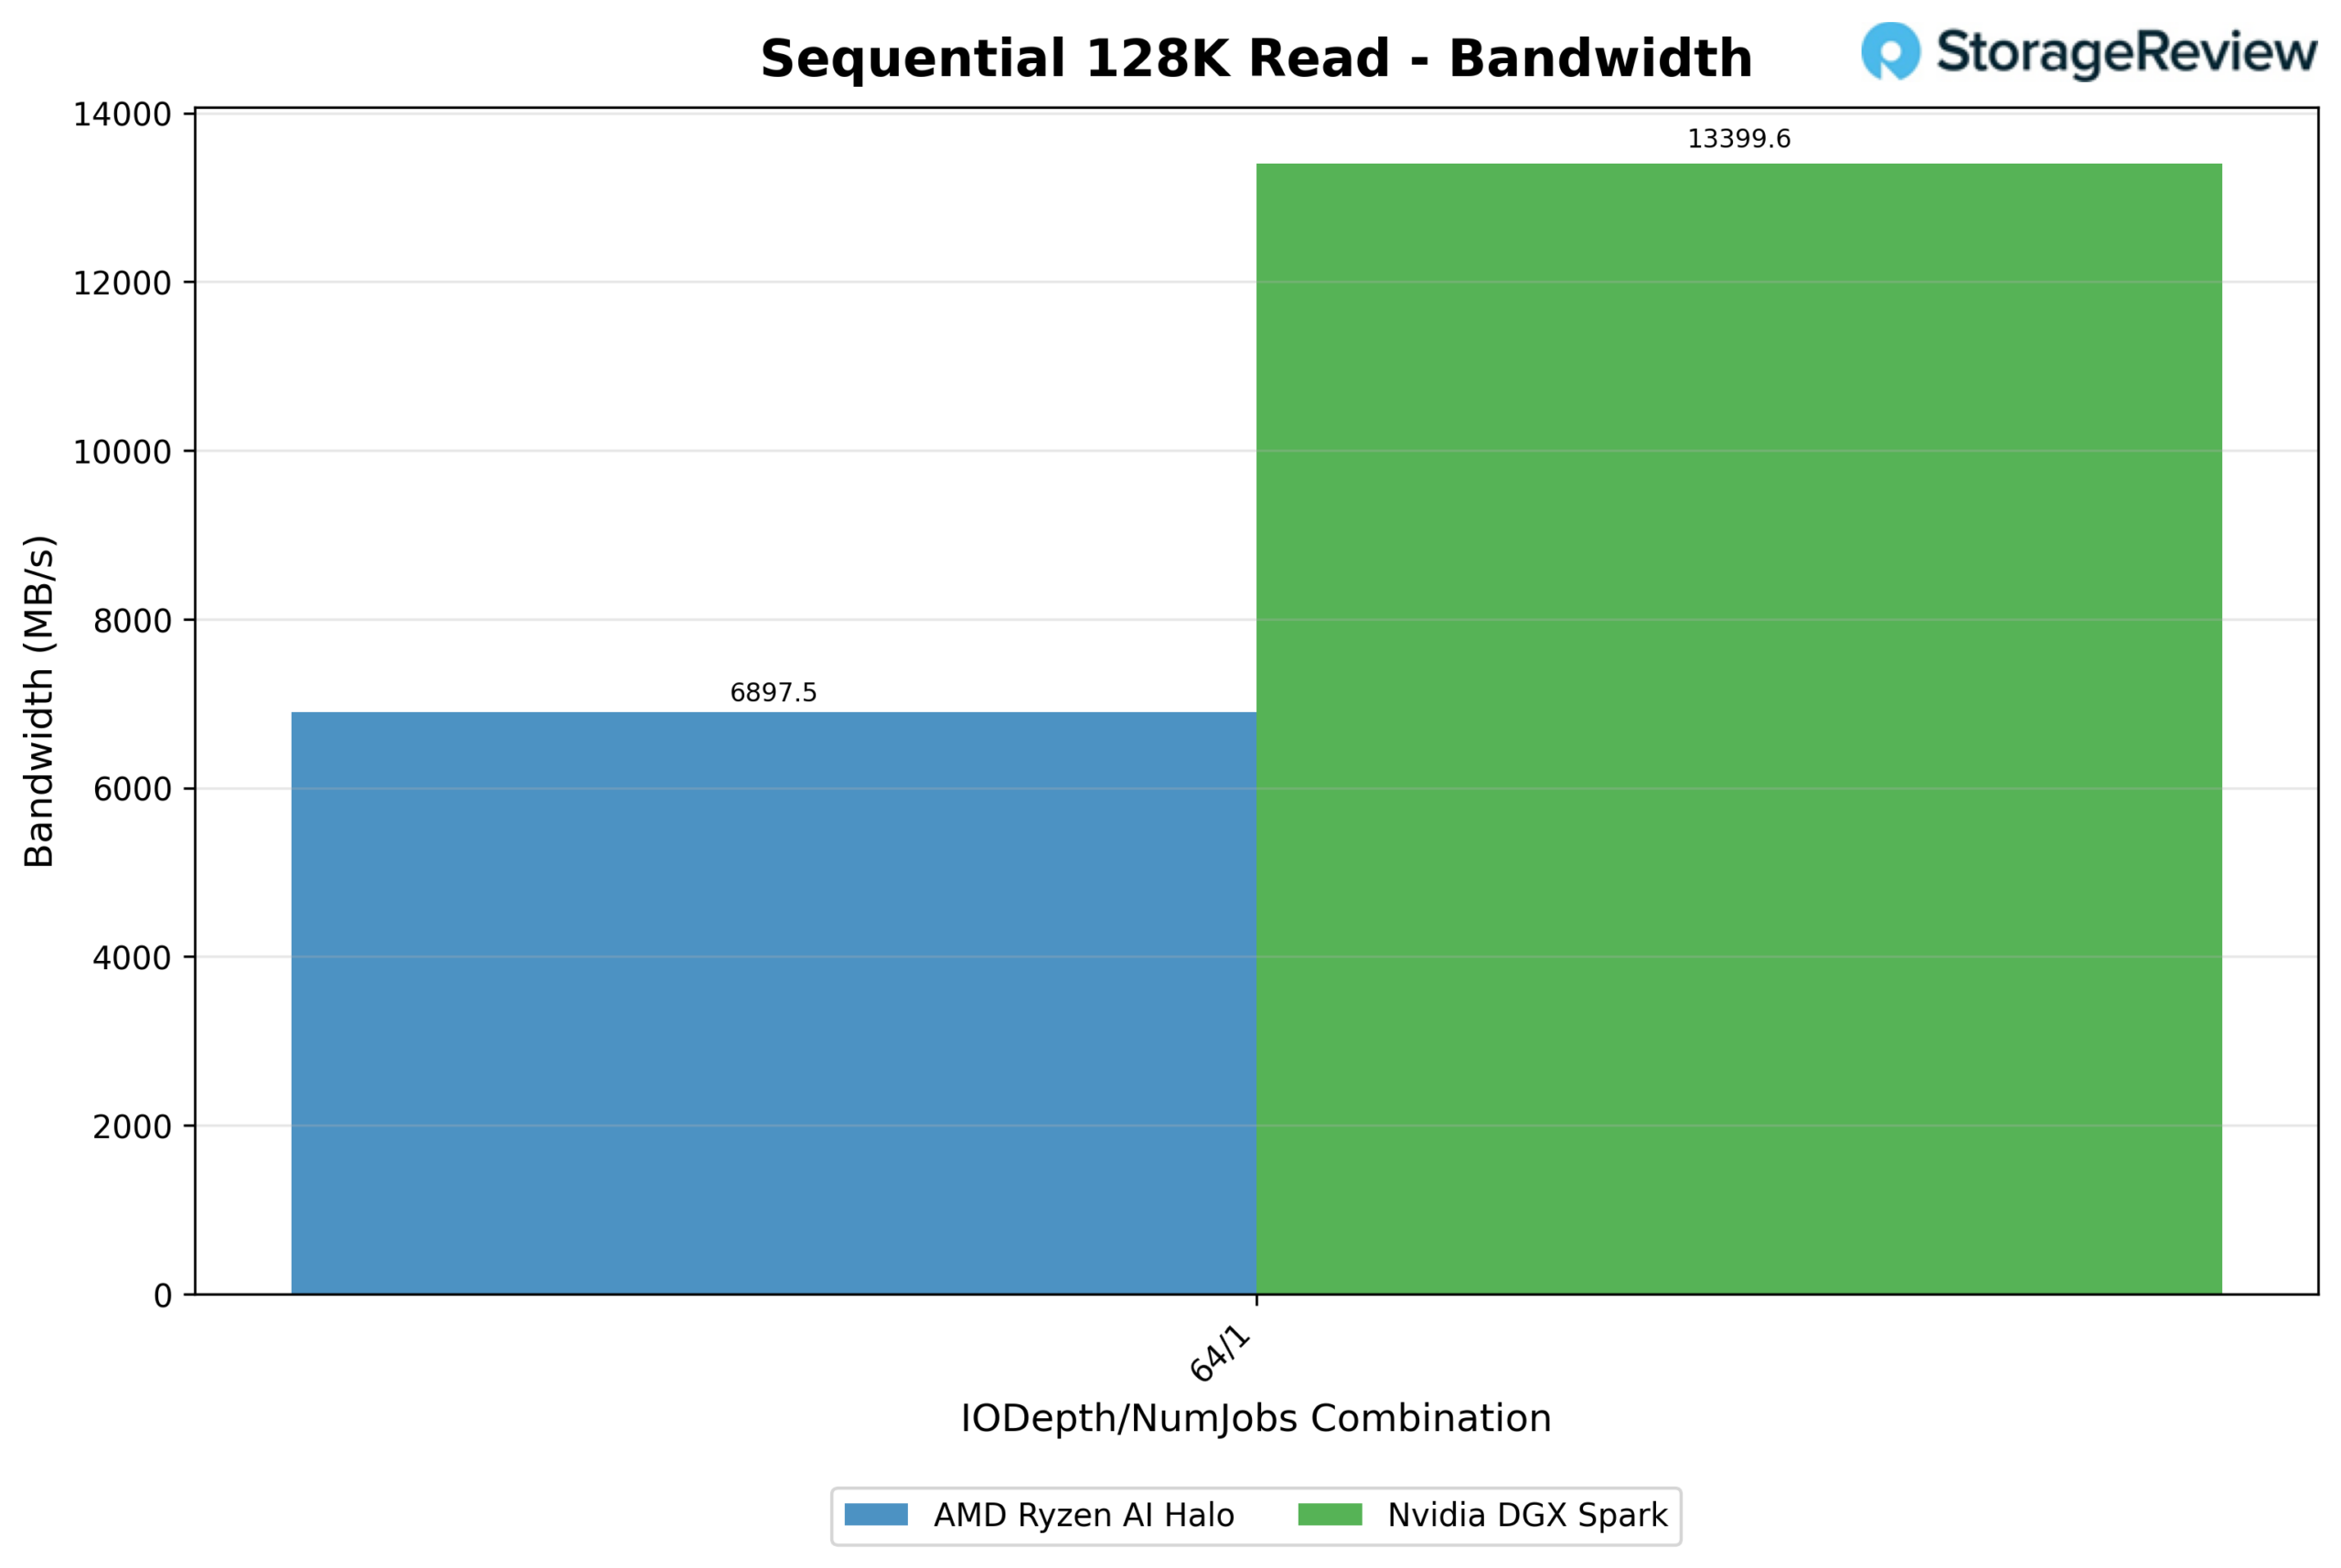
At a single-threaded, deep-queue 128K sequential read (64/1), the NVIDIA DGX Spark posted 13,399.6 MB/s, nearly double the AMD Ryzen AI Halo’s 6,897.5 MB/s. Latency followed the same pattern: the Spark’s mean latency at this depth was 0.597 ms, while the Halo trailed at 1.159 ms, almost twice as slow per request despite moving half the data. This is the clearest gap across the entire sweep, suggesting the Spark’s storage stack is built for higher sustained sequential throughput at this block size.
128K Sequential Write
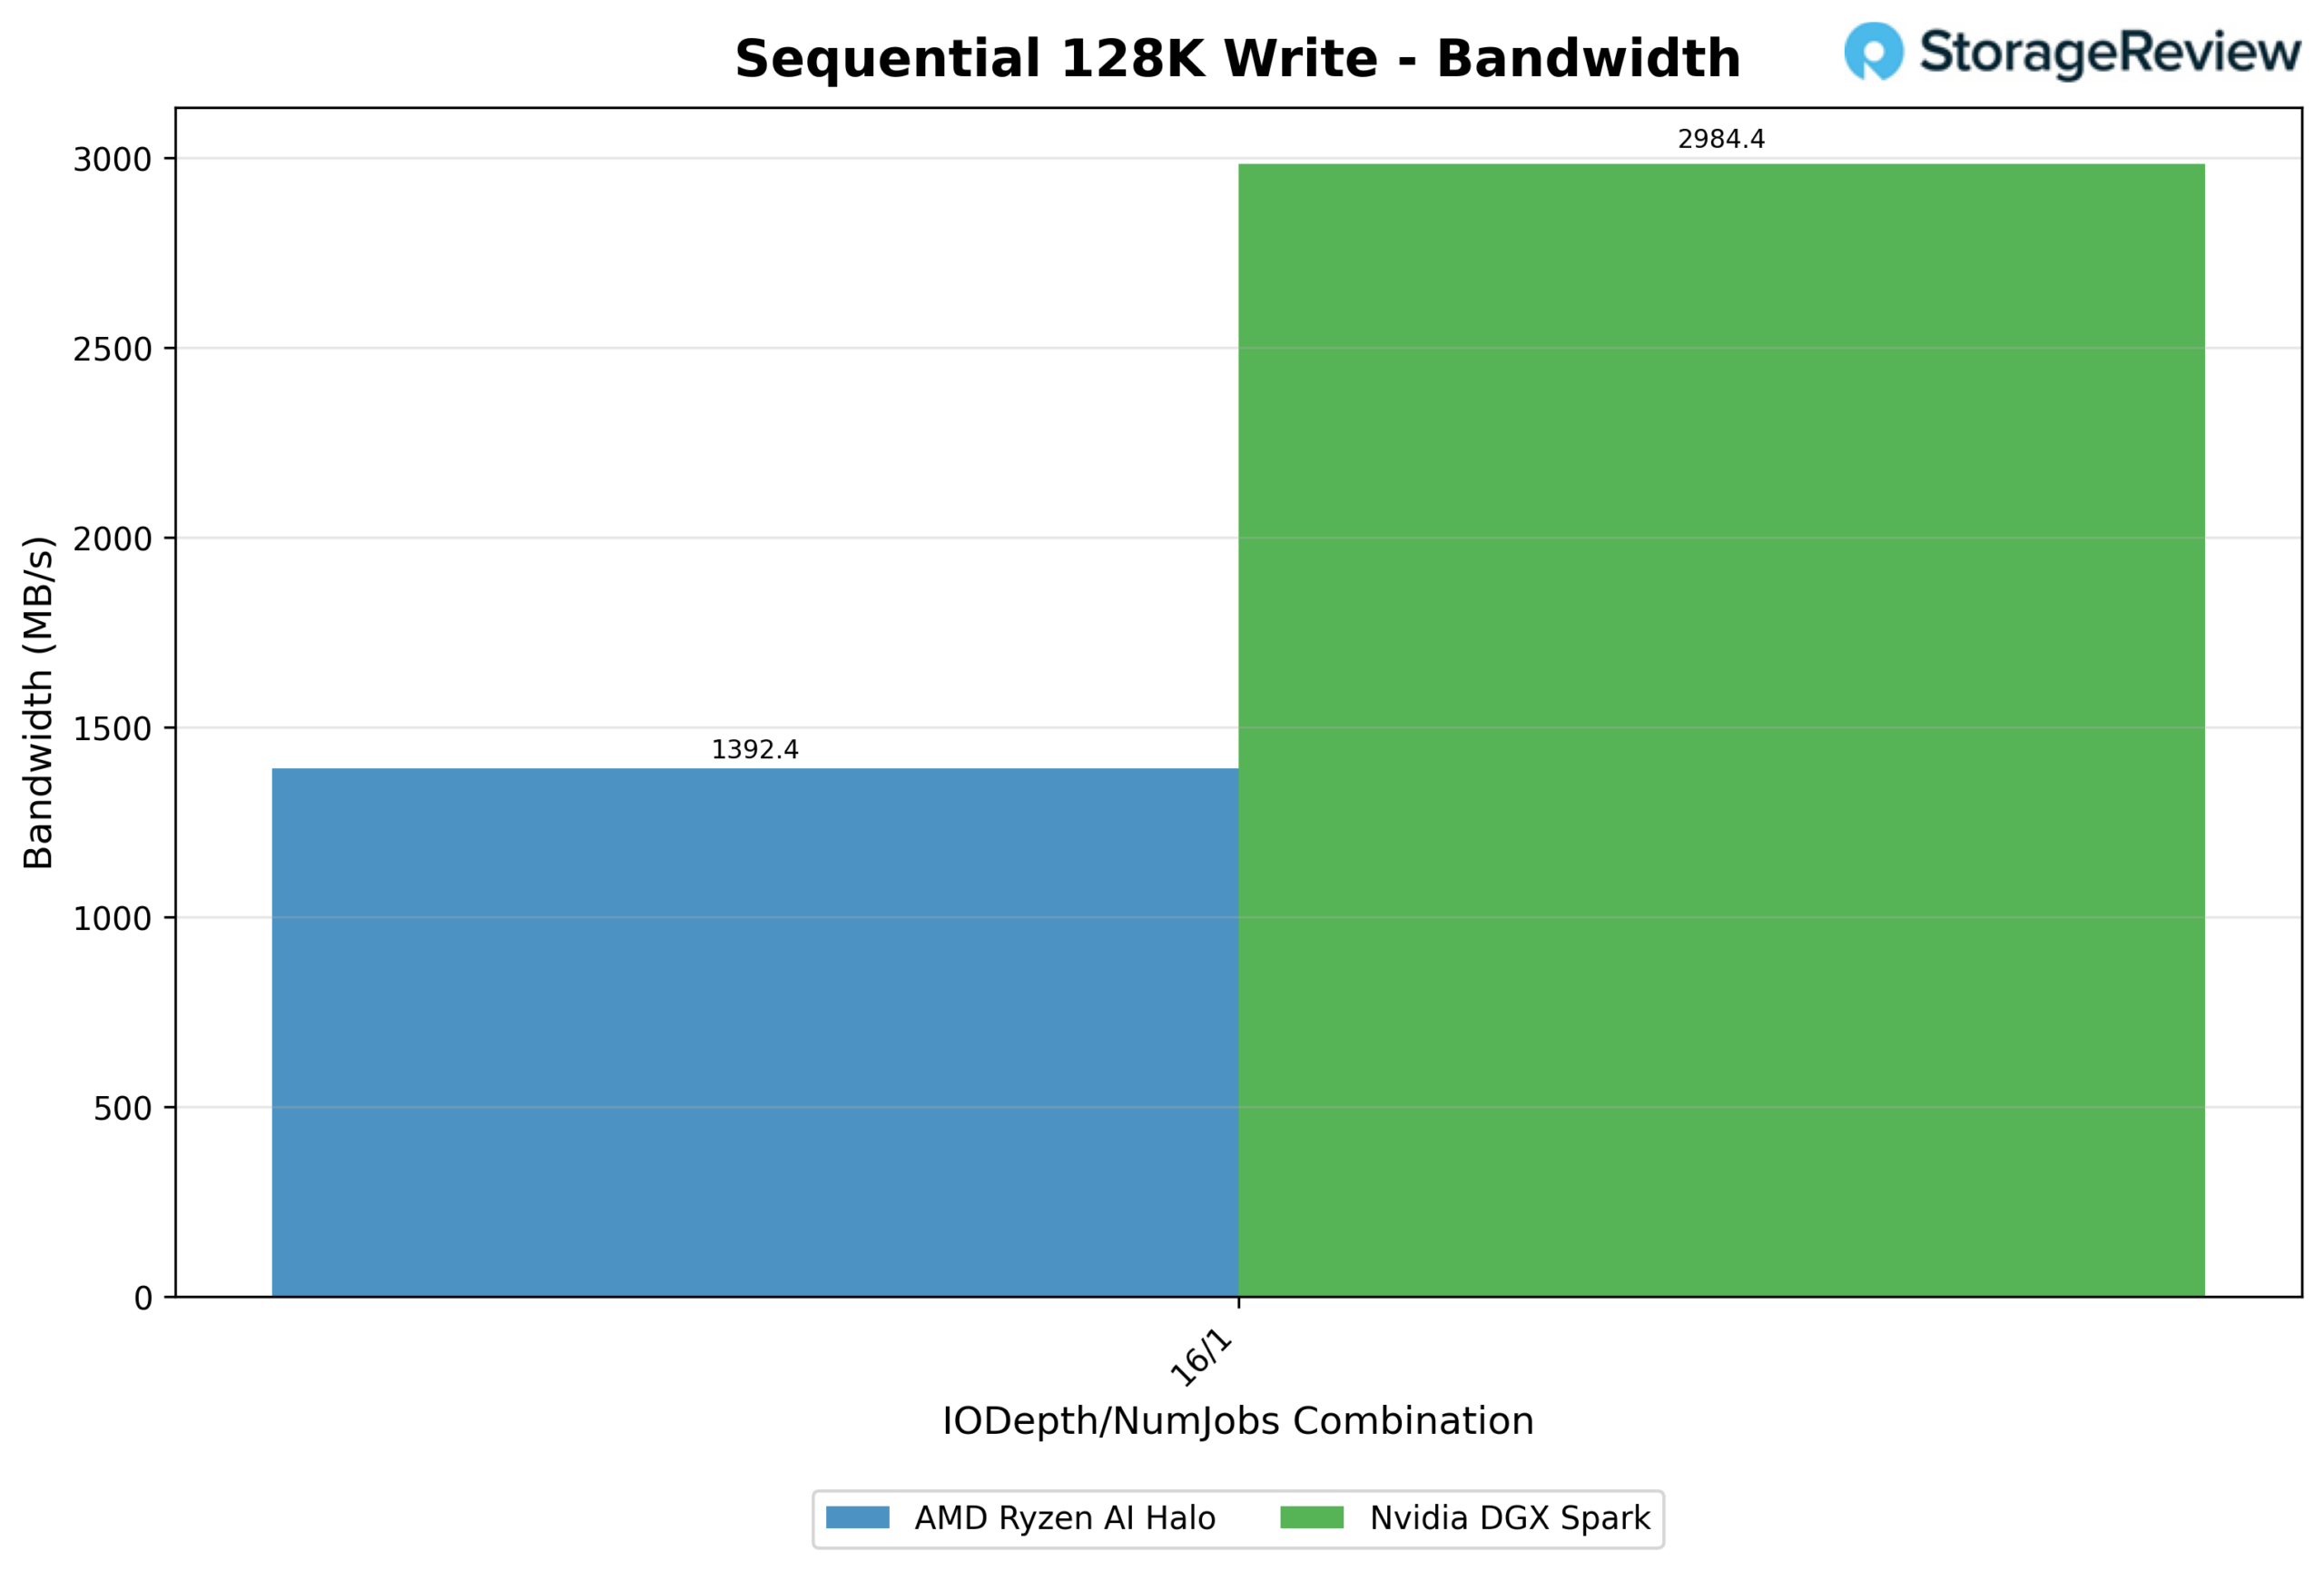
The write side tells a similar story. At IODepth 16/1, Spark reached 2,984.4 MB/s, compared with the Halo’s 1,392.4 MB/s, a 114% advantage for NVIDIA. Latency again favored Spark, at 0.67 ms versus the Halo’s 1.436 ms. Combined with the read results, 128K sequential is comfortably Spark’s strongest showing relative to the Halo.
64K Random Read
This is where the Halo’s low-queue-depth latency advantage really shows. At 1/1, the Halo answered in just 0.051 ms, versus Spark’s 0.275 ms, over 5x faster for a single outstanding request. That gap holds across low-to-mid queue depths, with the Halo tracking well under 0.2 ms while the Spark hovers in the 0.2–0.45 ms range for most of the sweep.
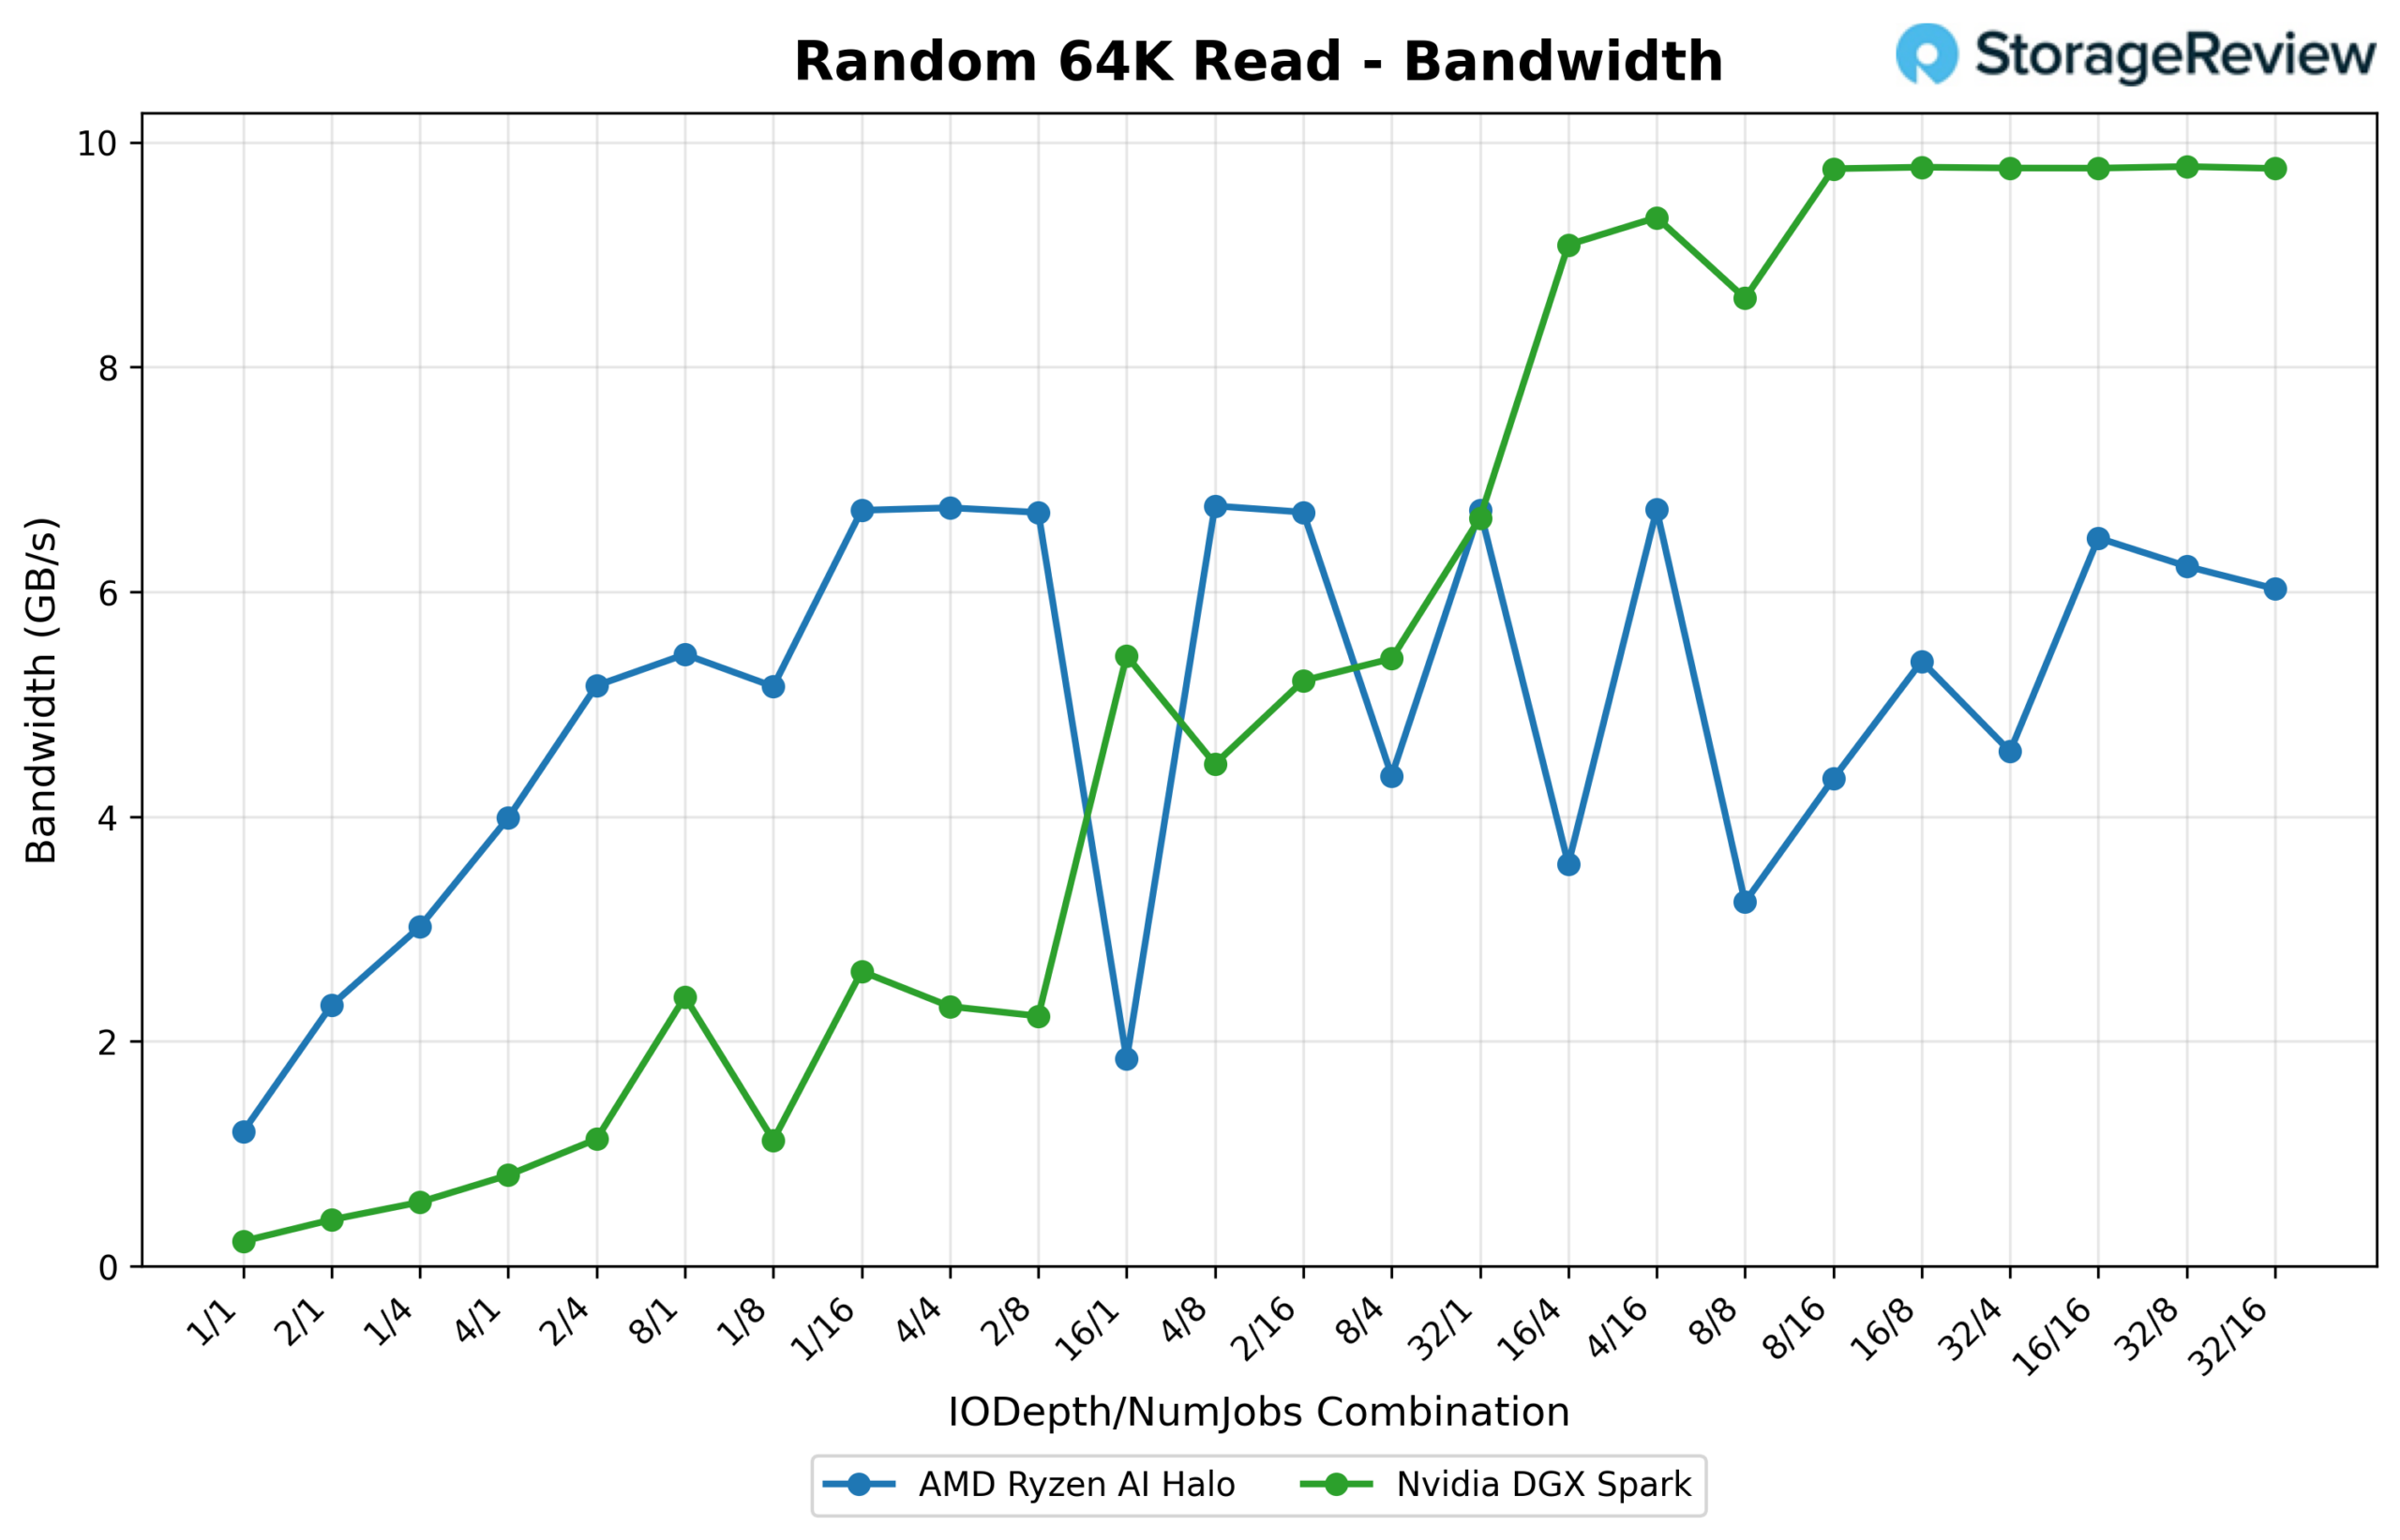
The story flips at scale, though. As queue depth and thread count climb past roughly 16/4, the Spark’s bandwidth breaks away and plateaus around 9.8 GB/s from 8/16 onward, topping out at 10,019.1 MB/s (160.3K IOPS) at 32/8. The Halo never reaches that ceiling: it saturates in the 6.0–6.9 GB/s range, peaking at 6,926.5 MB/s (110.8K IOPS) at 4/8. Its bandwidth curve is noticeably more erratic, sawtoothing between roughly 2 and 6.8 GB/s depending on the depth/thread combination rather than climbing smoothly.
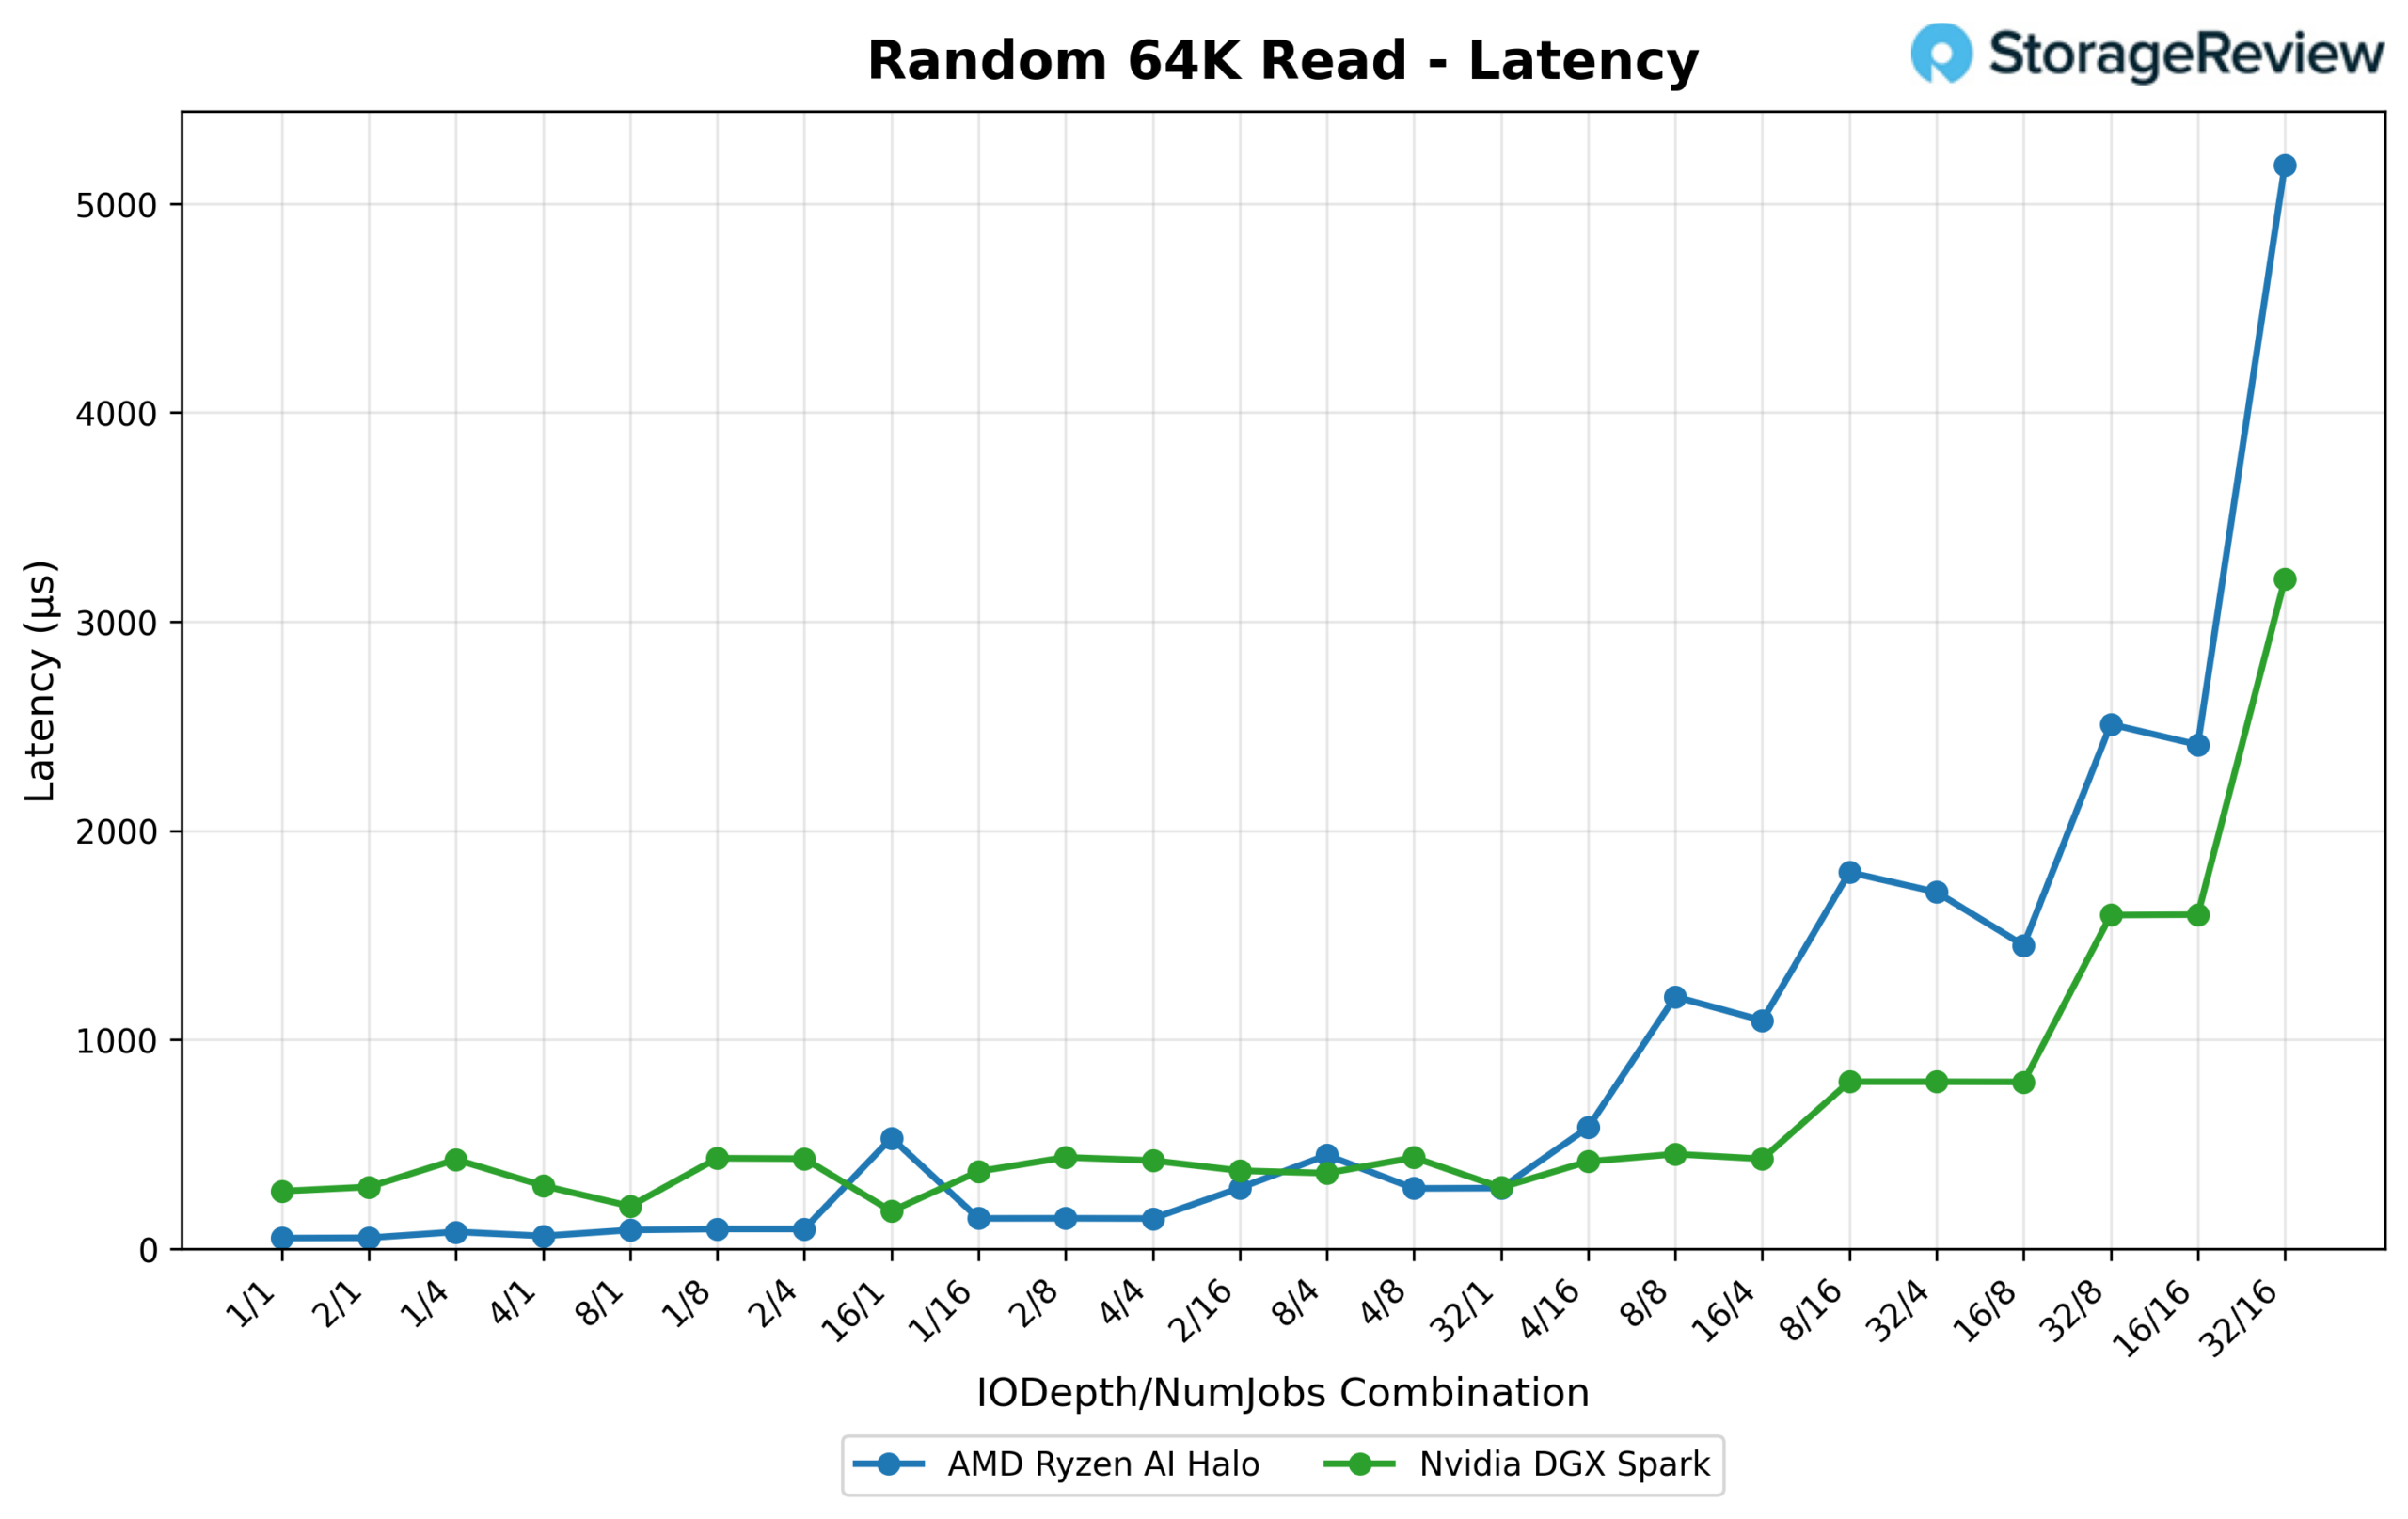
Latency at full saturation also swings in Spark’s favor: at 32/16, the Halo’s mean latency balloons to 5.185 ms, compared with Spark’s 3.204 ms, meaning the Halo pays for its low-queue-depth responsiveness with worse tail behavior once the queue is fully loaded.
64K Random Write
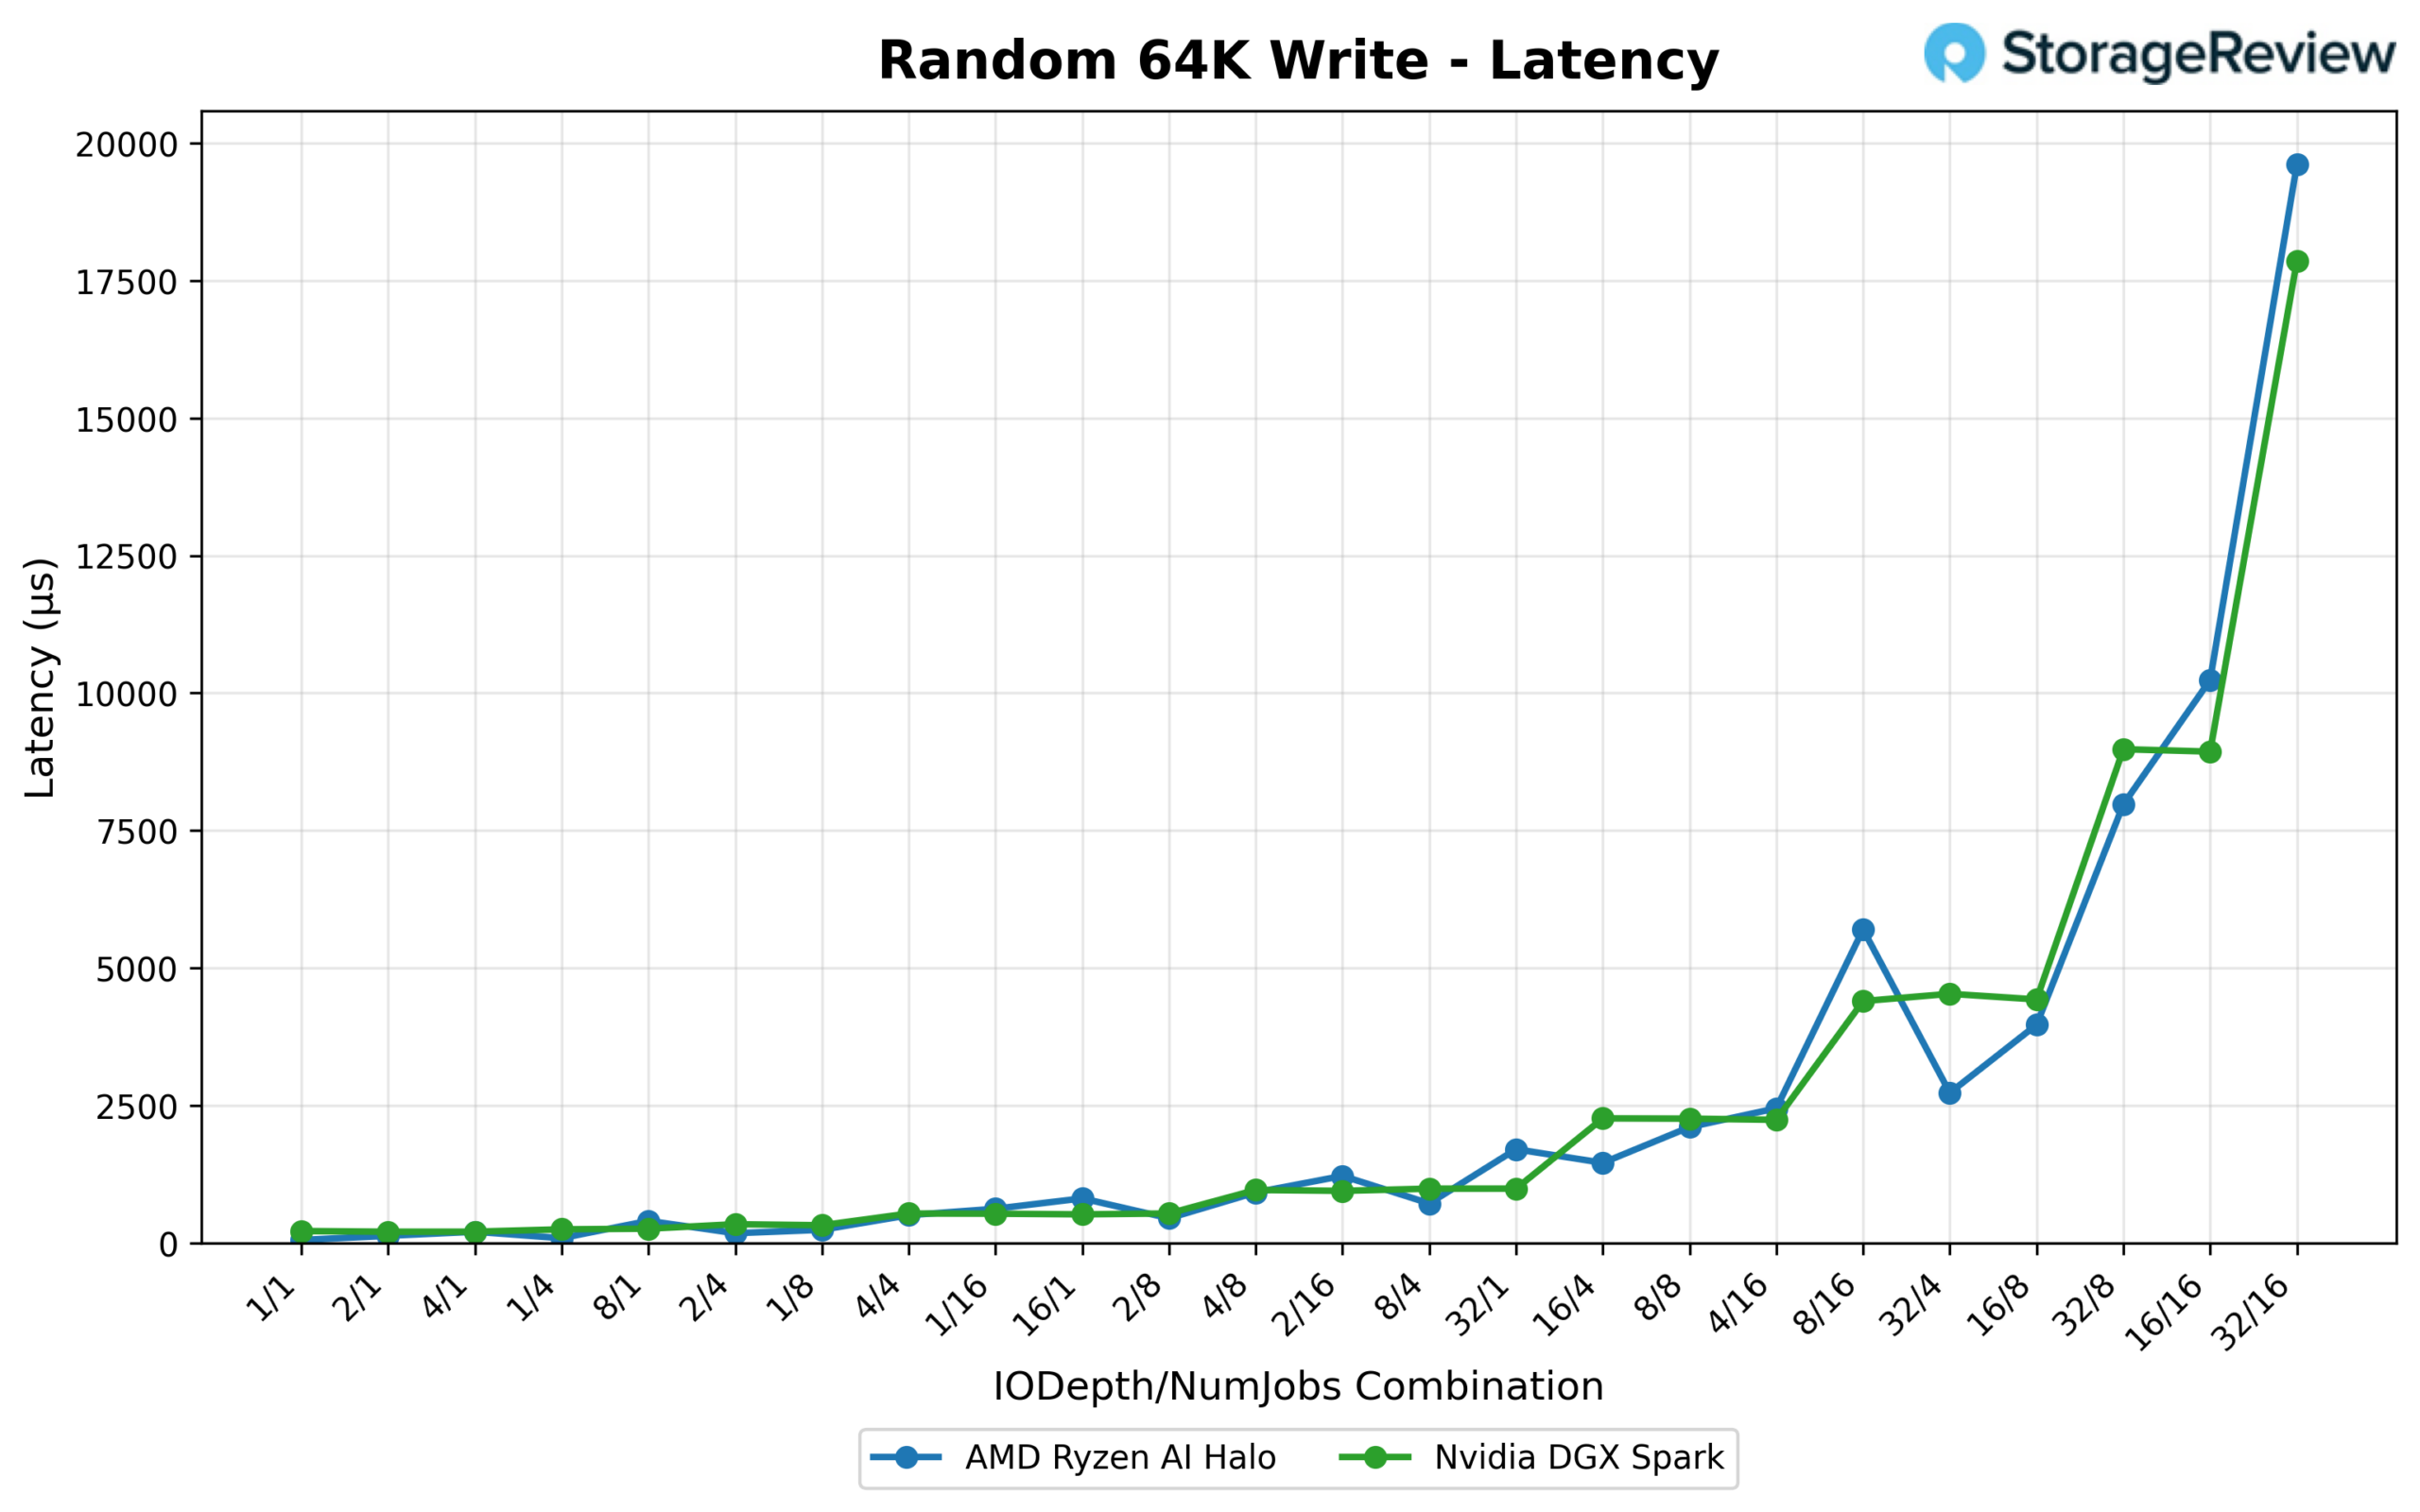
Random 64K write bandwidth is closer between the two platforms than read bandwidth, though the shapes of the curves are very different. The Halo’s bandwidth is spikier: it repeatedly jumps above 2.5 GB/s (peaking at 2,929.1 MB/s / 46.9K IOPS at 32/4) before dropping back to the 1.1–1.5 GB/s range on adjacent combinations. The Spark is comparatively steady, settling into a 1.7–2.0 GB/s band for most of the sweep and peaking at 2,106.6 MB/s (33.7K IOPS) at 2/16.
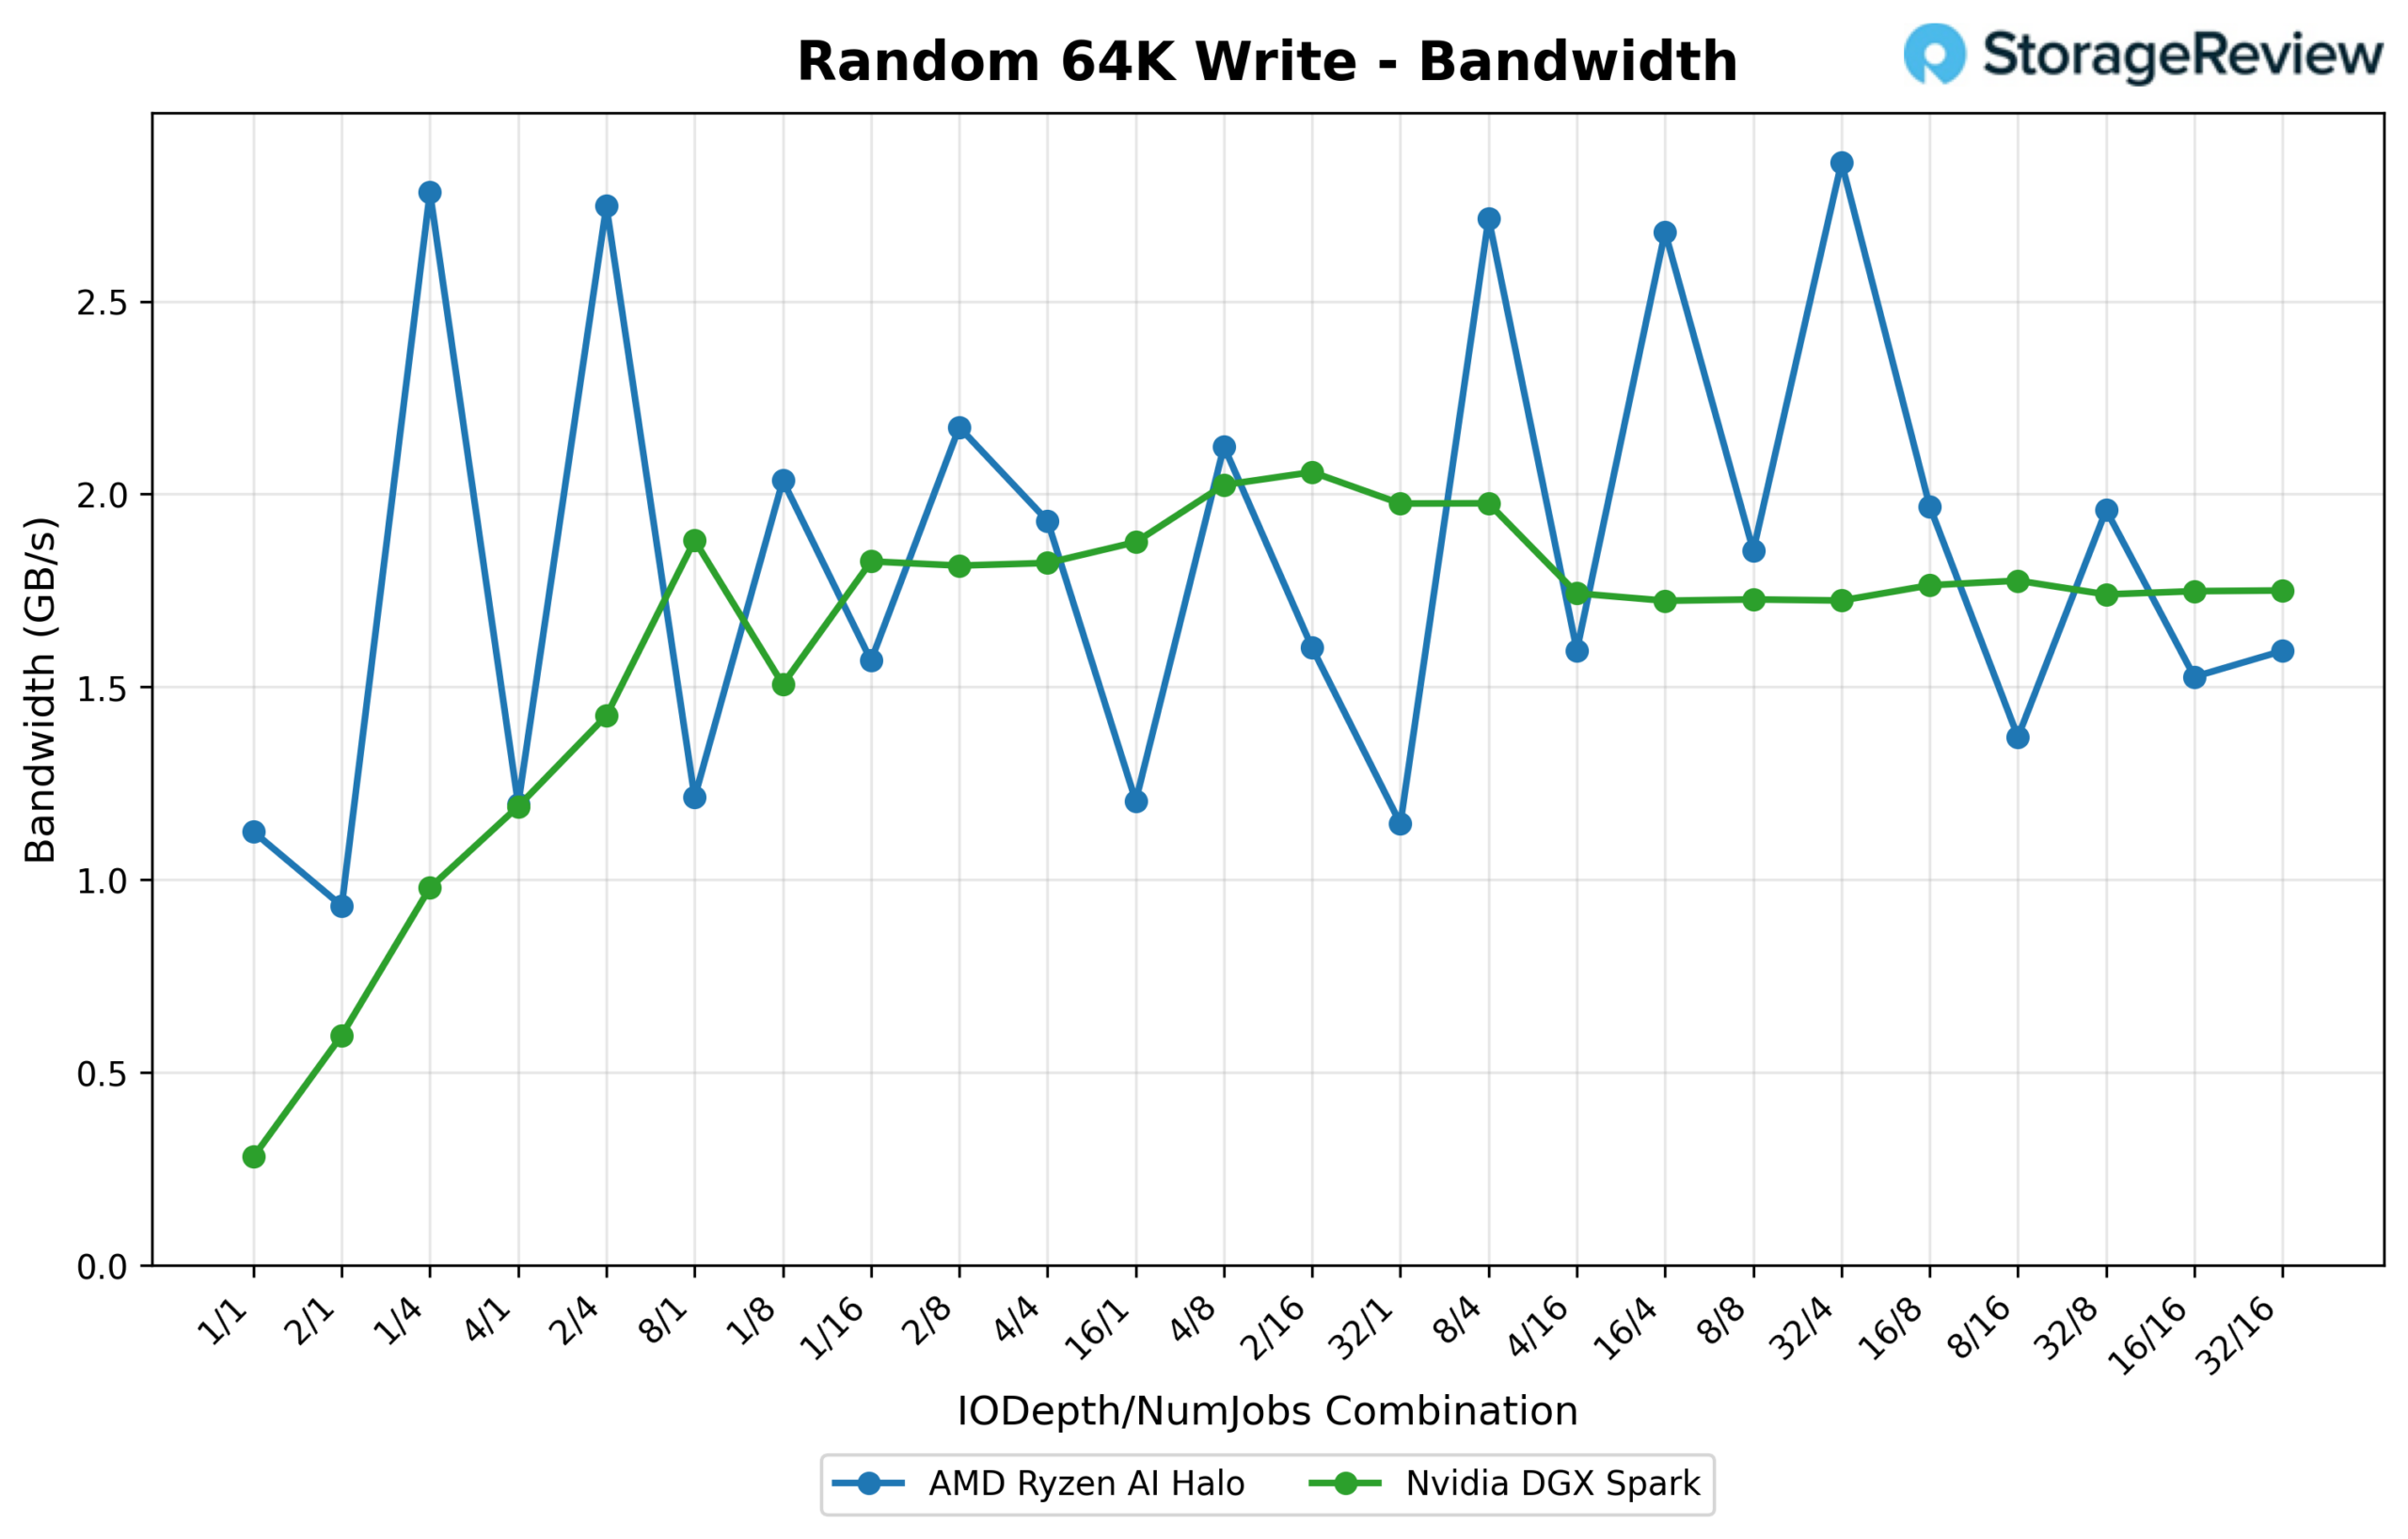
Latency mirrors the 64K read pattern: the Halo is dramatically faster at low queue depth (0.054 ms at 1/1 vs. 0.217 ms for the Spark), and both drives degrade sharply as queue depth and thread count climb into double digits. At full saturation (32/16), the Halo’s latency reaches 19.611 ms, compared with the Spark’s 17.857 ms. Both drives are clearly under heavy write-amplification stress at this point, with the Halo again slightly worse at the very top of the curve.
16K Sequential Read
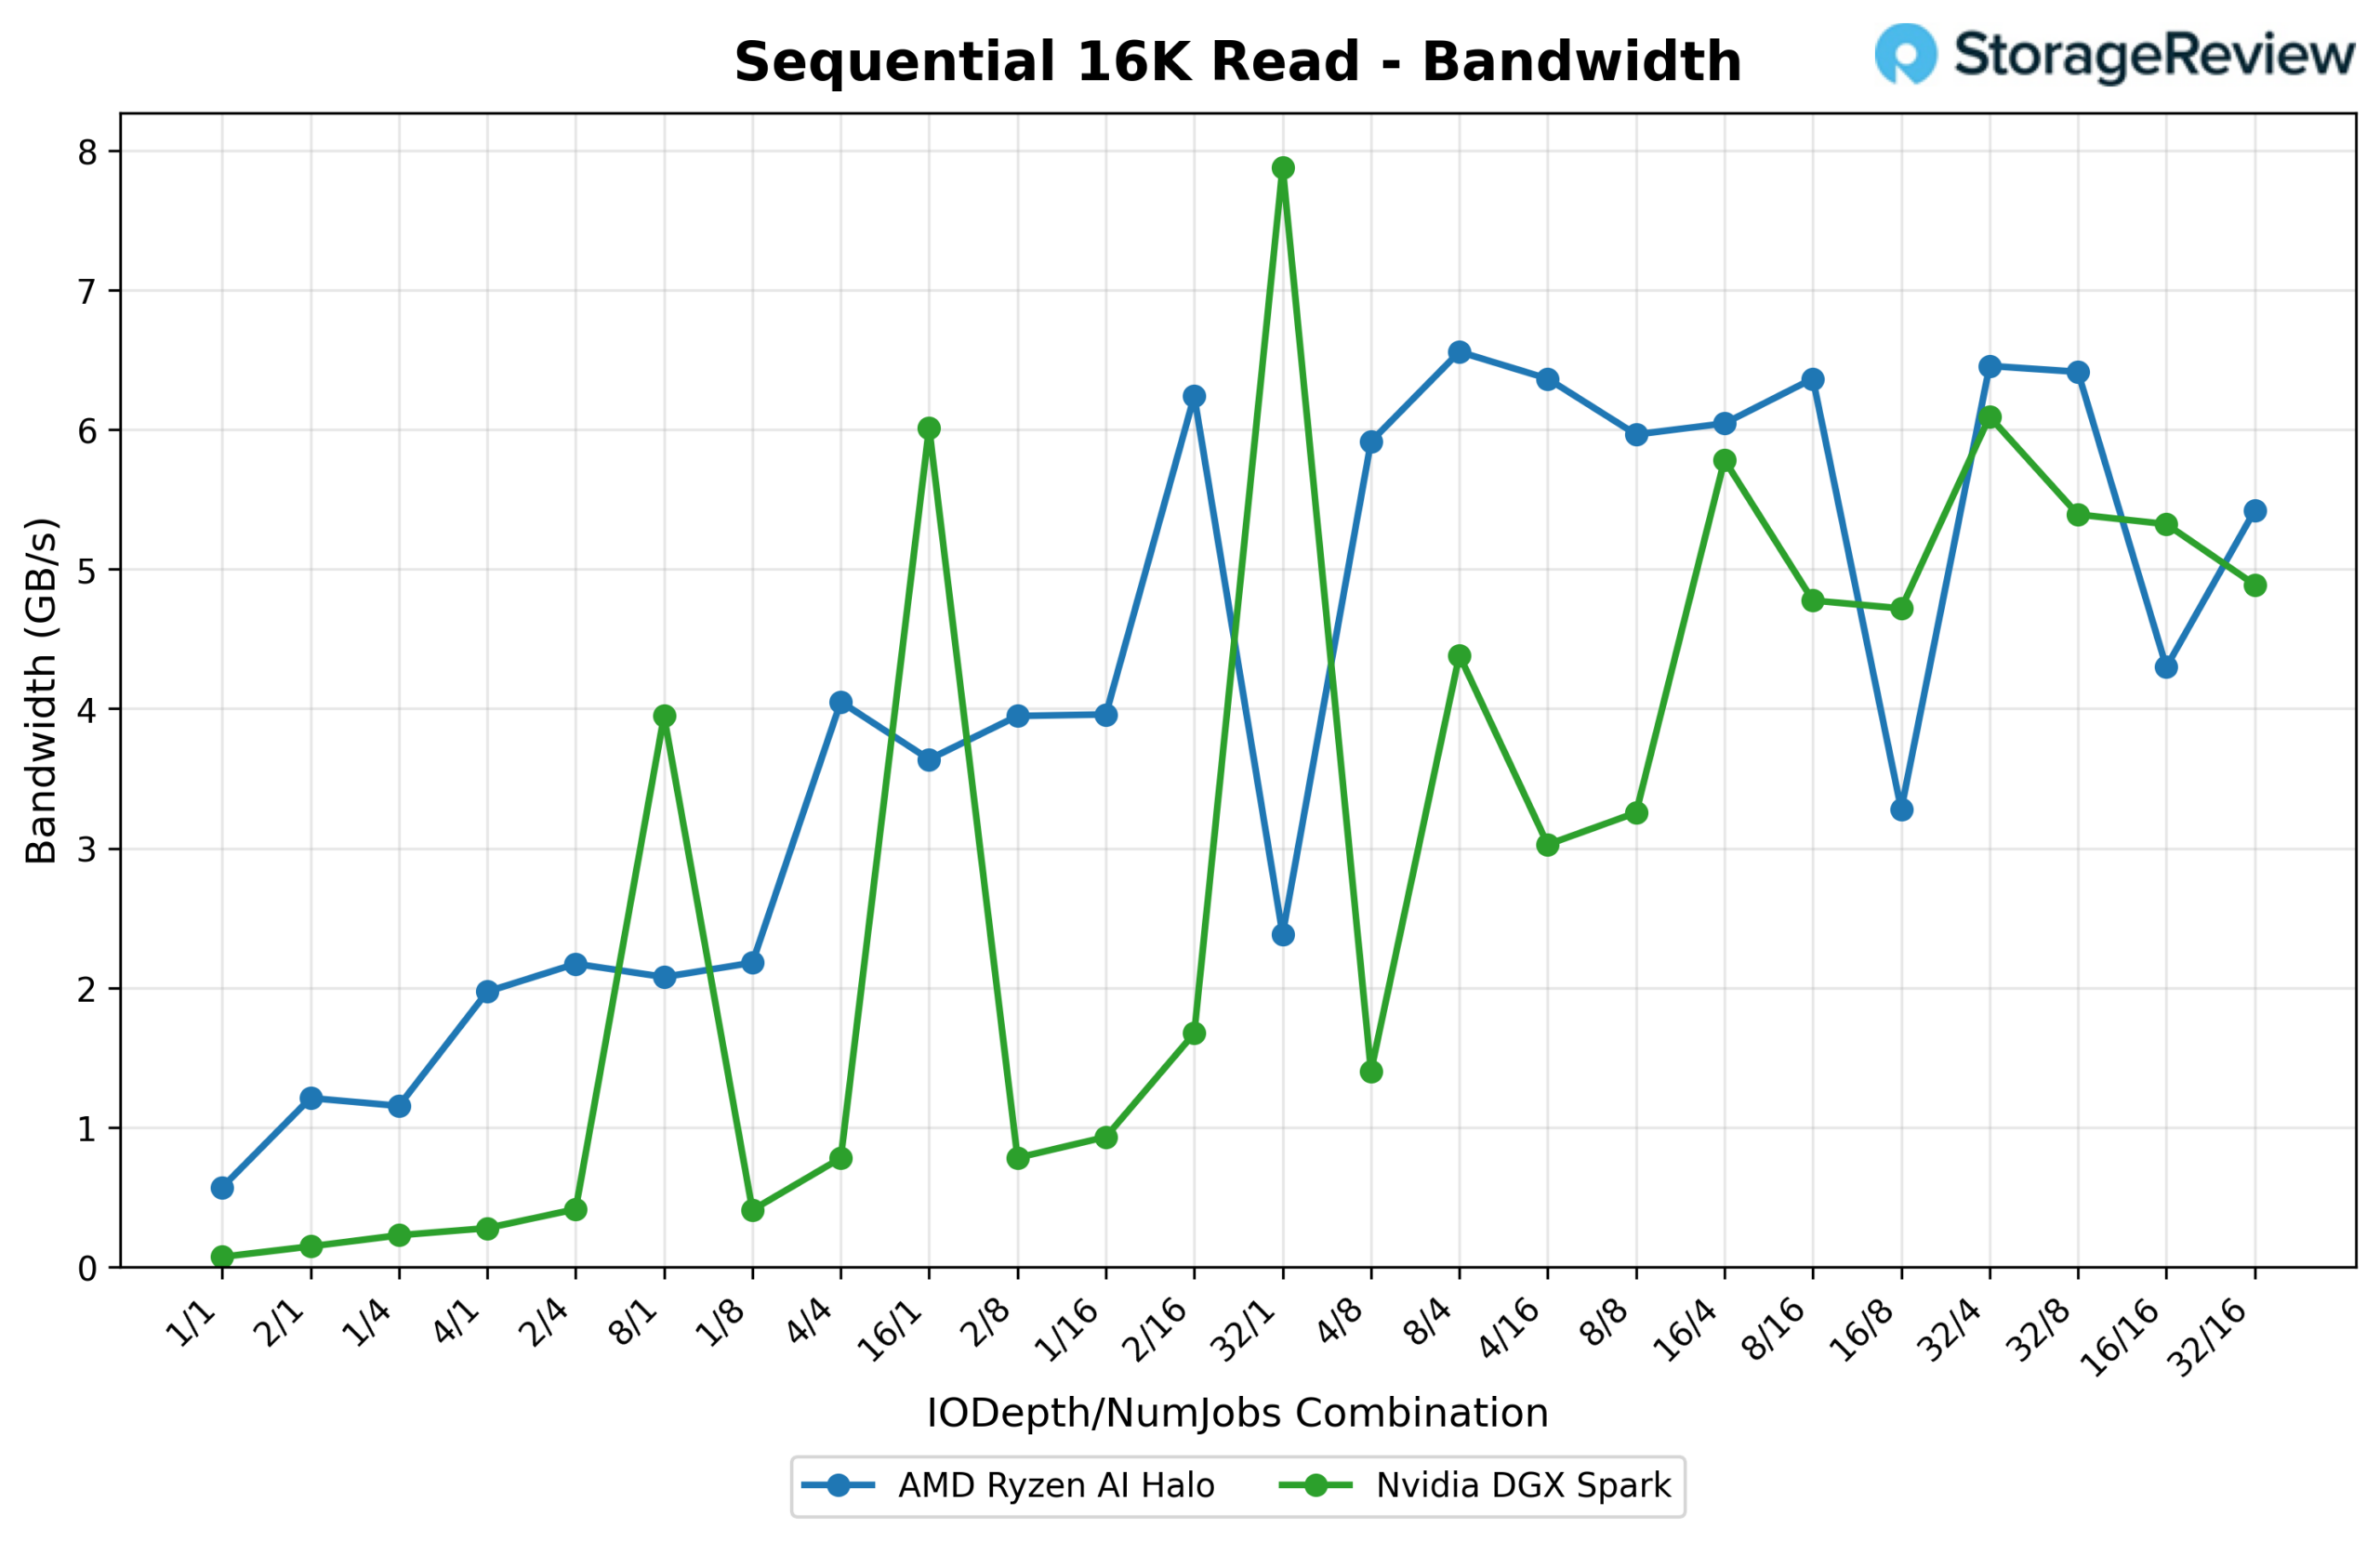
Bandwidth remains high throughout most of the sweep, with both drives sawtoothing between roughly 1–8 GB/s depending on the depth/thread combination. The Spark edges out the higher peak, reaching 8,069.3 MB/s (516.4K IOPS) at 32/1, while the Halo tops out at 6,715.8 MB/s (429.8K IOPS) at 8/4.
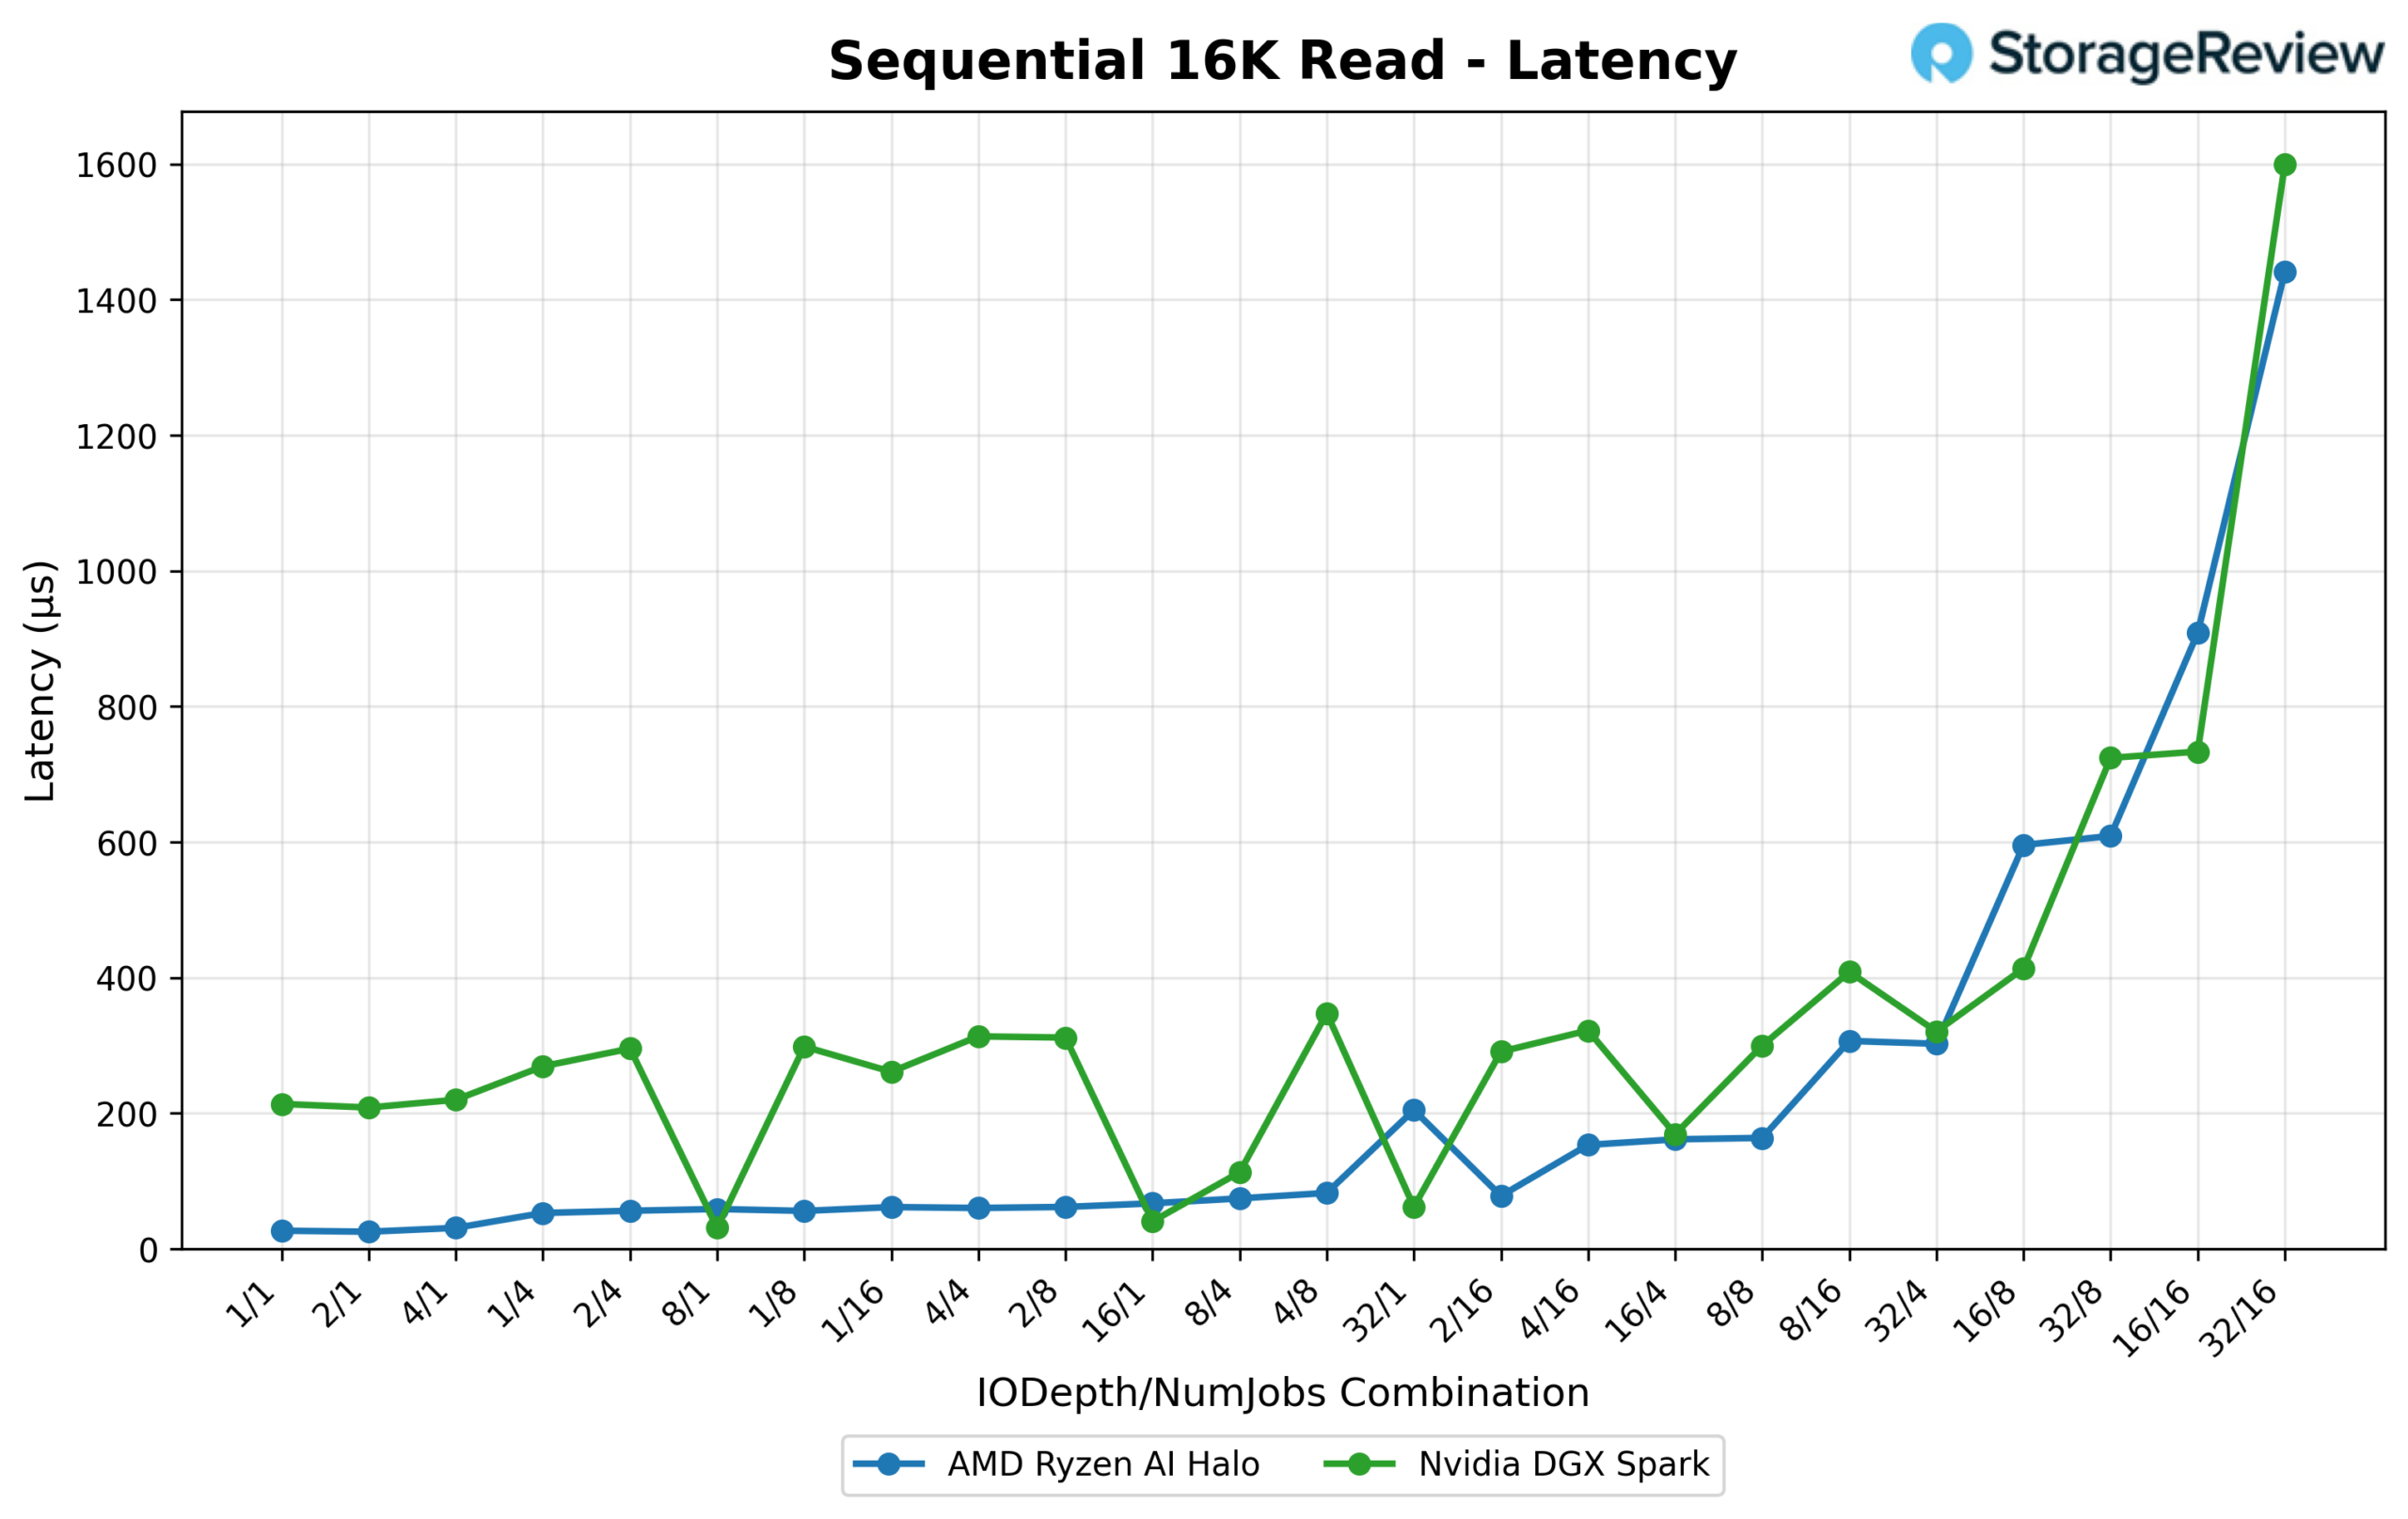
Latency again favors the Halo everywhere except at the very top of the queue. At 1/1, the Halo answers in 0.027 ms versus the Spark’s 0.214 ms, and the Halo maintains lower latency through most of the sweep. Only at the deepest combinations does the gap close. At 32/16, the Halo’s mean latency of 1.441 ms lands just under the Spark’s 1.599 ms, making this one of the few points where the Halo’s latency curve doesn’t blow past the Spark’s at saturation.
16K Sequential Write
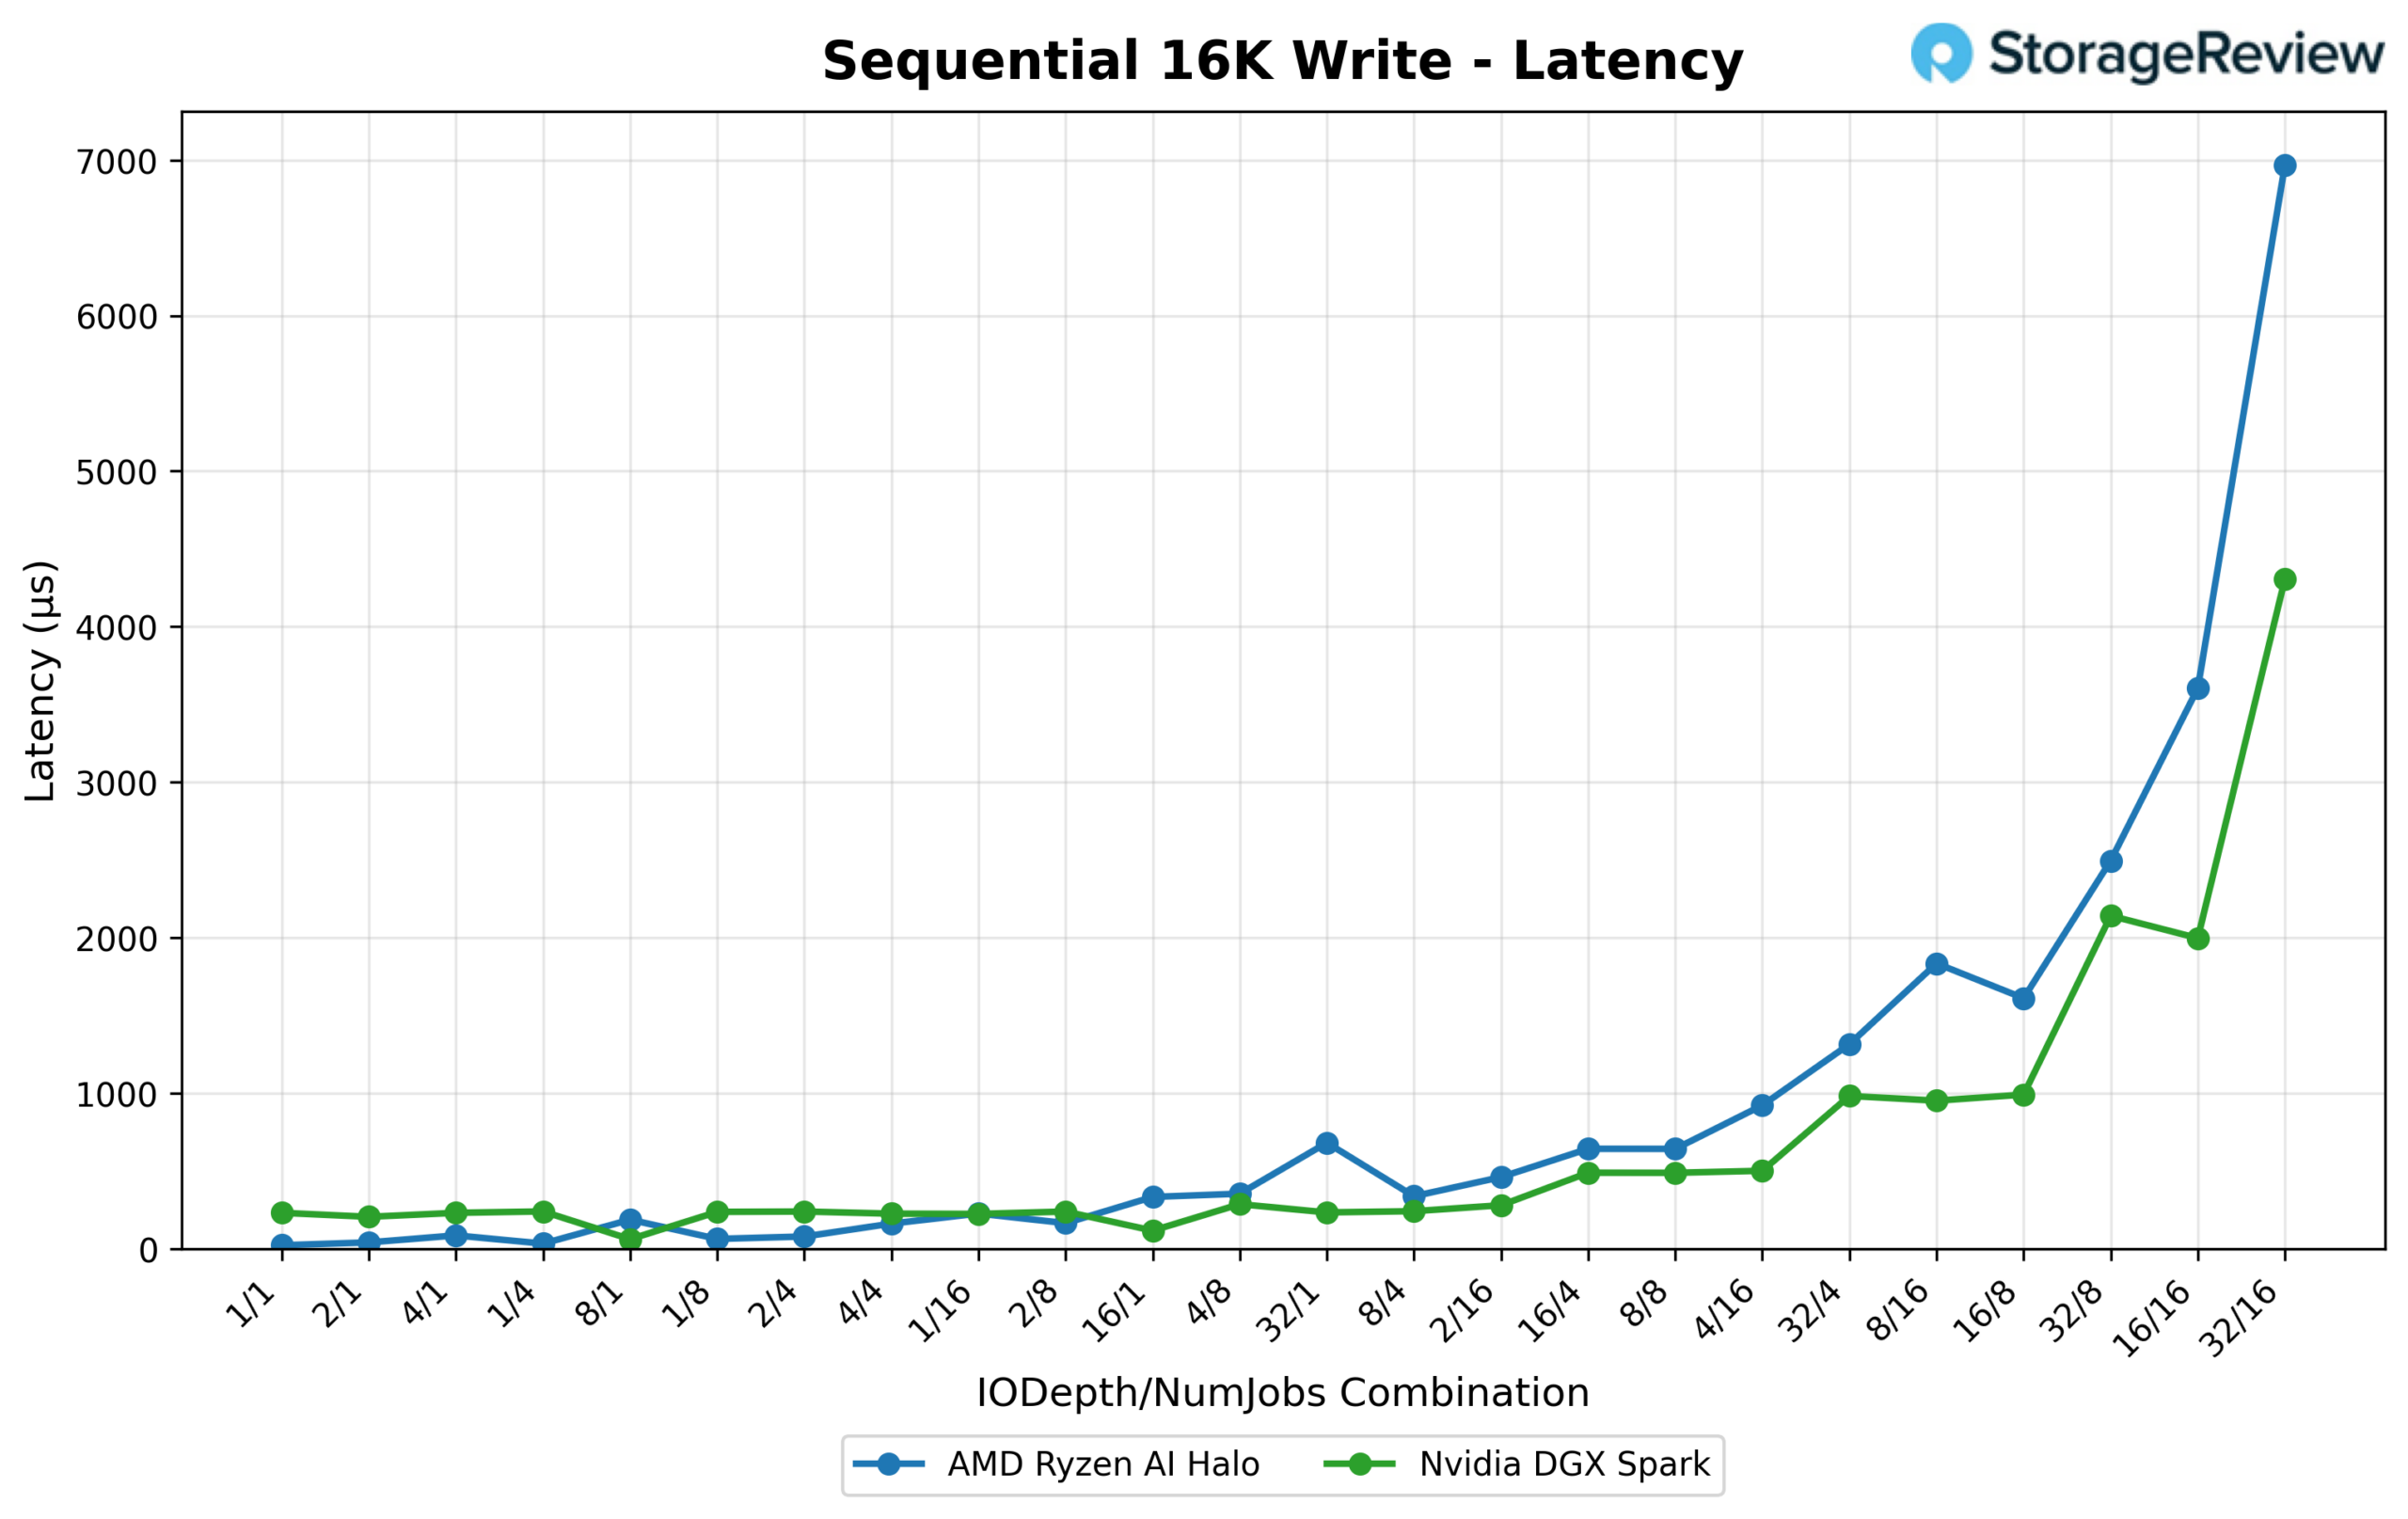
Bandwidth is close here as well: the Spark peaks at 2,141.6 MB/s (137.1K IOPS) at 16/1, and the Halo isn’t far behind at 1,970.9 MB/s (126.1K IOPS) at 1/8.
Latency is where the two diverge sharply. The Halo starts far ahead at low queue depth (0.022 ms at 1/1 versus the Spark’s 0.231 ms), but its latency curve spikes violently as the queue fills. By 32/16, the Halo’s mean latency has climbed to 6.967 ms, well past the Spark’s 4.306 ms at the same point. The Halo’s curve is also far less predictable along the way, with sharp spikes at several mid-range combinations where the Spark remains comparatively flat.
16K Random Read
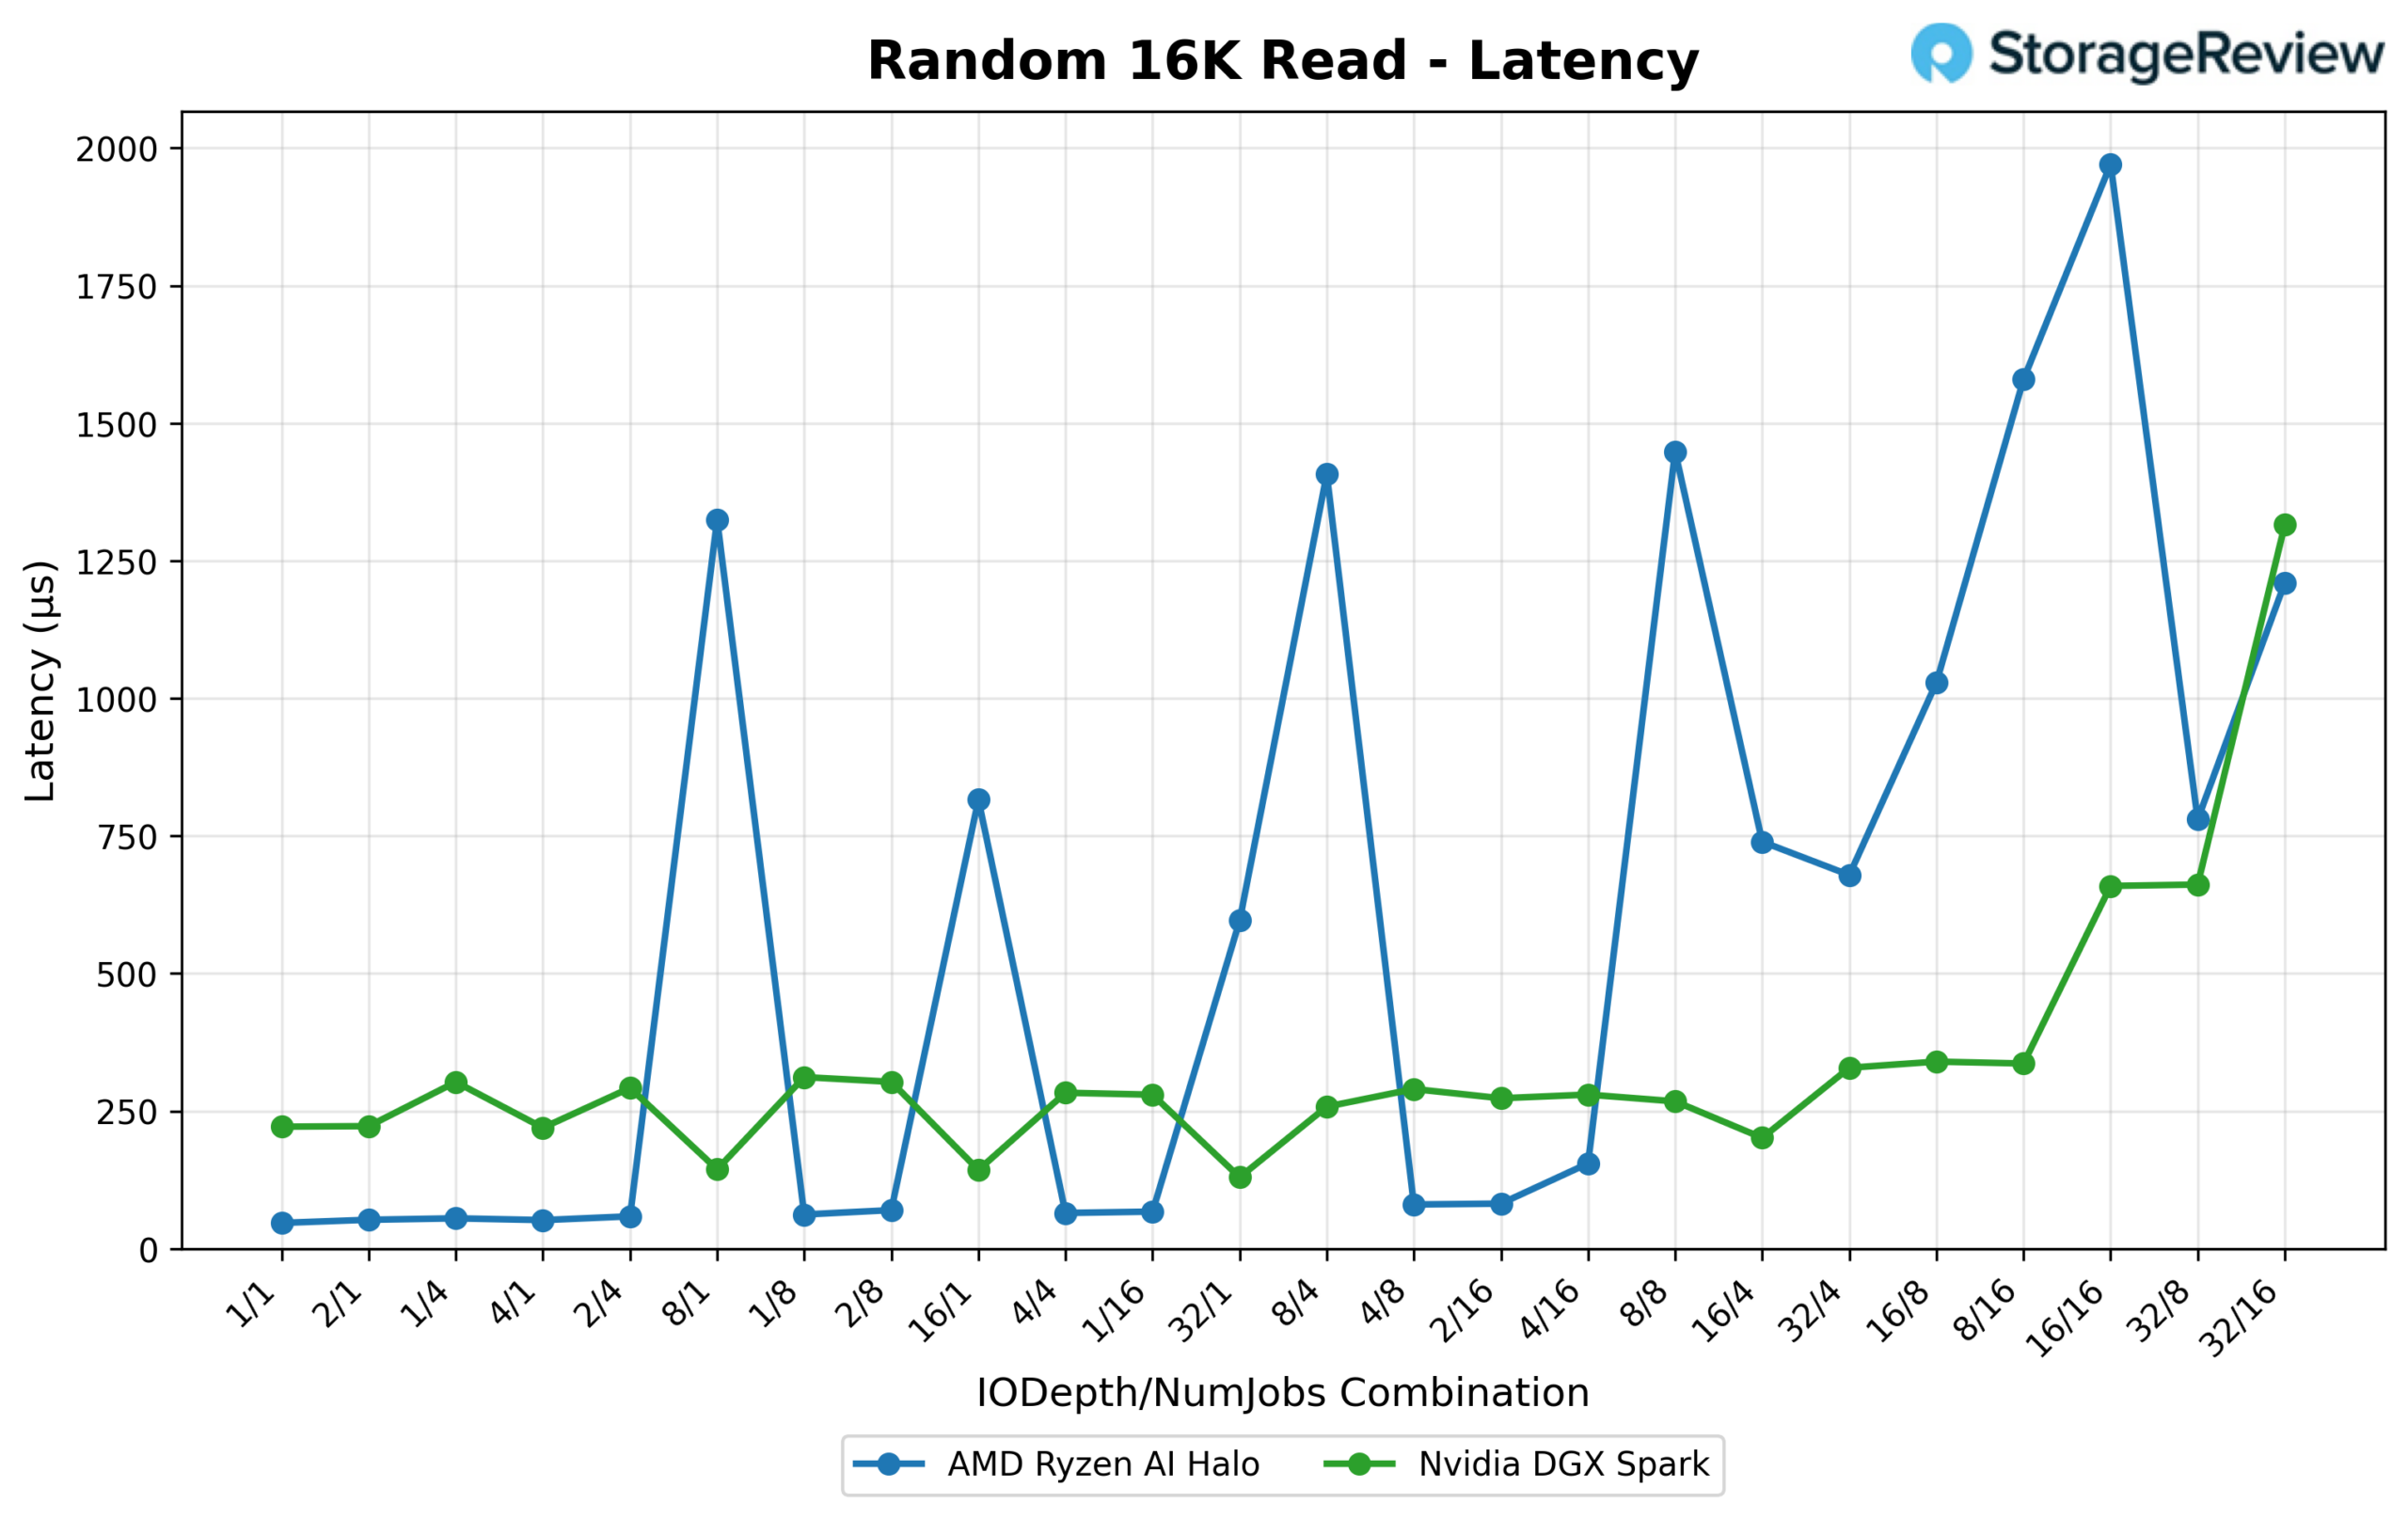
This is one of Halo’s better showings. It actually posts a higher peak bandwidth of 6,609.4 MB/s (423.0K IOPS) at 32/16, versus the Spark’s 6,082.6 MB/s (389.3K IOPS) at the same combination.
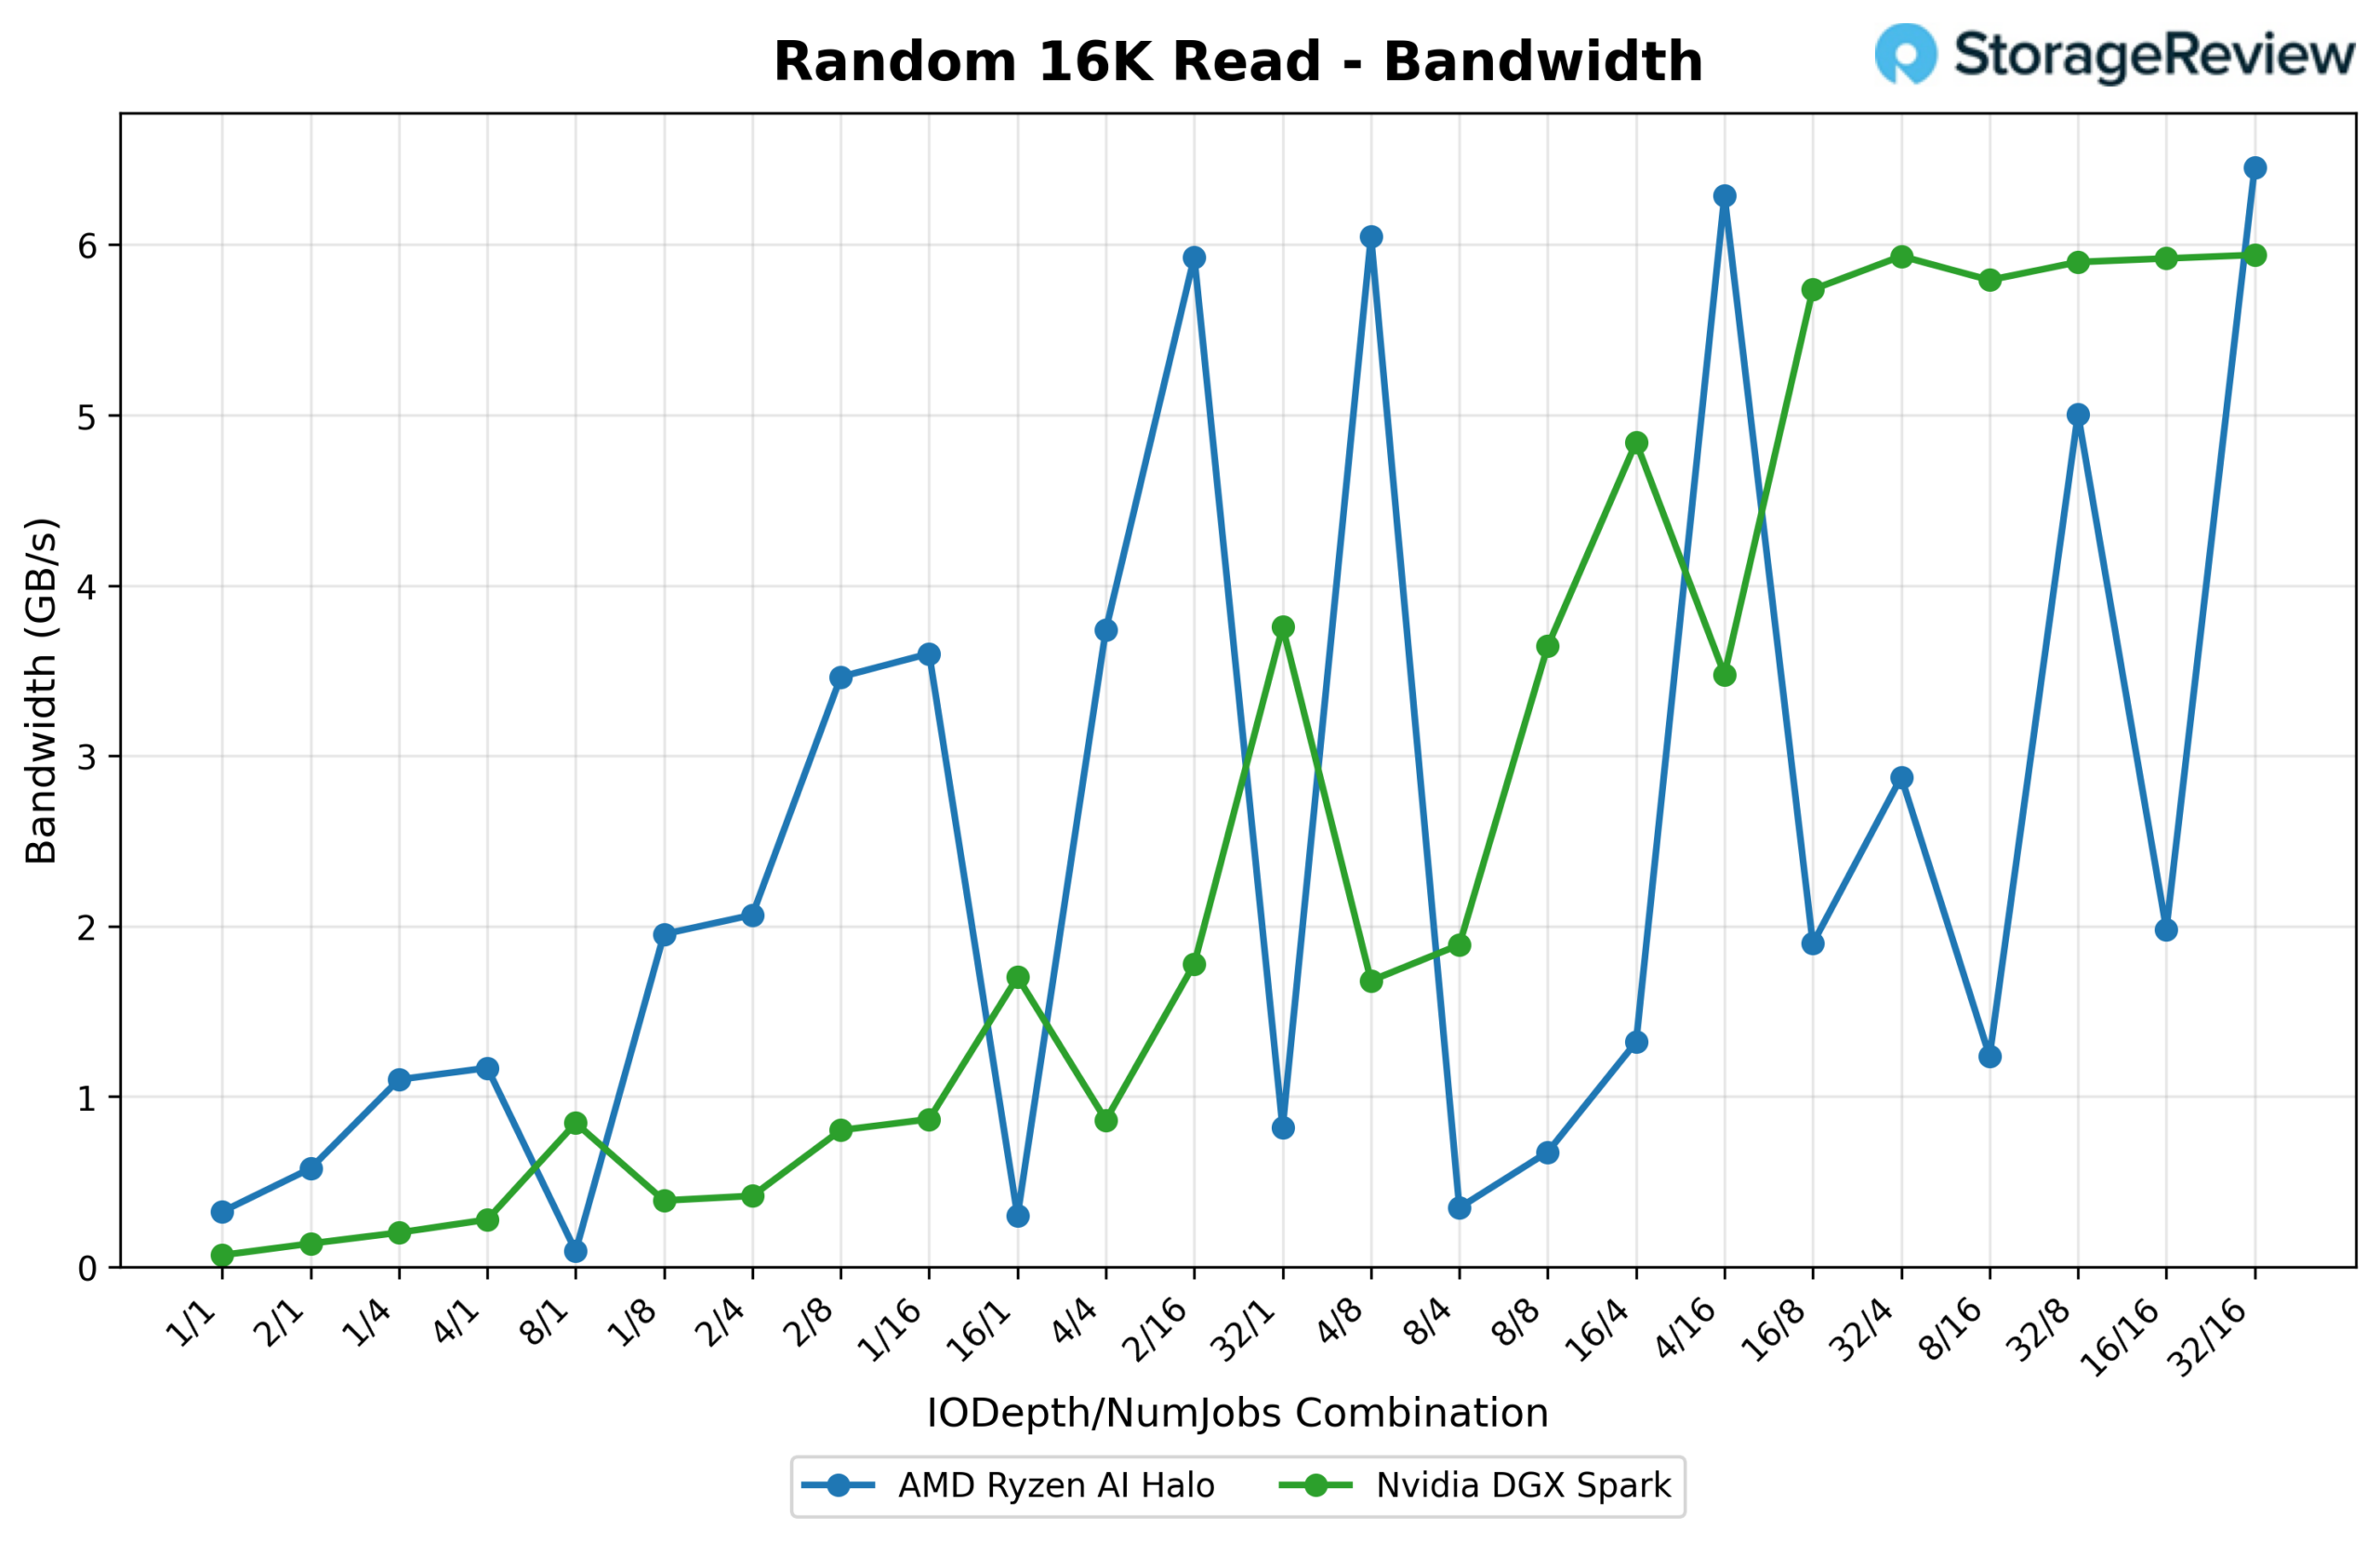
Latency again starts heavily in the Halo’s favor (0.047 ms at 1/1 vs. 0.222 ms for the Spark). Still, the Halo’s latency curve is far more volatile across the sweep, with sharp spikes at 8/1, 16/1, 8/4, and 8/8 that shoot well above the Spark’s comparatively smooth (if higher-baseline) curve. At the very top of the queue, the Halo’s peak latency of 1.971 ms (at 16/16) exceeds the Spark’s peak of 1.315 ms (at 32/16), so the Halo trades consistency for raw low-queue-depth speed.
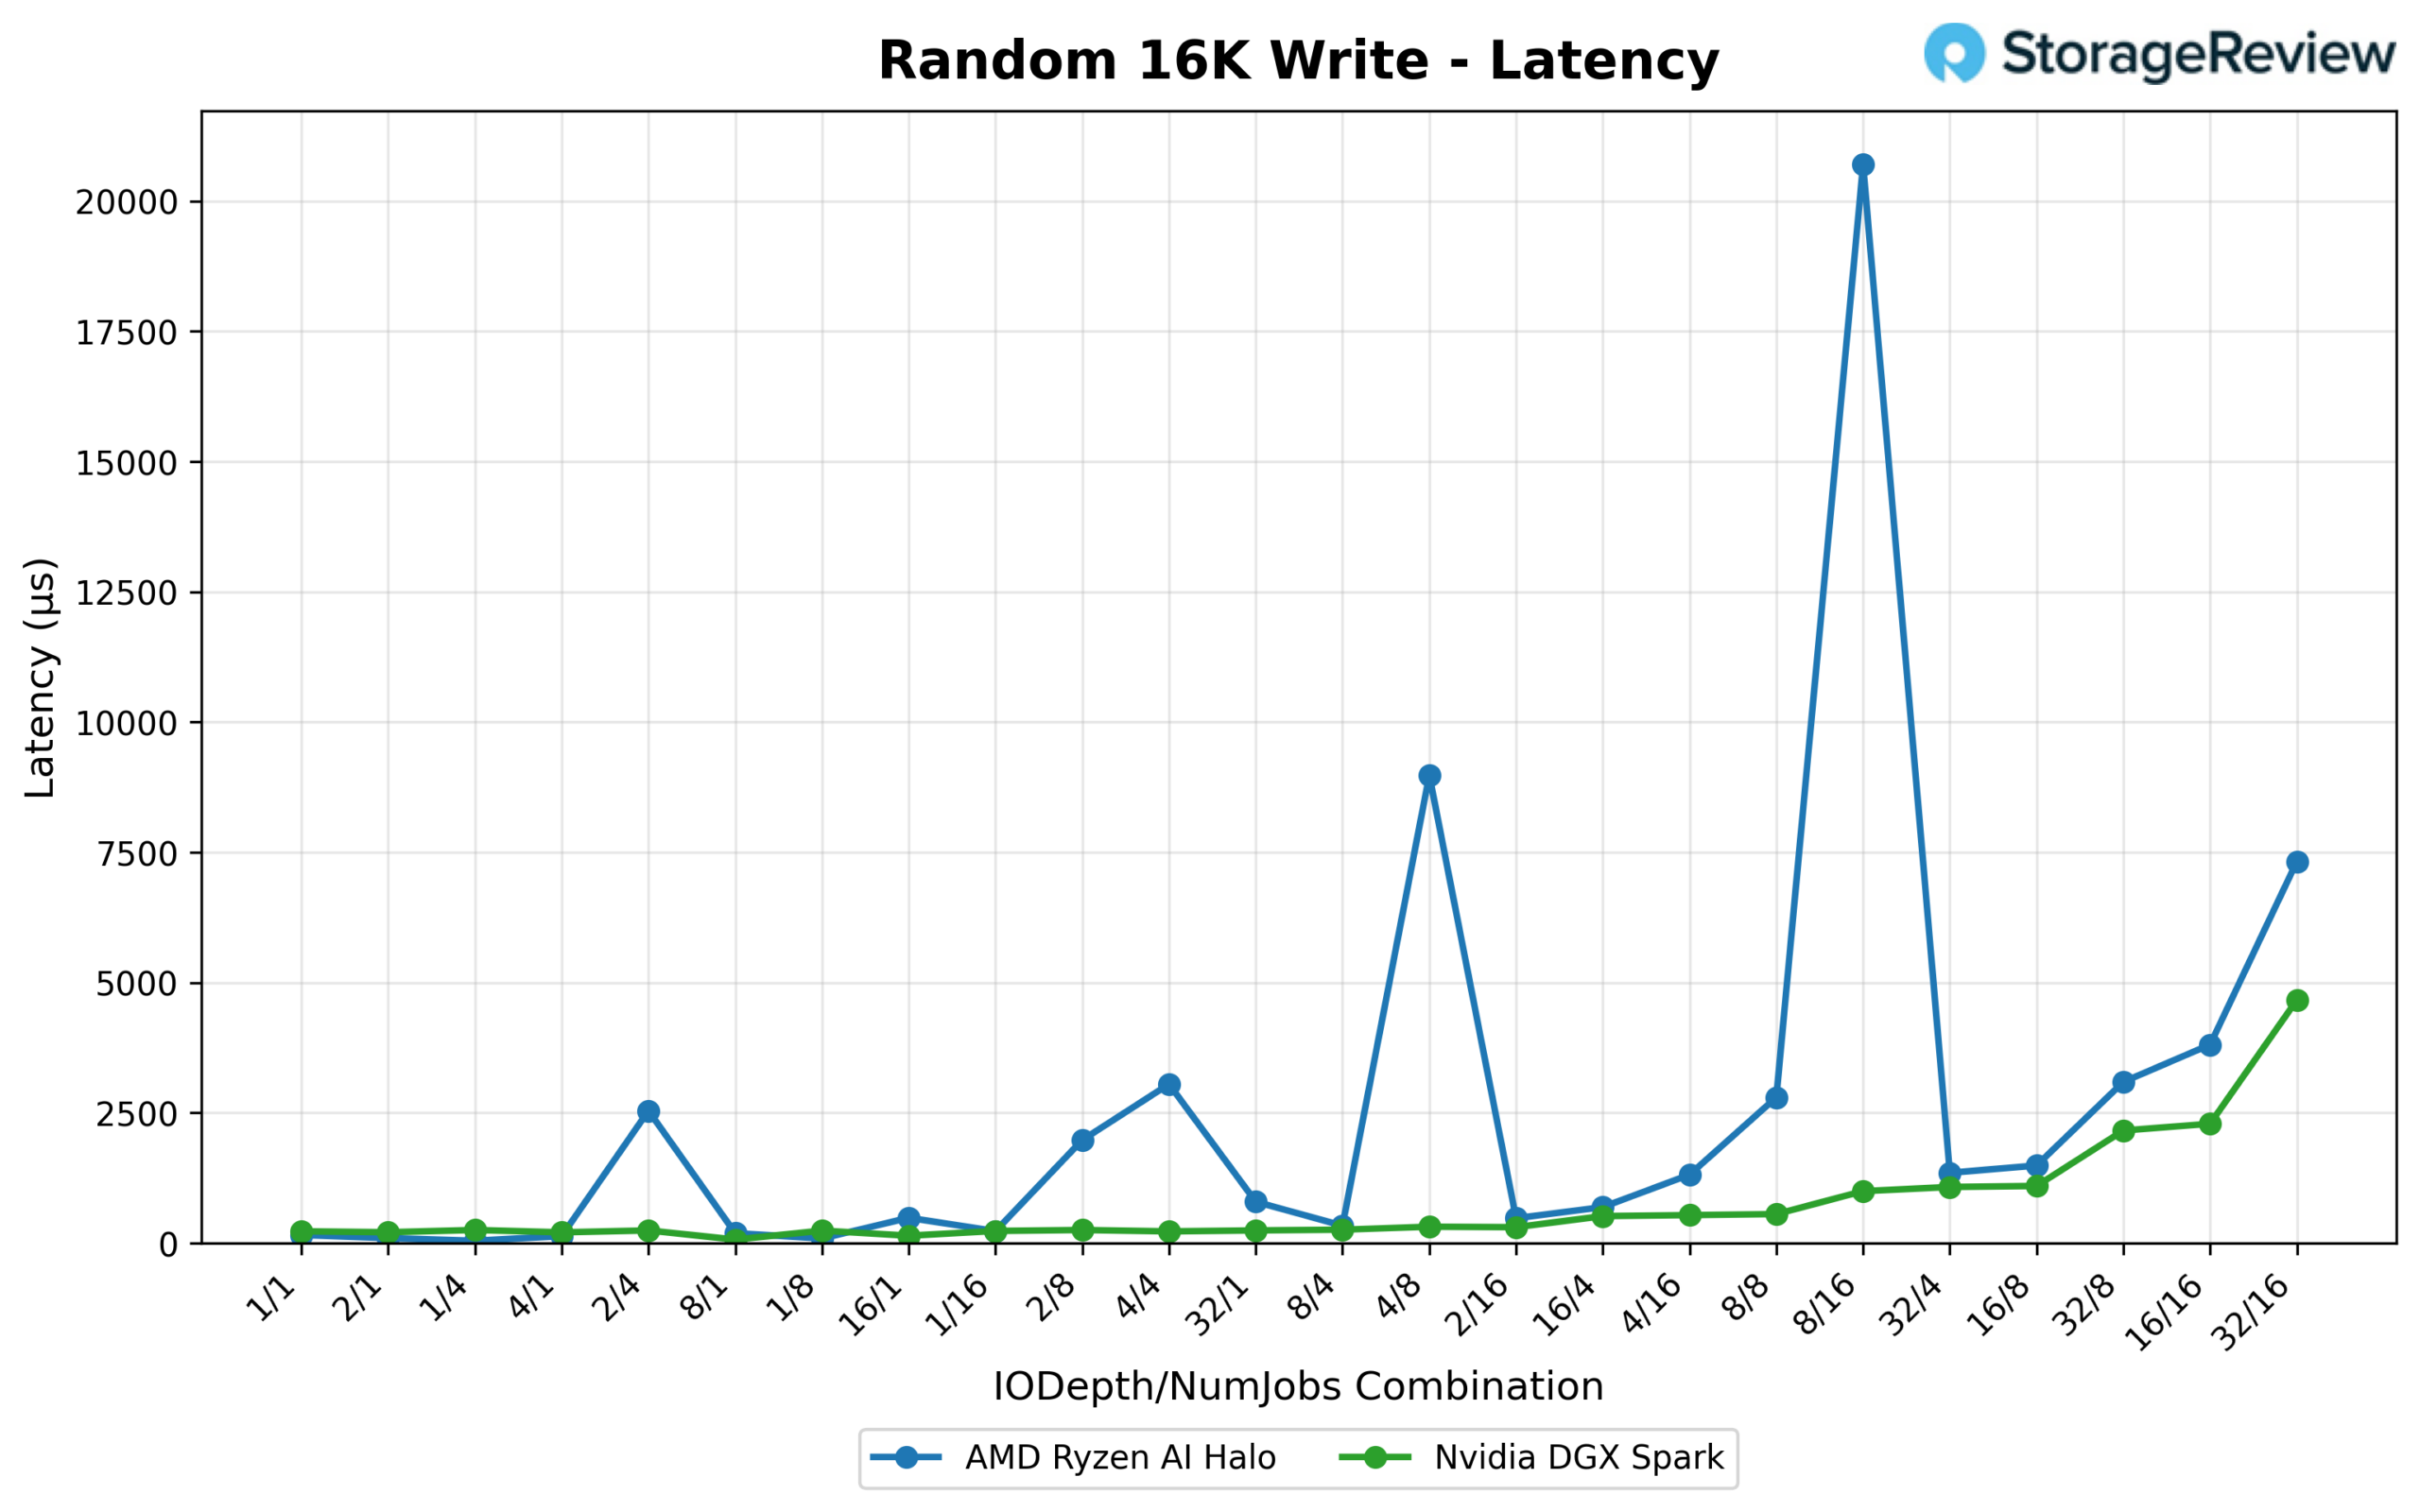
16K Random Write
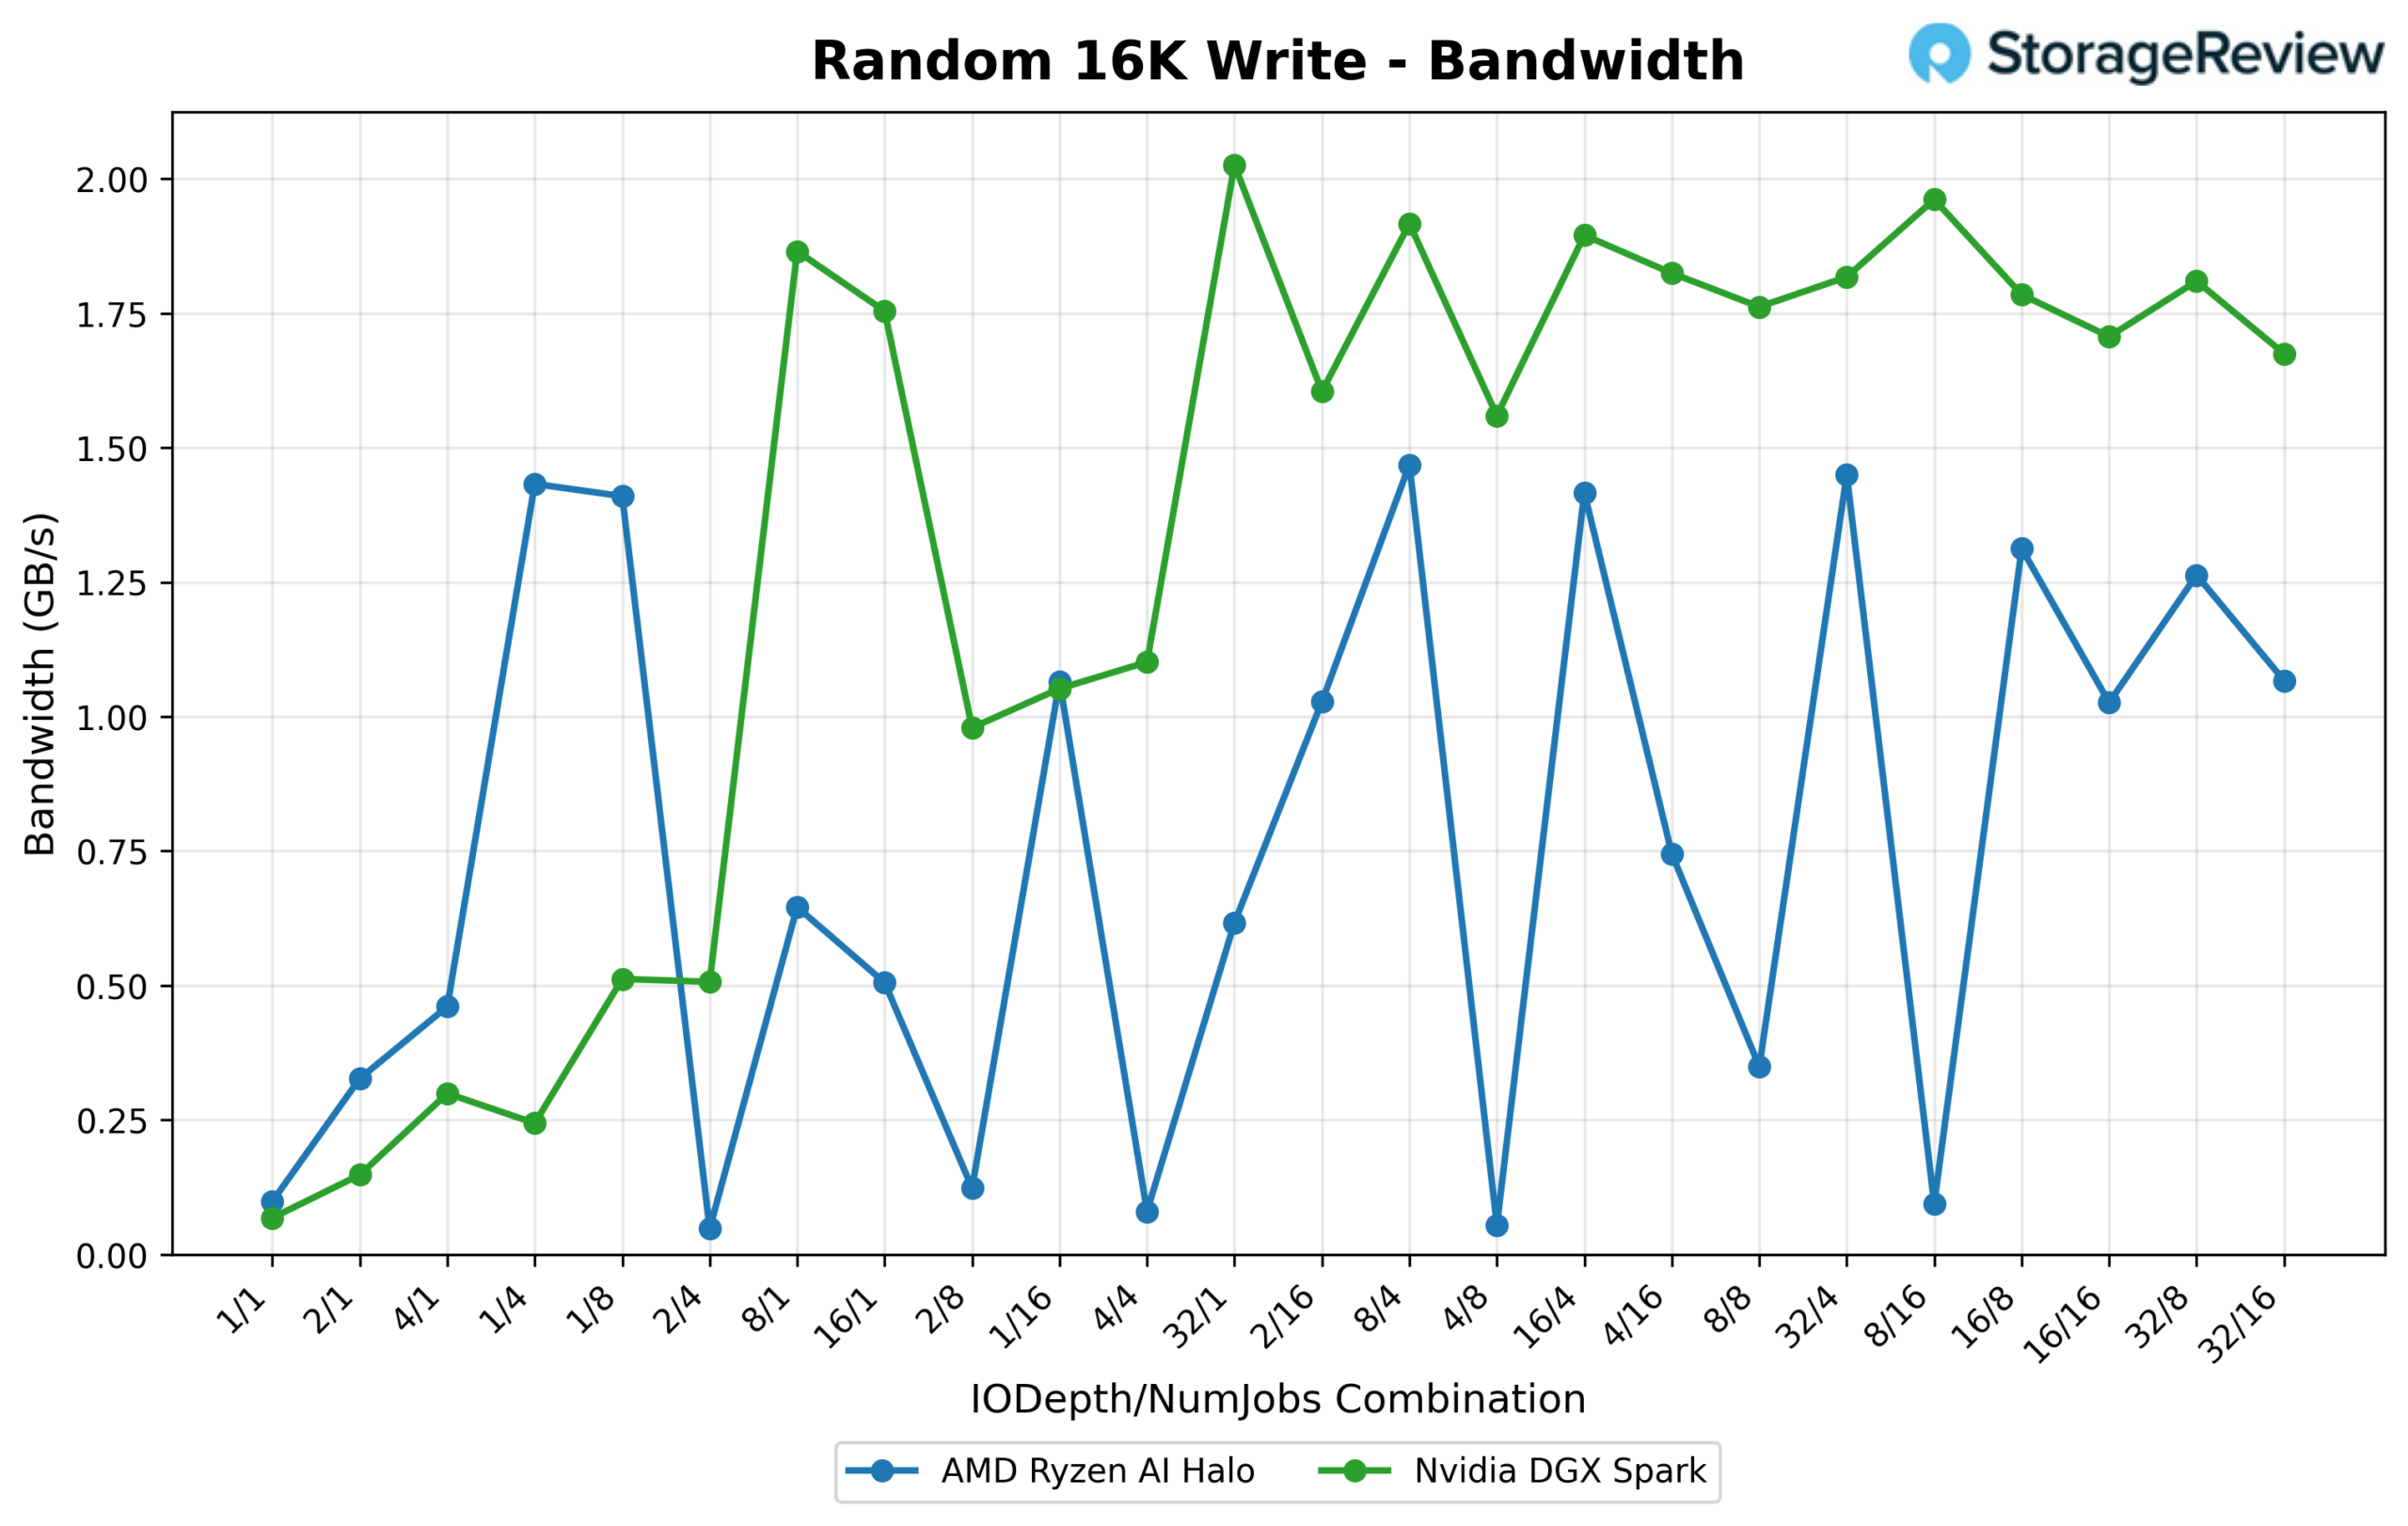
Bandwidth favors the Spark here, which reaches 2,074.1 MB/s (132.7K IOPS) at 32/1, compared with the Halo’s 1,503.5 MB/s (96.2K IOPS) at 8/4. The Spark’s bandwidth curve is also considerably more consistent, holding in the 1.6–2.0 GB/s range for most of the sweep after the initial ramp. In comparison, the Halo swings wildly between roughly 0.1 and 1.5 GB/s from one combination to the next.
Latency is where this test stands out: the Halo starts lower at 1/1 (0.154 ms vs. 0.224 ms), but at 8/16 its mean latency spikes to an extreme 20.698 ms, nearly 4.5x Spark’s worst-case 4.664 ms anywhere in the sweep. Aside from that single spike, the Halo’s latency is otherwise reasonable, but it’s a significant outlier worth flagging for any workload that might land on that specific depth/thread combination.
4K Random Read
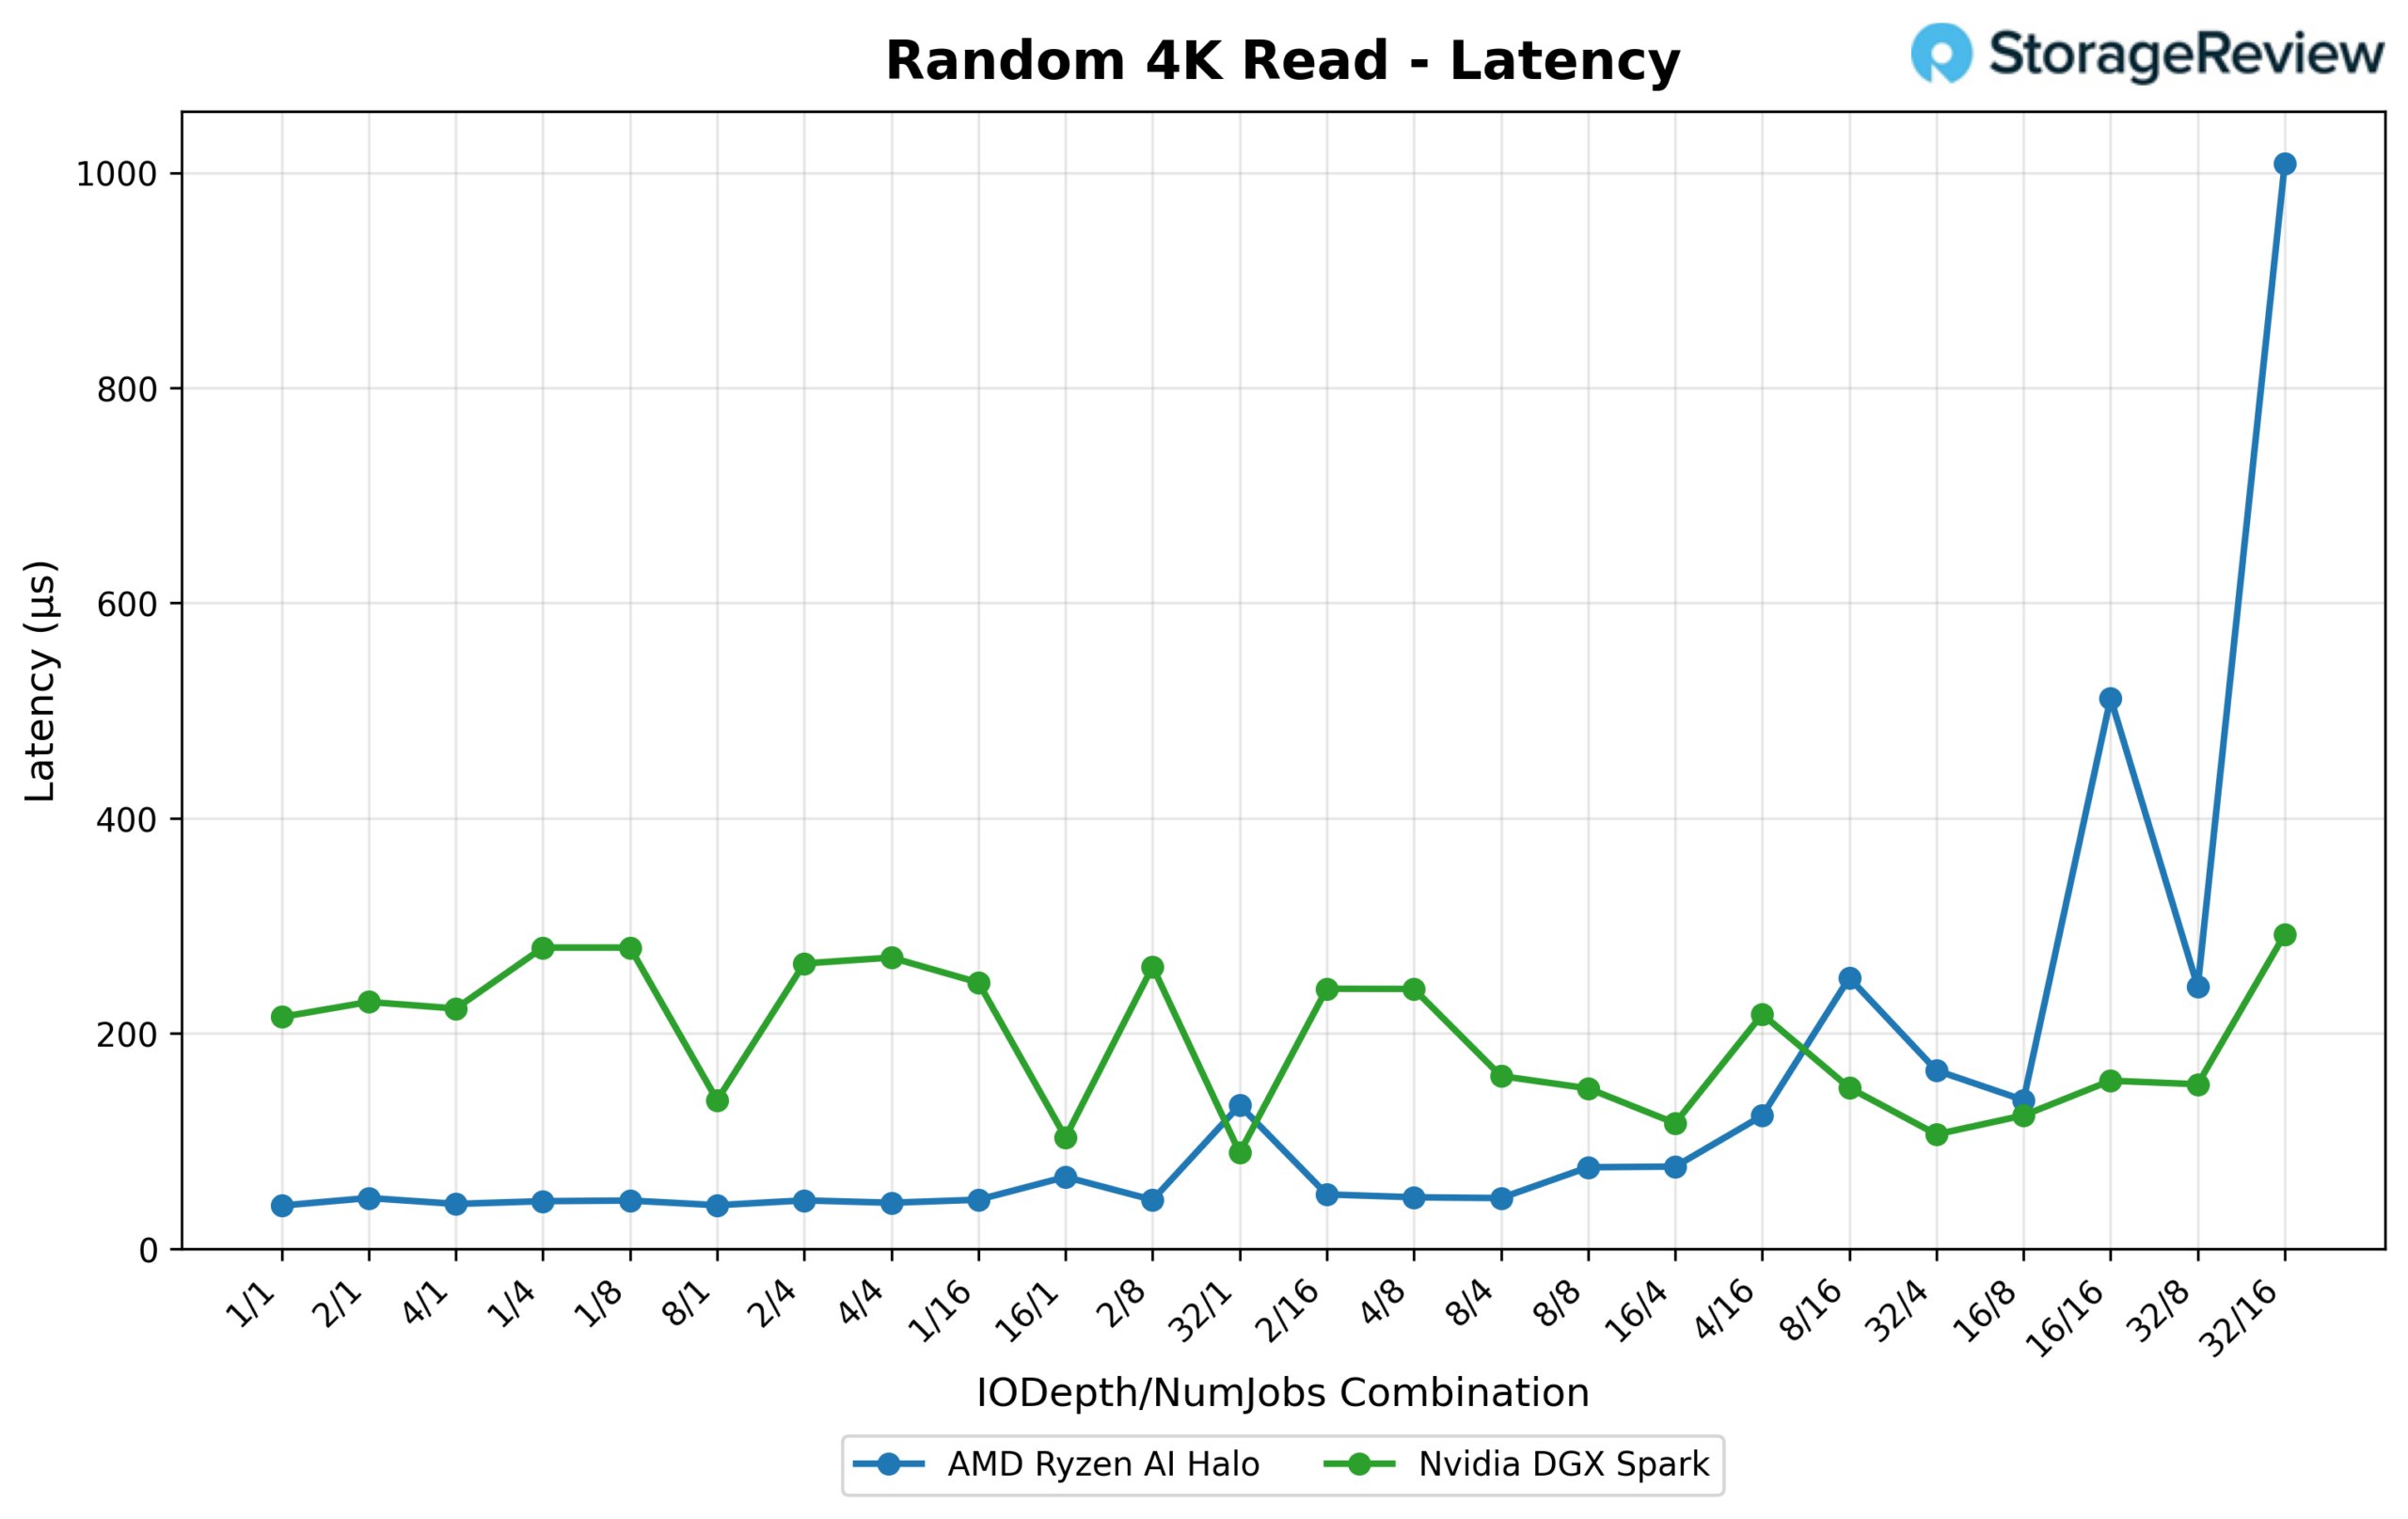
At low queue depth, the Halo responds dramatically faster (0.04 ms at 1/1 versus the Spark’s 0.215 ms), and it holds a latency advantage through most of the low-to-mid range of the sweep. But the Spark pulls ahead decisively in throughput at scale: its peak IOPS reaches 1,750.7K (6,838.8 MB/s) at 32/16, well clear of the Halo’s peak of 1,050.4K IOPS (4,103.2 MB/s) at 32/8.
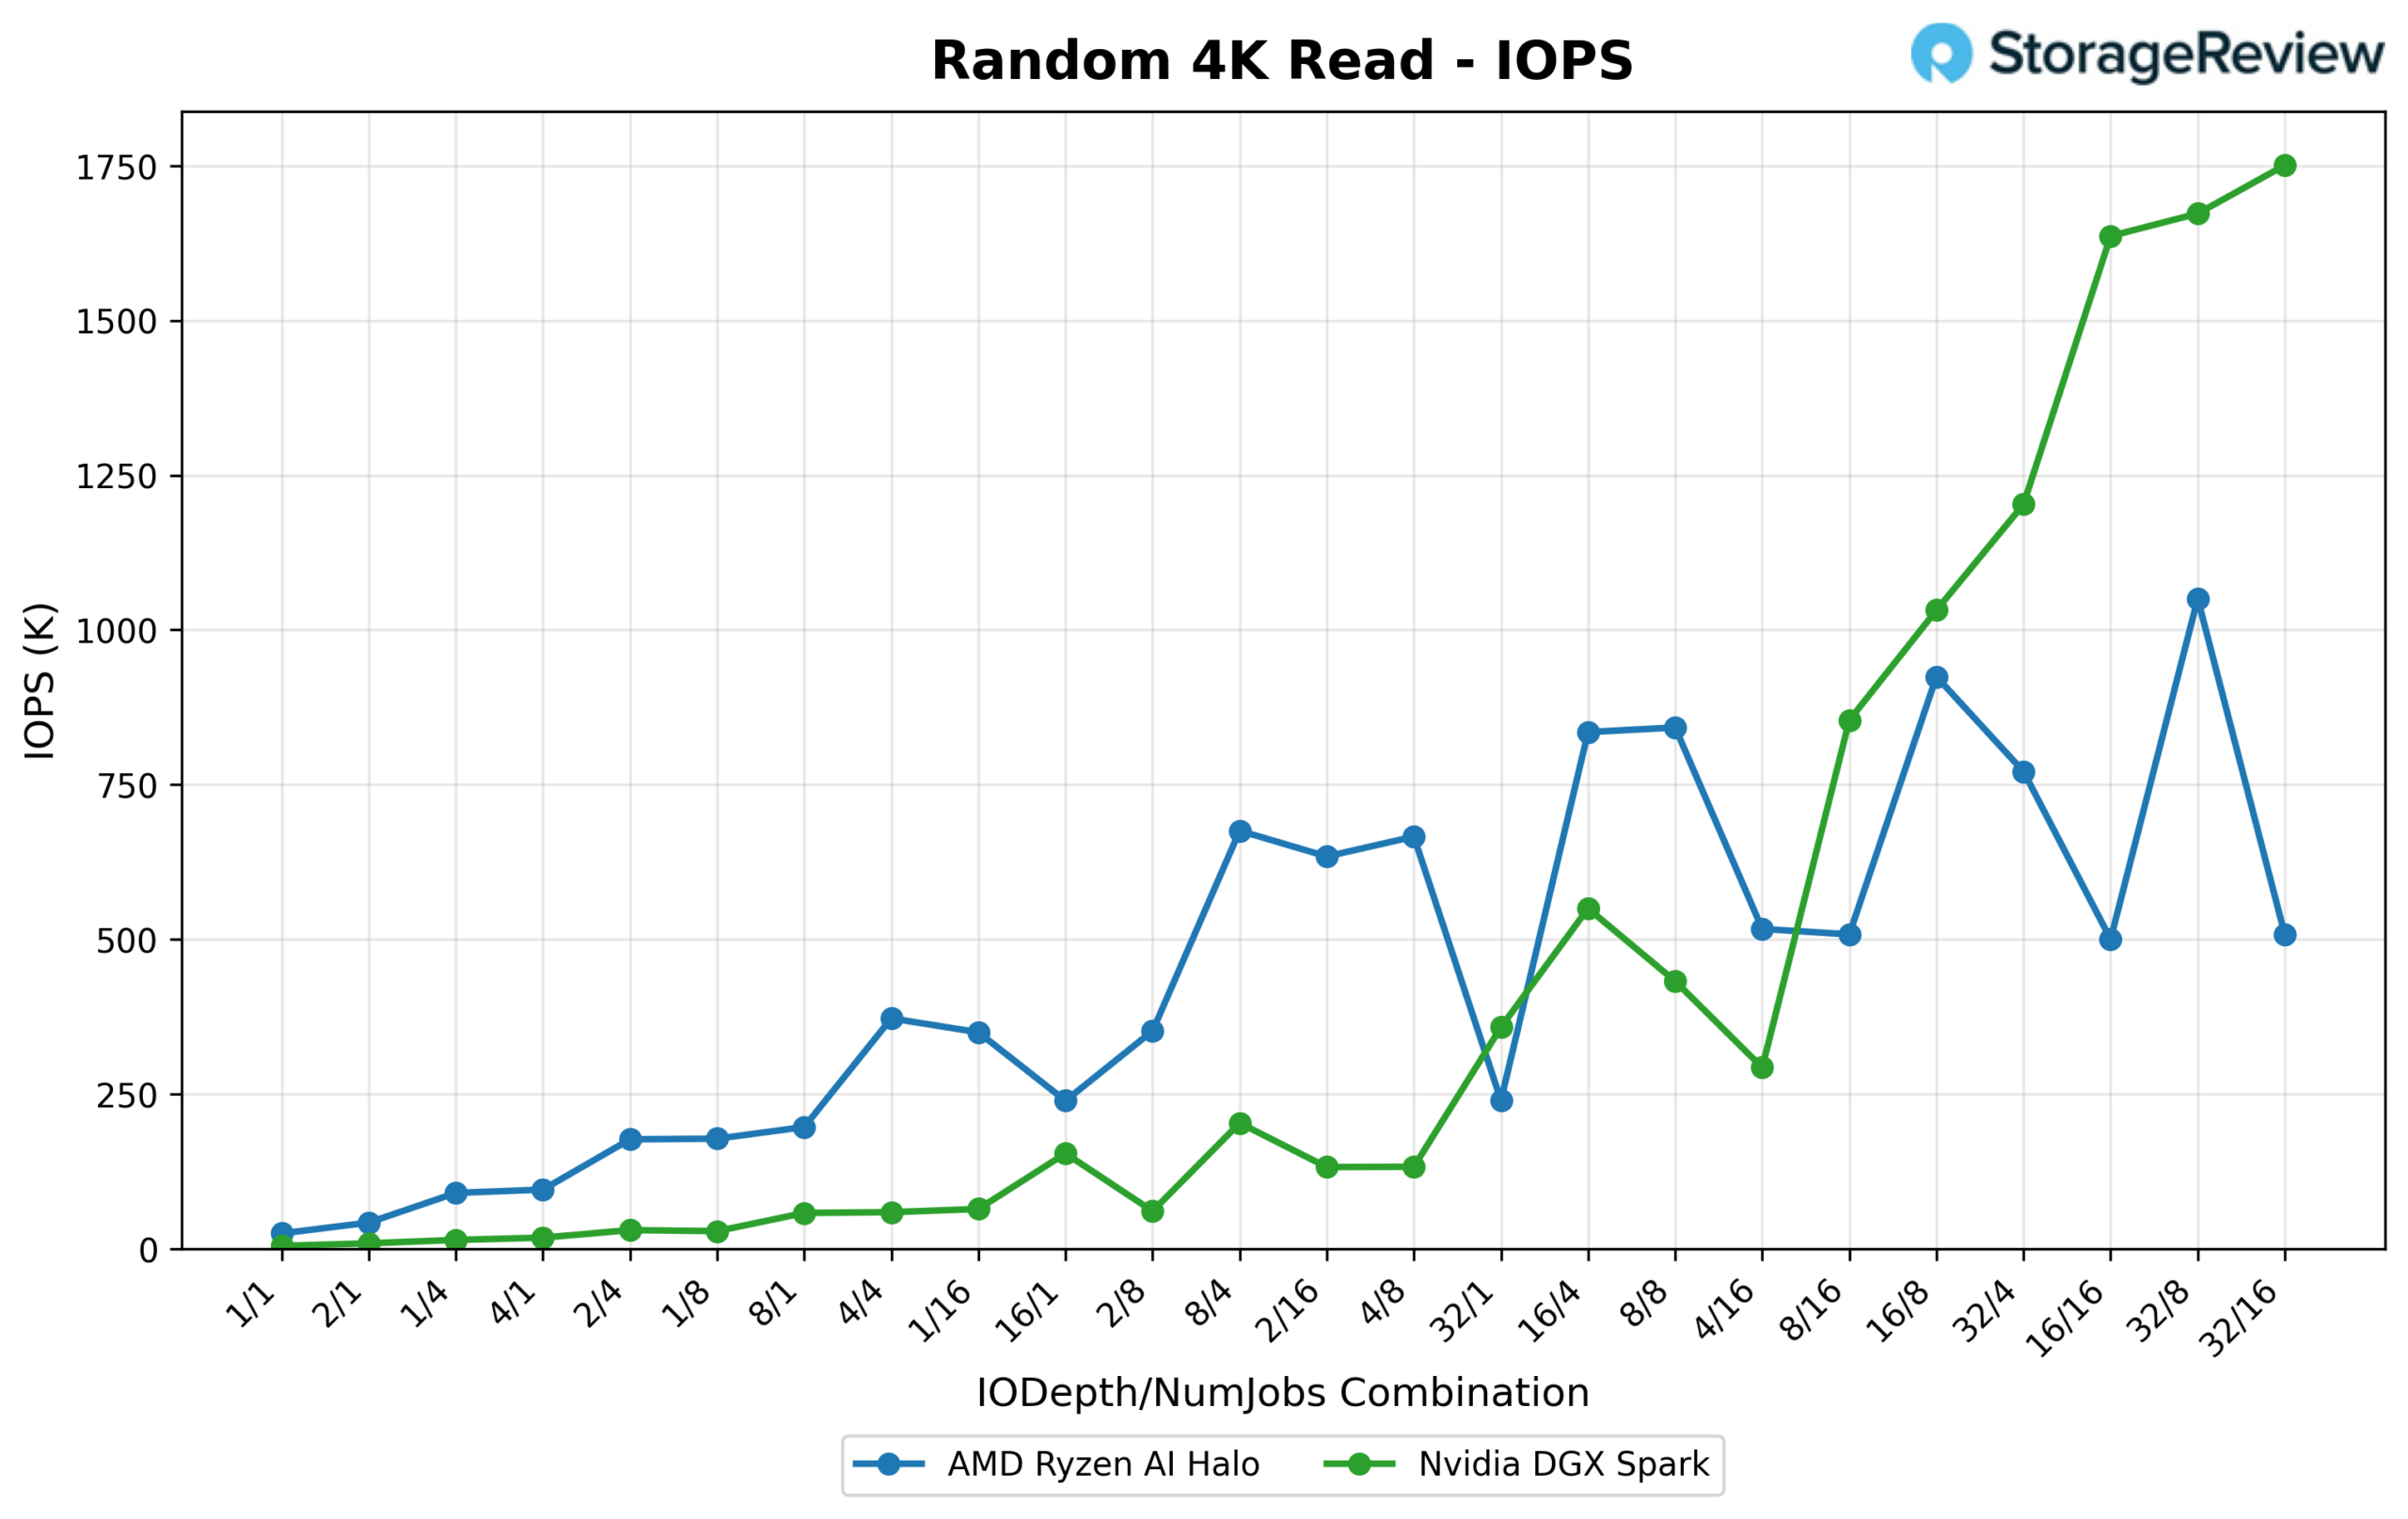
Interestingly, the latency picture inverts at high queue depth. Spark’s latency curve remains relatively contained even as depth and threads climb, peaking at just 0.292 ms. The Halo, by contrast, spikes sharply at 16/16 (0.513 ms) and again at 32/16 (1.009 ms), exceeding its steady-state baseline by over 3x, meaning its excellent low-queue-depth responsiveness doesn’t carry through to full saturation.
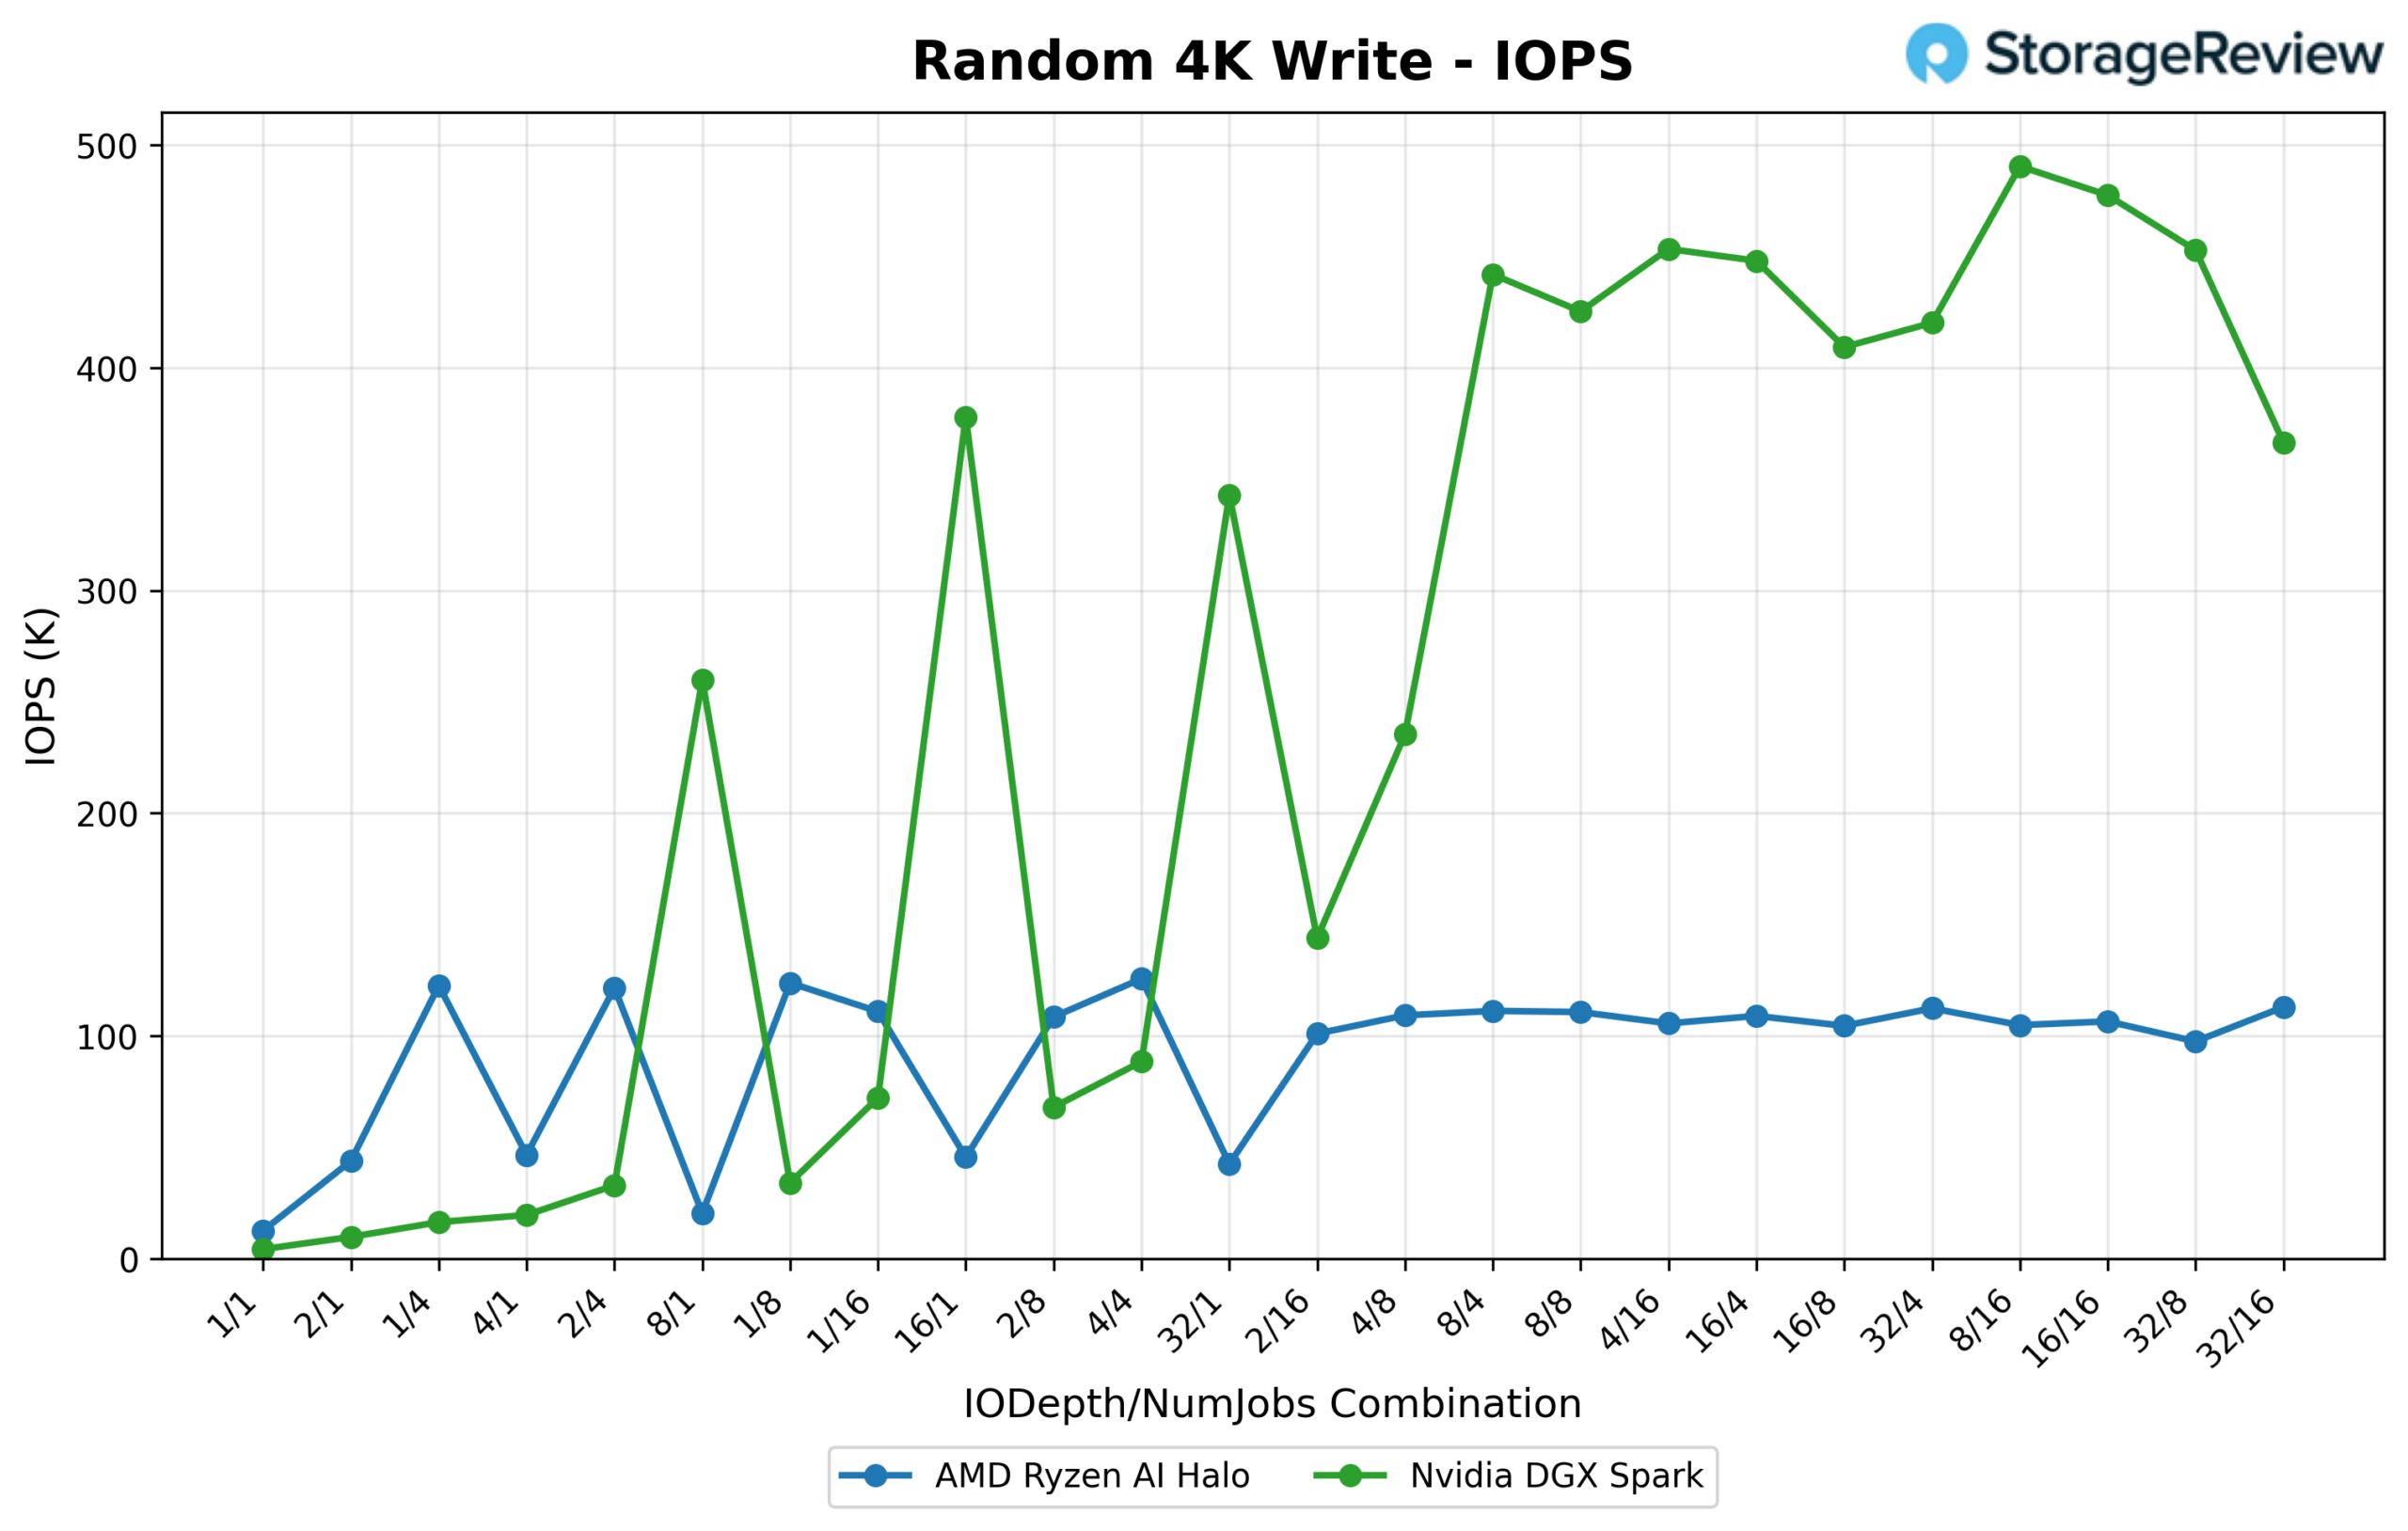
4K Random Write
This is the widest IOPS gap in the sweep. The Spark’s random 4K write performance climbs steeply as queue depth and thread count increase, reaching 490.4K IOPS (1,915.6 MB/s) at 8/16. The Halo, meanwhile, plateaus much earlier and at a much lower level, topping out at 125.6K IOPS (490.7 MB/s) at 4/4 and never exceeding roughly 110–115K IOPS for the remainder of the sweep. The Spark is running at nearly 4x the Halo’s ceiling here.
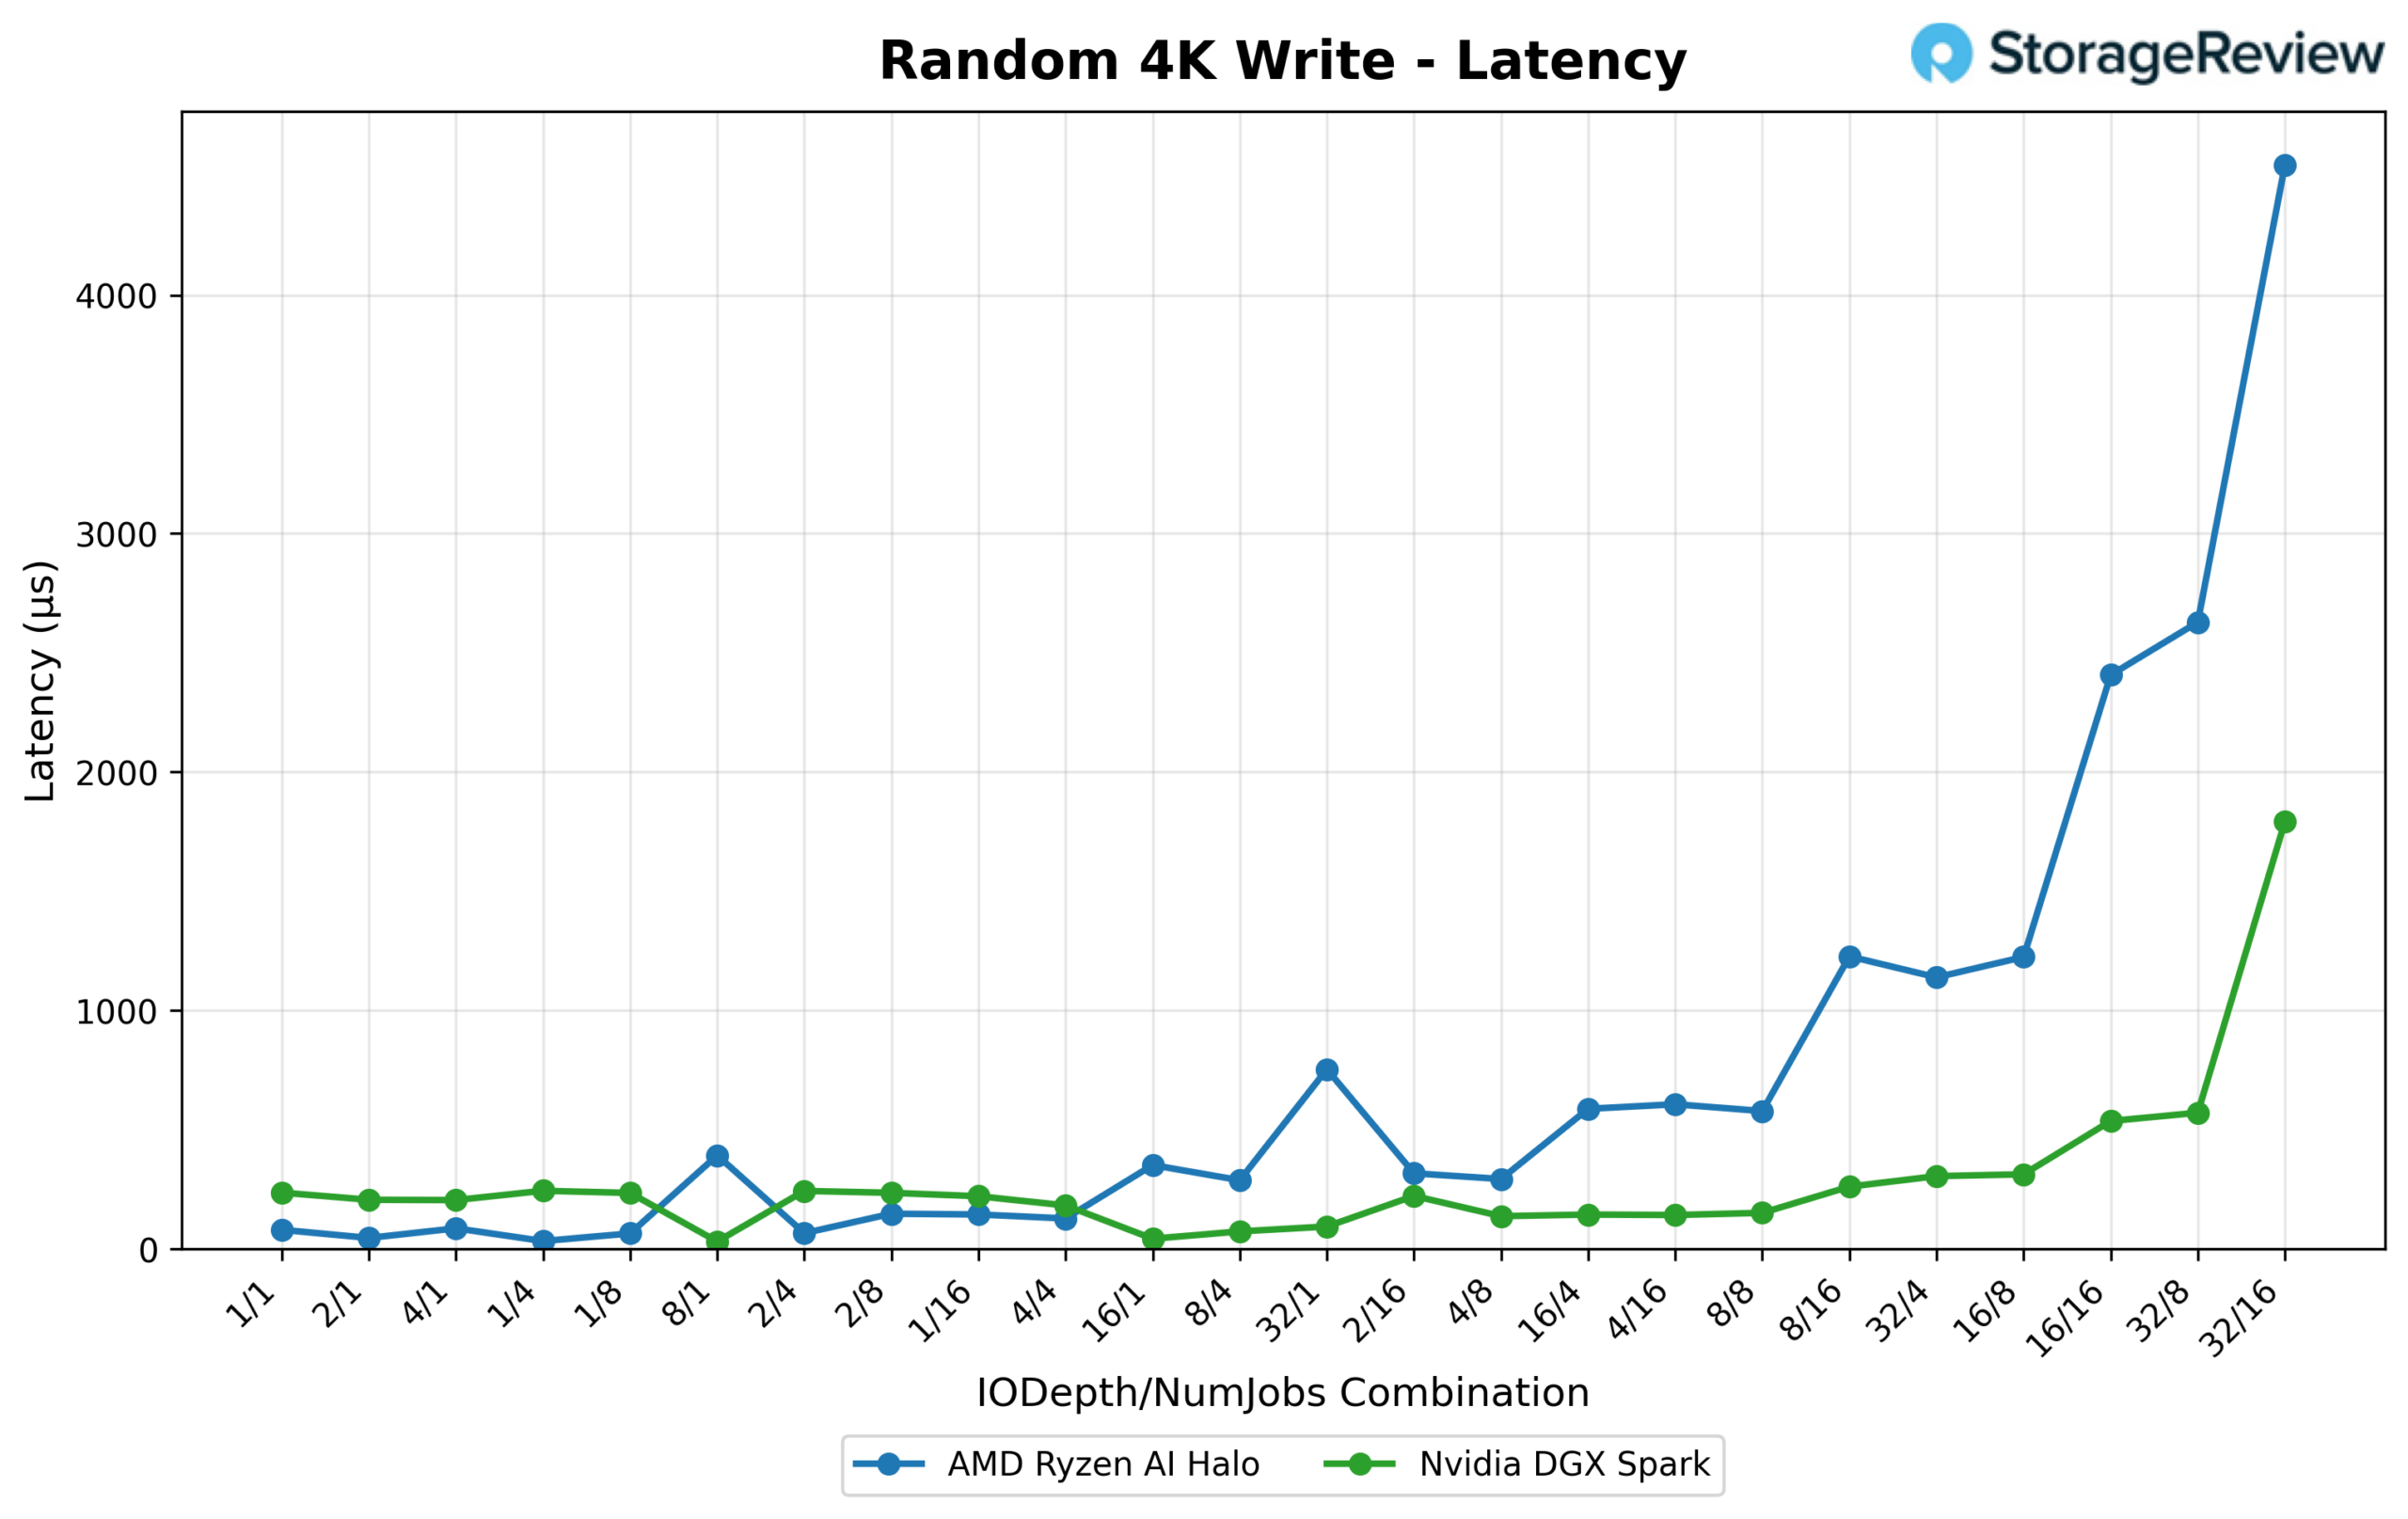
Latency again starts in the Halo’s favor at low queue depth (0.079 ms vs. 0.235 ms at 1/1). By 32/16, the Halo’s mean latency has climbed to 4.546 ms, while the Spark’s remains comparatively controlled at 1.792 ms. Combined with the IOPS gap, this is the test where the Spark’s advantage is most pronounced and most consistent across the full depth/thread sweep.
vLLM Online Serving – LLM Inference Performance
vLLM is one of the most popular high-throughput inference and serving engines for LLMs. The vLLM online serving benchmark evaluates the real-world serving performance of this inference engine under concurrent requests. It simulates production workloads by sending requests to a running vLLM server, with configurable parameters such as request rate, input and output lengths, and the number of concurrent clients. The benchmark measures key metrics, including throughput (tokens per second), time to first token, and time per output token (TPOT), helping users understand how vLLM performs under different load conditions.
We tested inference performance across a comprehensive suite of models spanning various architectures, parameter scales, and quantization strategies to evaluate throughput across different concurrency profiles.
GPT OSS 120B
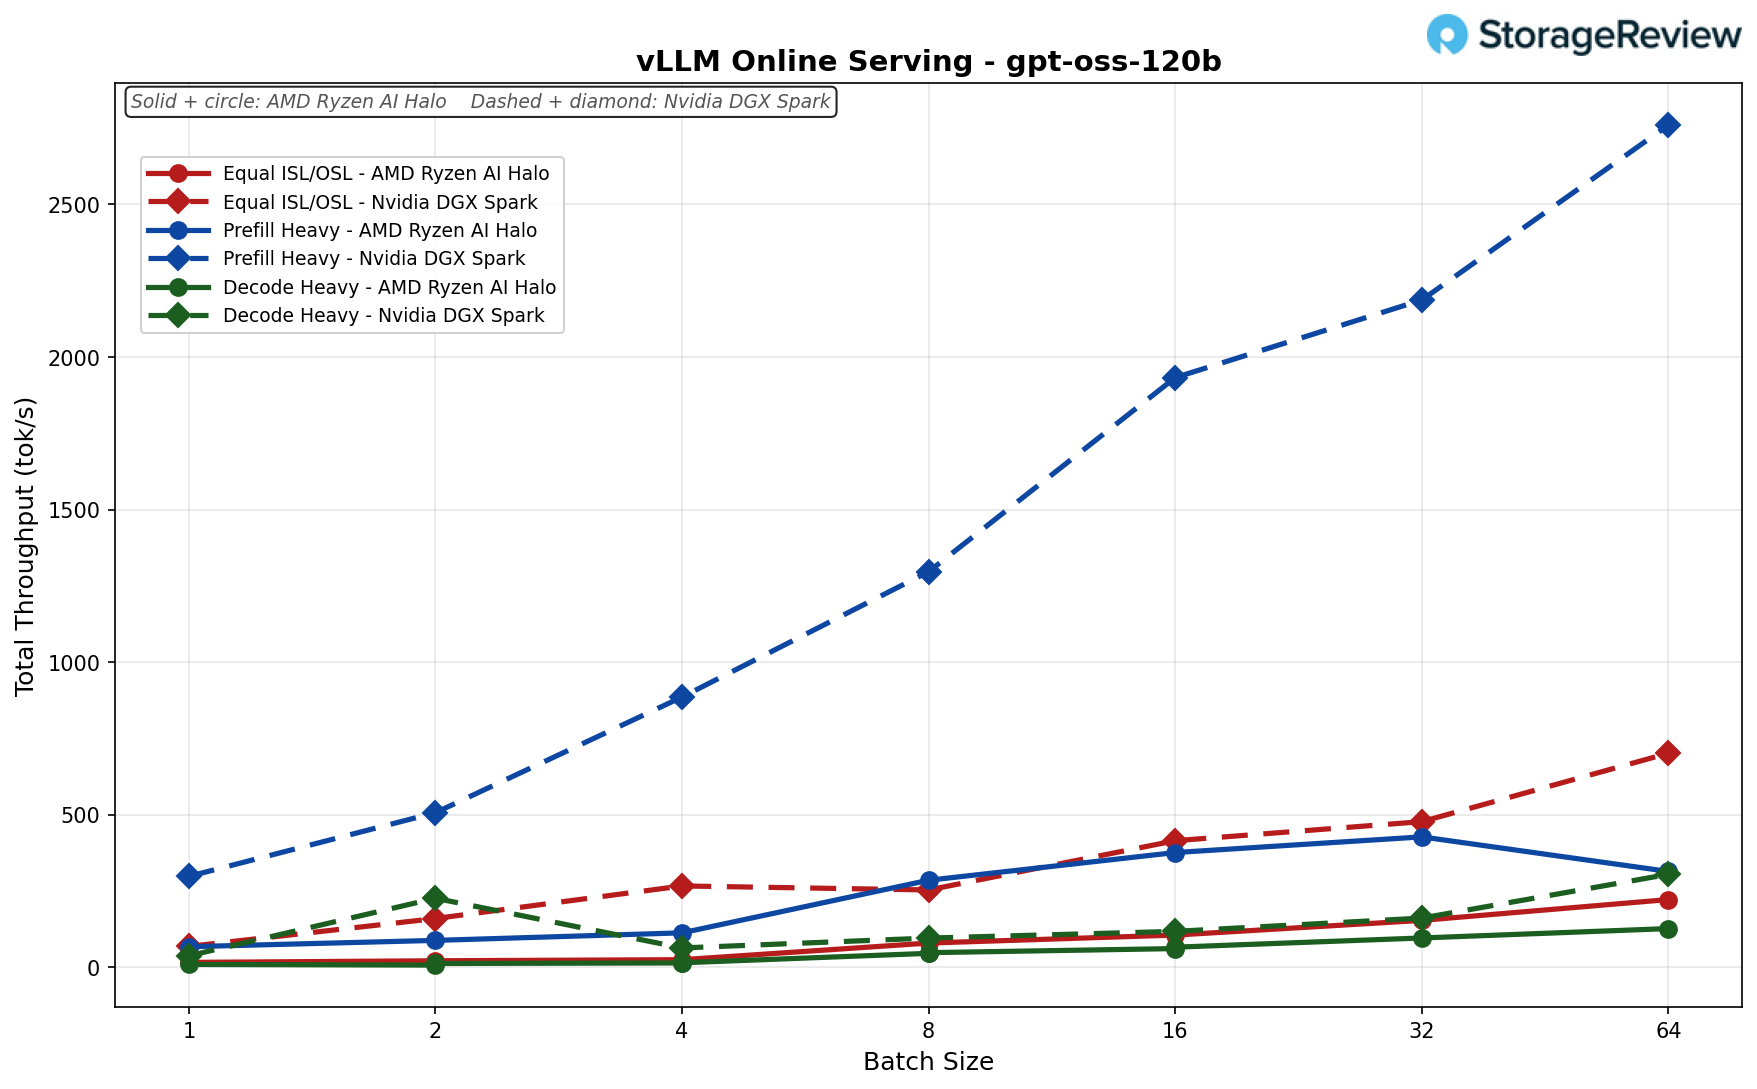
Equal ISL/OSL (256/256): The Halo scaled to 222 tok/s at batch size 64, while the Spark reached 701 (about 3.2x behind).
Prefill Heavy (8k/1k): The Halo’s throughput peaked at batch 32 (427 tok/s), then dipped to 314 at batch 64, while the Spark surged to 2,760 (about 8.8x) — the widest gap in the set.
Decode Heavy (1k/8k): The Halo reached 127 tok/s, compared with the Spark’s 305 at batch size 64 (about 2.4x).
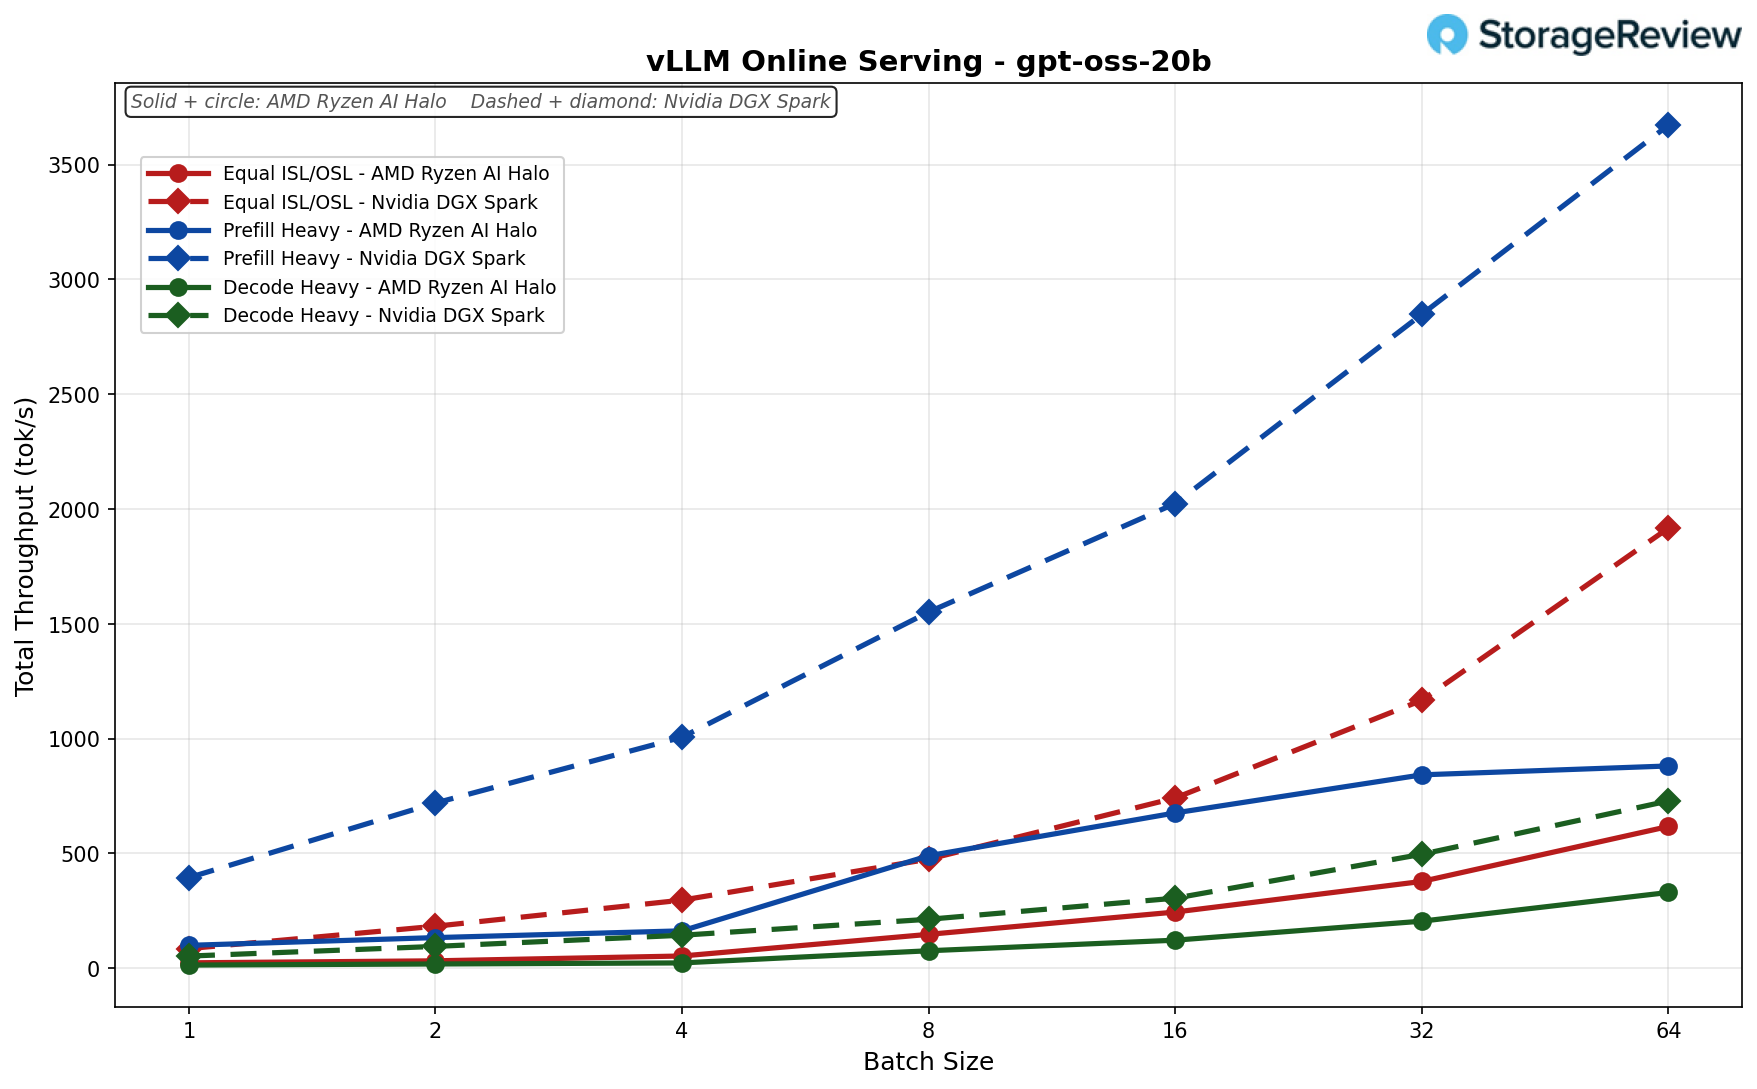
GPT OSS 20B
Equal ISL/OSL (256/256): Spark led in every batch, scaling to 1,917 vs 617 tok/s at batch 64 (Spark about 3.1x ahead).
Prefill Heavy (8k/1k): Spark’s strongest lead, climbing to 3,672 vs 881 tok/s at batch size 64 (Spark about 4.2x ahead).
Decode Heavy (1k/8k): Spark is ahead throughout, reaching 728 vs 330 tok/s at batch 64 (Spark about 2.2x ahead).
Qwen3 Coder 30B A3B Instruct
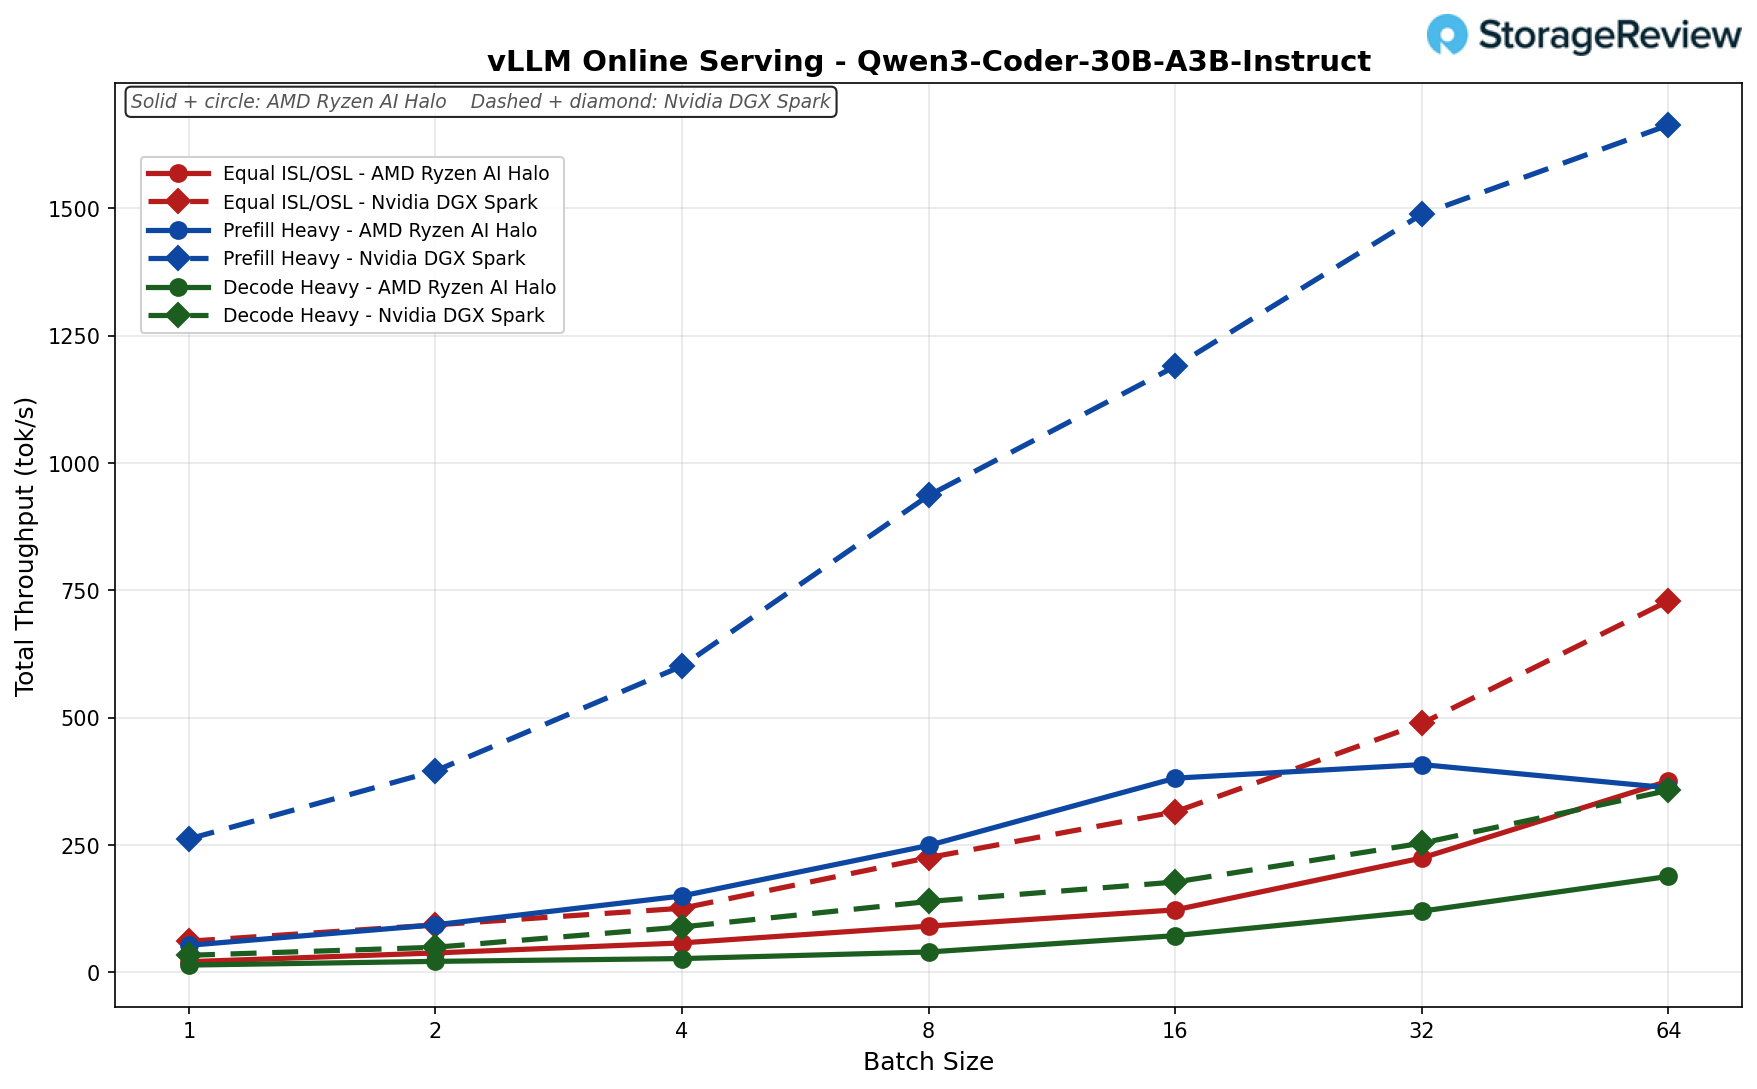
Equal ISL/OSL (256/256): The Halo scaled to 376 tok/s at batch size 64, roughly half of Spark’s 729 (about 1.9x) — one of the tighter Equal ISL/OSL results.
Prefill Heavy (8k/1k): The Halo peaked at batch 32 (408 tok/s), then dipped to 362 at batch 64, trailing Spark’s 1,663 (about 4.6x).
Decode Heavy (1k/8k): The Halo reached 188 tok/s, compared with Spark’s 357 at batch size 64 (about 1.9x).
Mistral Small 3.1 24B Instruct
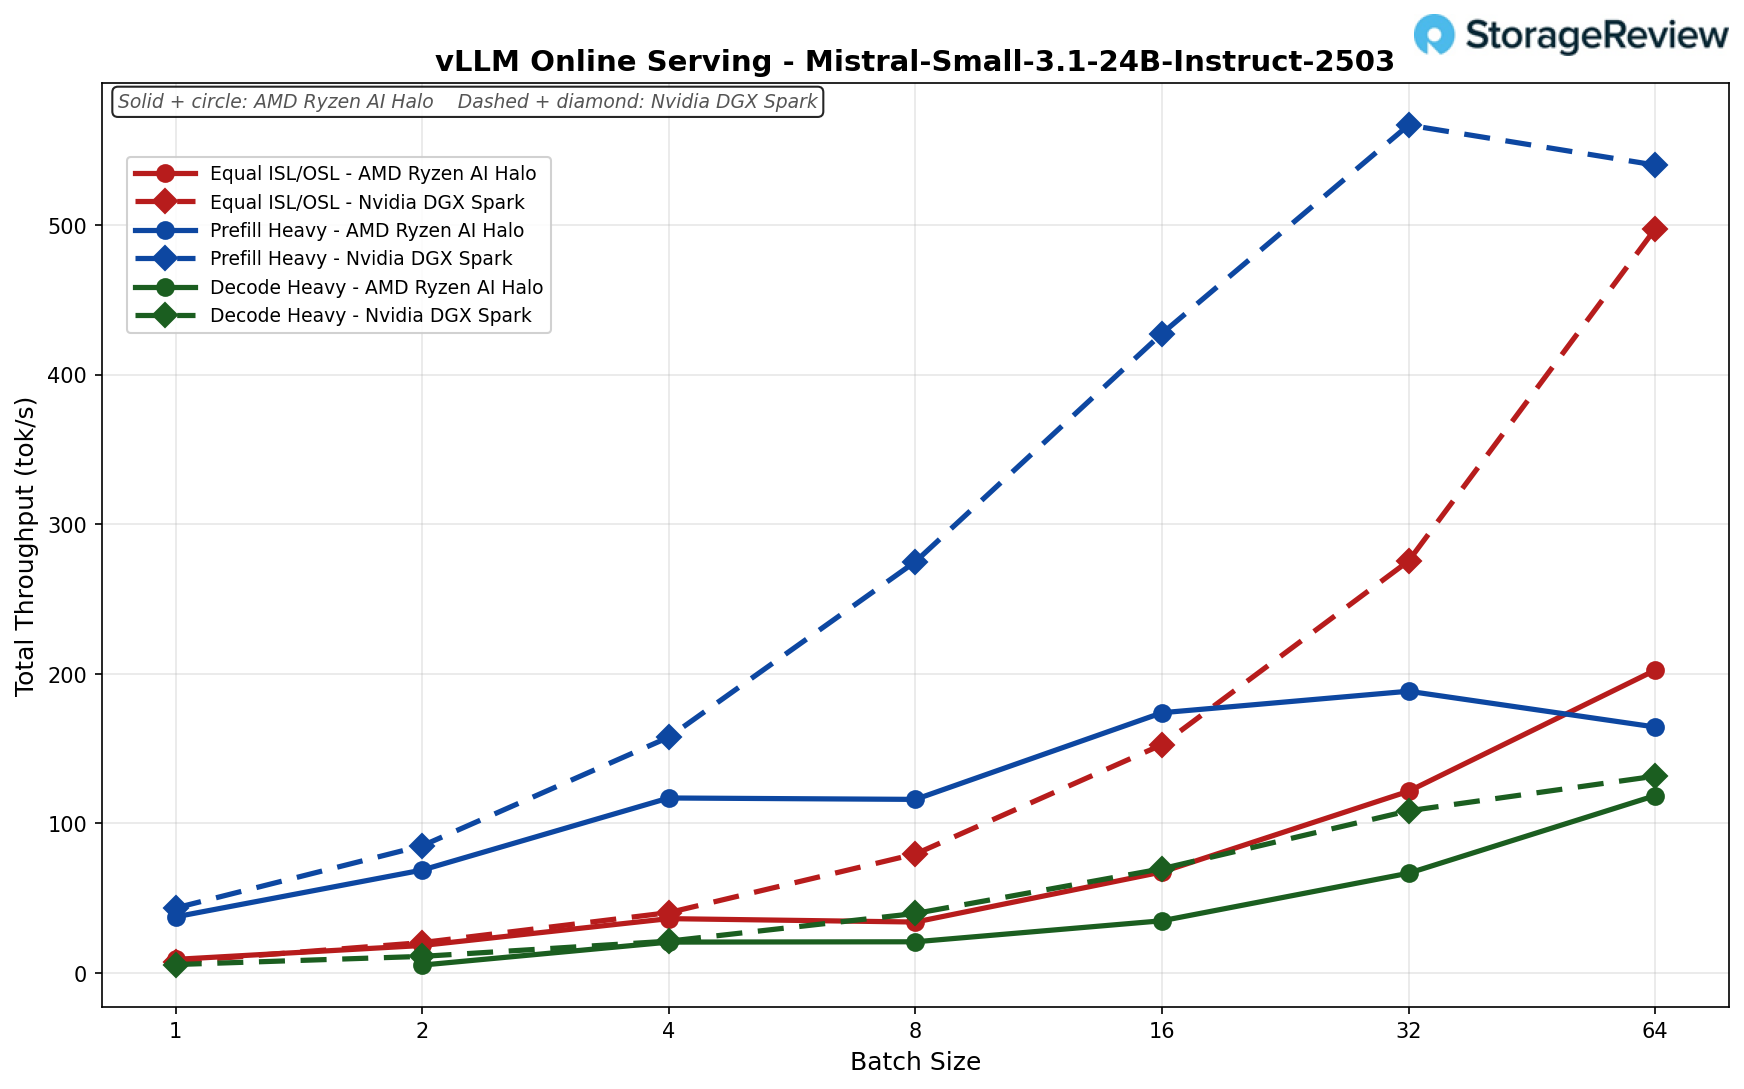
Equal ISL/OSL (256/256): The Halo actually led in batch 1 (9 vs 8 tok/s), then settled to 202 tok/s at batch 64, while the Spark was at 498 (about 2.5x behind).
Prefill Heavy (8k/1k): The Halo peaked at batch 32 (188 tok/s) and dipped slightly to 164 at batch 64, trailing the Spark’s 540 (about 3.3x).
Decode Heavy (1k/8k): Nearly tied throughout, the Halo reached 119 tok/s against the Spark’s 132 at batch 64 (within about 11%).
Llama 3.1 8B Instruct
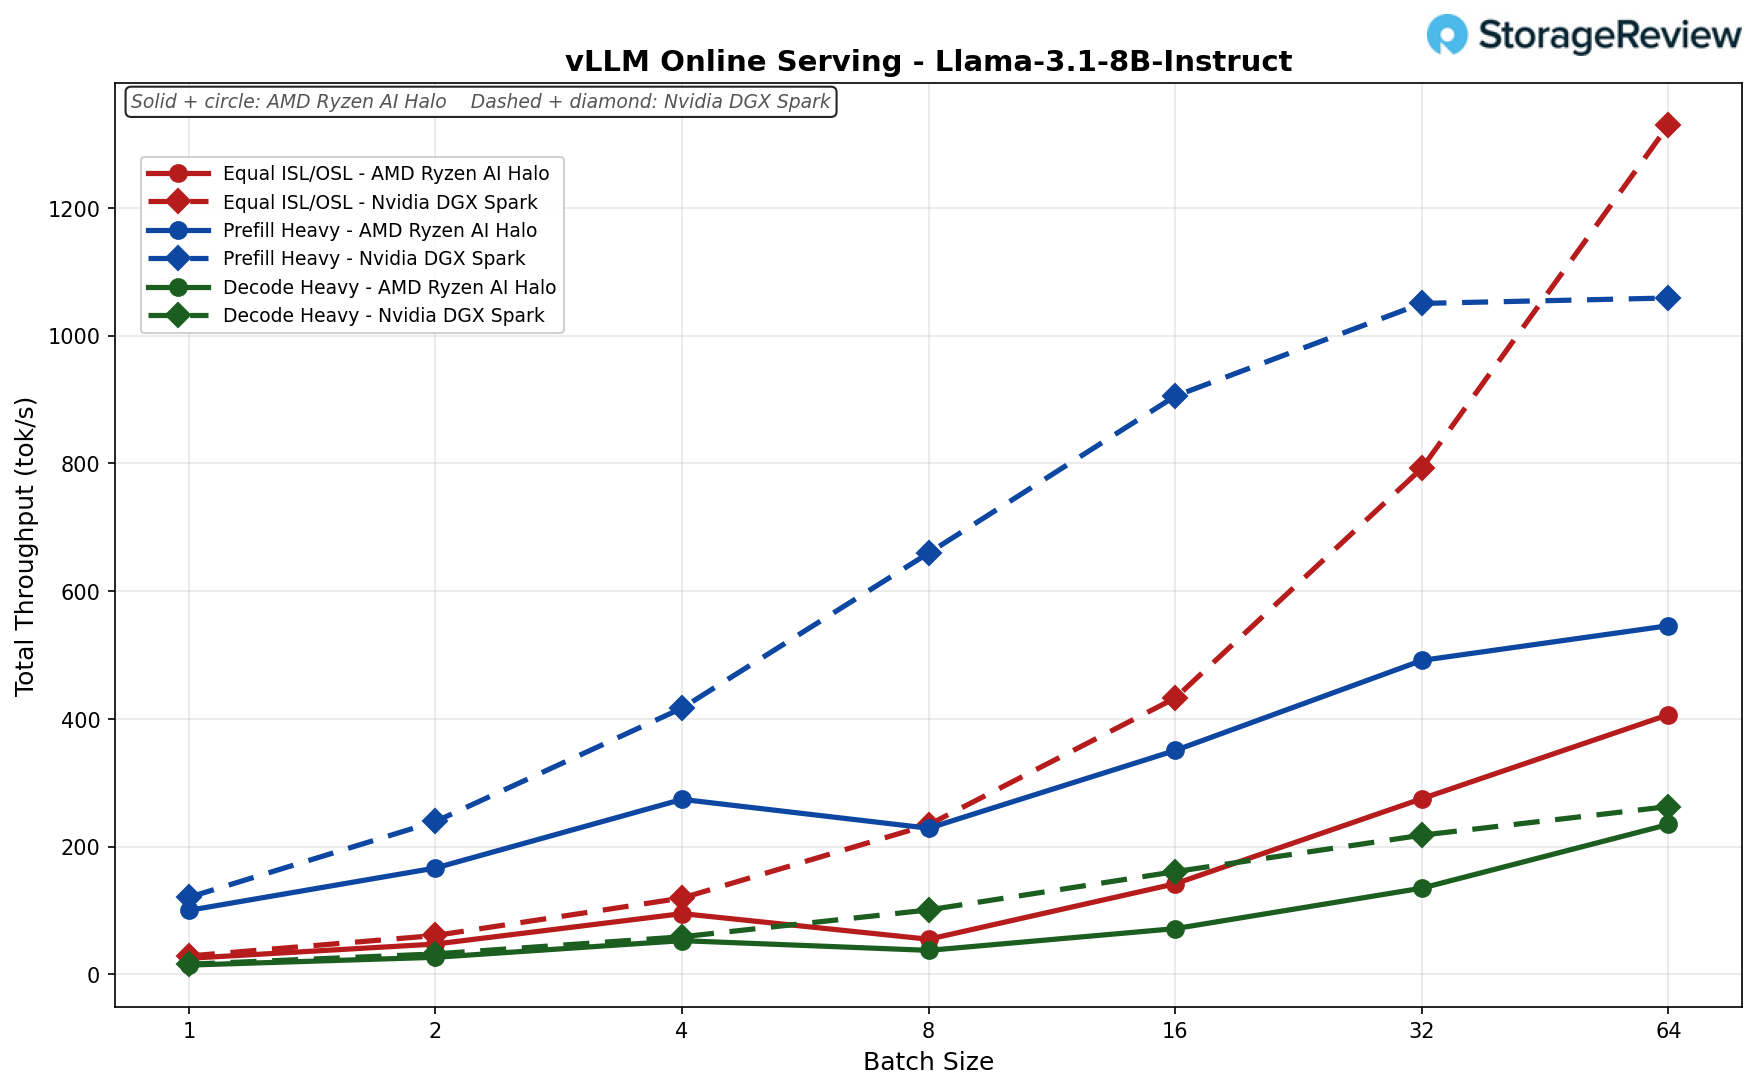
Equal ISL/OSL (256/256): The Halo scaled cleanly from 25 tok/s at batch 1 to 407 tok/s at batch 64, tracking the Spark closely through batch 4, after which the Spark pulled ahead to 1,330 (Halo trailing by about 3.3x at peak).
Prefill Heavy (8k/1k): The Halo reached 546 tok/s at batch size 64, holding roughly half of Spark’s 1,059.
Decode Heavy (1k/8k): The Halo’s most competitive scenario, reaching 235 tok/s against the Spark’s 263 at a batch size of 64 (within about 12%).
Llama 3.1 8B Instruct FP4
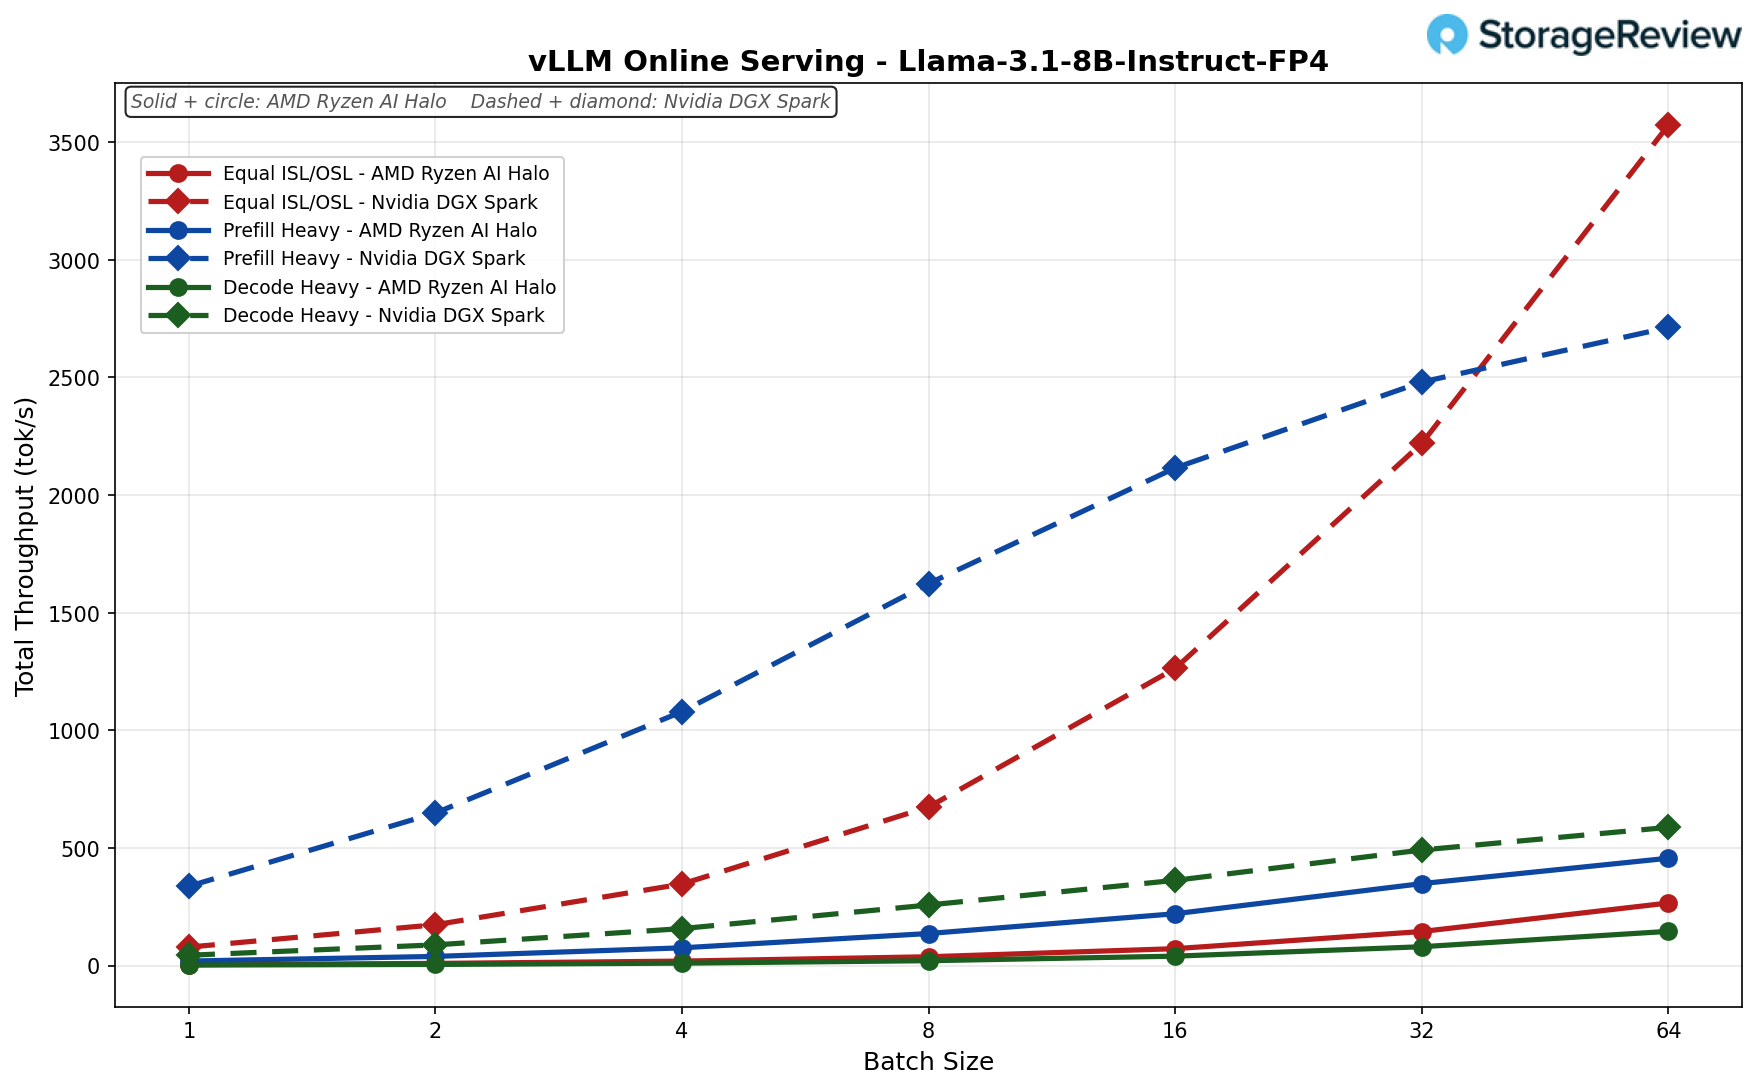
Equal ISL/OSL (256/256): The Halo peaked at 267 tok/s at batch size 64, far behind the Spark’s 3,573 — FP4 shows the widest gap (about 13.4x).
Prefill Heavy (8k/1k): The Halo reached 457 tok/s at batch size 64, compared with the Spark’s 2,713 (about 5.9x).
Decode Heavy (1k/8k): The Halo scaled to 146 tok/s, compared with the Spark’s 588 tok/s at a batch size of 64 (about 4x).
Conclusion
The AMD Ryzen AI Halo enters a category NVIDIA effectively created with the DGX Spark, and it does not try to beat the Spark at its own game. In our vLLM sweeps, the Spark held a 2x to 4x throughput advantage in most scenarios at higher concurrency, stretching to 8.8x in prefill-heavy GPT OSS 120B work and narrowing to roughly 10% only in a pair of decode-heavy runs, and its storage subsystem won nearly every fio test at saturation. What the Halo offers instead is the same 128GB of unified memory and 200-billion-parameter ceiling in a similar footprint, at $3,999 against the Spark Founders Edition’s $4,699 (though some OEMs have them under $4,000), in a full x86 machine that boots Windows 11 or Linux rather than DGX OS alone.
Set the Spark aside, and the Halo is the strongest Ryzen AI Max+ 395 implementation we’ve tested. It posted the top marks against the HP Z2 Mini G1a and ZBook Ultra G1a in nearly every Windows workload we ran: 37,316 in Cinebench R23 multi-core, 184.2 GIPS in 7-Zip against 151.6 and 156.8 for the HPs, the highest Procyon AI text and image generation scores, and the fastest y-cruncher times at 5 and 10 billion digits. On Linux, against the Spark, it won the CPU-bound Phoronix tests outright, compressing 11% faster in 7-Zip and finishing the LLVM compile 14% sooner. This is a compact workstation first, with the AI developer role layered on top rather than replacing it.
Developers who need maximum local tokens per second, or who plan to cluster nodes over high-speed fabric, should still buy the Spark; the Halo’s 10GbE and its vLLM ceilings are not close. For developers building against ROCm, teams that need Windows in the loop, or anyone who wants one box to cover professional workloads and local model work, the Halo is the better fit, and the standard M.2 2280 bay and pre-tuned Variable Graphics Memory remove two of the most common complaints Spark owners have raised. AMD has also said the platform will pick up Ryzen AI Max PRO 400 Series silicon with up to 192GB of unified memory in the third quarter, so buyers chasing larger models have a clear path forward without changing platforms.
Product Page – AMD Ryzen AI Halo
Leaderboard: The AMD Ryzen AI Halo holds the Best x86 Alternative spot on our Best Desktops for Local AI leaderboard.



 Amazon