

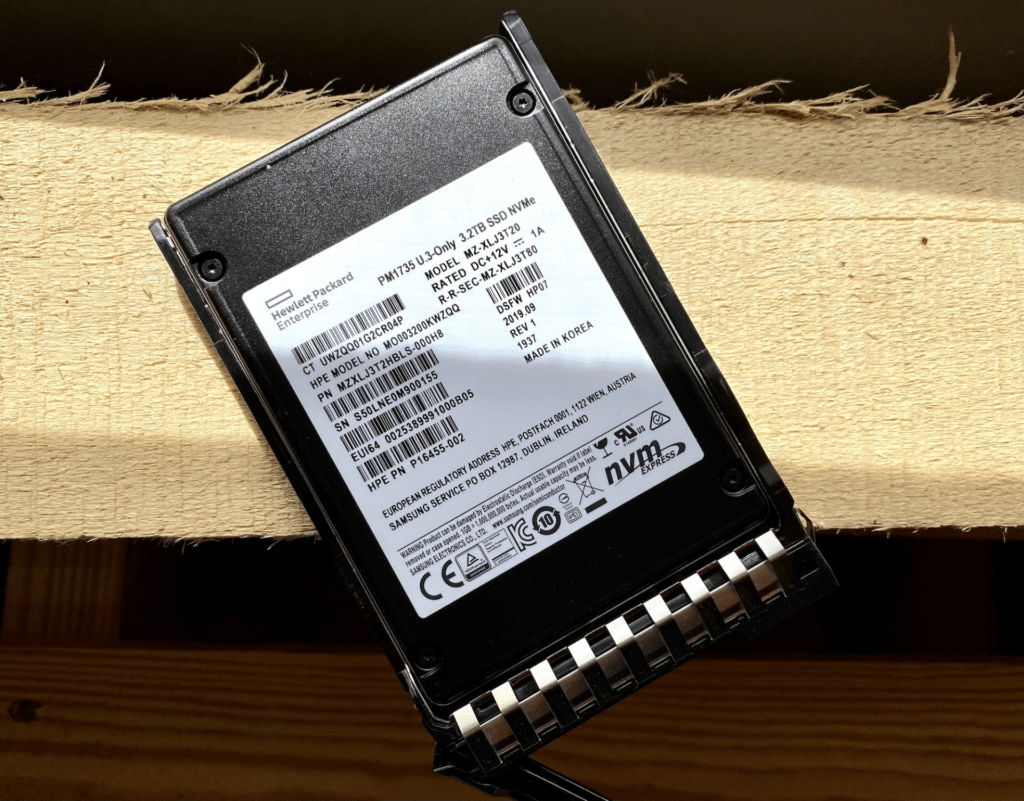
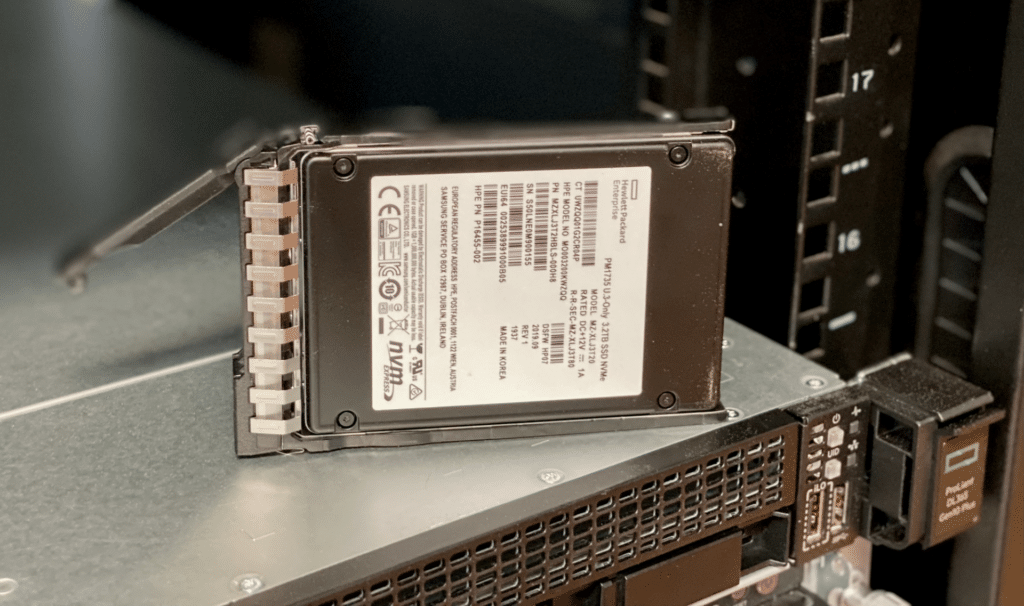
Samsung launched almost twenty iterations of their PCIe Gen4 enterprise SSD family in the fall of 2019. The PM1733 and PM1735 were designed to fully take advantage of the throughput Gen4 offers. Now that server vendors are including Gen4 ports across their AMD and Intel-based server offerings, these SSDs are finally coming to market in volume. The PM1733 is a single drive write per day model, while the PM1735 offers three drive writes per day. In this review, we take a look at an HPE PM1735 variant in a 3.2TB capacity (HPE P16499-B21).
Samsung PM1735 vs. PM1733
As noted, the PM1733 is differentiated largely from the PM1735 by endurance; that is, the former is quoted with 1 DWPD (drive writes per day) while the latter triples this number with 3 DWPD. Both drives are quoted with the same sequential write speeds (e.g., 3,800MB/s for their highest capacity models). Read activity is a bit different, however, as the PM1735 offers a potential 8,000MB/s for its 12.8TB, 3.2TB, and 6.4TB models vs. 7,000MB/s for all PM1733 models.
It should also be noted that with most server vendors, SSDs will have firmware specific to the vendor, HPE for instance in this case. These drives may also not be generally available in retail as they’re targeted toward OEMs. Samsung offers the 1.3 DWPD PM9A3 for retail. The PM9A3 is a single port datacenter drive offered in a range of form factors including M.2, U.2, E1.L, and E1.S.
Samsung PM1735 Specifications
| Product Number (SKU) | P16499-B21 |
| Lifetime Writes | 17,520TB |
| Endurance DWPD (Drive Writes Per Day) | 3 |
| Read IOPS | Random Read IOPS (4KiB, Q=16): 180,000
Max Random Read IOPS (4KiB): 950,000@Q256 |
| Write IOPS | Random Write IOPS (4KiB, Q=16) 350,000
Max Random Write IOPS (4KiB) 350,000@Q16 |
| Power (Watts) | 14 |
| Height | 15mm |
| Plug Type | Hot Pluggable |
| Warranty | Standard 3/0/0 warranty |
Samsung PM1735 Performance
Testing Background and Comparables
The StorageReview Enterprise Test Lab provides a flexible architecture for conducting benchmarks of enterprise storage devices in an environment comparable to what administrators encounter in real deployments. The Enterprise Test Lab incorporates a variety of servers, networking, power conditioning, and other network infrastructure that allows our staff to establish real-world conditions to accurately gauge performance during our reviews.
We incorporate these details about the lab environment and protocols into reviews so that IT professionals and those responsible for storage acquisition can understand the conditions under which we have achieved the following results. None of our reviews are paid for or overseen by the manufacturer of equipment we are testing. Additional details about the StorageReview Enterprise Test Lab and an overview of its networking capabilities are available on those respective pages.
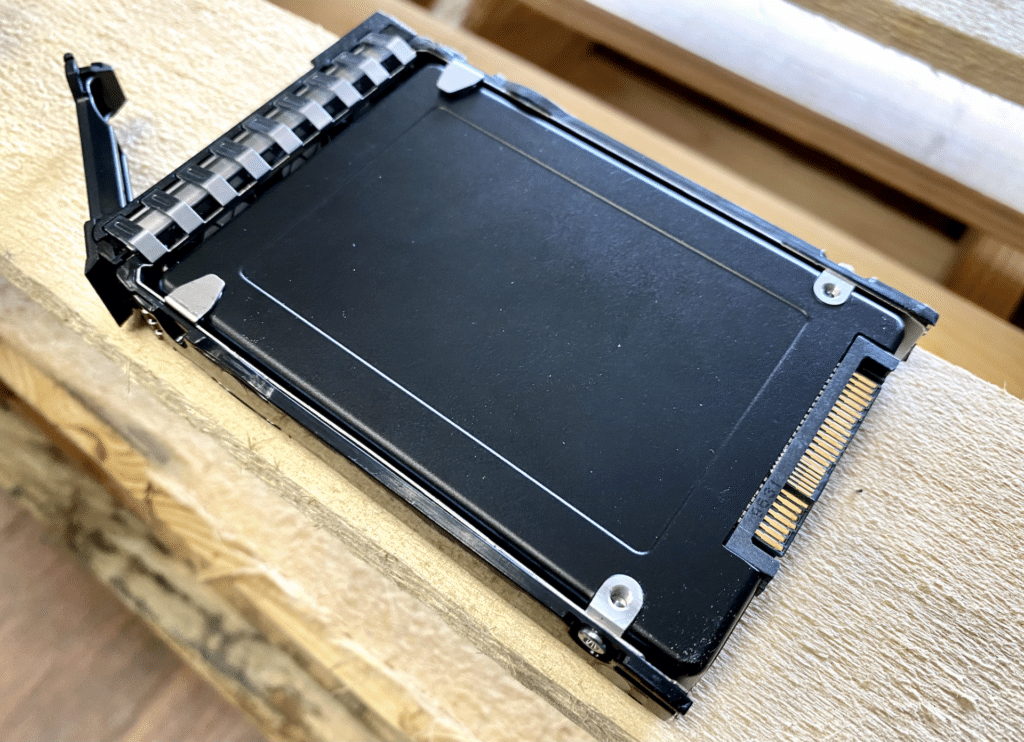
As the HPE PM1735 is offered in a U.3-ONLY version, we tested it inside the HPE ProLiant DL365 Gen10 Plus server.
HPE ProLiant DL365 Gen10 Plus Configuration:
- 2 x 7713 AMD Epyc Gen 3 CPUs (64-Core, 2GHz)
- 16 x 16GB DDR4 3200MHz
- 1 x HPE Samsung PM1735 3.2GB U.3 Gen4 SSD
- ESXi 7.0u1
Application Workload Analysis
In order to understand the performance characteristics of enterprise storage devices, it is essential to model the infrastructure and the application workloads found in live production environments. Our benchmarks for the HPE/Samsung PM1735 include the MySQL OLTP performance via SysBench and Microsoft SQL Server OLTP performance with a simulated TCP-C workload. For our application workloads, each comparable drive will be running 4 identically configured VMs. With the PM1735 being a U.3-ONLY variant, we tested it on the HPE DL365 Gen10 Plus while the other models were on our Lenovo ThinkSystem SR635.
SQL Server Performance
Each SQL Server VM is configured with two vDisks: 100GB volume for boot and a 500GB volume for the database and log files. From a system-resource perspective, we configured each VM with 8 vCPUs, 64GB of DRAM and leveraged the LSI Logic SAS SCSI controller. While our Sysbench workloads tested previously saturated the platform in both storage I/O and capacity, the SQL test is looking for latency performance.
This test uses SQL Server 2014 running on Windows Server 2012 R2 guest VMs, and is stressed by Quest’s Benchmark Factory for Databases. StorageReview’s Microsoft SQL Server OLTP testing protocol employs the current draft of the Transaction Processing Performance Council’s Benchmark C (TPC-C), an online transaction-processing benchmark that simulates the activities found in complex application environments. The TPC-C benchmark comes closer than synthetic performance benchmarks to gauging the performance strengths and bottlenecks of storage infrastructure in database environments. Each instance of our SQL Server VM for this review uses a 333GB (1,500 scale) SQL Server database and measures the transactional performance and latency under a load of 15,000 virtual users.
SQL Server Testing Configuration (per VM)
- Windows Server 2012 R2
- Storage Footprint: 600GB allocated, 500GB used
- SQL Server 2014
-
- Database Size: 1,500 scale
- Virtual Client Load: 15,000
- RAM Buffer: 48GB
- Test Length: 3 hours
-
- 2.5 hours preconditioning
- 30 minutes sample period
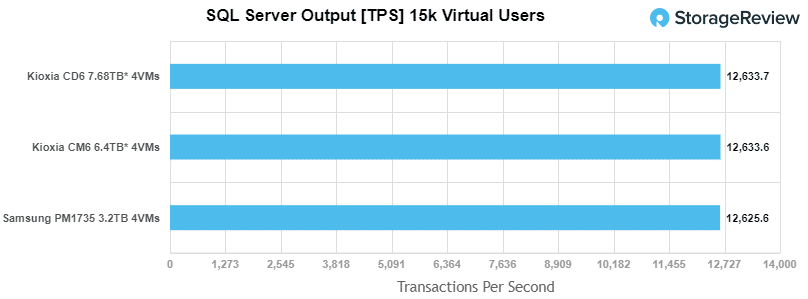
For our SQL Server transactional benchmark, the PM1735 placed just behind the Kioxia drive with 12,625.56 TPS.
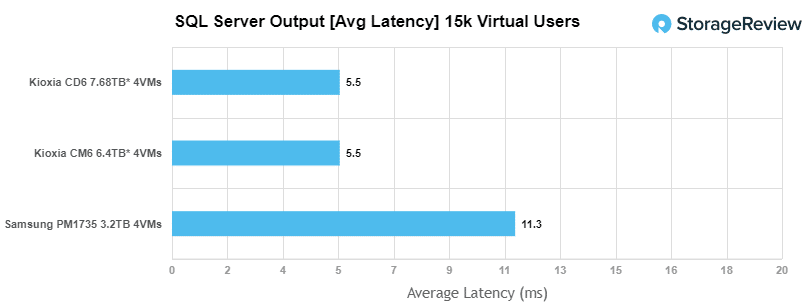
With SQL Server average latency, the PM1735 had an average latency of 11.25ms, doubling that of the Kioxia drives.
Sysbench Performance
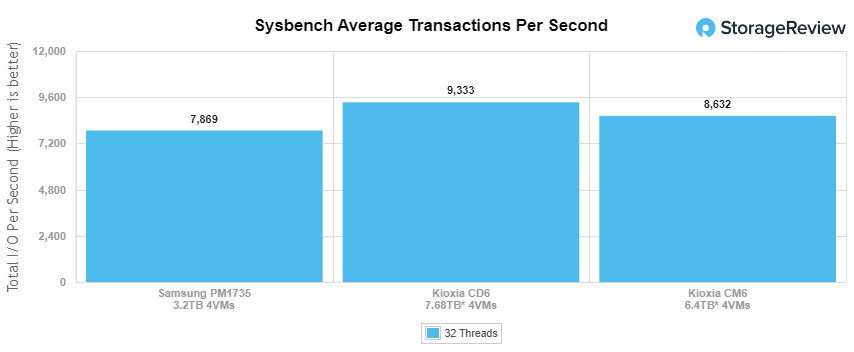
The next application benchmark consists of a Percona MySQL OLTP database measured via SysBench. This test measures average TPS (Transactions Per Second), average latency, and average 99th percentile latency as well.
Each Sysbench VM is configured with three vDisks: one for boot (~92GB), one with the pre-built database (~447GB), and the third for the database under test (270GB). From a system-resource perspective, we configured each VM with 8 vCPUs, 60GB of DRAM and leveraged the LSI Logic SAS SCSI controller.
Sysbench Testing Configuration (per VM)
- CentOS 6.3 64-bit
- Percona XtraDB 5.5.30-rel30.1
-
- Database Tables: 100
- Database Size: 10,000,000
- Database Threads: 32
- RAM Buffer: 24GB
- Test Length: 3 hours
-
- 2 hours preconditioning 32 threads
- 1 hour 32 threads
Looking at our Sysbench transactional benchmark, the PM1735 had 7,869.21 TPS, placing it well back of the Kioxia drives.
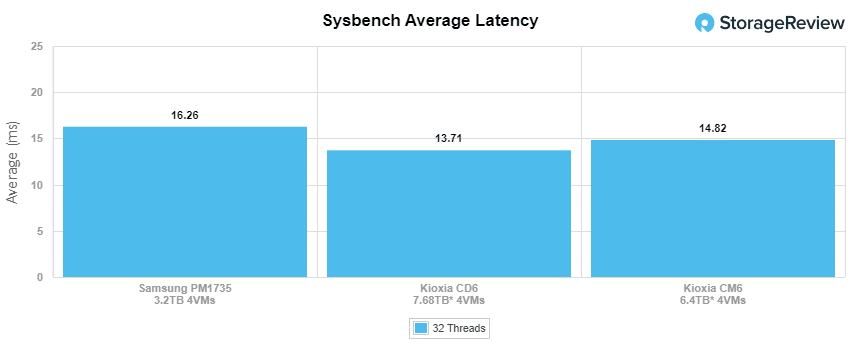
With Sysbench average latency the PM1735 posted 16.26ms, which was just behind the two Kioxia drives.
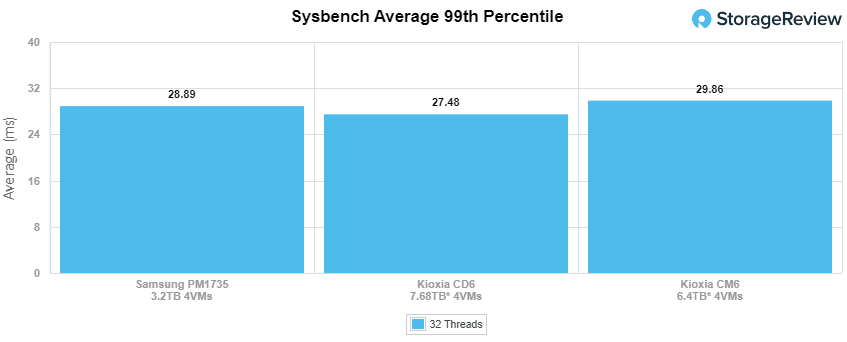
For our worst-case scenario latency (99th percentile) the PM1735 showed 28.90ms, placing it between the Kioxia CM6 and CD6 drives.
VDBench Workload Analysis
When it comes to benchmarking storage devices, application testing is best, and synthetic testing comes in second place. While not a perfect representation of actual workloads, synthetic tests do help to baseline storage devices with a repeatability factor that makes it easy to do apples-to-apples comparison between competing solutions. These workloads offer a range of different testing profiles ranging from “four corners” tests, common database transfer size tests, to trace captures from different VDI environments.
All of these tests leverage the common vdBench workload generator, with a scripting engine to automate and capture results over a large compute testing cluster. This allows us to repeat the same workloads across a wide range of storage devices, including flash arrays and individual storage devices. Our testing process for these benchmarks fills the entire drive surface with data, then partitions a drive section equal to 25% of the drive capacity to simulate how the drive might respond to application workloads. This is different than full entropy tests which use 100% of the drive and takes them into steady state. As a result, these figures will reflect higher-sustained write speeds.
Profiles:
- 4K Random Read: 100% Read, 128 threads, 0-120% iorate
- 4K Random Write: 100% Write, 128 threads, 0-120% iorate
- 4K Random Read (high load): 100% Read, 512 threads, 0-120% iorate
- 4K Random Write (high load): 100% Write, 512 threads, 0-120% iorate
- 64K Sequential Read: 100% Read, 32 threads, 0-120% iorate
- 64K Sequential Write: 100% Write, 16 threads, 0-120% iorate
- 64K Sequential Read (high load): 100% Read, 64 threads, 0-120% iorate
- 64K Sequential Write (high load): 100% Write, 64 threads, 0-120% iorate
- Synthetic Database: SQL and Oracle
- VDI Full Clone and Linked Clone Traces
Comparables:
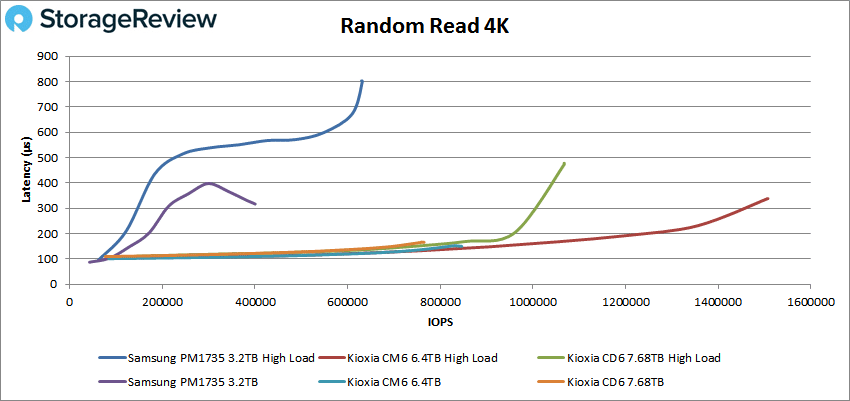
In our first VDBench Workload Analysis, Random 4K Read, the PM1735 showed weak performance compared to the Kioxia drives, peaking at just 631,959,288 IOPS at a latency of 800.7µs under a high load. The normal load showed just over 400K and 319.6ms in peak performance. This puts the drive well behind the leaders.
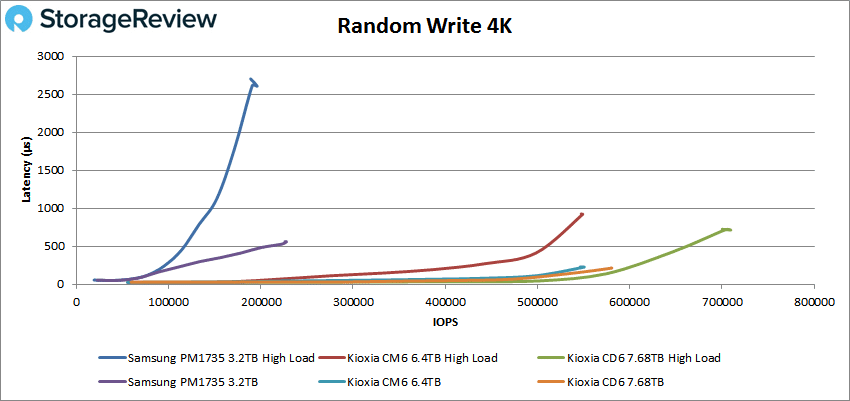
For Random 4K write, the Samsung drive performed well behind the Kioxia drives again. Under a high load, the PM1735 peaked at 195,953 IOPS at a latency of 2,605µs before a slight spike. In a normal load, it posted 227,664 IOPS at a latency of 557.6ms.
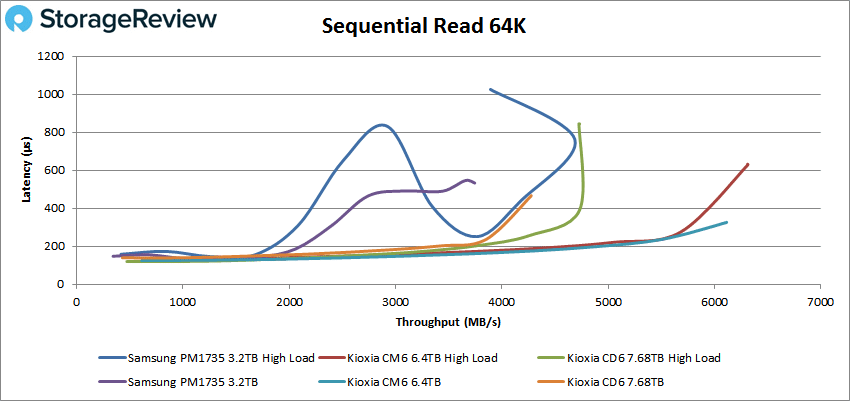
Sequential workloads told a similar, as the PM1735 fell behind again in 64K read with a peak score of 75,598 IOPS (or 4.72GB/s) at a latency of only 761.7µs before taking a big dip in performance (ending up at 3.9GB/s). For a normal load, read saw the PM1735 peaking at 59,915 IOPS or 3.74GB/s at a latency of 532.8µs.
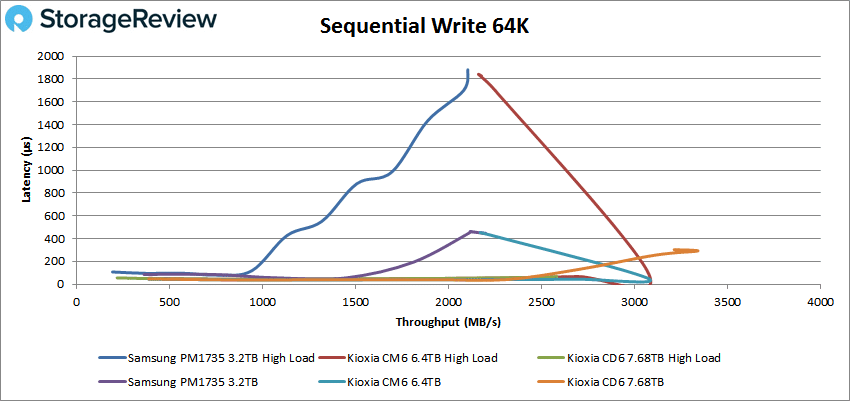
In 64K writes, the PM1735 showed a peak performance of 35,160K IOPS or 2.3GB/s at a latency of about 445µs. High Load 64K sequential write saw the PM1735 at about 33,643 IOPS or 2.1GB/s at a latency of 1.88ms.
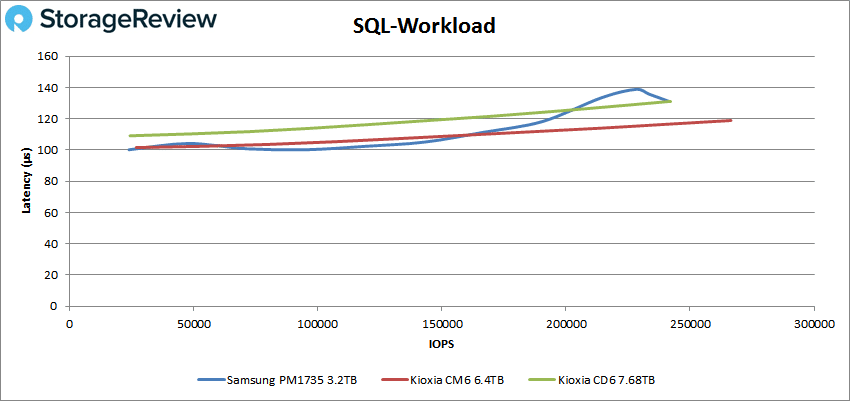
Our next set of tests are our SQL workloads: SQL, SQL 90-10, and SQL 80-20. Starting with SQL, the Samsung PM1735 ended up right next to the Kioxia CD6 drive, with a peak of 241,721 IOPS at a latency of 131µs.
For SQL 90-10 the PM1735 showed similar peak performance of the CD6 again with a peak performance of 241,804 IOPS at a latency of 130.8µs.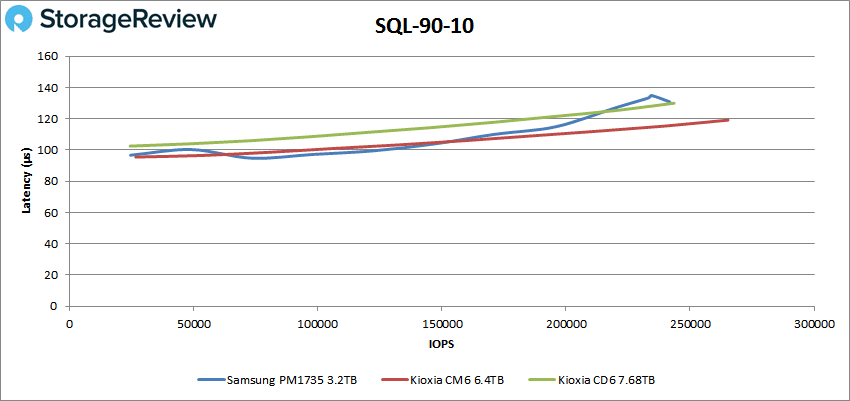
With SQL 80-20, results spread out a little more, placing the PM1735 slightly back in 3rd place with a peak performance of 225,753 IOPS 139.7µs.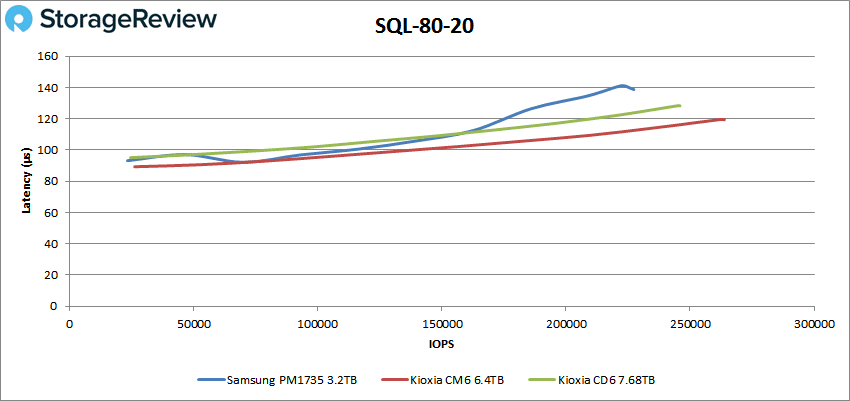
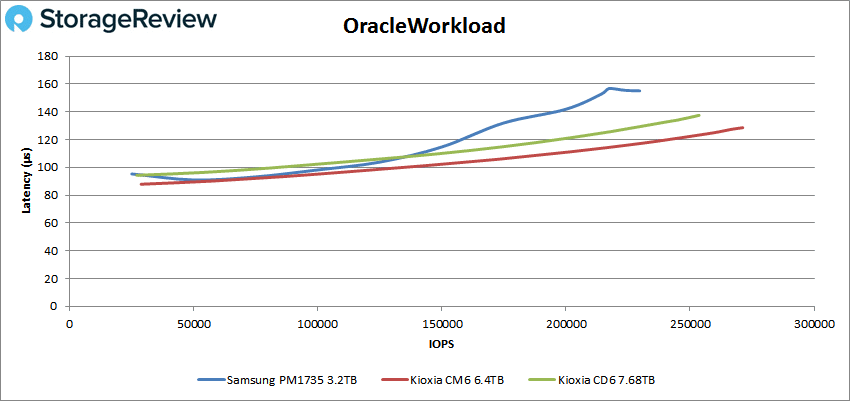
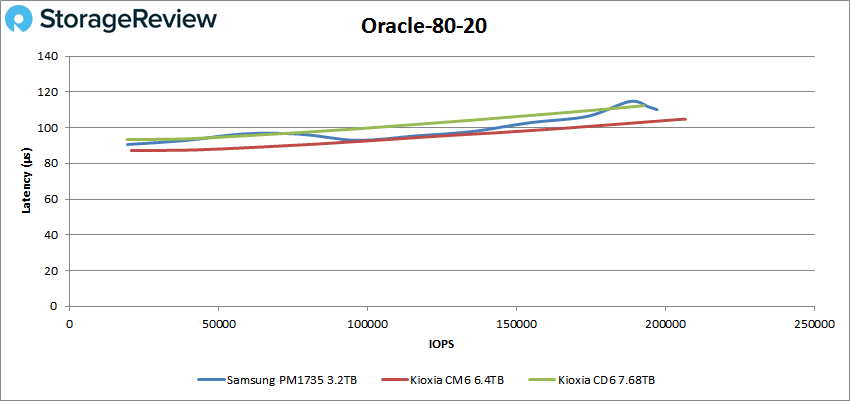
Next up are our Oracle workloads: Oracle, Oracle 90-10, and Oracle 80-20. Starting with Oracle, the PM1735 showed a peak performance of 229,702 IOPS at a latency of 155.1µs, placing it a little behind the Kioxia drives.
In Oracle 90-10, the PM1735 finally placed above one of the Kioxia drives for second place (and right on the tail of the CM6) with a peak performance of 199,587 IOPS at a latency of only 109µs.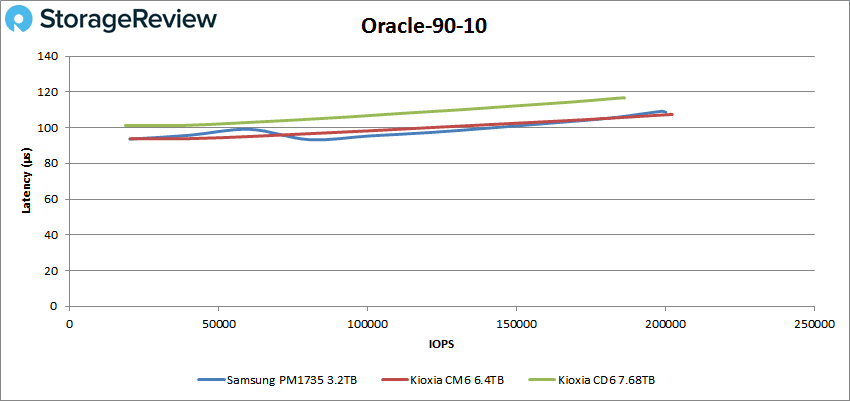
The PM1735 took second again in the Oracle 80-20 with a peak of 197,236 IOPS at a low latency of 110.1µs.
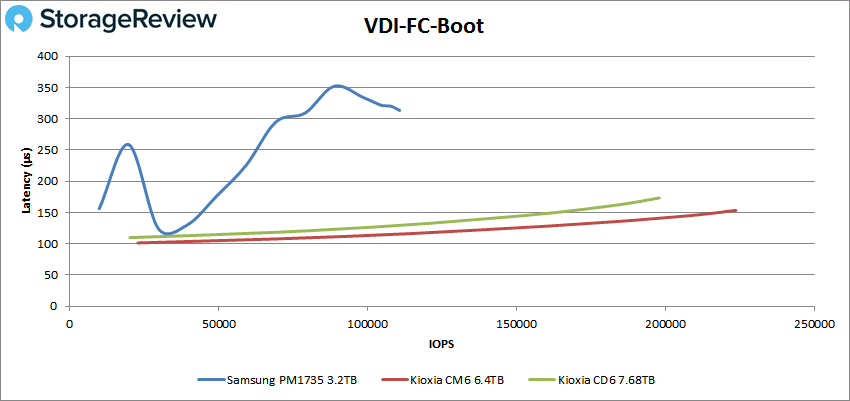
Next, we switched over to our VDI clone test, Full and Linked. For VDI Full Clone, the Samsung drive placed well back in all categories. First up is (FC) Boot, where the PM1735 peaked at 110,816 IOPS and a latency of 313.4µs.
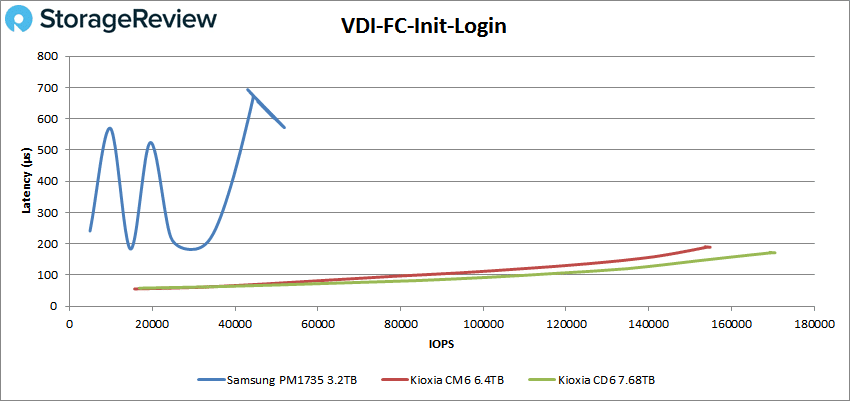
For VDI FC Initial Login the PM1735 remained way behind the Kioxia drives with a peak performance of just 51,903 IOPS with a latency of 571.8µs (before taking another spike in performance).
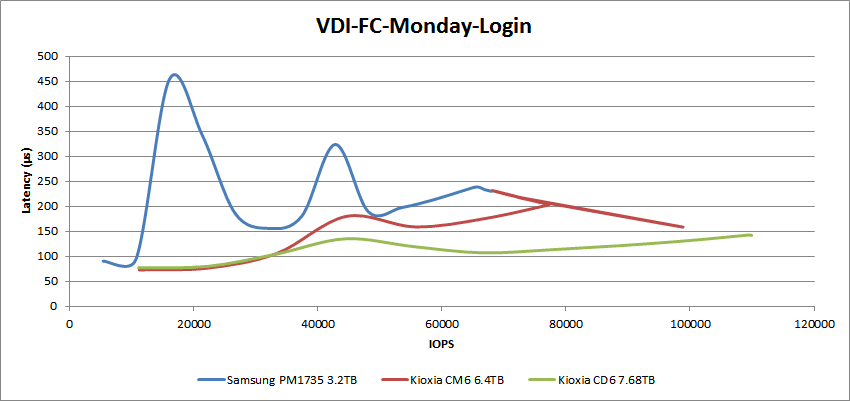
Our VDI FC Monday Login benchmark saw the PM1735 get slightly closer to the Koxia drives with a peak performance of 68,023 IOPS with a latency of 230µs.
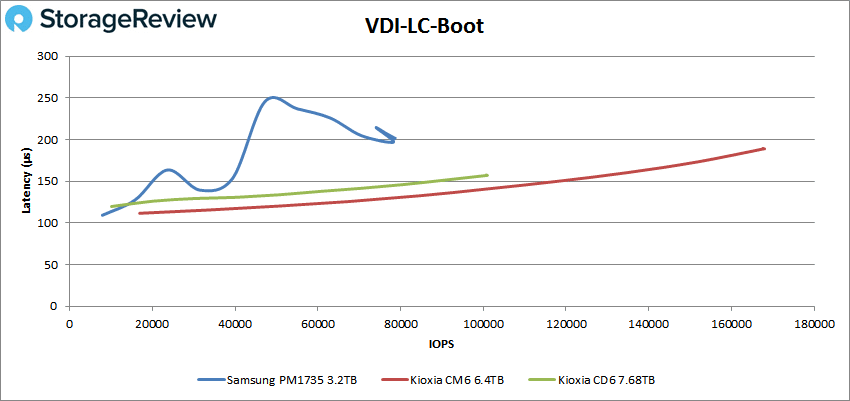
For VDI Linked Clone (LC) Boot, the PM1735 was well back again with a peak score of 78,481 IOPS at a latency 202µs.
VDI LC Initial Login, the PM1735 actually finished well ahead of the Kioxia drives with a peak of just under 50K IOPS at a latency of 159.4µs before dropping off some.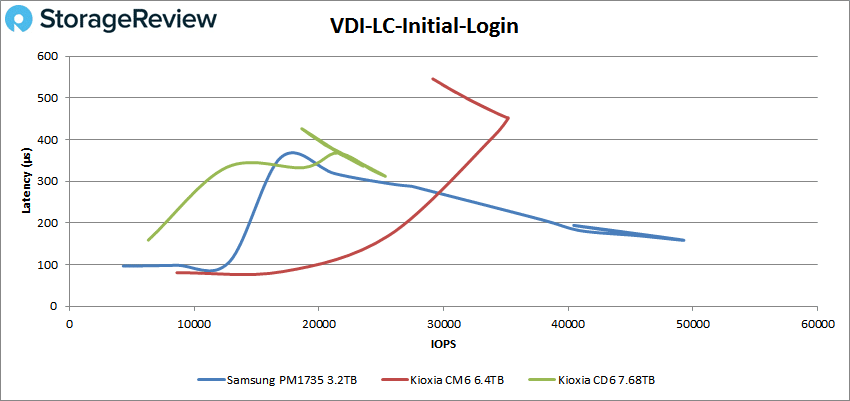
Finally, VDI LC Monday Login had the PM1735 back at the bottom of the pack with a peak score of 55,088 IOPS and a latency of 285.1µs.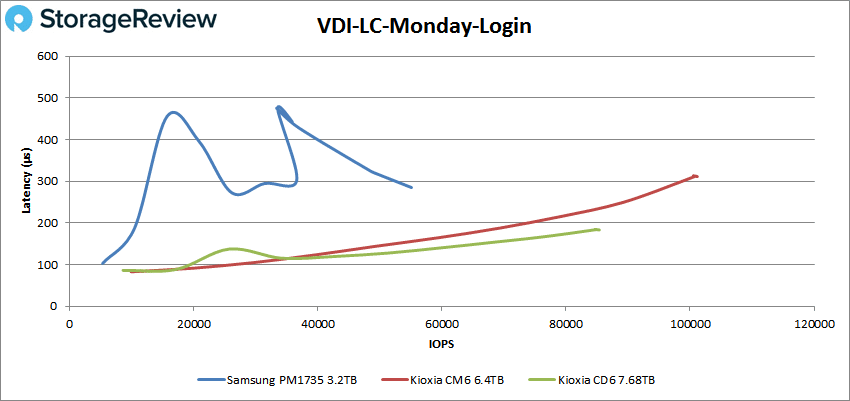
Conclusion
The Samsung PM1735 is a PCIe Gen4 SSD designed for demanding enterprise workloads. With its 3 DWPD endurance and performance profile of 8GB/s reads and 3.8GB/s for writes, on paper, the drive seems well-suited for the job. That’s a large reason why HPE is including it with their latest Gen4-enabled servers under the HPE P16499-B21 part number. Incidentally, as server vendors multi-source their components, that part number also includes the KIOXIA CM6 and Intel P4610 in the “high-performance mixed-use SFF” category.
For performance, we put the new Samsung drive through our usual gauntlet of Application Workload Analysis and VDBench. In addition, like the KIOXIA drive reviews we previously published, we added in a higher load test on VDBench to stress it a bit further since they are designed to handle it.
For our Application Workload Analysis tests, we ran SQL Server and Sysbench. With SQL Server the PM1735 had a TPS and average latency of 12,625.56 and 11.25ms, both of which were near the bottom of the leaderboard. With Sysbench, it posted 7,869.21 TPS (which was well behind the KIOXIA drives), 16.26ms average latency, and 28.90ms in our worst-case scenario latency.
In VDBench, the Samsung drive really struggled. Basic highlights include just over 400K in 4K read, 632K IOPS in 4K read high load, 228K IOPS in 4K write, 196K IOPS in 4K write high load, 1.55GB/s in 64K read, 2.47GB/s in 64K read high load, and 2.3GB/s in 64K write and 2.1GB/s in 64K write high load. SQL saw peaks of 242K IOPS, 242K IOPS in SQL 90-10, and 226K IOPS in SQL 80-20.
Oracle gave us peaks of 230K IOPS, 200K IOPS in Oracle 90-10, and 197K IOPS in Oracle 80-20. VDI FC gave us 111K IOPS boot, 52K IOPS Initial Login, and 68K IOPS in Monday Login. VDI LC saw 78K IOPS boot, 50K IOPS Initial Login, and 55K IOPS Monday Login. Across these workloads, where the other models we tested easily absorbed the additional ramped-up workloads, the Samsung PM1735 bogged down.
Ultimately the move to Gen4 has given enterprise SSD vendors a lot of performance opportunities. While the PM1735 did reasonably well in a few spots, it turned in a pretty uneven performance profile. Real-world use cases may not notice though, depending on what hardware they’re coming from. This is especially true if the workloads are database-driven, where the drive did okay. But given the choice of drives on HPE platforms, the CM6 is clearly a better option.


 Amazon