

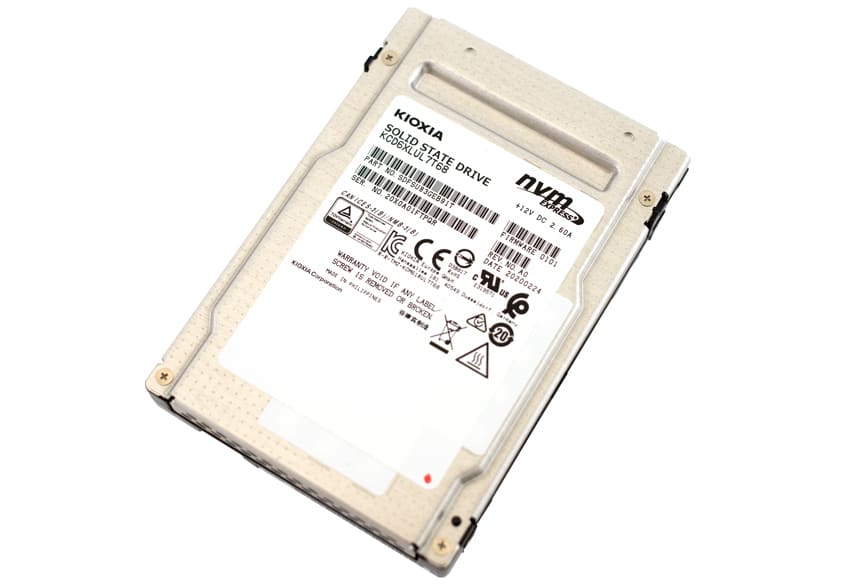
The NVMe interface, specifically PCIe 3.0 NVMe 1.3, has been the preferable SSD interface for virtually any use case for a while now. This interface has been used time and again as vendors continue to improve in performance with each new generation. PCIe has now entered into 4.0, bringing with it a massive gains in sequential and random performance. The KIOXIA CD6 is the latest SSD to hit the market (and one of the first PCIe 4.0 for enterprise), focusing on consistent performance in demanding 24×7 environments. This makes it ideal for data-centers with mixed-use and read intensive endurance needs. The KIOXIA CD6 SSDs are also SFF-TA-1001 conformant, which allow for connectivity with SAS, SATA and NVMe drives on the same backplane (as well as Tri-mode controllers). The KIOXIA line features capacities ranging from 800GB to 15.36TB and are available in several different security and endurance options. The CD6 also comes in 2.5-inch, 15mm Z-height form factors and is powered by KIOXIA’s proprietary controller, firmware and BiCS FLASH 96-layer 3D TLC memory. It uses a single-port design (i.e., there is one data path from the host to the SSD).
UPDATE 4/2/22 – We have re-reviewed the Kioxia CD6 with more mature firmware
Performance of PCIe 4.0 has potential to reach some pretty incredible numbers, and the KIOXIA CD6 certainly is no exception. KIOXIA quotes their new drive line to deliver sequential performance up to 6.2GB/s and 4.0GB/s in reads and writes, respectively, while random performance has the potential to hit up to a million IOPS in reads and 250,000 IOPS in writes. These are impressive numbers to say the least.
It also features a range of built-in reliability functionality, including 6th generation drive failure recovery, and double parity protection, and Power loss protection (PLP), end-to-end data correction for extra reliability. The KIOXIA CD6 is NVMe 1.4 compliant, which brings some important features to the drive. This includes persistent event logs, sanitizing improvements and namespace granularity and namespace write protection.
KIOXIA CD6 Specifications
| Specification | CM6-R (Read-Intensive) | CM6-V (Mixed Use) |
| Form Factor |
2.5-inch 15mm Z-height |
|
| Capacity[1][2] | 960GB, 1.92TB, 3.84TB, 7.68TB, 15.36TB | 800GB, 1.6TB, 3.2TB, 6.4TB, 12.8TB |
| Interface | PCIe Gen3 / 4, 1×4 | |
| Compliance | PCIe 4.0 and NVMe 1.4 | |
| NAND Type | KIOXIA BiCS FLASH 96-layer 3D TLC | |
| Sequential Read | Gen3 = up to 3,500MB/s; Gen4 = up to 6,200MB/s | Gen3 = up to 3,500MB/s; Gen4 = up to 6,200MB/s |
| Sequential Write | Gen3 = up to 2,350MB/s; Gen4 = up to 4,000MB/s | Gen3 = up to 2,350MB/s; Gen4 = up to 4,000MB/s |
| Random Read | Gen3 = up to 770K IOPS; Gen4 = up to 1.0M IOPS | Gen3 = up to 770K IOPS; Gen4 = up to 1.0M IOPS |
| Random Write | Gen3 = up to 75K IOPS; Gen4 = up to 85K IOPS | Gen3 = up to 165K IOPS; Gen4 = up to 250K IOPS |
| Power Consumption |
Active: 20W; Idle: <5W |
|
| Endurance | 1 DWPD for 5 years | 3 DWPD for 5 years |
| Uncorrectable BER |
1 sector per 10^17 bits read |
|
| MTTF / AFR |
2.5M hours / 0.35% |
|
| Operating Temperature |
0 to 70C |
|
KIOXIA CD6 Performance
Testbed
Our new PCIe Gen4 Enterprise SSD reviews leverage a Lenovo ThinkSystem SR635 for application tests and synthetic benchmarks. The ThinkSystem SR635 is a well-equipped single-CPU AMD platform, offering CPU power well in excess of what’s needed to stress high-performance local storage. It is also the only platform in our lab (and one of the few on the market currently) with PCIe Gen4 U.2 bays. Synthetic tests don’t require a lot of CPU resources but still leverage the same Lenovo platform. In both cases, the intent is to showcase local storage in the best light possible that aligns with storage vendor maximum drive specs.
PCIe Gen4 Synthetic and Application Platform (Lenovo ThinkSystem SR635)
- 1 x AMD 7452 (2.35GHz x 32 Cores)
- 8 x 64GB DDR4-3200MHz ECC DRAM
- CentOS 7.7 1908
- ESXi 6.7u3
PCIe Gen3 Application Platform (Lenovo ThinkSystem SR850)
- 4 x Intel Platinum 8160 CPU (2.1GHz x 24 Cores)
- 16 x 32GB DDR4-2666Mhz ECC DRAM
- 2 x RAID 930-8i 12Gb/s RAID Cards
- 8 NVMe Bays
- VMware ESXI 6.7u3
PCIe Gen3 Synthetic Platform (Dell PowerEdge R740xd)
- 2 x Intel Gold 6130 CPU (2.1GHz x 16 Cores)
- 4 x 16GB DDR4-2666MHz ECC DRAM
- 1x PERC 730 2GB 12Gb/s RAID Card
- Add-in NVMe Adapter
- Ubuntu-16.04.3-desktop-amd64
Being the first set of reviews on a new platform, we’ve included past drive results, which are close but not 100% apples to apples comparisons since they were testing on an older platform. Our synthetic test differences won’t have much skew in results, but the application workloads working on the single CPU AMD platform vs Quad CPU Intel platform may to some degree. In our MySQL tests one of the new Gen4 KIOXIA products did take the lead, but in SQL server latency was average. With only two Gen4 drives we’ve been able to publish around we don’t have a significant amount of comparable data, but it is something to take note of viewing these results. We’ve also ramped up our synthetic tests to take advantage of the faster SSDs, now showing test results with higher peak thread counts.
Testing Background and Comparables
The StorageReview Enterprise Test Lab provides a flexible architecture for conducting benchmarks of enterprise storage devices in an environment comparable to what administrators encounter in real deployments. The Enterprise Test Lab incorporates a variety of servers, networking, power conditioning, and other network infrastructure that allows our staff to establish real-world conditions to accurately gauge performance during our reviews.
We incorporate these details about the lab environment and protocols into reviews so that IT professionals and those responsible for storage acquisition can understand the conditions under which we have achieved the following results. None of our reviews are paid for or overseen by the manufacturer of equipment we are testing. Additional details about the StorageReview Enterprise Test Lab and an overview of its networking capabilities are available on those respective pages.
Application Workload Analysis
In order to understand the performance characteristics of enterprise storage devices, it is essential to model the infrastructure and the application workloads found in live-production environments. Our benchmarks for the Kioxia CD6 are therefore the MySQL OLTP performance via SysBench and Microsoft SQL Server OLTP performance with a simulated TCP-C workload. For our application workloads, each drive will be running 4 identically configured VMs.
SQL Server Performance
Each SQL Server VM is configured with two vDisks: 100GB volume for boot and a 500GB volume for the database and log files. From a system-resource perspective, we configured each VM with 8 vCPUs, 64GB of DRAM and leveraged the LSI Logic SAS SCSI controller. While our Sysbench workloads tested previously saturated the platform in both storage I/O and capacity, the SQL test is looking for latency performance.
This test uses SQL Server 2014 running on Windows Server 2012 R2 guest VMs, and is stressed by Quest’s Benchmark Factory for Databases. StorageReview’s Microsoft SQL Server OLTP testing protocol employs the current draft of the Transaction Processing Performance Council’s Benchmark C (TPC-C), an online transaction-processing benchmark that simulates the activities found in complex application environments. The TPC-C benchmark comes closer than synthetic performance benchmarks to gauging the performance strengths and bottlenecks of storage infrastructure in database environments. Each instance of our SQL Server VM for this review uses a 333GB (1,500 scale) SQL Server database and measures the transactional performance and latency under a load of 15,000 virtual users.
SQL Server Testing Configuration (per VM)
- Windows Server 2012 R2
- Storage Footprint: 600GB allocated, 500GB used
- SQL Server 2014
-
- Database Size: 1,500 scale
- Virtual Client Load: 15,000
- RAM Buffer: 48GB
- Test Length: 3 hours
- 2.5 hours preconditioning
- 30 minutes sample period
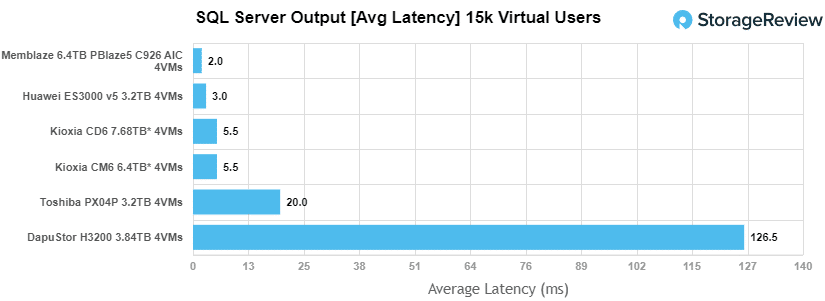
For our SQL Server transactional benchmark, the KIOXIA CD6 had a score of 12,633.7 TPS at 4VMs.
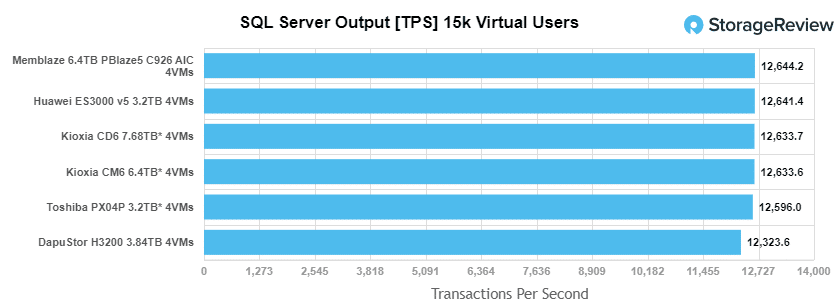
Average latency saw the KIOXIA CD6 have 5.5ms at 4VMs (the same as the CD6), putting it slightly behind the Huawei and Memblaze drives.
Sysbench Performance
The next application benchmark consists of a Percona MySQL OLTP database measured via SysBench. This test measures average TPS (Transactions Per Second), average latency, and average 99th percentile latency as well.
Each Sysbench VM is configured with three vDisks: one for boot (~92GB), one with the pre-built database (~447GB), and the third for the database under test (270GB). From a system-resource perspective, we configured each VM with 8 vCPUs, 60GB of DRAM and leveraged the LSI Logic SAS SCSI controller.
Sysbench Testing Configuration (per VM)
- CentOS 6.3 64-bit
- Percona XtraDB 5.5.30-rel30.1
-
- Database Tables: 100
- Database Size: 10,000,000
- Database Threads: 32
- RAM Buffer: 24GB
- Test Length: 3 hours
- 2 hours preconditioning 32 threads
- 1 hour 32 threads
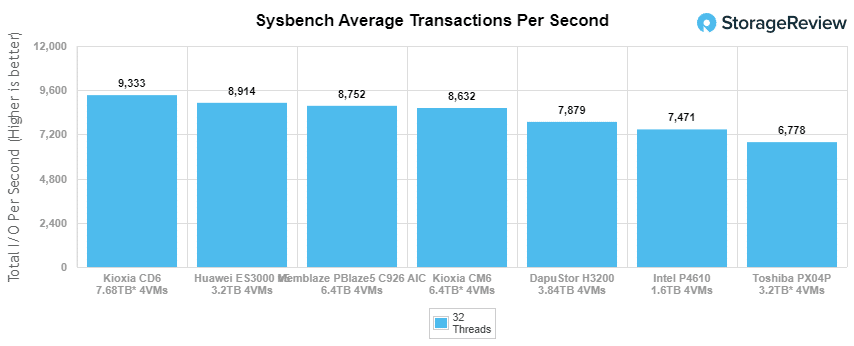
Moving on to the Sysbench transactional benchmark, the KIOXIA posted a leading score of 9,333 TPS at 4VMs.
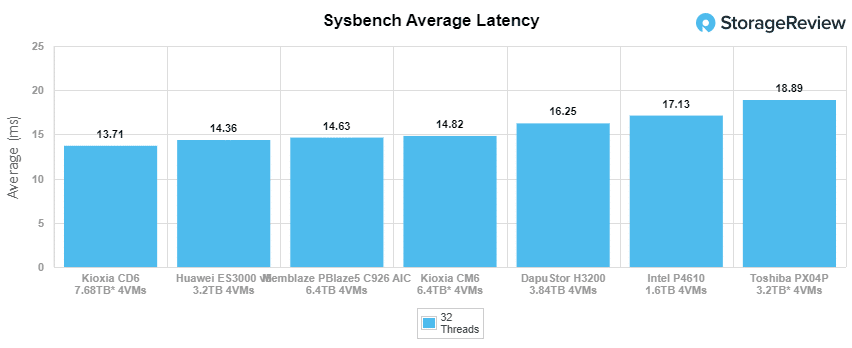
In Sysbench average latency, we saw the CD6 with a latency of just 13.71ms at 4VMs, again leading the pack.
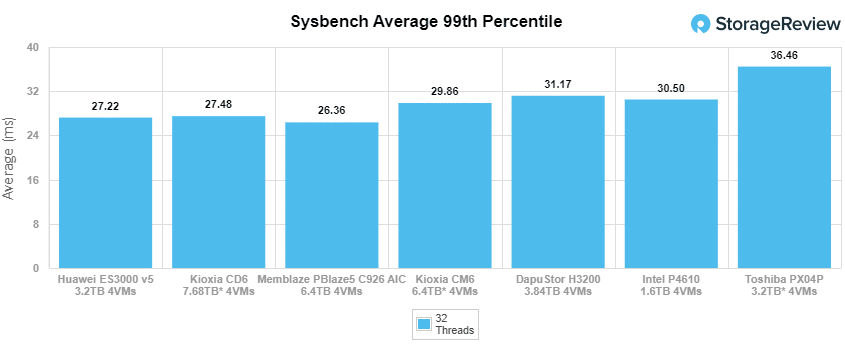
For our worst-case scenario latency (99th percentile) the CD6 hit 27.48ms at 4VMs, this time trailing the Huawei by a hair (27.22ms).
VDBench Workload Analysis
When it comes to benchmarking storage devices, application testing is best, and synthetic testing comes in second place. While not a perfect representation of actual workloads, synthetic tests do help to baseline storage devices with a repeatability factor that makes it easy to do apples-to-apples comparison between competing solutions. These workloads offer a range of different testing profiles ranging from “four corners” tests, common database transfer size tests, to trace captures from different VDI environments. All of these tests leverage the common vdBench workload generator, with a scripting engine to automate and capture results over a large compute testing cluster. This allows us to repeat the same workloads across a wide range of storage devices, including flash arrays and individual storage devices. Our testing process for these benchmarks fills the entire drive surface with data, then partitions a drive section equal to 25% of the drive capacity to simulate how the drive might respond to application workloads. This is different than full entropy tests which use 100% of the drive and takes them into steady state. As a result, these figures will reflect higher-sustained write speeds.
Profiles:
- 4K Random Read: 100% Read, 128 threads, 0-120% iorate
- 4K Random Write: 100% Write, 128 threads, 0-120% iorate
- 4K Random Read (high load): 100% Read, 512 threads, 0-120% iorate
- 4K Random Write (high load): 100% Write, 512 threads, 0-120% iorate
- 64K Sequential Read: 100% Read, 32 threads, 0-120% iorate
- 64K Sequential Write: 100% Write, 16 threads, 0-120% iorate
- 64K Sequential Read (high load): 100% Read, 64 threads, 0-120% iorate
- 64K Sequential Write (high load): 100% Write, 64 threads, 0-120% iorate
- Synthetic Database: SQL and Oracle
- VDI Full Clone and Linked Clone Traces
Comparables:
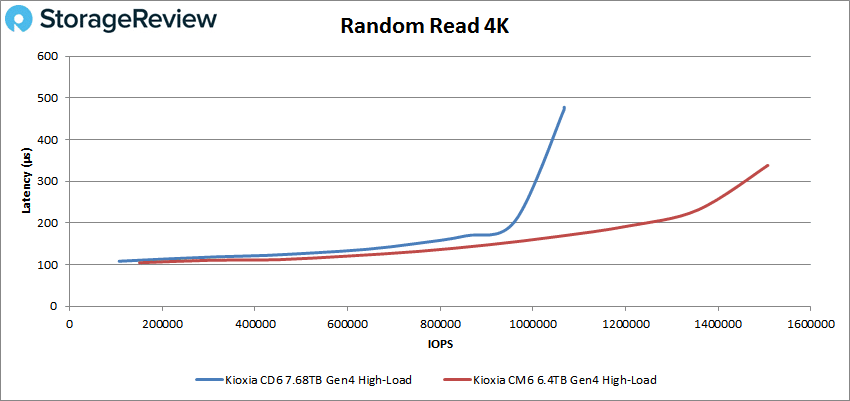
In our first VDBench Workload Analysis, Random 4K Read, the KIOXIA CD6 had a peak score of 760,160 IOPS with a latency of 165.5µs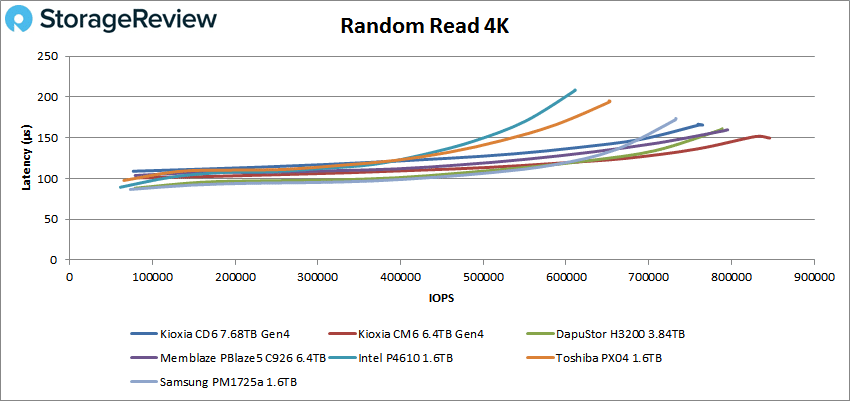 During a high load in Random 4K Read, we saw the KIOXIA CD6 slow down a bit nearing the 1 million IOPS mark, ending up with a peak of 1,067,840 IOPS at 472 µs.
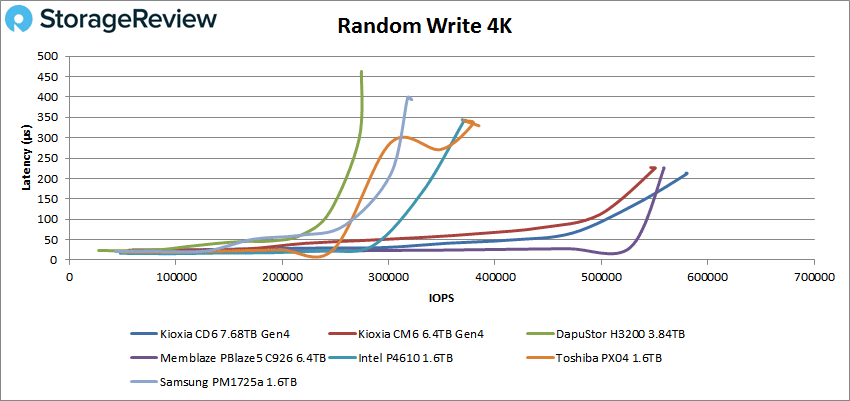
For 4K random write, the CD6 was the top performer, peaking at 579,919 IOPS at a latency of 211.1µs.
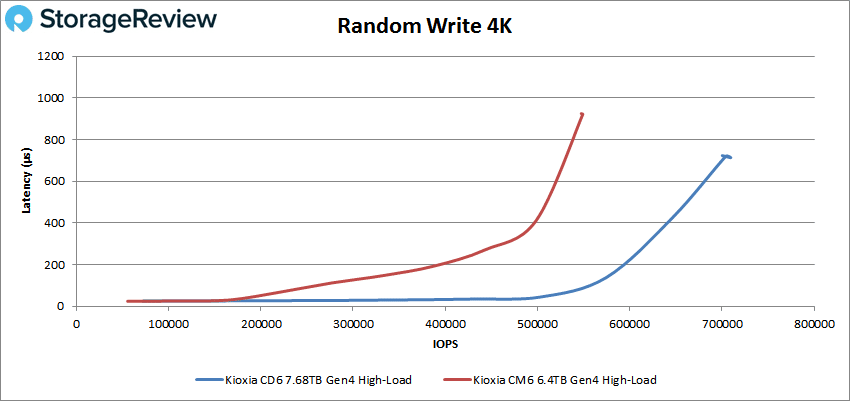
 In a high write load, the KIOXIA CD6 showed an impressive peak of 709,547 IOPS with 713.3µs in latency.
 Switching over to sequential workloads, the CD6 showed solid results with a peak of 68,413 IOPS (or 4.28GB/s) at 465.6 µs (the other KIOXIA was expectedly the best drive in reads).
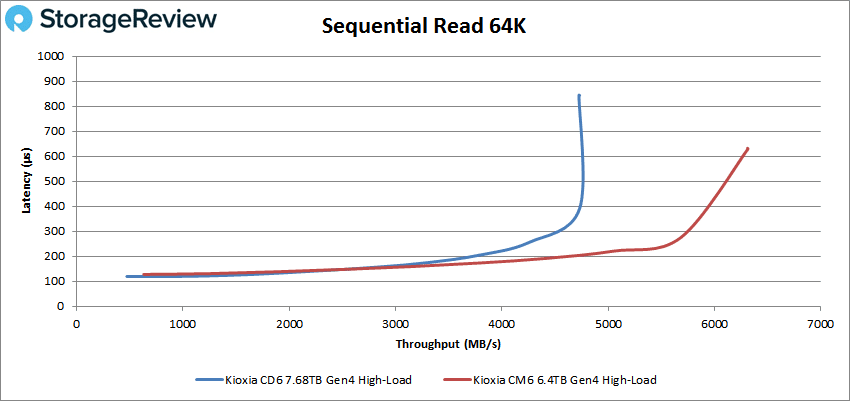
 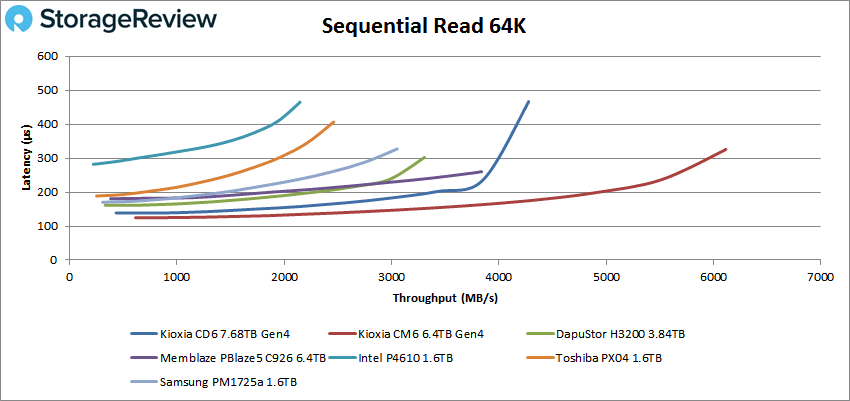 During a high load in sequential reads, the CD6 peaked at 75,598 IOPS (4.72GB/s) before slowing down reaching a latency as high as 843.5ms.
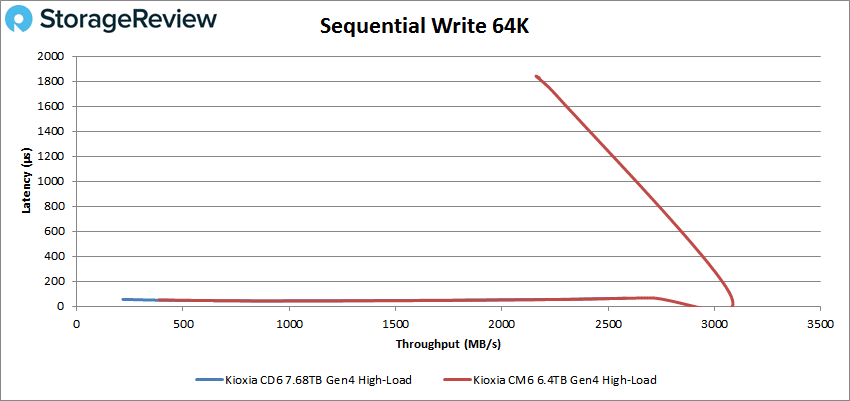
 For 64K sequential write, the KIOXIA CD6 again showed it is a powerhouse in writes, posting a peak 53,402 IOPS (or 3.33GB/s) with a latency of 291.6ms before dropping off a bit at the end.
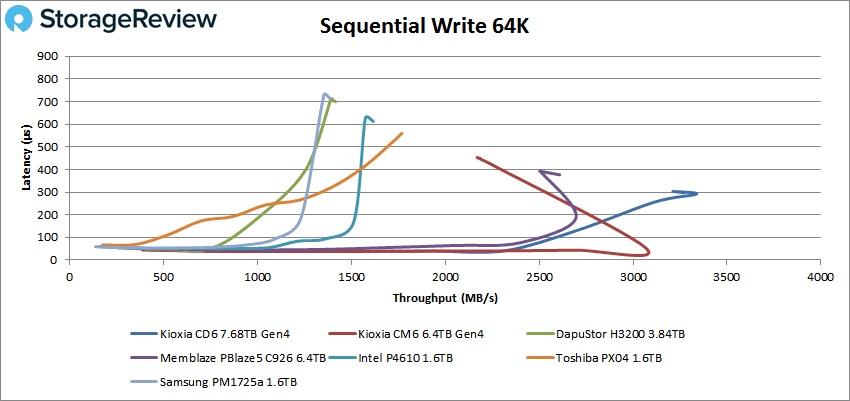 In a high write load, the KIOXIA CD6 peaked at 42,299 IOPS (or 2.58GB/s) with a latency at just 65.1ms.
 Our next set of tests are our SQL workloads: SQL, SQL 90-10, and SQL 80-20. Beginning with SQL, the KIOXIA CD6 had a solid peak of 241,700 IOPS and a latency of 131.1ms.
 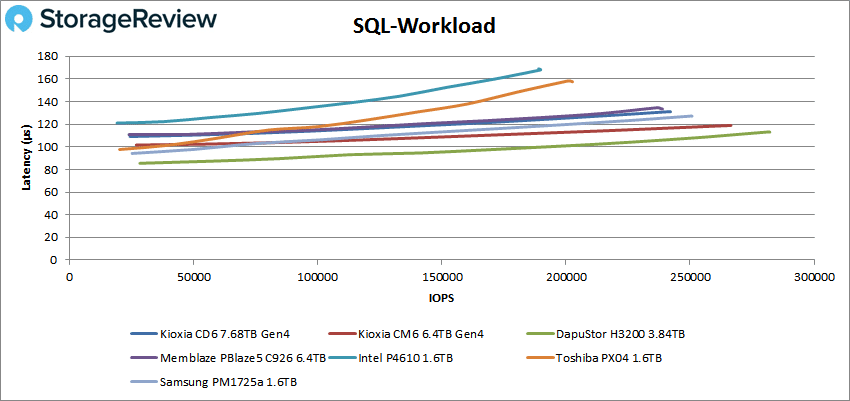 In SQL 90-10, the CD6 had pretty much the same performance as the Memblaze drive, peaking at 243,292 IOPS and 129.9ms in latency.
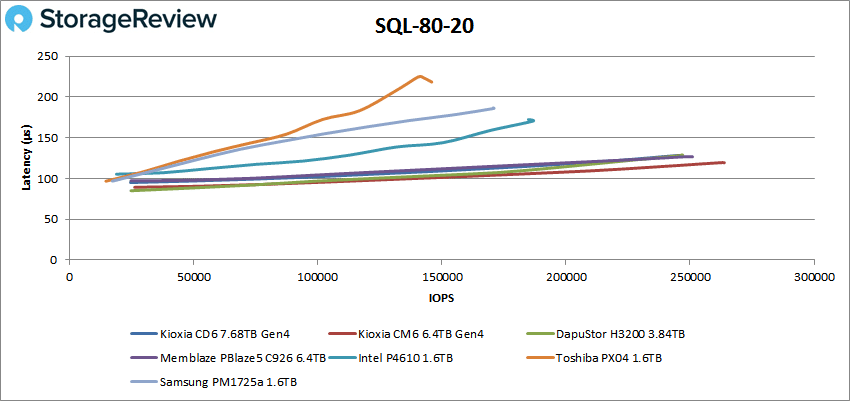
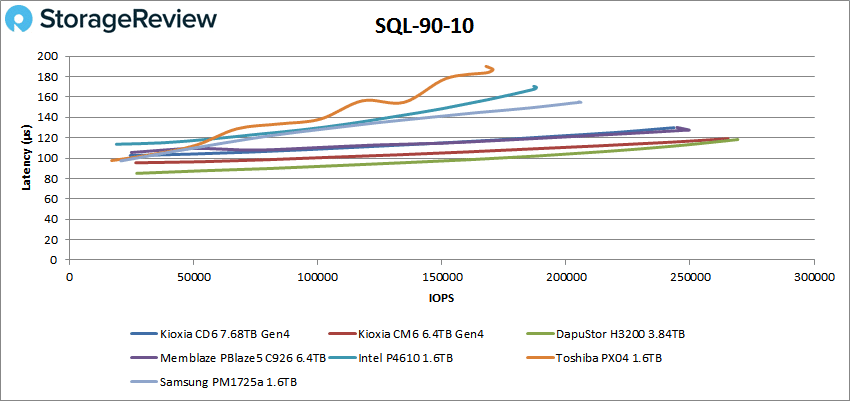 In the SQL 80-20, the top performance drives boasted pretty similar performance, with the CD6 posting a peak of 244,857 IOPS with a latency of 128.3ms.
 Next up are our Oracle workloads: Oracle, Oracle 90-10, and Oracle 80-20. Starting with Oracle, the KIOXIA CD6 peaked in third place with a solid 253,635 IOPS and a latency of 137.5µs.
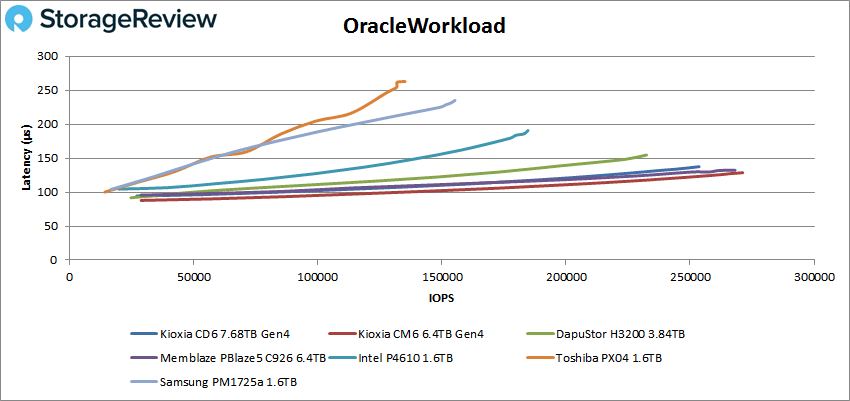
Oracle 90-10 showed us more of the above, the CD6 peaked at 168,000 IOPS with 116.8µs in latency.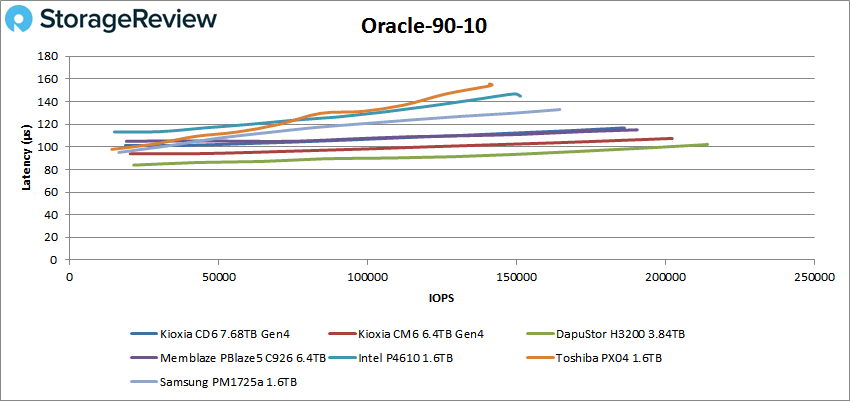 With Oracle 80-20, the top 4 drives showed very similar performance, as the CD6 peaked at 192,663 with a latency of 112.3ms.
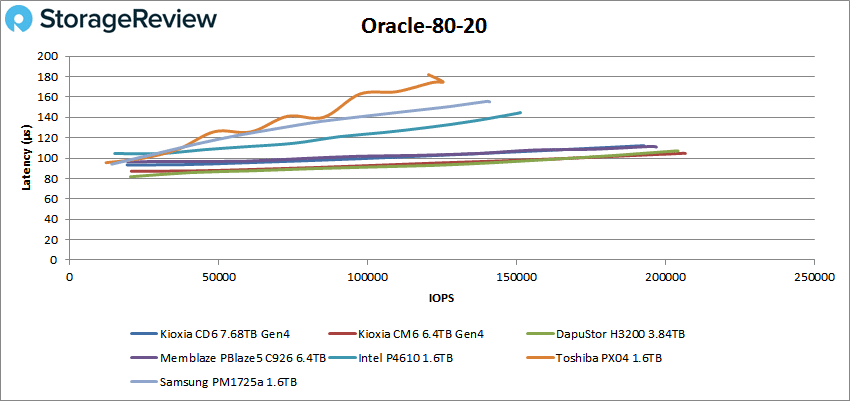 Next, we switched over to our VDI clone test, Full and Linked. For VDI Full Clone (FC) Boot, the KIOXIA CD6 had a peak of 196,584 IOPS at a latency of 172.3µs for third place.
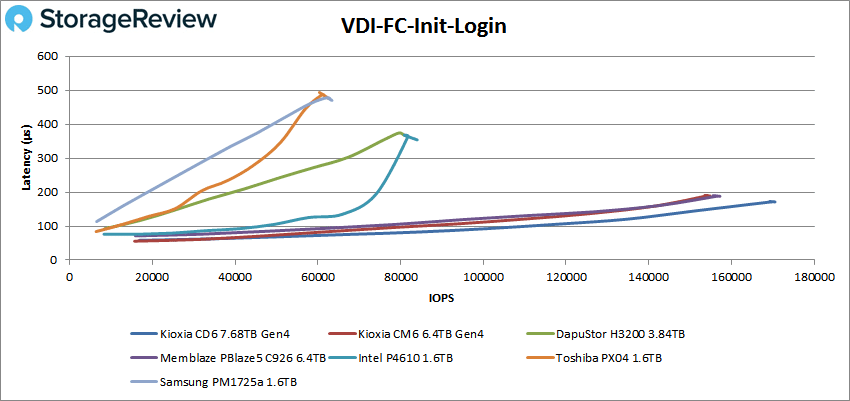
 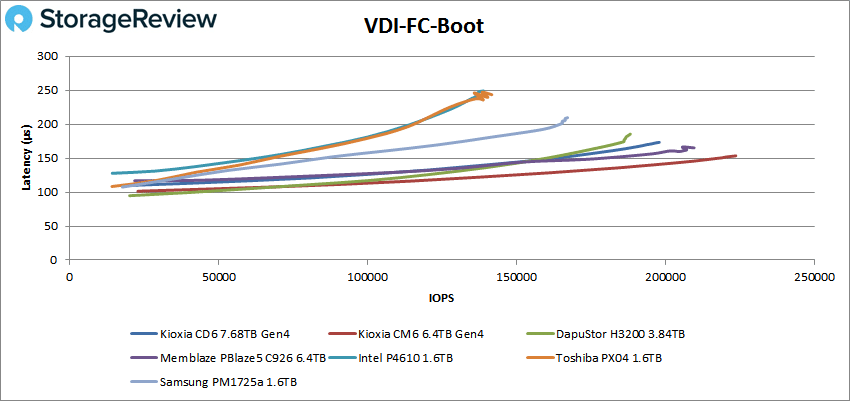 VDI FC Initial Login, the KIOXIA CD6 had the best performance with a peak of 169,412 IOPS at 172.6ms.
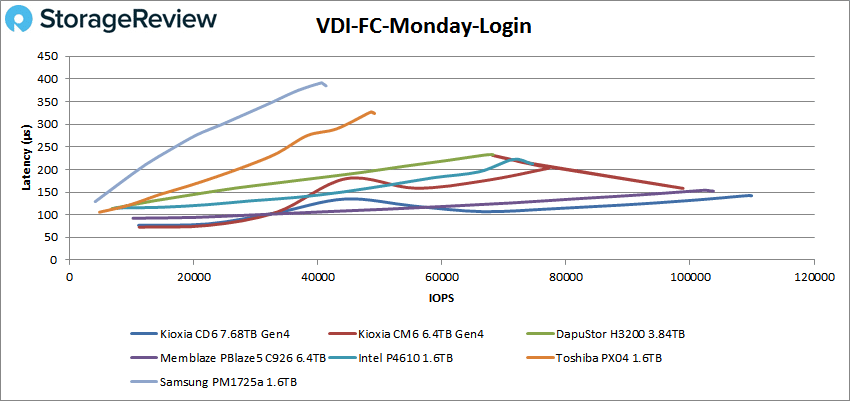
 VDI FC Monday Login, the CD6 showed top performance once again with a peak of 109,488 IOPS at 142.7ms.
 For VDI Linked Clone (LC) Boot, the CD6 showed an impressive 100,678 IOPS at 157ms in latency, just trailing the KIOXIA CM6.
 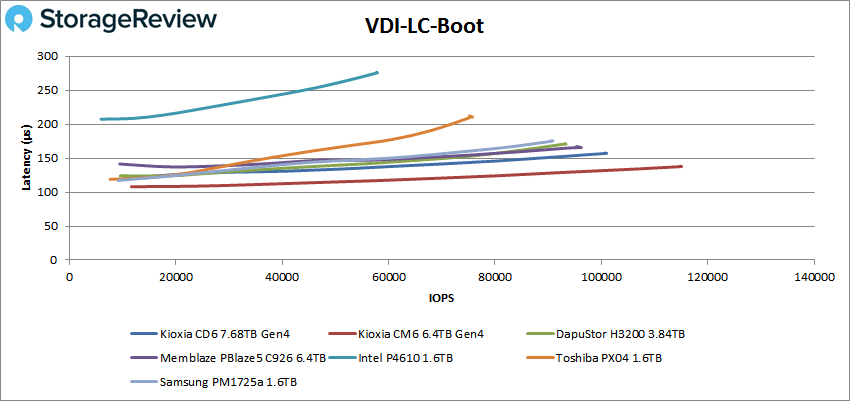 VDI LC Initial Login showed uneven numbers during the initial login profile, peaking at 25,235 IOPS and 313.8ms in latency before taking a big dip in performance.
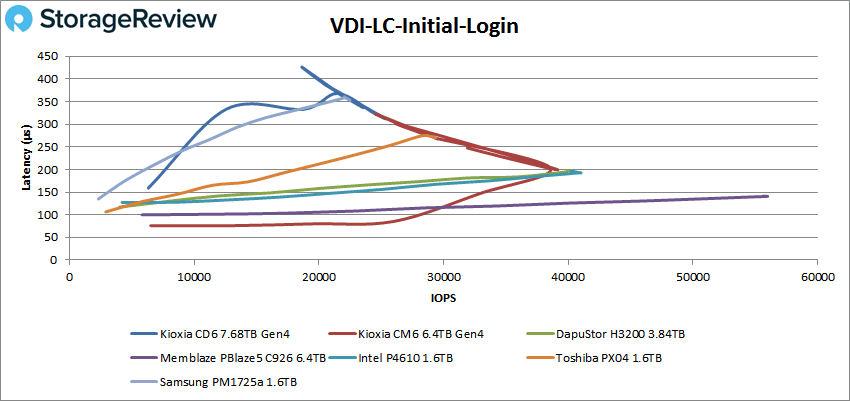 Lastly, with VDI LC Monday Login, the KIOXIA CD6 ended our tests with another good performance, boasting 84,903 IOPS at 184.3ms.
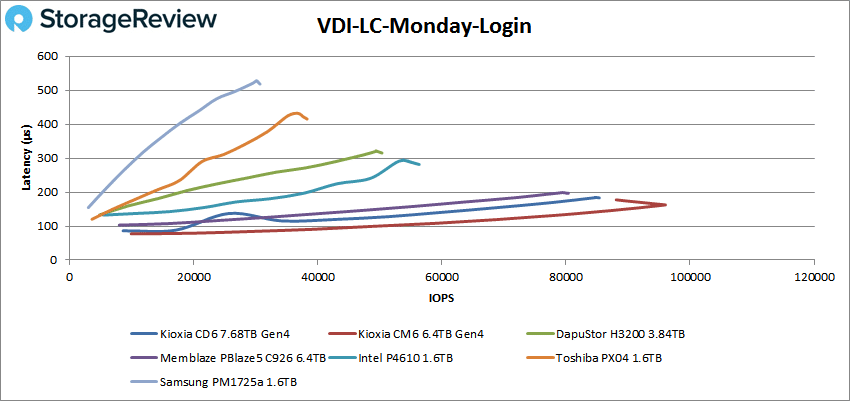
Conclusion
The KIOXIA CD6 is the newest high-performing data-center SSD to hit the market, leveraging the new PCIe 4.0 interface. It is purpose-built for demanding 24×7 environments, specifically those with mixed-use and read intensive endurance needs. The new KIOXIA drive is available in the 2.5-inch 15mm Z-height form factor, features KIOXIA BiCS FLASH 96-layer 3D TLC and is available in a wide range of capacities from 960GB to 15.36TB. It also comes with a range of security options.
For performance, we compared the CD6 to other similarly-classed SSDs, including the KIOXIA CM6. For Application Workload Analysis, we saw the CD6 hit 12,633.7 TPS with an average latency of 5.5ms in SQL Server, placing it just below the Memblaze and Huawei drives. For Sysbench the drive hit 9,333 TPS, 13.71ms average latency, and 27.48m worst-case scenario latency.
Our VDbench test saw more solid performance by the KIOXIA. In most cases, however, it trailed the CM6 drive. Highlights include: 760,160 IOPS in 4K read (1,067,840 IOPS high load), 579,919 IOPS in 4K write (709,547 IOPS high load), 4.28GB/s in 64K read (4.72GB/s high load), and 3.33GB/s in 64K write (2.58GB/s high load). SQL workloads saw 242K IOPS, 243K IOPS for SQL 90-10, and 245K IOPS in SQL 80-20. In Oracle, the top performing drives performed very similarly (the CD6 among them), posting workloads with 254 IOPS, 168K IOPS in Oracle 90-10, and 192K IOPS in Oracle 80-20. In our VDI Clone test, the CD6 showed impressive performance across the board, highlighted by its top-performance in our VDI FC Monday Login and VDI FC Initial Login tests.
The focus of this review is on the performance of the CD6, which puts together an impressive score card. Perhaps the larger story though is the future of PCIe Gen4. Lenovo is first out of the gate with a server that supports PCIe Gen4 from front to back. Most other servers are only supporting Gen4 in the back, which is a fundamental design decision. It was easier and faster to skip the front bays. Lenovo took the more comprehensive path, and developed their Rome servers to be able to take advantage of everything AMD had to offer. The net result is that Lenovo can take advantage of new tech, like the CD6 form KIOXIA, where most others cannot. This puts KIOXIA in a chicken/egg scenario, at least until Intel gets their next gen server CPUs out. It could be said that being ahead of the IT curve in this case is okay though, the CD6 will work fine with legacy platforms, ready to give more when PCIe Gen4 systems are available. For now, expect to see benchmarks galore touting the benefits of AMD servers, especially as the Lenovo dual-CPU systems get into the market.
UPDATE 4/2/22 – We have re-reviewed the Kioxia CD6 with more mature firmware


 Amazon