
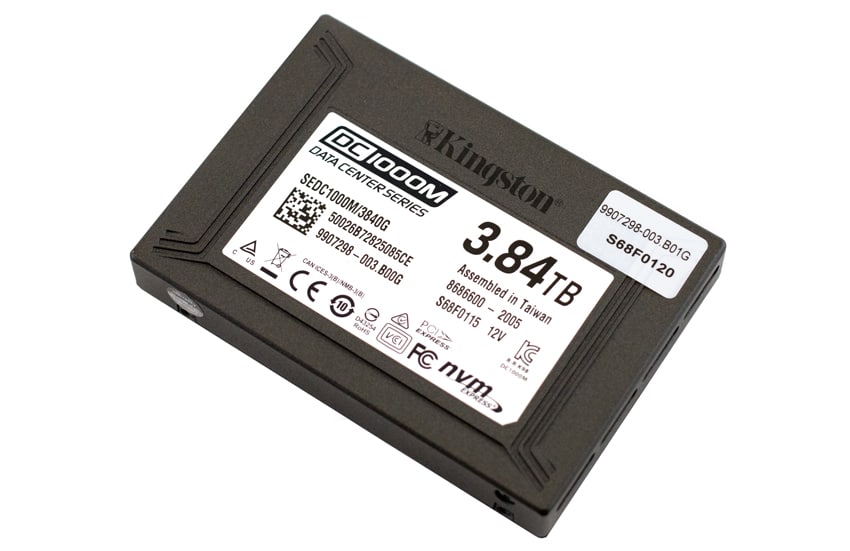
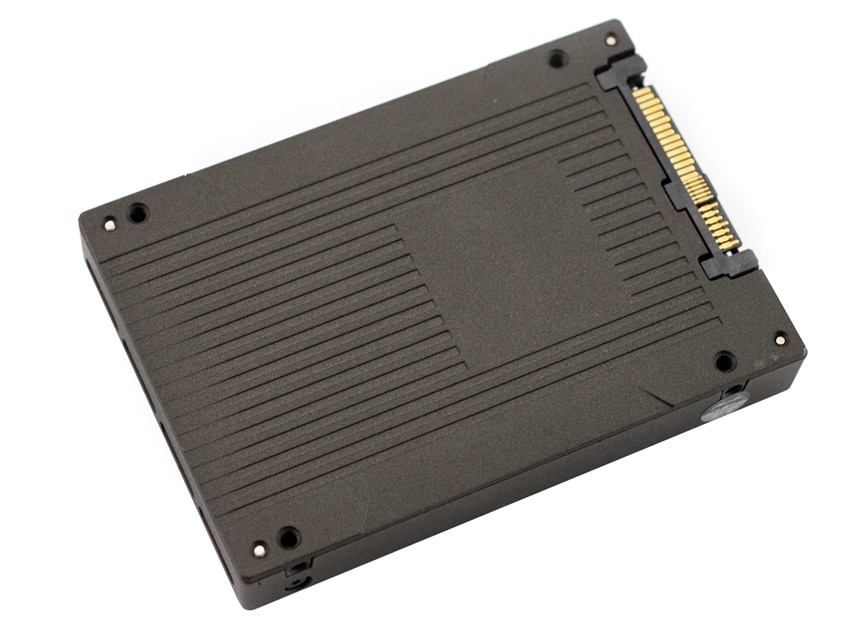
In March of this year, Kingston Digital Inc. expanded its line of affordable enterprise SSDs with the introduction of the Kingston DC1000M. The new SSD is meant to be an affordable drive with NVMe level performance that replaces old SATA and SAS SSDs as companies move forward. The DC1000M comes in capacities between 960GB and 7.68TB and in a U.2 form factor.
In March of this year, Kingston Digital Inc. expanded its line of affordable enterprise SSDs with the introduction of the Kingston DC1000M. The new SSD is meant to be an affordable drive with NVMe level performance that replaces old SATA and SAS SSDs as companies move forward. The DC1000M comes in capacities between 960GB and 7.68TB and in a U.2 form factor.
The DC1000M works well in any server or arrays that utilizes NVMe and U.2 backplanes. Designed for mixed use case workloads, the new drive is stated to be able to hit 3GB/s and up to 540K IOPS with very low latency. This is ideal for the drives applications that include virtualization, HPC, web hosting caching, high-resolution media capture and transport, along with ERP, CRM, GL, OLAP, OLTP, ERM, BI, and EDW workloads. The DC1000M comes with power loss protection and telemetry monitoring for better data protection and reliability.
The Kingston DC 1000M comes in four form factors: 960GB, 1.92TB, 3.84TB, and 7.68TB for this review we will be looking at the 3.84TB model.
Kingston DC1000M Specifications
| Form Factor | U.2, 2.5′′ x 15mm |
| Interface | NVMe PCIe Gen 3.0 x4 |
| Capacities | 960GB, 1.92TB, 3.84TB, 7.68TB |
| NAND | 3D TLC |
| Sequential Read/Write | 960GB – 3,100MBs/1,330MBs 1.92TB – 3,100MBs/2,600MBs 3.84TB – 3,100MBs/2,700MBs 7.68TB – 3,100MBs/2,800MBs |
| Steady-State 4k Read/Write | 960GB – 400,000/125,000 IOPS 1.92TB – 540,000/205,000 IOPS 3.84TB – 525,000/210,000 IOPS 7.68TB – 485,000/210,000 IOPS |
| Latency | TYP Read/Write: <300μs / <1ms |
| Endurance | 960GB — (1 DWPD/5yrs) 1.92TB — (1 DWPD/5yrs) 3.84TB — (1 DWPD/5yrs) 7.68TB — (1 DWPD/5yrs) |
| Power Consumption | 960GB: Idle: 5.14W Average Read: 5.25W Average Write: 9.10W Max Read: 5.64W Max Write: 9.80W 1.92TB: Idle: 5.22W Average Read: 5.31W Average Write: 13.1W Max Read: 5.70W Max Write: 13.92W 3.84TB: Idle: 5.54W Average Read: 5.31W Average Write: 14.69W Max Read: 6.10W Max Write: 15.5W 7.68TB: Idle: 5.74W Average Read: 5.99W Average Write: 17.06W Max Read: 6.63W Max Write: 17.88W |
| Storage temperature | -40°C ~ 85°C |
| Operating temperature | 0°C ~ 70°C |
| Dimensions | 100.09mm x 69.84mm x 14.75mm |
| Weight | 160g |
| Vibration operating | 2.17G peak (7-800Hz) |
| MTBF | 2 million hours |
| Warranty | Limited 5-year warranty |
Kingston DC1000M Performance
Testbed
Our Enterprise SSD reviews leverage a Lenovo ThinkSystem SR850 for application tests (Note: we had to use an adapter card instead of a front bay slot due to a compatibility issue) and a Dell PowerEdge R740xd for synthetic benchmarks. The ThinkSystem SR850 is a well-equipped quad-CPU platform, offering CPU power well in excess of what’s needed to stress high-performance local storage. Synthetic tests that don’t require a lot of CPU resources use the more traditional dual-processor server. In both cases, the intent is to showcase local storage in the best light possible that aligns with storage vendor maximum drive specs.
Lenovo ThinkSystem SR850
- 4 x Intel Platinum 8160 CPU (2.1GHz x 24 Cores)
- 16 x 32GB DDR4-2666Mhz ECC DRAM
- 2 x RAID 930-8i 12Gb/s RAID Cards
- 8 NVMe Bays
- VMware ESXI 6.5
Dell PowerEdge R740xd
- 2 x Intel Gold 6130 CPU (2.1GHz x 16 Cores)
- 4 x 16GB DDR4-2666MHz ECC DRAM
- 1x PERC 730 2GB 12Gb/s RAID Card
- Add-in NVMe Adapter
- Ubuntu-16.04.3-desktop-amd64
Testing Background and Comparables
The StorageReview Enterprise Test Lab provides a flexible architecture for conducting benchmarks of enterprise storage devices in an environment comparable to what administrators encounter in real deployments. The Enterprise Test Lab incorporates a variety of servers, networking, power conditioning, and other network infrastructure that allows our staff to establish real-world conditions to accurately gauge performance during our reviews.
We incorporate these details about the lab environment and protocols into reviews so that IT professionals and those responsible for storage acquisition can understand the conditions under which we have achieved the following results. None of our reviews are paid for or overseen by the manufacturer of equipment we are testing. Additional details about the StorageReview Enterprise Test Lab and an overview of its networking capabilities are available on those respective pages.
Application Workload Analysis
In order to understand the performance characteristics of enterprise storage devices, it is essential to model the infrastructure and the application workloads found in live-production environments. Our benchmarks for the Kingston DC 1000M are therefore the MySQL OLTP performance via SysBench and Microsoft SQL Server OLTP performance with a simulated TCP-C workload. For our application workloads, each drive will be running 2-4 identically configured VMs.
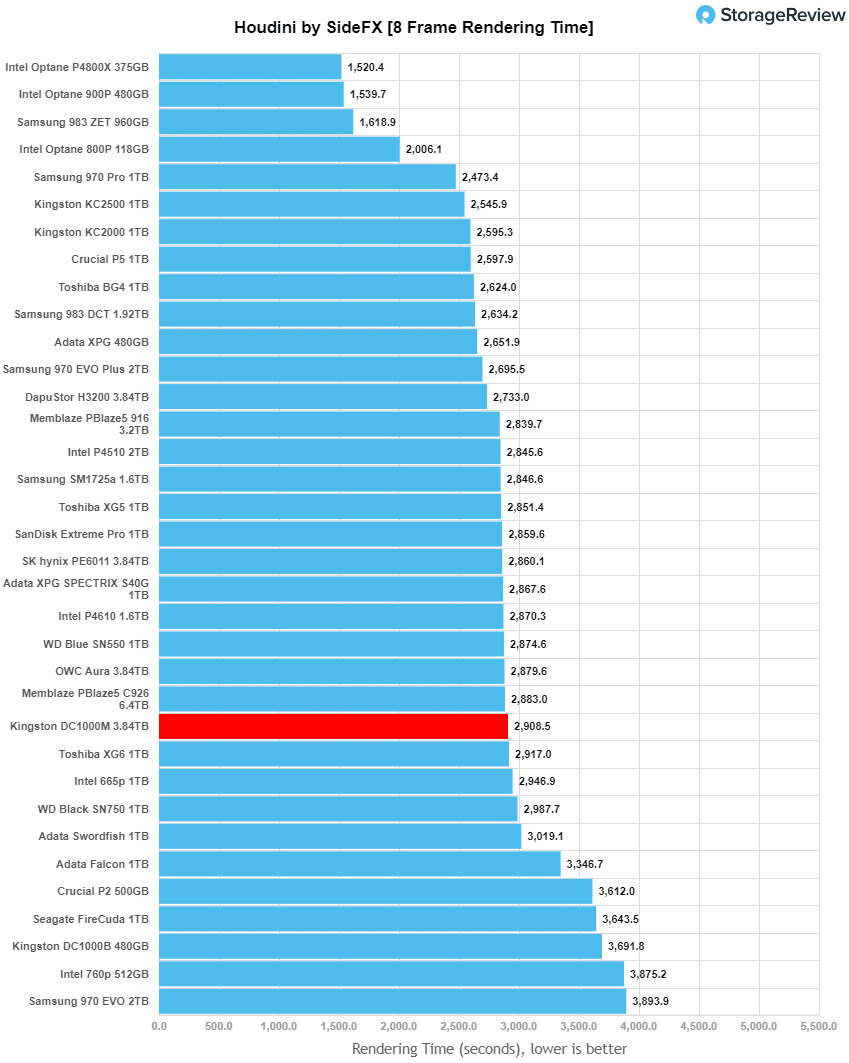
Houdini by SideFX
The Houdini test is specifically designed to evaluate storage performance as it relates to CGI rendering. The test bed for this application is a variant of the core Dell PowerEdge R740xd server type we use in the lab with dual Intel 6130 CPUs and 64GB DRAM. In this case, we installed Ubuntu Desktop (ubuntu-16.04.3-desktop-amd64) running bare metal. Output of the benchmark is measured in seconds to complete, with fewer being better.
The Maelstrom demo represents a section of the rendering pipeline that highlights the performance capabilities of storage by demonstrating its ability to effectively use the swap file as a form of extended memory. The test does not write out the result data or process the points in order to isolate the wall-time effect of the latency impact to the underlying storage component. The test itself is composed of five phases, three of which we run as part of the benchmark, which are as follows:
- Loads packed points from disk. This is the time to read from disk. This is single threaded, which may limit overall throughput.
- Unpacks the points into a single flat array in order to allow them to be processed. If the points do not have dependency on other points, the working set could be adjusted to stay in-core. This step is multi-threaded.
- (Not Run) Processes the points.
- Repacks them into bucketed blocks suitable for storing back to disk. This step is multi-threaded.
- (Not Run) Writes the bucketed blocks back out to disk.
Here, the Kingston DC1000M hit 2,908.5 seconds landing in the bottom quarter of drives tested.
SQL Server Performance
Each SQL Server VM is configured with two vDisks: 100GB volume for boot and a 500GB volume for the database and log files. From a system-resource perspective, we configured each VM with 16 vCPUs, 64GB of DRAM and leveraged the LSI Logic SAS SCSI controller. While our Sysbench workloads tested previously saturated the platform in both storage I/O and capacity, the SQL test is looking for latency performance.
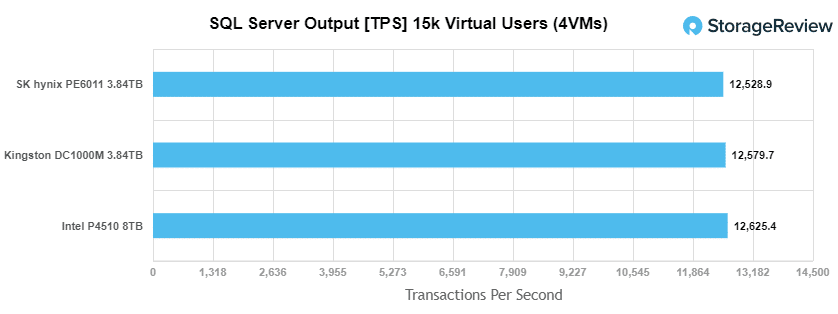
This test uses SQL Server 2014 running on Windows Server 2012 R2 guest VMs, and is stressed by Quest’s Benchmark Factory for Databases. StorageReview’s Microsoft SQL Server OLTP testing protocol employs the current draft of the Transaction Processing Performance Council’s Benchmark C (TPC-C), an online transaction-processing benchmark that simulates the activities found in complex application environments. The TPC-C benchmark comes closer than synthetic performance benchmarks to gauging the performance strengths and bottlenecks of storage infrastructure in database environments. Each instance of our SQL Server VM for this review uses a 333GB (1,500 scale) SQL Server database and measures the transactional performance and latency under a load of 15,000 virtual users.
SQL Server Testing Configuration (per VM)
- Windows Server 2012 R2
- Storage Footprint: 600GB allocated, 500GB used
- SQL Server 2014
-
- Database Size: 1,500 scale
- Virtual Client Load: 15,000
- RAM Buffer: 48GB
- Test Length: 3 hours
-
- 2.5 hours preconditioning
- 30 minutes sample period
For our SQL Server transactional benchmark, the Kingston DC1000M was able to hit 12,579.7 TPS placing it in the middle of the pack.
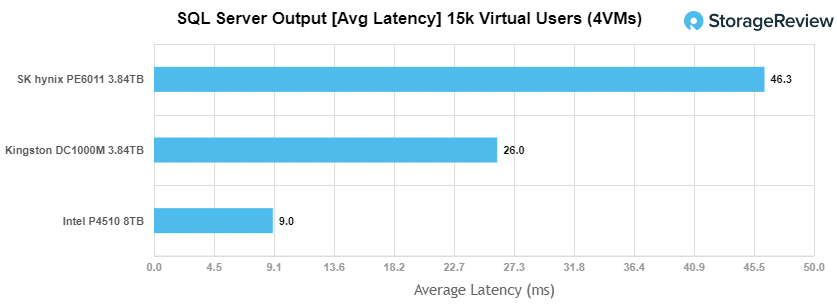
For SQL Server average latency the DC1000M had an aggregate of 26ms placing it second.
Sysbench Performance
The next application benchmark consists of a Percona MySQL OLTP database measured via SysBench. This test measures average TPS (Transactions Per Second), average latency, and average 99th percentile latency as well.
Each Sysbench VM is configured with three vDisks: one for boot (~92GB), one with the pre-built database (~447GB), and the third for the database under test (270GB). From a system-resource perspective, we configured each VM with 16 vCPUs, 60GB of DRAM and leveraged the LSI Logic SAS SCSI controller.
Sysbench Testing Configuration (per VM)
- CentOS 6.3 64-bit
- Percona XtraDB 5.5.30-rel30.1
-
- Database Tables: 100
- Database Size: 10,000,000
- Database Threads: 32
- RAM Buffer: 24GB
- Test Length: 3 hours
-
- 2 hours preconditioning 32 threads
- 1 hour 32 threads
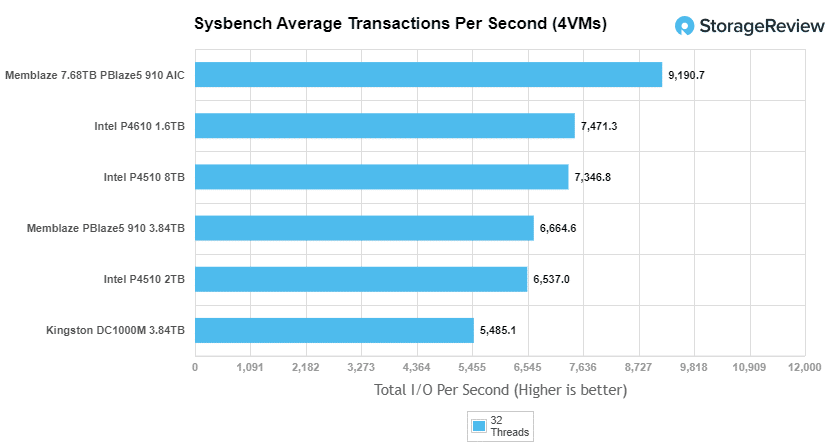
Looking at our Sysbench transactional benchmark, the Kingston DC1000M hit 5,485 TPS coming in the back of the pack tested against it.
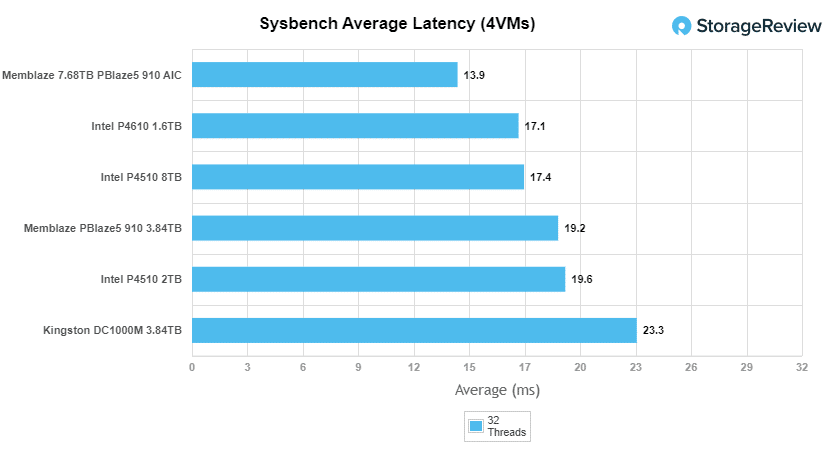
For Sysbench average latency the DC1000M came in last again with 23.3ms.
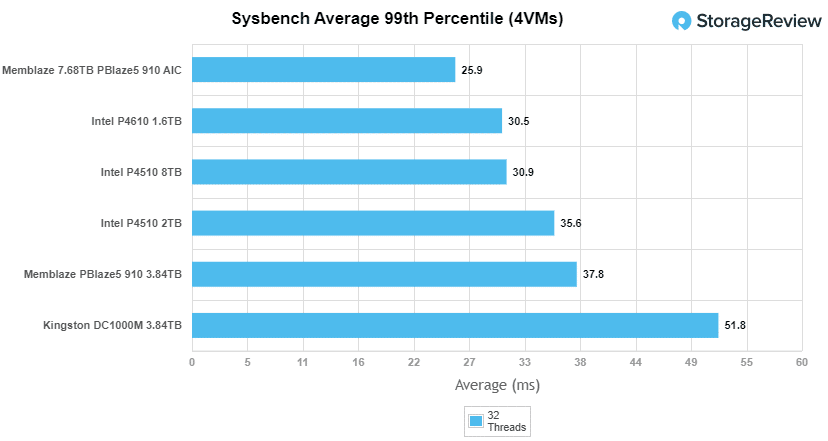
For our worst-case scenario latency (99th percentile) the DC1000M was last with 51.8ms.
VDBench Workload Analysis
When it comes to benchmarking storage devices, application testing is best, and synthetic testing comes in second place. While not a perfect representation of actual workloads, synthetic tests do help to baseline storage devices with a repeatability factor that makes it easy to do apples-to-apples comparison between competing solutions. These workloads offer a range of different testing profiles ranging from “four corners” tests, common database transfer size tests, to trace captures from different VDI environments. All of these tests leverage the common vdBench workload generator, with a scripting engine to automate and capture results over a large compute testing cluster. This allows us to repeat the same workloads across a wide range of storage devices, including flash arrays and individual storage devices. Our testing process for these benchmarks fills the entire drive surface with data, then partitions a drive section equal to 25% of the drive capacity to simulate how the drive might respond to application workloads. This is different than full entropy tests which use 100% of the drive and takes them into steady state. As a result, these figures will reflect higher-sustained write speeds.
Profiles:
- 4K Random Read: 100% Read, 128 threads, 0-120% iorate
- 4K Random Write: 100% Write, 64 threads, 0-120% iorate
- 64K Sequential Read: 100% Read, 16 threads, 0-120% iorate
- 64K Sequential Write: 100% Write, 8 threads, 0-120% iorate
- Synthetic Database: SQL and Oracle
- VDI Full Clone and Linked Clone Traces
Comparables:
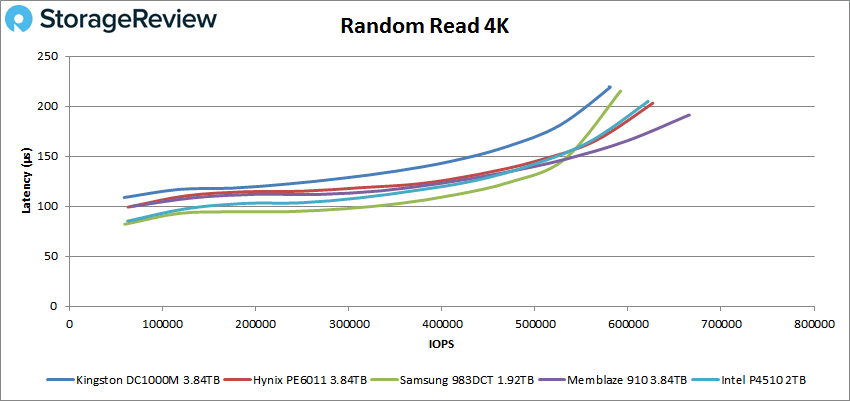
In our first VDBench Workload Analysis, Random 4K Read, the Kingston DC1000M trailed the rest of the pack with a peak performance of 580,077 IOPS at a latency of 219.3µs.
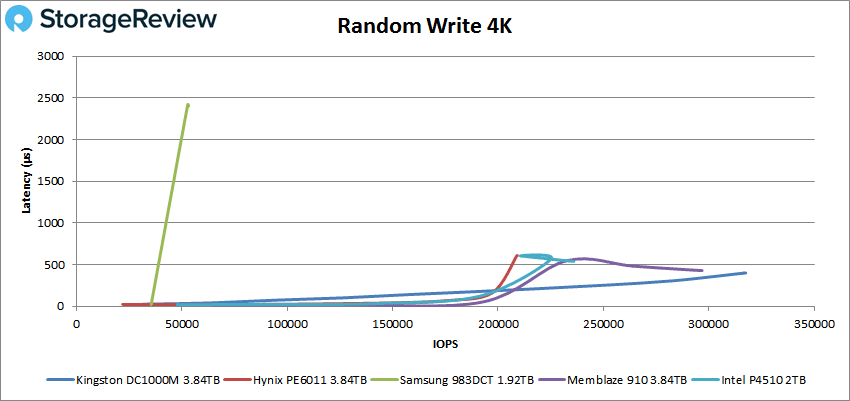
4K random write gave us showed us the opposite with the DC1000M taking the top spot with a peak performance of 317,525 IOPS at a latency of 399.9µs.
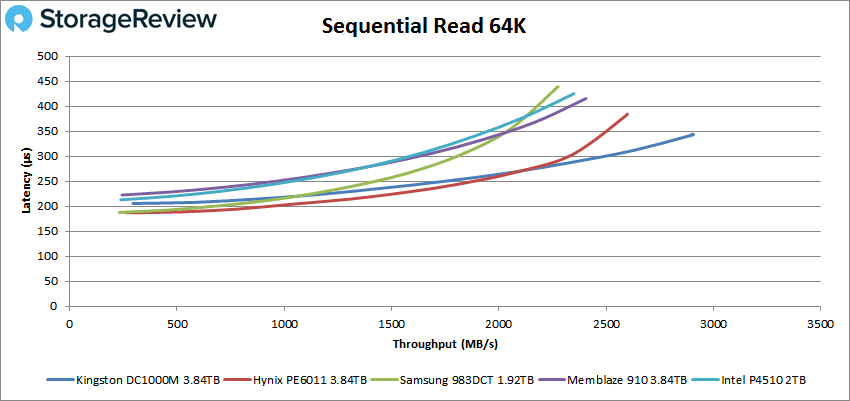
Switching over to 64k sequential workloads, the DC1000M again took the top spot in 64K read with a peak of 46,502 IOPS or 2.91GB/s at a latency of 343.3µs.
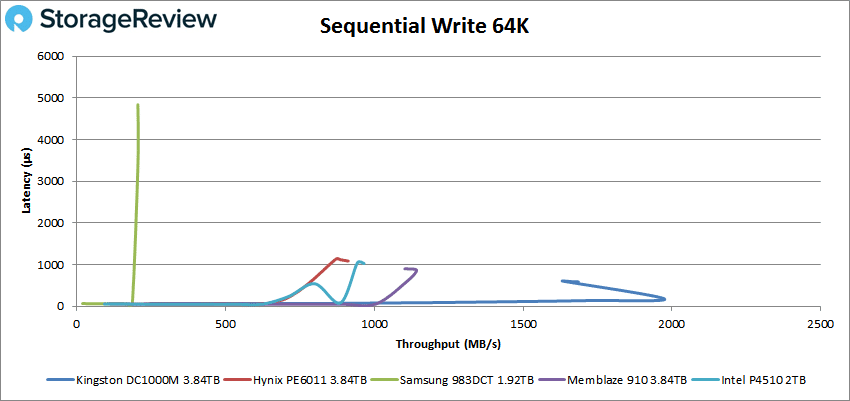
64K write saw another strong performance with the Kingston taking the top spot with 31,600 IOPS or about 2GB/s at a latency of 190µs before dropping off some.
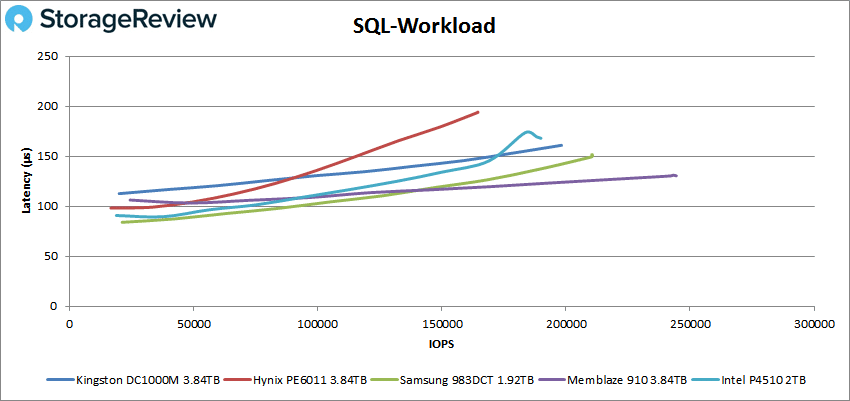
Our next set of tests are our SQL workloads: SQL, SQL 90-10, and SQL 80-20. Starting with SQL, the DC1000M landed third with a peak performance of 198,187 IOPS at a latency of 160.9µs.
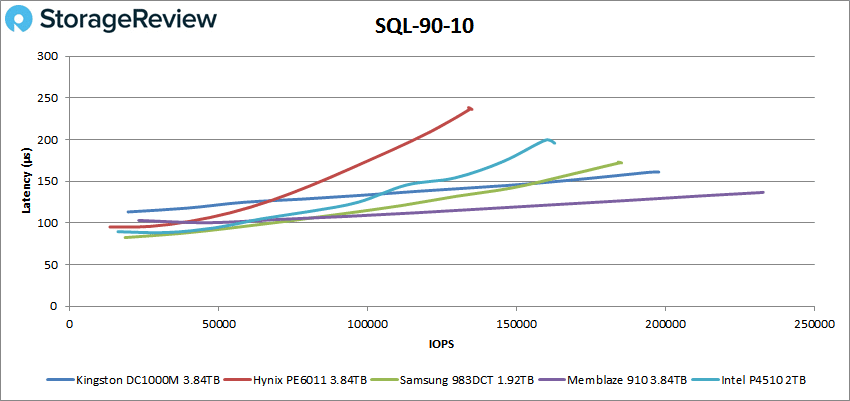
SQL 90-10 saw the new Kingston drive land second with a peak performance of 197,847 IOPS at a latency of 161.1µs.
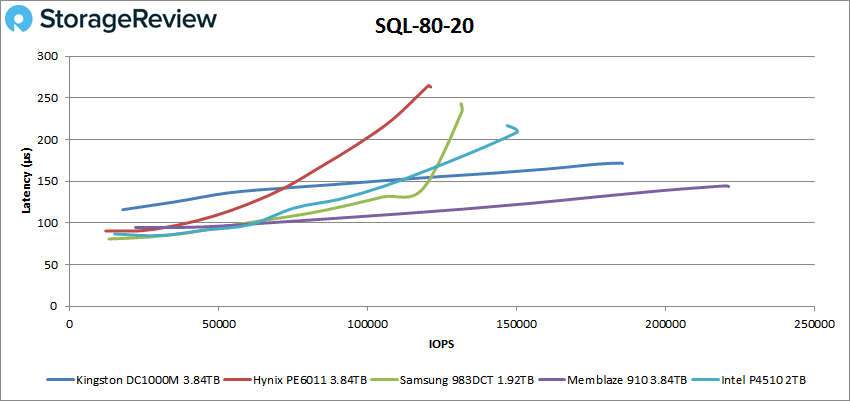
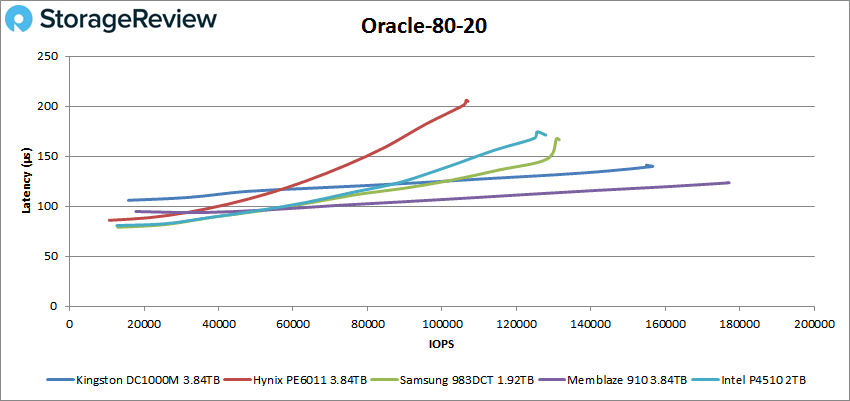
With SQL 80-20 the DC1000M again came in second with a peak of 185,634 IOPS at a latency of 171.4µs.
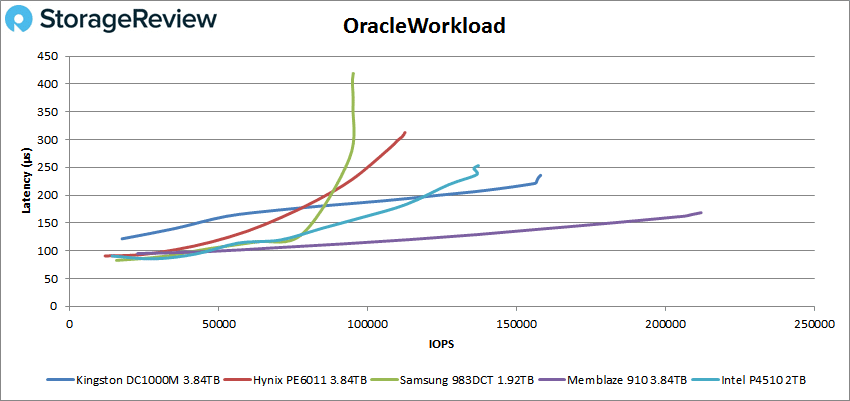
Next up are our Oracle workloads: Oracle, Oracle 90-10, and Oracle 80-20. Starting with Oracle, the DC1000M took second to the Memblaze 910 with a peak performance of 158,140 IOPS 235.9µs.
For Oracle 90-10 the Kingston tied at second with the Samsung and had a peak of 156,623 IOPS with a latency of 139.9µs.
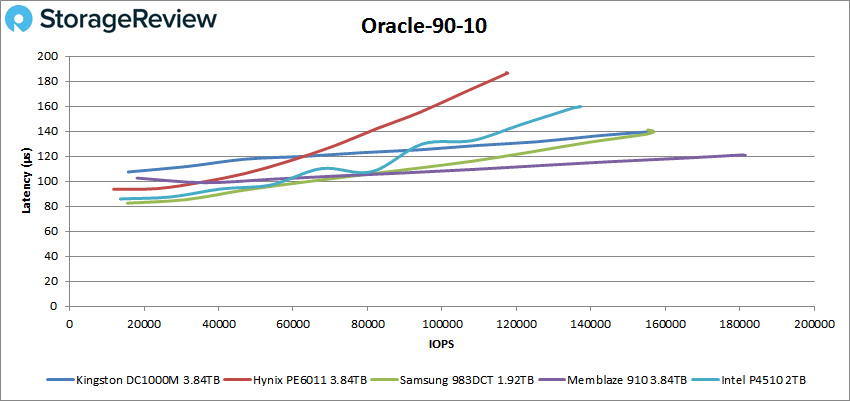
Oracle 80-20 the DC1000M kept its second place spot with a peak score of 156,528 IOPS with a latency of 139.9µs.
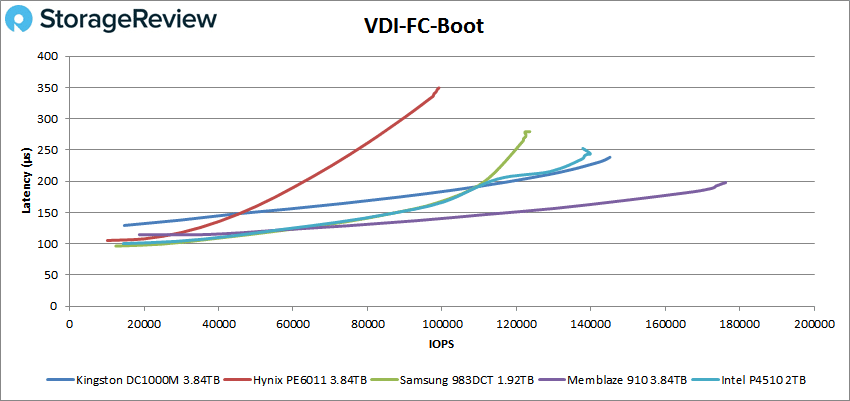
Next, we switched over to our VDI clone test, Full and Linked. For VDI Full Clone (FC) Boot, the Kingston DC1000M stayed in second place with a peak of 145,139 IOPS at a latency of 238.5µs.
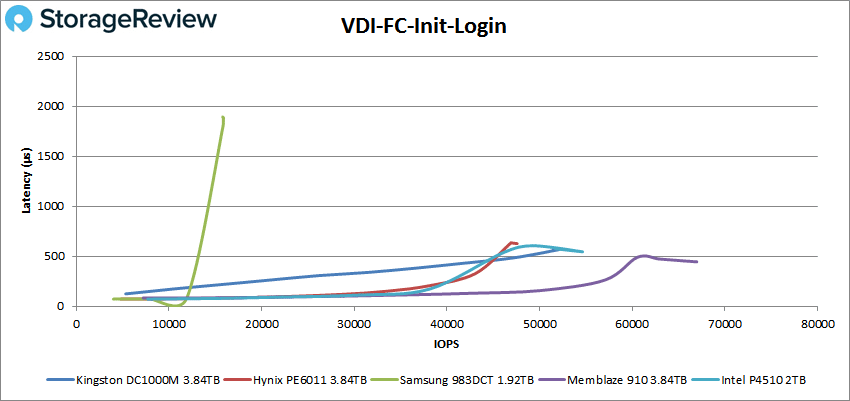
VDI FC Initial Login the DC1000M fell to third with a peak of 52,123 IOPS with 568.7µs for latency.
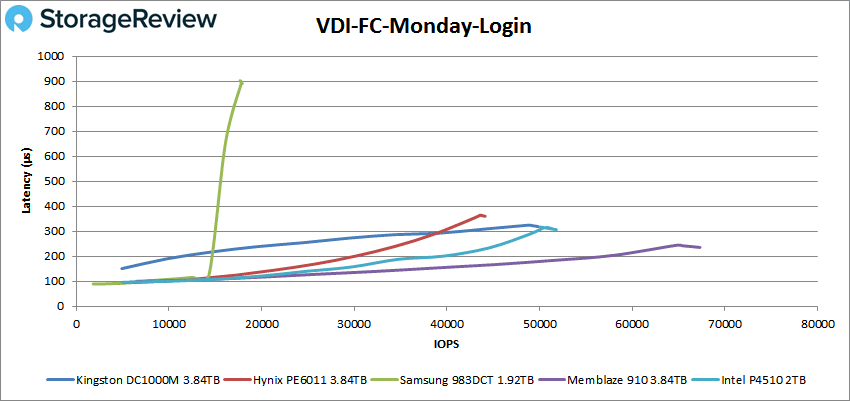
With VDI FC Monday Login the DC1000M placed third once more with a peak of 49,867 IOPS with a latency of 318.7µs.
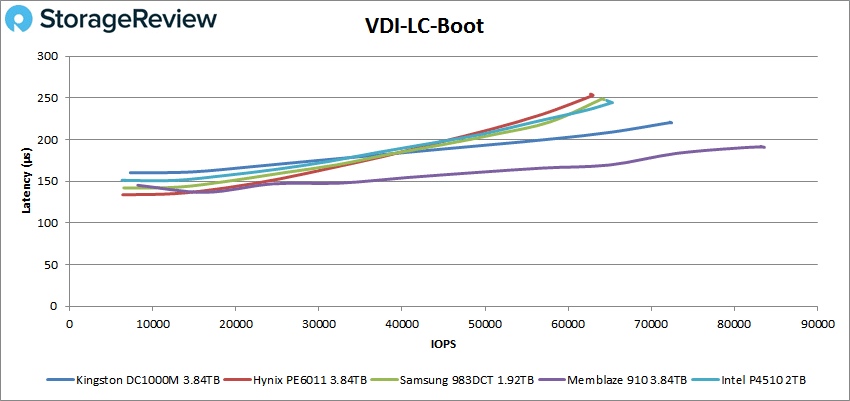
For VDI Linked Clone (LC) Boot, the DC1000M took second with a peak of 72,430 IOPS at a latency of 220.2µs.
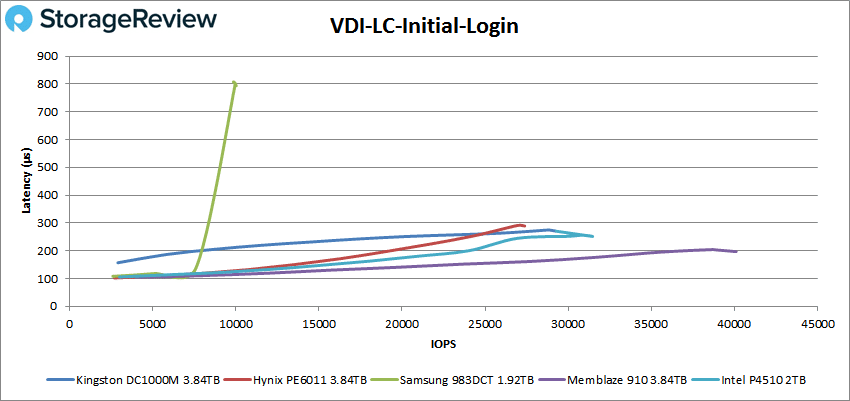
VDI LC Initial Login saw the Kingston fall to third with 29,229 IOPS with a latency of 271.3µs.
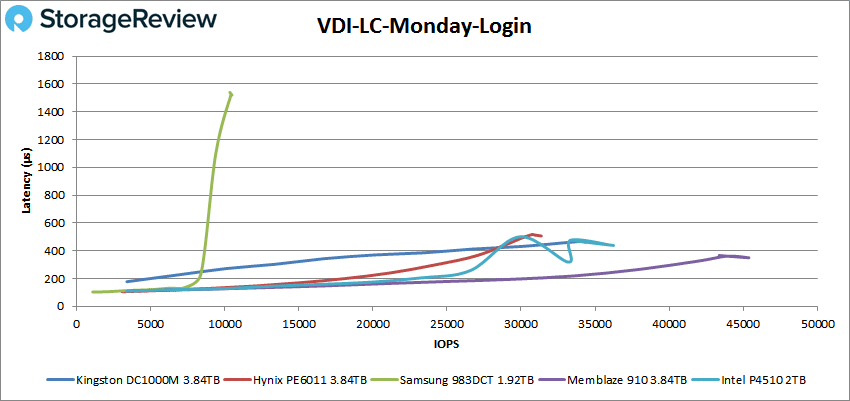
Finally with VDI LC Monday Login the DC1000M once more found itself in third with a peak performance of 34,384 IOPS at a latency of 462.8µs.
Conclusion
The Kingston DC1000M is an expansion of the company’s affordable NVMe SSDs for data centers. The drive is for mixed workload use cases and act as a replacement for SATA and SAS drives as customers move forward. The drive comes in a U.2 form factor and capacities as high as 7.68TB. The DC1000M has quoted speeds of up to 3GB/s and up to 540K IOPS and is ideal for virtualization, HPC, web hosting caching, and high-resolution media capture use cases amongst others.
For performance we looked at both our Application Workload Analysis and VDBench tests and compared the Kingston DC1000M to other drives with a similar focus. In our Applications Workload Analysis benchmarks the DC1000M did ok with SQL Server performance of 12,579 TPS and an average latency of 26ms. For Sysbench the drive placed last with 5,485 TPS, and average latency of 23.3ms, and a worst-case scenario of 51.8ms. For Houdini we saw 2,908.5 seconds placing the drive in the bottom quarter of those tested.
With VDBench, the DC100M did better overall. Highlights include 580K IOPS random 4K read (its worst placing here), 318K IOPS 4K write, 2.91GB/s 64K read, and 2GB/s 64K write. SQL saw scores of 198K IOPS, 198K IOPS for SQL 90-10, and 186K IOPS for SQL 80-20. Oracle had the drive hit 158K IOPS, 157K IOPS for Oracle 90-10, and 157K IOPS for Oracle 80-20. For our VDI clone tests the drive stayed around second or third throughout with highlights in the boot scores, 145K IOPS FC and 72K IOPS in LC.
The Kingston DC1000M offers good performance and capacity for many different use cases. This drive would have a great replacement for SATA or SAS drives where organizations are looking for a performance boost at an affordable price.
Engage with StorageReview
Newsletter | YouTube | Podcast iTunes/Spotify | Instagram | Twitter | Facebook | RSS Feed