

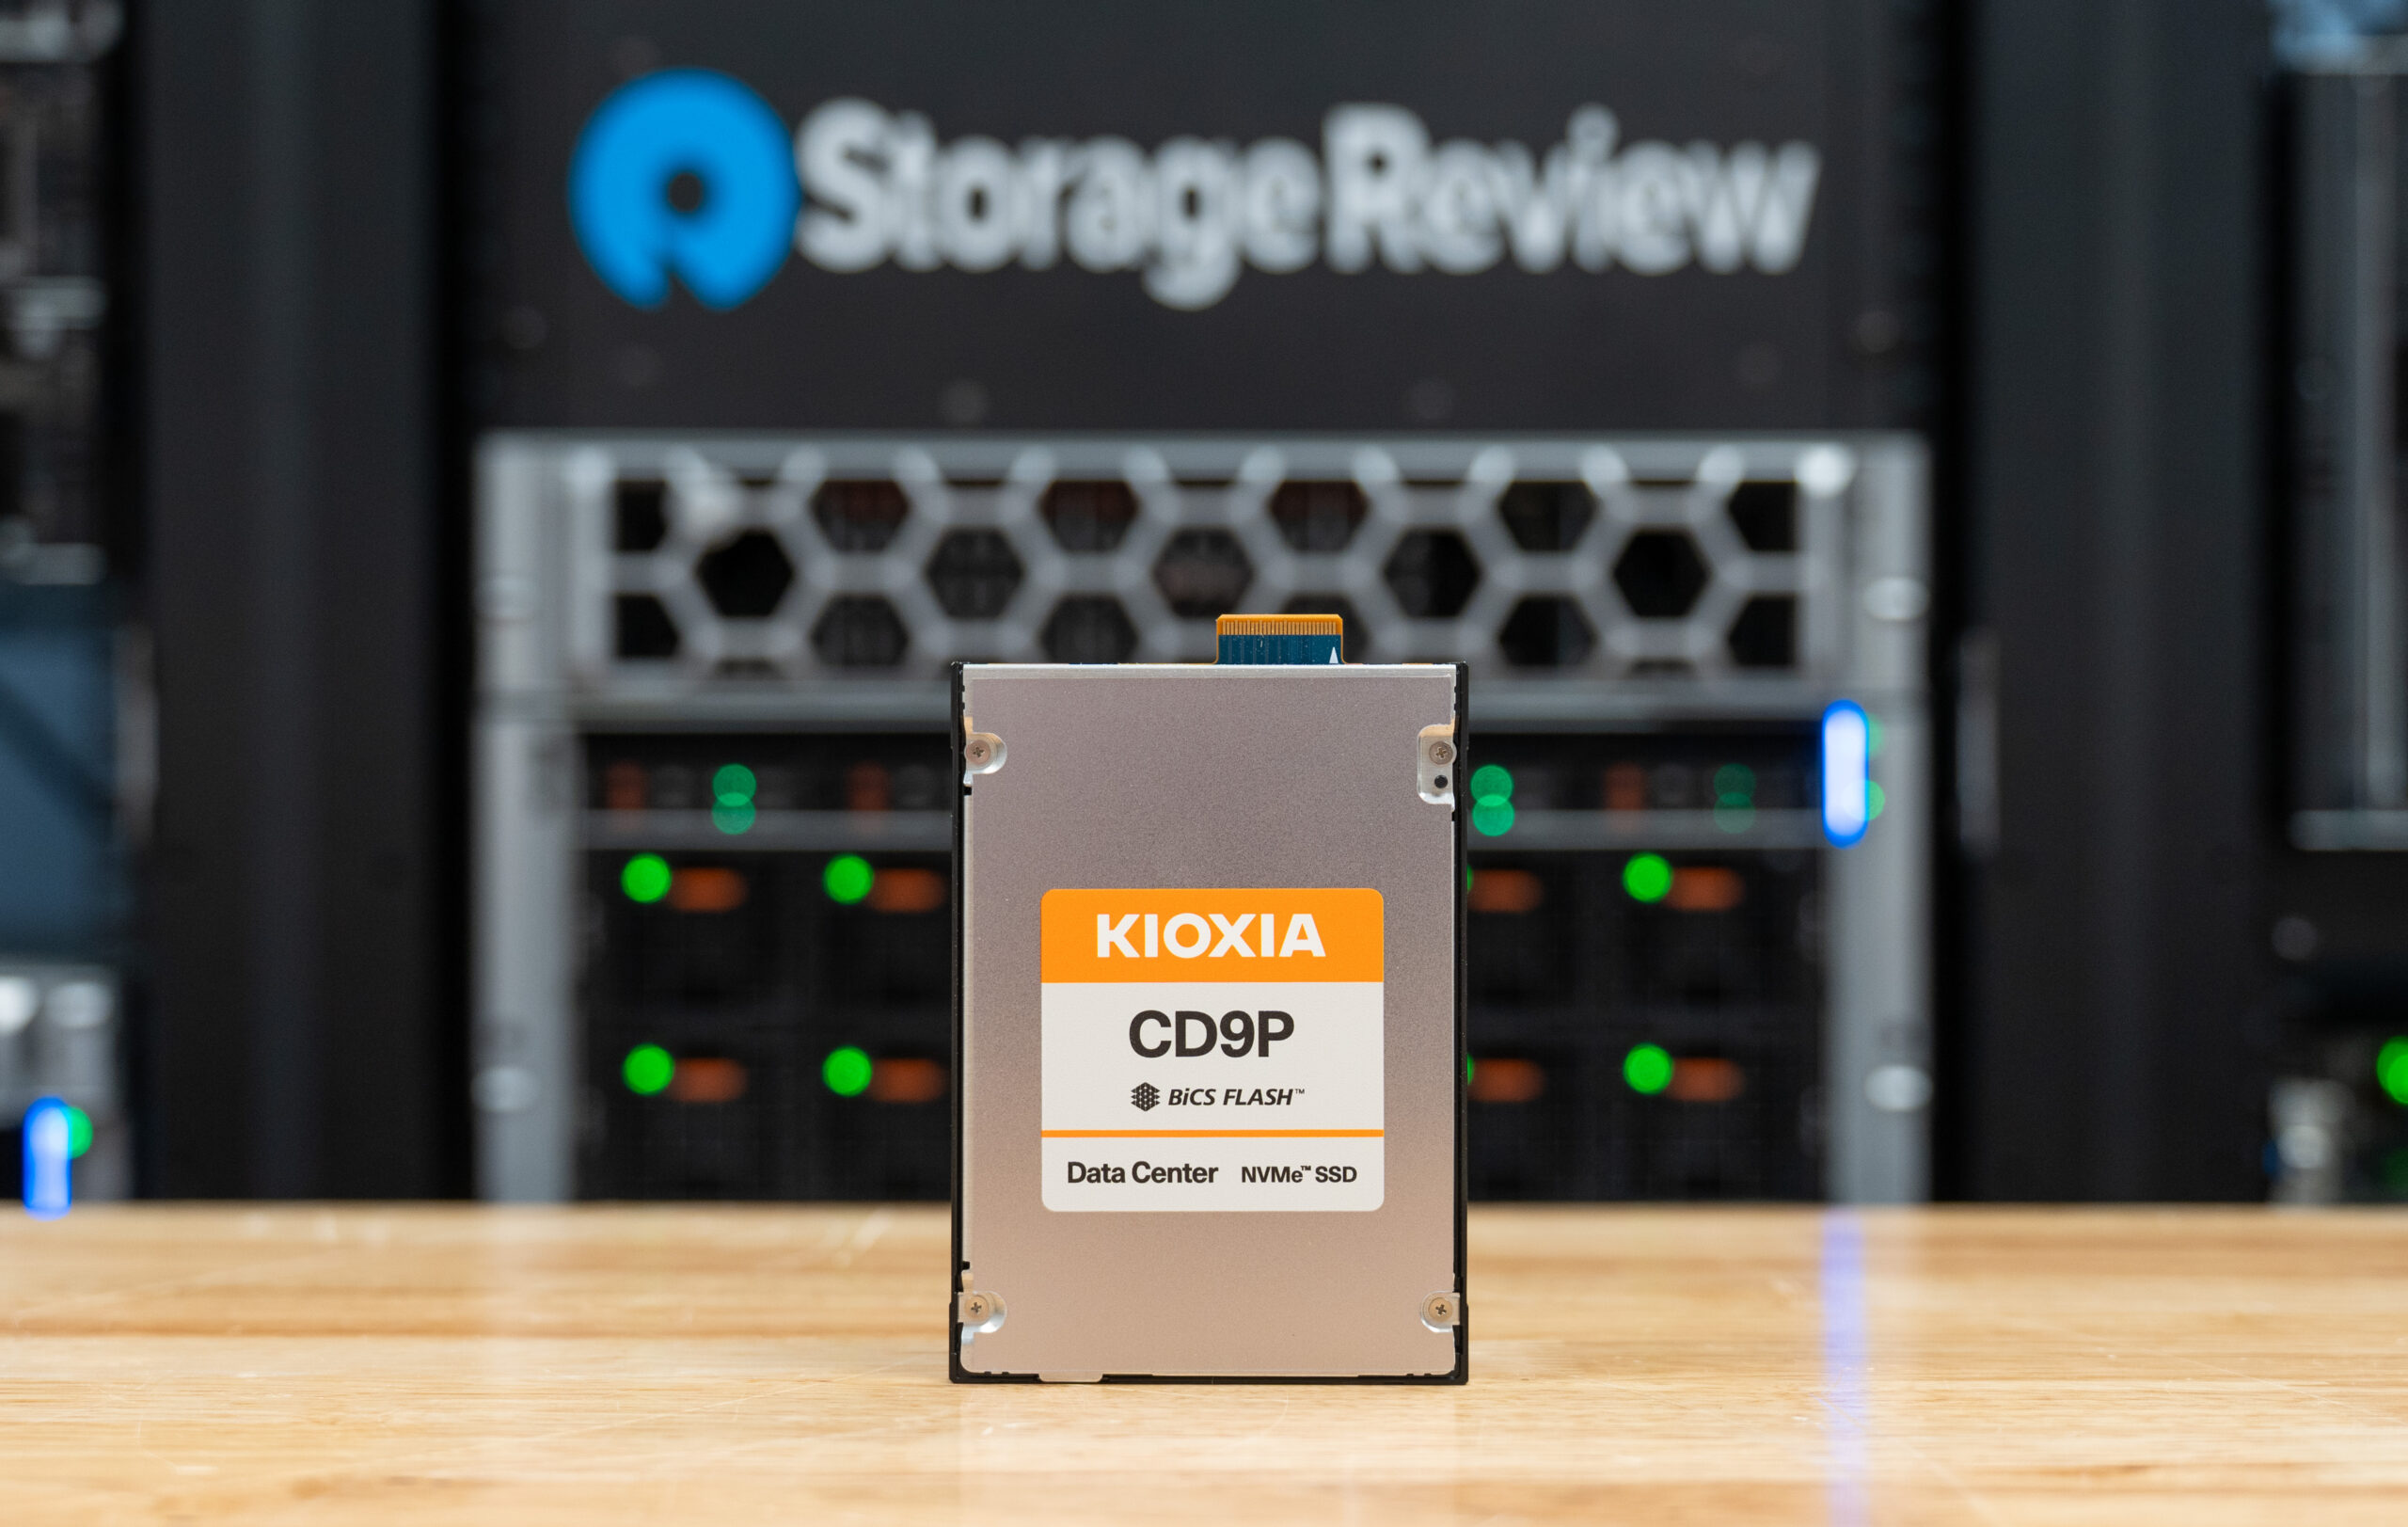
The Kioxia CD9P-R is the read-intensive arm of the company’s new data center NVMe SSD generation, and the first CD-series drive built on BiCS FLASH generation 8 TLC. The series pairs Kioxia’s own controller and firmware with PCIe 5.0 and NVMe 2.0, with rated performance reaching 14,800 MB/s sequential read and 2.6 million random read IOPS depending on capacity. E3.S models run from 1.92TB to 30.72TB, while the 2.5-inch variant extends the stack to 61.44TB. Our review unit is the 7.68TB E3.S model in SED trim (KCD9DPJE7T68).
The capacity stack has a wrinkle worth understanding before the charts. Kioxia’s published specs peak in the middle of the family, not at the top: the 7.68TB and 15.36TB models carry the line’s best sequential read rating at 14,800 MB/s and its best random write rating at 450K IOPS, while the 30.72TB flagship steps down to 13,500 MB/s and 270K IOPS. The two smallest capacities also ship on the prior BiCS generation 5 NAND rather than generation 8. In other words, the 7.68TB drive on our bench is the configuration where this platform shows its full hand, and buyers chasing maximum density at 30.72TB give some of that back, which is not uncommon.
The generational step from the CD8P is where Kioxia is making its case, and the published spec tables back it up. At 7.68TB, the outgoing CD8P-R E3.S rated at 200K random write IOPS; the CD9P-R lifts that to 450K, a 2.25x improvement. Sequential read climbs 23% from 12,000 MB/s to 14,800 MB/s, and random read moves 30% from 2 million to 2.6 million IOPS. The active power rating rises slightly, from 21W typical to 23W at this capacity, putting the CD9P-R in line with the rest of the Gen5 read-intensive class. The efficiency argument here concerns what the drive delivers within that envelope.

The fine print that defines where this drive belongs: the CD9P-R features a single-port, 1 DWPD design. There is no dual-port path for traditional enterprise storage arrays, and write-heavy workloads belong on the CD9P-V mixed-use sibling. This is a drive built for hyperscale and cloud server fleets, OLTP read tiers, content delivery, and virtualized environments where the access pattern is read-dominated, and the power budget is fixed. It checks the expected platform boxes along the way, with OCP Datacenter NVMe SSD v2.5 support (not all requirements), power loss protection, end-to-end data protection, SIE and SED security options, a 2.5 million-hour MTTF at 50°C, and a five-year warranty.
KIOXIA CD9P-R Specifications
The table below outlines the KIOXIA CD9P-R Series in the E3.S form factor across its capacity points, highlighting performance metrics, endurance ratings, power, and reliability specifications.
| KIOXIA CD9P-R Series Specifications (E3.S) | |||||
| 30.72TB | 15.36TB | 7.68TB | 3.84TB | 1.92TB | |
| Model Numbers | |||||
| SIE Model Number | KCD9XPJE30T7 | KCD9XPJE15T3 | KCD9XPJE7T68 | KCD9XPJE3T84 | KCD9XPJE1T92 |
| SED Model Number | KCD9DPJE30T7 | KCD9DPJE15T3 | KCD9DPJE7T68 | KCD9DPJE3T84 | KCD9DPJE1T92 |
| Basic Specifications | |||||
| Use Case | Read Intensive (1 Drive Write Per Day) | ||||
| Form Factor | E3.S, 7.5mm thickness | ||||
| Interface / Protocol | PCIe 5.0 x4, NVMe 2.0 | ||||
| Maximum Interface Speed | 128 GT/s (PCIe Gen5 x4) | ||||
| NAND | KIOXIA BiCS FLASH 3D TLC (Gen 8 for 7.68TB-30.72TB; Gen 5 for 1.92TB-3.84TB) | ||||
| OCP Compliance | OCP Datacenter NVMe SSD Specification v2.5 (partial) | ||||
| Security | SIE (Sanitize Instant Erase), SED (TCG Opal & Ruby SSC) | ||||
| Performance (Up To) | |||||
| Sequential Read (128KiB, MB/s) | 13,500 | 14,800 | 14,800 | 14,500 | 14,500 |
| Sequential Write (128KiB, MB/s) | 7,000 | 7,000 | 7,000 | 7,000 | 3,600 |
| Random Read (4KiB, K IOPS) | 2,600 | 2,600 | 2,600 | 2,600 | 2,000 |
| Random Write (4KiB, K IOPS) | 270 | 450 | 450 | 320 | 160 |
| Power Requirements | |||||
| Supply Voltage | 12V ±10%, 3.3V ±15% | ||||
| Power (Active) | 23W typ. | ||||
| Power (Ready/Idle) | 5W typ. | ||||
| Reliability | |||||
| MTTF | 2,500,000 hours @ 0–50°C | 2,000,000 hours @ 0–55°C | ||||
| UBER | < 1 sector per 1017 bits read | ||||
| DWPD | 1 | ||||
| Warranty | 5 Years | ||||
| Data Protection | Power Loss Protection (PLP), End-to-End Data Protection | ||||
| Dimensions | |||||
| Thickness | 7.5mm +0.2 / -0.5mm | ||||
| Width | 76mm ±0.25mm | ||||
| Length | 112.75mm ±0.4mm | ||||
| Weight | 110g max | ||||
| Environmental | |||||
| Temperature (Operating) | 0°C to 75°C | ||||
| Temperature (Non-operating) | -40°C to 85°C | ||||
| Humidity (Operating) | 5% to 95% RH | ||||
| Vibration (Operating) | 21.27 m/s² { 2.17 Grms } (5–800 Hz) | ||||
| Shock (Operating) | 9.8 km/s² { 1,000 G } (0.5 ms) | ||||
KIOXIA CD9P-R Performance

Drive Testing Platform
We use a Dell PowerEdge R760 running Ubuntu 22.04.2 LTS as our test platform for all workloads in this review. Equipped with a Serial Cables Gen5 JBOF, it offers wide compatibility with U.2, E1.S, E3.S, and M.2 SSDs. Our system configuration is outlined below:
- 2 x Intel Xeon Gold 6430 (32-Core, 2.1GHz)
- 16 x 64GB DDR5-4400
- 480GB Dell BOSS SSD
- Serial Cables Gen5 JBOF
- NVIDIA L4
Drives Compared
- Pascari X200P 7.68TB
- SanDisk SN861 7.68TB
- Solidigm PS1010 7.68TB
- Kingston DC3000ME 7.68TB
- Micron 7600 Max 6.4TB
- Micron 9550 MAX 12.8TB
- Micron 9550 Pro 7.68TB
DLIO Checkpointing Benchmark
To evaluate SSD real-world performance in AI training environments, we utilized the Data and Learning Input/Output (DLIO) benchmark tool. Developed by Argonne National Laboratory, DLIO is specifically designed to test I/O patterns in deep learning workloads. It provides insights into how storage systems handle challenges such as checkpointing, data ingestion, and model training.
The chart below illustrates how the drives handle the process across 18 checkpoints. When training machine learning models, checkpoints are essential for periodically saving the model’s state, preventing loss of progress during interruptions or power failures. This storage demand requires robust performance, especially under sustained or intensive workloads. We used DLIO benchmark version 2.0 from the August 13, 2024, release.
To ensure our benchmarking reflected real-world scenarios, we based our testing on the LLAMA 3.1 405B model architecture. We implemented checkpointing using torch.save() to capture model parameters, optimizer states, and layer states. Our setup simulated an eight-GPU system, implementing a hybrid parallelism strategy with 4-way tensor parallelism and 2-way pipeline parallel processing distributed across the eight GPUs. This configuration yielded a checkpoint size of 1,636GB, reflecting the requirements of training modern large language models.
Looking at the pass averages, the KIOXIA CD9P-R started at 464.7 seconds in Pass 1 before increasing to 575.6 seconds in Pass 2 and settling at 572.2 seconds in Pass 3. This behavior closely mirrored the majority of the comparison group, which clustered between roughly 553 and 590 seconds by the final pass. The standout outlier was the Pascari X200P, which finished substantially higher at 674.5 seconds. Overall, the CD9P-R demonstrated predictable scaling across repeated checkpoint operations and remained competitive with the mainstream enterprise Gen5 SSDs in the test.

For the DLIO Checkpoint Benchmark through checkpoint 12, the KIOXIA CD9P-R 7.68TB remained one of the more consistent drives in the comparison group. After starting at 471.4 seconds at the first checkpoint, it settled into a relatively narrow operating range of roughly 560 to 580 seconds for the remainder of the test, finishing checkpoint 12 at 569.7 seconds. The KIOXIA drive closely tracked the Solidigm PS1010, Micron 7600 MAX, and Kingston DC3000ME throughout most of the workload.
The Pascari X200P was the clear outlier, jumping sharply after checkpoint 4 and remaining well above the field, reaching nearly 690 seconds by checkpoint 12. The Micron 9550 MAX showed the lowest sustained checkpoint times during the latter half of the run, dipping as low as 531.3 seconds before ending at 569.1 seconds. While the CD9P-R was not the fastest drive at any individual checkpoint, it avoided the large swings seen from several competitors and delivered stable checkpoint performance across the full test window.

FIO Performance Benchmark
To measure the storage performance of each SSD across common industry metrics, we leverage FIO. Each drive undergoes the same testing process, which includes a preconditioning step of two full drive fills with a sequential write workload, followed by steady-state performance measurement. As each workload type being measured changes, we run another preconditioning fill of that new transfer size.
In this section, we focus on the following FIO benchmarks:
- 128K Sequential
- 64K Random
- 16K Random
- 4K Random
128K Sequential Write (IODepth 16 / NumJobs 1)
Moving to the steady-state 128K Sequential Write test at a lower IODepth of 16, the overall group ranking remained largely unchanged compared to preconditioning. The Micron 9550 Max (12.8TB) continued to lead at 10,957.9 MB/s, with the Micron 9550 Pro (7.68TB) close behind at 10,354.6 MB/s. The Kingston DC3000ME (7.68TB) held third at 8,477.4 MB/s, and the Pascari X200P (7.68TB) was right behind at 8,369.7 MB/s.
The KIOXIA CD9P-R (7.68TB) delivered 6,912.4 MB/s, landing at the back of the field. The Solidigm PS1010 (7.68TB) at 7,126.5 MB/s and the SanDisk DC SN861 (7.68TB) at 7,116.5 MB/s both trailed the mid-pack drives, but still edged out the CD9P-R and the Micron 7600 Max (6.4TB) at 6,960.6 MB/s. The KIOXIA result is consistent and predictable for a read-optimized NVMe drive.

128K Sequential Write Latency (IODepth 16 / NumJobs 1)
At an IODepth of 16 for the steady-state write test, latency dropped substantially across all drives compared to preconditioning conditions. The Micron 9550 Max (12.8TB) again led with the lowest mean latency at 182.2 µs, comfortably ahead of the Micron 9550 Pro (7.68TB) at 192.9 µs, with both drives benefiting from their higher write throughput to service IOs more efficiently.
The KIOXIA CD9P-R (7.68TB) posted 289.0 µs, the highest write latency in the group at this queue depth. The Solidigm PS1010 (7.68TB) at 280.3 µs and the SanDisk DC SN861 (7.68TB) at 280.7 µs were just below the CD9P-R, while the Micron 7600 Max (6.4TB) came in at 287.1 µs. The Kingston DC3000ME (7.68TB) and Pascari X200P (7.68TB) occupied the middle tier at 235.6 µs and 238.6 µs, respectively.

128K Sequential Read (IODepth 64 / NumJobs 1)
The 128K Sequential Read test produced a complete reversal of the write rankings, and the KIOXIA CD9P-R (7.68TB) came out as one of the top performers in the group. The CD9P-R delivered 14,235.9 MB/s, effectively tying with the Pascari X200P (7.68TB) at 14,242.1 MB/s at the top of the chart. The Solidigm PS1010 (7.68TB) at 14,163.3 MB/s, the Micron 9550 Pro (7.68TB) at 14,050.1 MB/s, and the Micron 9550 Max (12.8TB) at 14,047.5 MB/s all clustered tightly in a 200 MB/s band at the top.
The Kingston DC3000ME (7.68TB) trailed the leaders at 13,513.8 MB/s, and the SanDisk DC SN861 (7.68TB) came in at 12,631.2 MB/s. The Micron 7600 Max (6.4TB) at 11,240.5 MB/s was the only drive to fall below the 12 GB/s threshold.

128K Sequential Read latency (IODepth 64 / NumJobs 1)
The 128K Sequential Read latency results closely mirror the bandwidth outcome. The Pascari X200P (7.68TB) led with 561.4 µs, with the KIOXIA CD9P-R (7.68TB) essentially matched at 561.7 µs. The Solidigm PS1010 (7.68TB) at 564.5 µs, Micron 9550 Pro (7.68TB) at 569.0 µs, and Micron 9550 Max (12.8TB) at 569.1 µs all fell within an 8 µs window of the leader, confirming that this tier of drives is constrained by Gen5 interface bandwidth rather than internal latency.
The Kingston DC3000ME (7.68TB) followed at 591.6 µs and the SanDisk DC SN861 (7.68TB) at 633.0 µs, while the Micron 7600 Max (6.4TB) at 711.4 µs posted latency that was 26% higher than the top performers, consistent with its lower sequential read throughput.

64K Random Write
Across the full 64K Random Write sweep, the KIOXIA CD9P-R (7.68TB) delivered a consistently respectable bandwidth profile, averaging in the 3-6 GB/s range and reaching a peak of 6,906 MB/s at the highest queue depths tested (IODepth 32 / NumJobs 8). This positioned the CD9P-R in the middle of the field for 64K write throughput, clearly behind the Micron 9550 Max (12.8TB), which scaled to 10+ GB/s peaks, but ahead of the Solidigm PS1010 (7.68TB) and SanDisk DC SN861 (7.68TB), which lagged in the lower half of the chart. The Micron 7600 Max (6.4TB) tracked closely, reaching a similar ceiling and ending just above the CD9P-R.

64K Random Write Latency
The 64K Random Write latency sweep for the KIOXIA CD9P-R (7.68TB) showed us a fairly balanced drive. At low queue depths, latency was well-controlled, starting in the sub-100 µs range at IODepth 1 / NumJobs 1. As concurrency increased, latency rose gradually across the 300-700 µs range for most of the mid-depth sweep, then climbed further at peak queue depths, reaching into the low 2,000 µs range. This placed the CD9P-R in the middle of the group for most of the sweep, performing more predictably than the Solidigm PS1010 (7.68TB) and Pascari X200P (7.68TB), which had sharper spikes in the 4,000-6,000 µs range at high concurrency.
The Micron 9550 Max (12.8TB) maintained the most consistent latency across the sweep, rarely exceeding 1,700 µs even at peak depths, while the Micron 7600 Max (6.4TB) and Micron 9550 Pro (7.68TB) tracked nearby.

64K Random Read
The 64K Random Read sweep revealed one of the more distinctive benefits of the KIOXIA CD9P-R (7.68TB): exceptional performance at low queue depths. At the low end of the sweep, IODepth 1 / NumJobs 1, the CD9P-R started at approximately 1,334 MB/s, leading by a wide margin thanks to its extremely low per-IO read latency. This advantage persisted across the lower queue-depth range, as it consistently ran at or near the top.
As queue depth increased into the 8/4-32/4 range, other drives caught up and surpassed the CD9P-R. At the highest concurrency levels, the CD9P-R stabilized around 11.0-12.0 GB/s, placing it behind the Pascari X200P (7.68TB), Micron 9550 Pro (7.68TB), and Micron 9550 Max (12.8TB), which reached 13.5-14.2 GB/s.

64K Random Read Latency
The 64K Random Read latency sweep confirmed the KIOXIA CD9P-R’s (7.68TB) read latency advantage at low queue depths. From IODepth 1 / NumJobs 1 through the low-concurrency range, the CD9P-R consistently posted some of the tightest latency in the group, tracking well below most competitors and within a narrow band through mid-queue depths.
As queue depth increased beyond the 32/1-to-16/4 range, the group converged, and by the end of the sweep, all drives had climbed into the 600 µs to 1,400 µs range.

16K Random Write
Across the 16K Random Write IOPS sweep, the KIOXIA CD9P-R (7.68TB) delivered a consistent performance profile through the mid-range of the sweep. The Micron 9550 Max (12.8TB) again dominated, sustaining a highly elevated IOPS trajectory well above the field, often approaching 600-690K IOPS at higher queue depths, while the Micron 7600 Max (6.4TB) maintained strong throughput in the 400-450K range.
The CD9P-R tracked alongside the Kingston DC3000ME (7.68TB), Micron 9550 Pro (7.68TB), and SanDisk DC SN861 (7.68TB) through much of the sweep, generally ranging between 200-250K IOPS at moderate depths and scaling toward 365-440K IOPS at the highest tested concurrency (IODepth 32 / NumJobs 16). The Solidigm PS1010 (7.68TB) was the weakest performer in 16K random write, frequently trailing all other drives.

16K Random Write Latency
In the 16K Random Write latency sweep, the KIOXIA CD9P-R (7.68TB) consistently tracked in the lower-to-middle tier across most of the queue depth range. At low queue depths, the drive began under 50 µs and maintained stable, well-controlled latency through the moderate portion of the sweep. As queue depth increased into the 8/8-32/8 range, latency climbed more steeply across all drives, and the CD9P-R moved through the 500-750 µs range before peaking at approximately 1,165 µs.
The Micron 9550 Max (12.8TB) posted the most stable latency across the sweep, holding below the field at most data points. The Solidigm PS1010 (7.68TB) and Pascari X200P (7.68TB) showed the most pronounced latency spikes at high queue depths, peaking at 3,300 µs and 2,050 µs, respectively. In contrast, the CD9P-R, Micron 7600 Max (6.4TB), and Kingston DC3000ME (7.68TB) tracked more predictably through the upper concurrency range. The CD9P-R’s 16K write latency is one of the most consistent in the group under heavy mixed-parallelism loads.

16K Random Read
In the 16K Random Read IOPS sweep, the Pascari X200P (7.68TB) and Micron 9550 Max (12.8TB) posted the highest sustained read IOPS, approaching 900K at saturation. The Micron 9550 Pro (7.68TB) followed closely with similar scaling, while the Solidigm PS1010 (7.68TB) rounded out the top tier.
The KIOXIA CD9P-R (7.68TB) delivered 734.3K IOPS at its peak measured point (IODepth 32 / NumJobs 8), placing it in the upper-middle tier, ahead of the Micron 7600 Max (6.4TB) at 719.3K, Kingston DC3000ME (7.68TB) at 665.6K, and SanDisk DC SN861 (7.68TB) at 661.1K IOPS.

16K Random Read Latency
In the 16K Random Read latency sweep, the KIOXIA CD9P-R (7.68TB) showed excellent read latency across the majority of the tested queue depth range. From the low end of the sweep, the CD9P-R began at approximately 33 µs at IODepth 1 / NumJobs 1. It remained tightly grouped with the top performers through the moderate-concurrency portion of the sweep, generally staying below 100 µs.
As queue depth increased into the highest concurrency ranges, all drives saw latency climb sharply. The CD9P-R scaled to approximately 713 µs at the peak, landing behind the SanDisk DC SN861 (7.68TB) and Kingston DC3000ME (7.68TB), which exceeded 820-845 µs, while the Micron 9550 Max (12.8TB) and Micron 9550 Pro (7.68TB) maintained a lower peak latency.

4K Random Write
In the 4K Random Write IOPS sweep, the Micron 7600 Max (6.4TB) and Micron 9550 Max (12.8TB) held the top positions through most of the sweep, sustaining 1,500-1,780K IOPS at peak concurrency. The Micron 9550 Pro (7.68TB) and Pascari X200P (7.68TB) followed in the upper tier, while the Solidigm PS1010 (7.68TB) and SanDisk DC SN861 (7.68TB) traded positions in the mid-upper range.
The KIOXIA CD9P-R (7.68TB) reached 1,263.1K IOPS at IODepth 32 / NumJobs 16, placing it in the lower-middle tier for 4K random write performance.

4K Random Write Latency
The 4K Random Write latency sweep produced one of the more variable pictures in the group, and the KIOXIA CD9P-R (7.68TB) again occupied the middle ground. At low queue depths, the CD9P-R’s write latency started in the 9-13 µs range at IODepth 1, competitive but slightly above the best performers at those settings. Through the moderate portion of the sweep, the drive held in the 20-120 µs range alongside most of the group.
At the highest queue depths, the CD9P-R climbed to 200-410 µs, staying well below the Solidigm PS1010 (7.68TB), which peaked near 740 µs and showed significant volatility, and the Pascari X200P (7.68TB) at 544 µs. The Micron 9550 Max (12.8TB), Micron 7600 Max (6.4TB), and Micron 9550 Pro (7.68TB) posted the most controlled latency profiles across the full sweep.

4K Random Read
The 4K Random Read sweep delivered one of the more interesting results in our FIO tests for the KIOXIA CD9P-R (7.68TB). At the lowest queue depths, IODepth 1 / NumJobs 1 and IODepth 2 / NumJobs 1, the CD9P-R separated itself clearly from the field, producing approximately 32.3K IOPS (126 MB/s). As concurrency increased, the rest of the group caught up, and by the peak of the sweep, the rankings shifted. The SanDisk DC SN861 (7.68TB) led in concurrency with 2,555.6K IOPS. At the same time, the KIOXIA CD9P-R reached 2,165.0K IOPS at IODepth 32 / NumJobs 16, effectively tying with the Micron 9550 Max (12.8TB) at 2,164.8K IOPS for second place in the group. The Solidigm PS1010 (7.68TB) and Pascari X200P (7.68TB) followed, with the Micron 7600 Max (6.4TB) and Kingston DC3000ME (7.68TB) at the lower end.

4K Random Read Latency
The 4K Random Read latency sweep confirmed what the IOPS chart suggested: the KIOXIA CD9P-R (7.68TB) has the lowest measured read latency at low queue depths among the drives we tested in the comparison group. Starting at approximately 30 µs with IODepth 1 / NumJobs 1, the CD9P-R had nearly half the latency of most competing drives, clustered in the 60-90 µs range at the same data point. Through the moderate portion of the sweep, the CD9P-R maintained its latency lead, tracking below the group through IODepth 8 and 16 before converging with the pack as concurrency climbed. At the highest tested queue depths, all drives moved into the 120-275 µs range, with the SanDisk DC SN861 (7.68TB) posting the highest latency at roughly 200 µs. The KIOXIA CD9P-R ended the sweep at approximately 236 µs, putting it midway in the group.

GPU Direct Storage
One of the tests we conducted on this testbench was the Magnum IO GPU Direct Storage (GDS) test. GDS is a feature developed by NVIDIA that allows GPUs to bypass the CPU when accessing data stored on NVMe drives or other high-speed storage devices. Instead of routing data through the CPU and system memory, GDS enables direct communication between the GPU and the storage device, significantly reducing latency and improving data throughput.
How GPU Direct Storage Works
Traditionally, when a GPU processes data stored on an NVMe drive, the data must first travel through the CPU and system memory before reaching the GPU. This process introduces bottlenecks, as the CPU acts as an intermediary, adding latency and consuming valuable system resources. GPU Direct Storage eliminates this inefficiency by enabling the GPU to access data directly from the storage device via the PCIe bus. This direct path reduces data-movement overhead, enabling faster, more efficient data transfers.
AI workloads, especially those involving deep learning, are highly data-intensive. Training large neural networks requires processing terabytes of data, and any delay in data transfer can lead to underutilized GPUs and longer training times. GPU Direct Storage addresses this challenge by ensuring that data is delivered to the GPU as quickly as possible, minimizing idle time and maximizing computational efficiency.
In addition, GDS is particularly beneficial for workloads that involve streaming large datasets, such as video processing, natural language processing, or real-time inference. By reducing the reliance on the CPU, GDS accelerates data movement and frees up CPU resources for other tasks, further enhancing overall system performance.
GDSIO Sequential Read Throughput
The GDSIO Sequential Read Throughput sweep highlighted the strong read performance of the KIOXIA CD9P-R (7.68TB). Across all three block size segments, the CD9P-R emerged as the highest-throughput drive at most thread counts.
In the 16K block-size segment, the CD9P-R opened at approximately 0.3 GiB/s on 16K/1 thread, starting behind most of the field. Drives like the Pascari X200P (7.68TB) and Micron 7600 Max (6.4TB) entered the segment at roughly 0.55-0.6 GiB/s on a single thread. As the thread count increased, the CD9P-R scaled aggressively, pulling ahead of the group through the mid-range. By 16K/16 it had overtaken most competitors, and by 16K/64 it reached approximately 2.0 GiB/s, the highest throughput in the group at that point. At 16K/128, the CD9P-R held at roughly 1.9 GiB/s and remained among the top performers as several other drives plateaued or declined. The CD9P-R’s 16K read throughput advantage is a product of how efficiently it scales with thread count, not single-stream dominance.
Moving into the 128K block-size segment, the CD9P-R opened at approximately 1.6 GiB/s at 128K/1, near the top of the group at that thread count, alongside the SanDisk DC SN861 (7.68TB). It scaled cleanly through the moderate thread range, reaching approximately 3.9 GiB/s at 128K/8, the highest throughput in the group at that point, where most competitors were still in the 1.7 to 2.0 GiB/s range. Through 128K/16 and 128K/32, the CD9P-R continued leading the field as other drives scaled up. By 128K/64 and 128K/128, the Micron 9550 Pro (7.68TB) and Micron 9550 Max (12.8TB) caught and passed the CD9P-R, reaching approximately 5.2 to 5.3 GiB/s, while the CD9P-R peaked at approximately 5.1 GiB/s and then pulled back to roughly 4.8 GiB/s at 128K/128.
In the 1M block-size segment, the CD9P-R opened at approximately 3.9 GiB/s at 1M/1 and scaled steadily with each subsequent thread count. At 1M/128, it reached approximately 6.2 GiB/s, the highest peak read throughput in the comparison group. The Pascari X200P (7.68TB) and Micron 9550 Max (12.8TB) were close behind at approximately 6.1 GiB/s each, followed by the Solidigm PS1010 (7.68TB) and Micron 9550 Pro (7.68TB) at roughly 6.0 GiB/s. The Kingston DC3000ME (7.68TB) reached approximately 5.9 GiB/s, while the Micron 7600 Max (6.4TB) was the clear laggard at approximately 5.6 GiB/s.

GDSIO Sequential Read Latency
The GDSIO Sequential Read Latency chart showed that all eight drives followed nearly identical trajectories throughout the full sweep. Latency values are dominated by block size and thread count rather than drive-specific characteristics, making this chart less differentiating than the throughput and IOPS results.
At the single-thread baseline (16K block, 1 thread), the CD9P-R posted approximately 44 µs, placing it in the middle of the group. Faster drives at this configuration included the Pascari X200P (7.68TB) at approximately 26 µs, the SanDisk DC SN861 (7.68TB) at approximately 26 µs, and the Micron 7600 Max (6.4TB) at approximately 27 µs. At the other end, the Kingston DC3000ME (7.68TB) posted approximately 83 µs, and the Solidigm PS1010 (7.68TB) approximately 71 µs, by far the widest single-thread read latency outliers in the group.
Through the rest of the sweep, the lines converged. All drives reached the 20,000-22,000 µs range by 1M/128, with the CD9P-R at approximately 20.3 ms landing in the lower portion of the group, consistent with its higher throughput at that configuration.

GDSIO Sequential Write Throughput
The GDSIO Sequential Write Throughput sweep revealed notable differences across the group.
The Solidigm PS1010 (7.68TB) exhibited a dramatic collapse in write throughput at high thread counts in the 128K block-size segment. After delivering a competitive 3.9 GiB/s at 128K/32, the drive fell sharply to approximately 2.5 GiB/s at 128K/64 and then to just 1.6 GiB/s at 128K/128, less than half the throughput of most competing drives at that configuration. The degradation continued into the 1M segment, where the drive’s peak reached only 4.2 GiB/s with moderate thread counts, then declined again at the high end. This sustained collapse under heavy multi-thread write load stands out as the most significant anomaly in the dataset. The Micron 9550 Max (12.8TB) also showed a sharp throughput drop in the 1M segment, falling from approximately 4.7 GiB/s at 1M/32 to roughly 2.2 GiB/s at 1M/64 before a partial recovery at 1M/128.
In the 16K block-size segment, all drives tracked closely within the 0.6 to 1.5 GiB/s range, with differences of only a few tenths of GiB/s across most thread counts. The CD9P-R opened at approximately 0.7 GiB/s at 16K/1, scaled to approximately 1.5 GiB/s at 16K/32, and then leveled off. The Micron 9550 Max (12.8TB) was the outlier, dropping abruptly to approximately 0.7 GiB/s at 16K/128 while the rest of the group held in the 1.2 to 1.4 GiB/s range.
In the 128K segment, the CD9P-R was among the strongest performers at low thread counts. At 128K/1, it entered at approximately 2.7 GiB/s near the top of the group, and scaled to approximately 4.7 GiB/s at 128K/8, the highest in the group at that point. From 128K/16 onward, the Micron 9550 Pro (7.68TB) and Micron 9550 Max (12.8TB) scaled past the CD9P-R, reaching approximately 5.1 to 5.3 GiB/s at their respective peaks. The CD9P-R held at roughly 4.1-4.5 GiB/s for the remainder of the 128K segment.
In the 1M-block-size segment, the CD9P-R entered the segment at approximately 4.9 GiB/s at 1M/1, the highest throughput in the group at that single-thread configuration. Still, it remained essentially flat at approximately 4.3-4.4 GiB/s across all subsequent thread counts, rather than continuing to scale. Most other drives used additional threads to climb further: the Micron 9550 Pro (7.68TB), Micron 7600 Max (6.4TB), and Pascari X200P (7.68TB) all scaled past the CD9P-R at 1M/4 and higher, reaching peak throughput of approximately 5.2 to 5.7 GiB/s. The CD9P-R’s peak write throughput of 4.9 GiB/s ranked fifth among the eight drives, behind the Micron 9550 Max at 5.69 GiB/s, Micron 9550 Pro at 5.54 GiB/s, Micron 7600 Max at 5.44 GiB/s, and Pascari X200P at 5.41 GiB/s.

GDSIO Sequential Write Latency
In the 16K segment, all drives tracked closely at low thread counts. At 16K/1, the CD9P-R posted approximately 21 µs, the lowest write latency in the group at that configuration, just below the Solidigm PS1010 (7.68TB) at approximately 22 µs. The Pascari X200P (7.68TB) followed at approximately 25 µs, while the Micron 9550 Max (12.8TB) and Micron 7600 Max (6.4TB) both came in around 30 µs. At 16K/128, the Micron 9550 Max spiked to approximately 2,500 µs, the highest write latency in the group at that configuration, while the CD9P-R held at approximately 1,500 µs and remained among the lower values in the group.
In the 128K segment, the Solidigm PS1010’s throughput collapse appeared in the latency chart as a sharp spike to approximately 9,700 µs at 128K/64, the most visible anomaly in that portion of the sweep. The CD9P-R tracked with the main group throughout the 128K segment, remaining in the 1,900 to 3,800 µs range across 128K/64 and 128K/128.
In the 1M segment, two drives showed elevated latency spikes at 1M/64 consistent with their throughput degradation at that configuration. The Micron 9550 Max (12.8TB) and Micron 9550 Pro (7.68TB) each reached approximately 27,000-28,000 µs at 1M/64, then climbed further at 1M/128. The CD9P-R reached approximately 14,500 µs at 1M/64, reflecting its more stable write throughput in that configuration, and ended the sweep at approximately 29,100 µs at 1M/128. The Pascari X200P (7.68TB) delivered the lowest write latency at 1M/128 at approximately 25,000 µs. The highest values at 1M/128 were observed for the Micron 9550 Pro at approximately 44,900 µs and the Solidigm PS1010 at approximately 40,700 µs, with the Micron 7600 Max following at approximately 36,000 µs.

Conclusion
The KIOXIA CD9P-R E3.S 7.68TB does exactly what a read-intensive drive should, and the test data tracks that brief from start to finish. Sequential reads landed near the top of the group at 14,235.9 MB/s in our 128K test, effectively tying the Pascari X200P, and the drive’s real signature showed up at low queue depths: roughly 30 µs of 4K random read latency at QD1, close to half the 60 to 90 µs posted by most of the field. That low-latency read behavior carried over to GPU Direct Storage, where the CD9P-R scaled cleanly with thread count and achieved the group’s highest 1M read throughput of approximately 6.2 GiB/s.

The trade-offs are just as clear and align with the drive’s 1 DWPD design rather than working against it. Write performance sat mid-pack, with 128K sequential writes of 6,912.4 MB/s, landing at the back of the group, and GDSIO sequential write throughput peaking at 4.9 GiB/s, placing fifth among the eight drives. The Micron 9550 family led those write workloads in both throughput and latency. None of that is a knock on the CD9P-R; it is a read-intensive SSD, and buyers who need sustained write performance should be looking at the mixed-use CD9P-V instead.
Consistency under load is the other part of the story. In DLIO checkpointing against the LLAMA 3.1 405B profile, the CD9P-R settled around 572 seconds per pass and stayed inside the 553 to 590 second band that defined the mainstream Gen5 field, avoiding the swings that pushed the Pascari X200P out to 674.5 seconds. The platform also scales well beyond our sample: the CD9P-R family runs to 30.72TB in E3.S and 61.44TB in the 2.5-inch form factor on the same architecture, which lets a single qualification cover everything from performance compute nodes to high-density read tiers.
For cloud fleets, AI data pipelines, content delivery, and virtualized read tiers with read-dominated access patterns, the CD9P-R is an easy drive to recommend. It pairs top-tier Gen5 read throughput with the lowest low-QD read latency in our comparison group and a deep capacity stack, and it holds steady under sustained load.


 Amazon