

Lenovo’s ThinkPad P16 Gen 3 is a high-end mobile workstation built around Intel’s Core Ultra 9 275HX and NVIDIA’s RTX PRO 5000, paired with a 16-inch 3200 x 2000 Tandem OLED touchscreen. It is a 5.6-pound workstation-replacement system built for users who rely on GPU acceleration, high-core-count CPUs, large memory pools, and PCIe Gen5 storage, all of which are ideal for demanding professional workflows. This makes it ideal for engineers working in CAD and simulation, visualization specialists, AI developers running local inference pipelines, and content creators dealing with high-resolution media.
The Core Ultra 9 275HX brings 24 cores to the P16 Gen 3, split into eight Performance cores clocking up to 5.4 GHz and 16 efficiency cores clocking up to 4.6 GHz, backed by 36 MB of L3 cache. The addition of Intel’s AI Boost NPU, rated at 13 TOPS, introduces another layer of acceleration for AI-assisted software, enabling workload distribution across CPU, GPU, and NPU resources.
The system ships with 32 GB of DDR5-5600 in a 2 x 16 GB configuration across four SO-DIMM slots, supporting expansion up to 192 GB, which is more than enough for simulation workloads, large assemblies, and virtualized development environments. Storage consists of a 1 TB M.2 NVMe SSD installed in a PCIe 5.0 x4 slot, with two additional PCIe 4.0 x4 M.2 2280 slots available.
For graphics, the P16 Gen 3 is powered by the mobile version of the NVIDIA RTX PRO 5000 based on the Blackwell 2.0 (GB203) architecture, built on TSMC’s 5nm 4N process. The chip packs 45.6 billion transistors into a 378 mm² die and has a 95W TDP. It features 24GB of GDDR7 memory on a 256-bit interface, delivering 896GB/s of bandwidth at an effective 28 Gbps. The base clock is rated at 1095 MHz, with a boost up to 1740 MHz, and it connects via PCIe 5.0 x16. For a mobile workstation, 24GB of VRAM is fairly substantial, especially in rendering, simulation, and AI-assisted workflows where memory limits often define project size.
The GPU includes 10,496 shading units across 82 streaming multiprocessors, along with 328 Tensor Cores and 82 RT cores. L1 cache is provisioned at 128 KB per SM, backed by a sizable 64 MB L2 cache. Theoretical compute throughput is rated at 36.53 TFLOPS for FP32 and FP16, with 570.7 GFLOPS for FP64. API support spans DirectX 12 Ultimate, Shader Model 6.8, OpenGL 4.6, Vulkan 1.4, OpenCL 3.0, and CUDA 12.0, aligning it with current professional rendering engines, simulation platforms, and CUDA-driven compute tools.
For connectivity and I/O, the big highlight is its two Thunderbolt 5 ports (up to 80 Gb/s) and a Thunderbolt 4 port (40 Gb/s). This will make it easy for high-speed external storage arrays, multi-display docking setups, and future high-bandwidth peripherals. HDMI 2.1 offers direct display output, and the inclusion of an SD Express card reader is great for media workflows. On the networking side, it is equipped with Wi-Fi 7 (2×2 MU-MIMO) and a 2.5 GbE RJ45 port.
Lenovo’s ThinkPad P16 Gen 3 Specifications
| Specification | Lenovo ThinkPad P16 Gen 3 |
|---|---|
| Performance | |
| Processor | Intel Core Ultra 9 275HX |
| CPU | 24-Core: 2.7 to 5.4 GHz Performance (8 Cores) 2.1 to 4.6 GHz Efficiency (16 Cores) |
| Dedicated AI Cores | Yes: 13 TOPS |
| L3 Cache | 36 MB |
| GPU | NVIDIA RTX PRO 5000 with 24 GB GDDR7 VRAM |
| Installed RAM | 32 GB |
| RAM Type | 5600 MT/s DDR5 |
| RAM Configuration / Capacity | 2x User-Replaceable 16 GB Module / 4 Slots Supporting up to 192 GB (SO-DIMM) |
| vPro Support | No |
| Display | |
| Panel Type | OLED |
| Size | 16″ |
| Aspect Ratio | 16:10 |
| Native Resolution | 3200 x 2000 |
| Touchscreen | Yes |
| Finish | Anti-Glare |
| Maximum Brightness | 600 nits/cd/m2 |
| Color Gamut | 100% DCI-P3 |
| Refresh Rate | 120 Hz |
| Variable Refresh Technology | Variable Refresh Rate (VRR) |
| Storage and Expansion | |
| Total Installed Storage | 1 TB |
| Storage Drive Type | 1x 1 TB / M.2 NVMe SSD |
| Storage Expansion | 1x M.2 Slot 2280 (PCIe 5.0 x4) [Occupied] 2x M.2 Slot 2280 (PCIe 4.0 x4) [Available] |
| Inputs / Outputs | |
| Inputs/Outputs | 2x USB-C (Thunderbolt 5) / Supports Power Delivery 1x USB-C (Thunderbolt 4) / Supports Power Delivery 1x USB-A 3.1/3.2 Gen 2 / Supports Power Delivery 1x USB-A 3.1/3.2 Gen 2 |
| Display I/O | 1x HDMI 2.1 Output |
| Audio I/O | 1x 1/8″ / 3.5 mm Headphone/Microphone Input/Output |
| Network I/O | 1x RJ45 (2.5 GbE) |
| Built-In Speakers | Yes: 2x 2 W |
| Built-In Microphones | Yes: 2 |
| Media/Memory Card Slot | Single Slot: SD (Unspecified Type) |
| Communications | |
| Wi-Fi | Wi-Fi 7 (802.11be) with MU-MIMO Support (2 x 2) |
| Bluetooth | Bluetooth 5.4 |
| Cellular Support | No |
| GPS | No |
| Webcam | Yes: User-Facing 5 MP |
| Battery | |
| Battery Chemistry | Lithium-Ion Polymer (LiPo) |
| Capacity | 99.9 Wh |
| Keyboard & Mouse | |
| Keyboard | Built-In Full-Size Keyboard with Backlight |
| Pointing Device | TouchPad |
| General | |
| Security | Dedicated Hardware TPM Security Chip, Facial Recognition, Fingerprint Reader, Kensington Lock Slot, Webcam Blocker |
| Power Supply | 180 W with USB-C |
| Input Power | 100 to 240 VAC, 50 / 60 Hz |
| Certifications | ENERGY STAR 9.0, EPEAT Gold, RoHS, TCO Certified Gen 10 |
| Dimensions | 14.25 x 9.92 x 1.17″ / 36.2 x 25.2 x 2.97 cm |
| Weight | 5.6 lb / 2.5 kg |
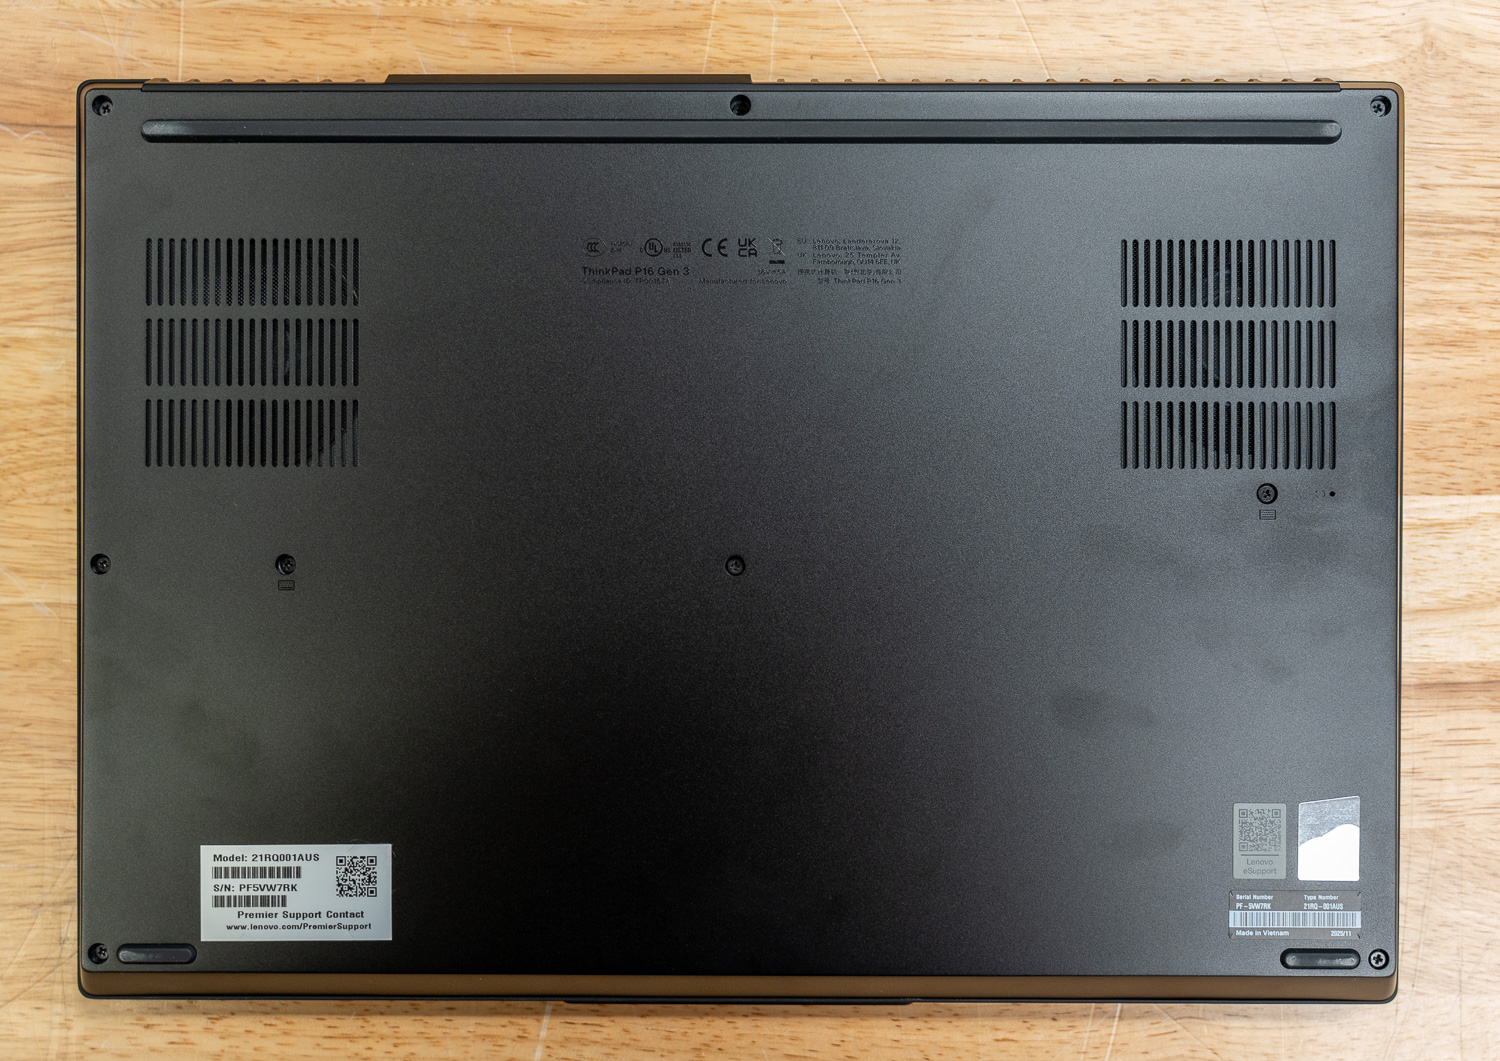
Lenovo ThinkPad P16 Gen 3 Build and Design
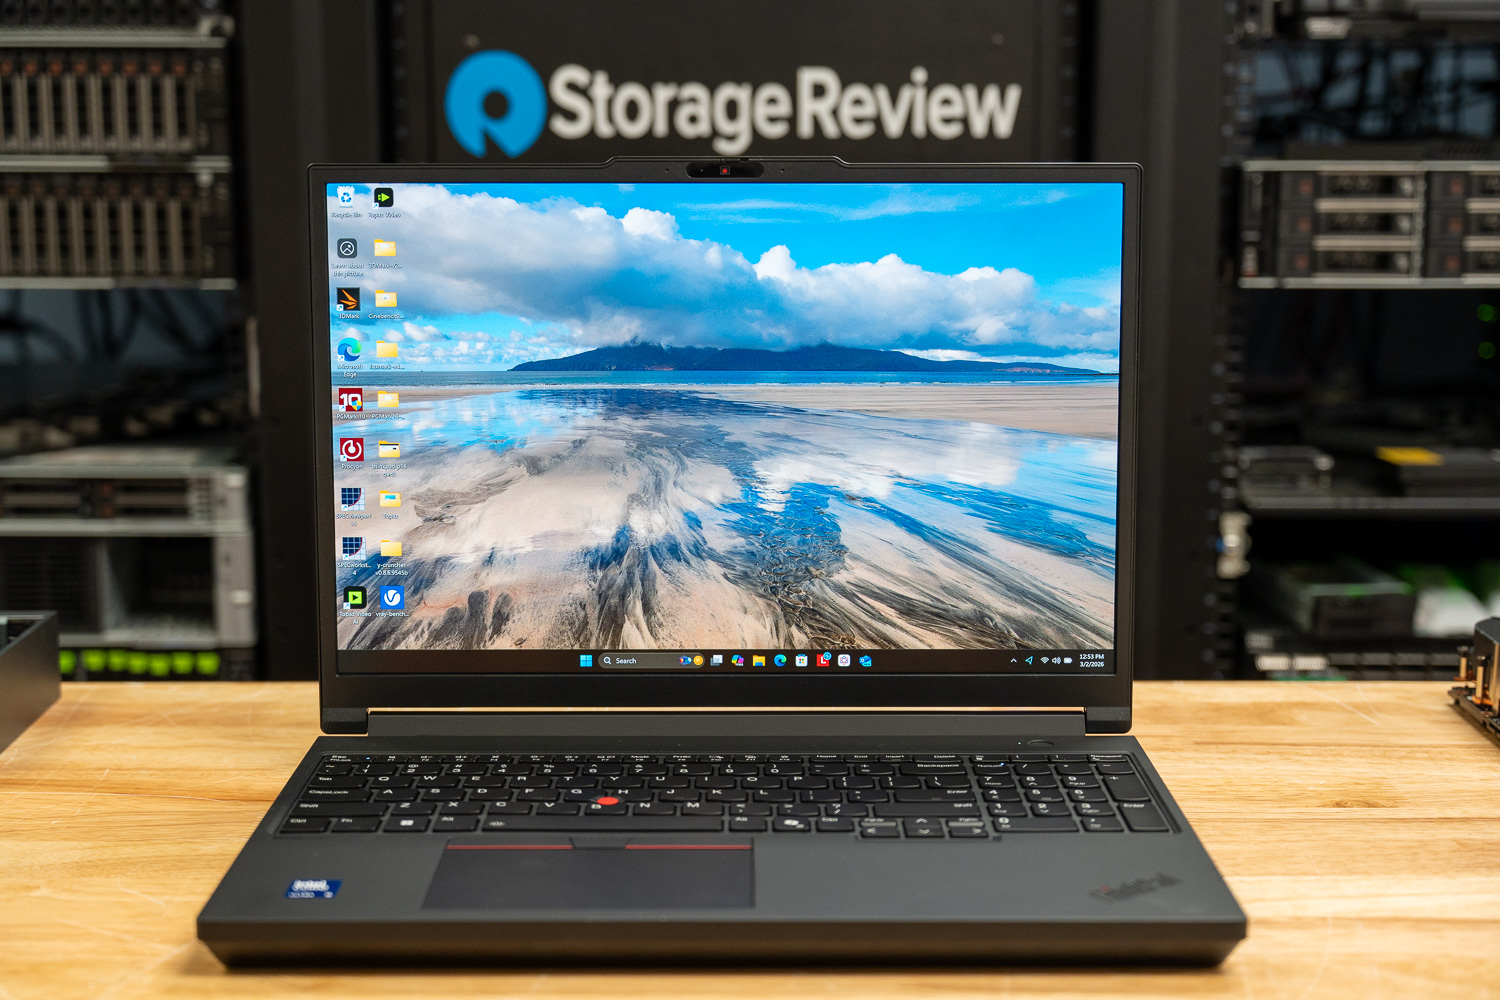
The ThinkPad P16 Gen 3 is a full-size 16-inch mobile workstation built to replace a desktop for professional users who need serious compute power on the go. At 5.6 pounds (2.5 kg), it’s not a lightweight machine, but it’s still more manageable than many 17- or 18-inch workstation systems. The design follows Lenovo’s familiar ThinkPad approach, focusing on durability, structure, and serviceability rather than an ultra-thin build. This laptop is designed for everyday use in real-world work environments.
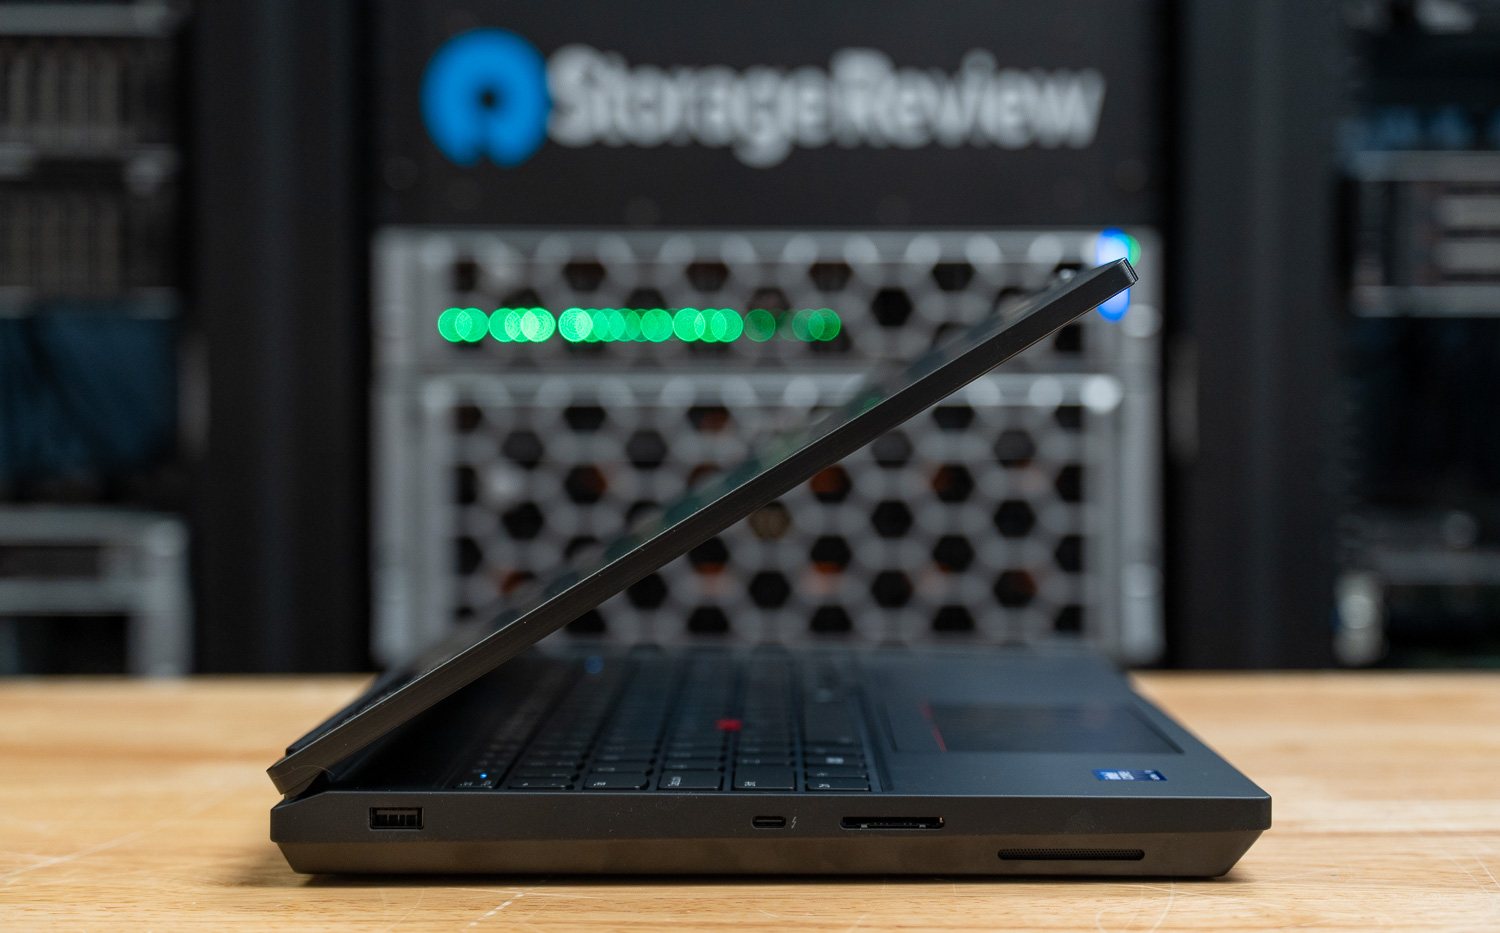
Display and Front
The P16 Gen 3 features a 16-inch 3200 × 2000 Tandem OLED panel in a 16:10 aspect ratio. Resolution and vertical workspace are very important in use cases such as CAD, timeline editing, and coding environments, and the 2000-pixel height provides more usable screen area than traditional 16:9 panels. The display supports multi-touch input and features a peak brightness rating of 600 nits, 100% DCI-P3 color coverage, DisplayHDR 600 certification, and a variable refresh rate up to 120 Hz. Tandem OLED means the panel uses two light-emitting layers instead of one, which helps it reach higher brightness levels and reduces the workload for each layer.
There’s also a 5MP user-facing webcam above the display, accompanied by dual microphones.
Keyboard and Input
The P16 features a full-size backlit keyboard (as usual for the ThinkPad workstation lineup), including a dedicated numeric keypad.
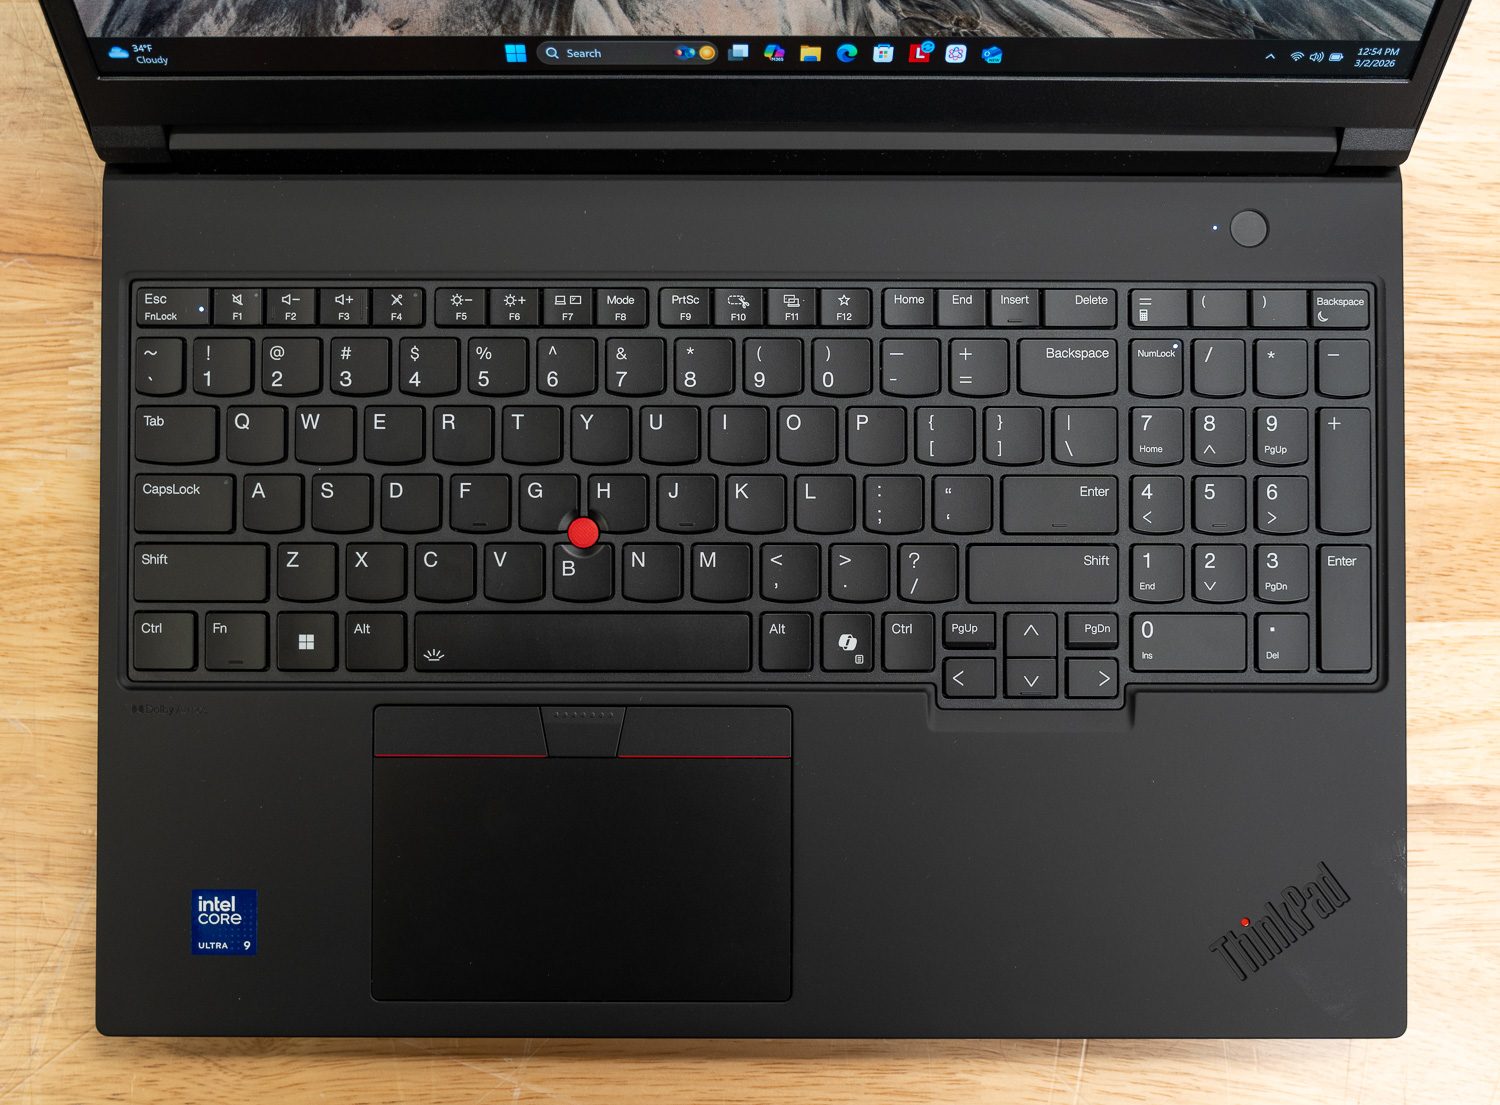
It follows Lenovo’s usual workstation layout, built around a full 6-row design with a dedicated numeric keypad. For engineering applications, financial modeling, and CAD input, having a physical numpad is very important. Key travel is rated at 1.5 mm, giving the deck a deeper feel compared to thinner productivity systems. The keyboard is also spill-resistant, which is definitely a nice safeguard to have in studio and lab environments where employees have longer work sessions.
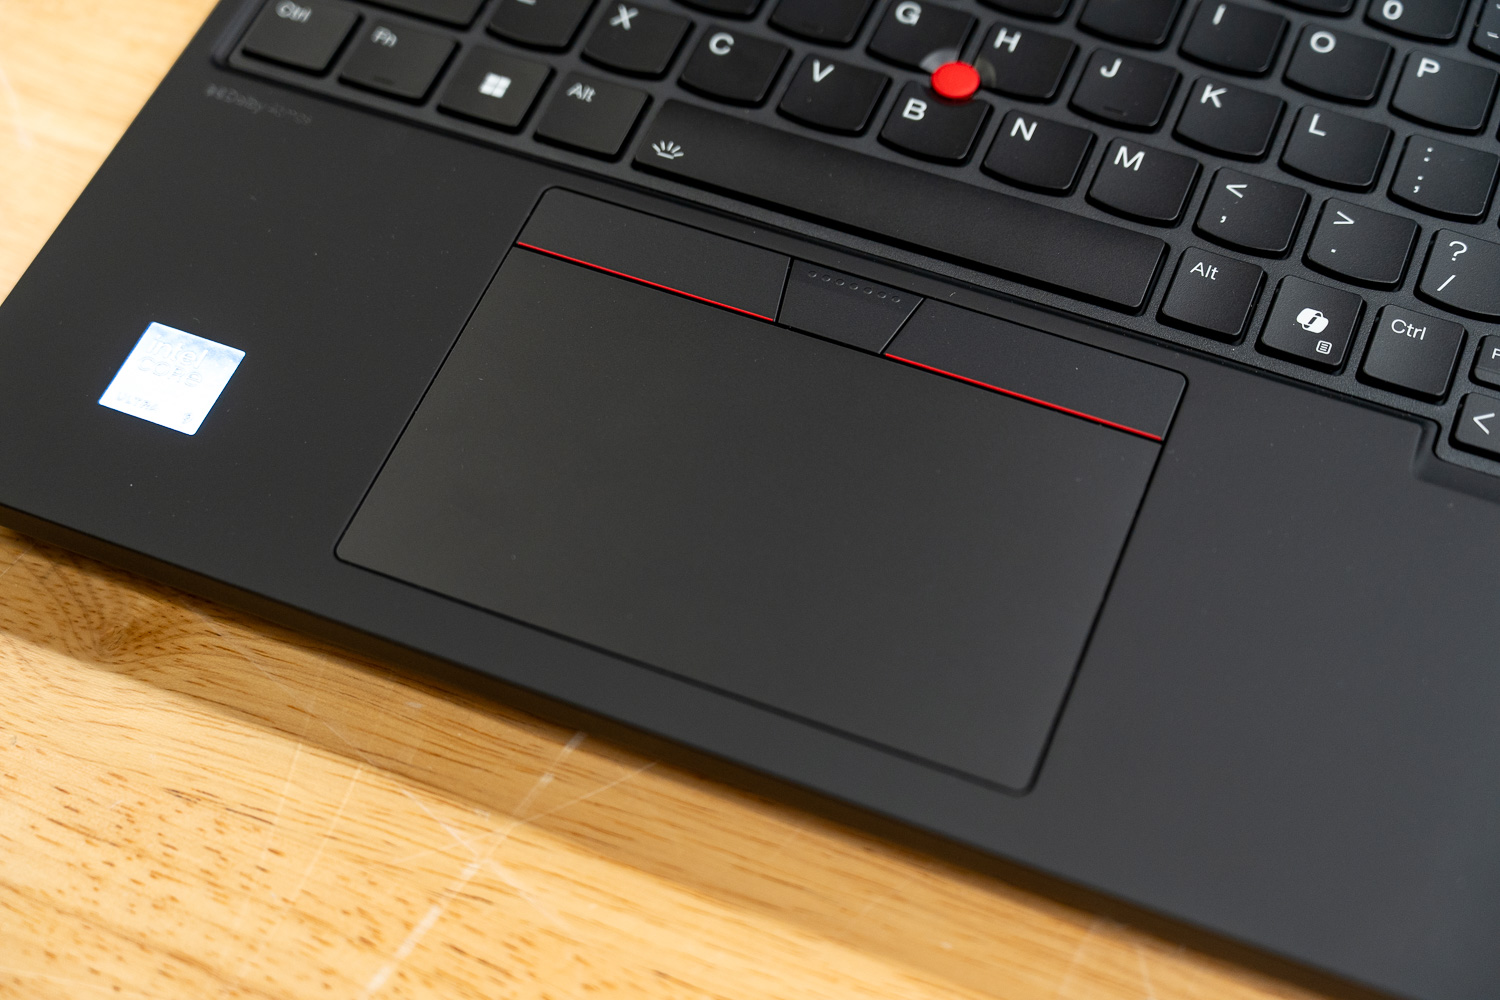
Lenovo also retains the TrackPoint with its dedicated three-button arrangement above the touchpad (including the red track button), allowing precise cursor control without leaving the home row. LED backlighting is standard, and the layout now includes the Copilot key.
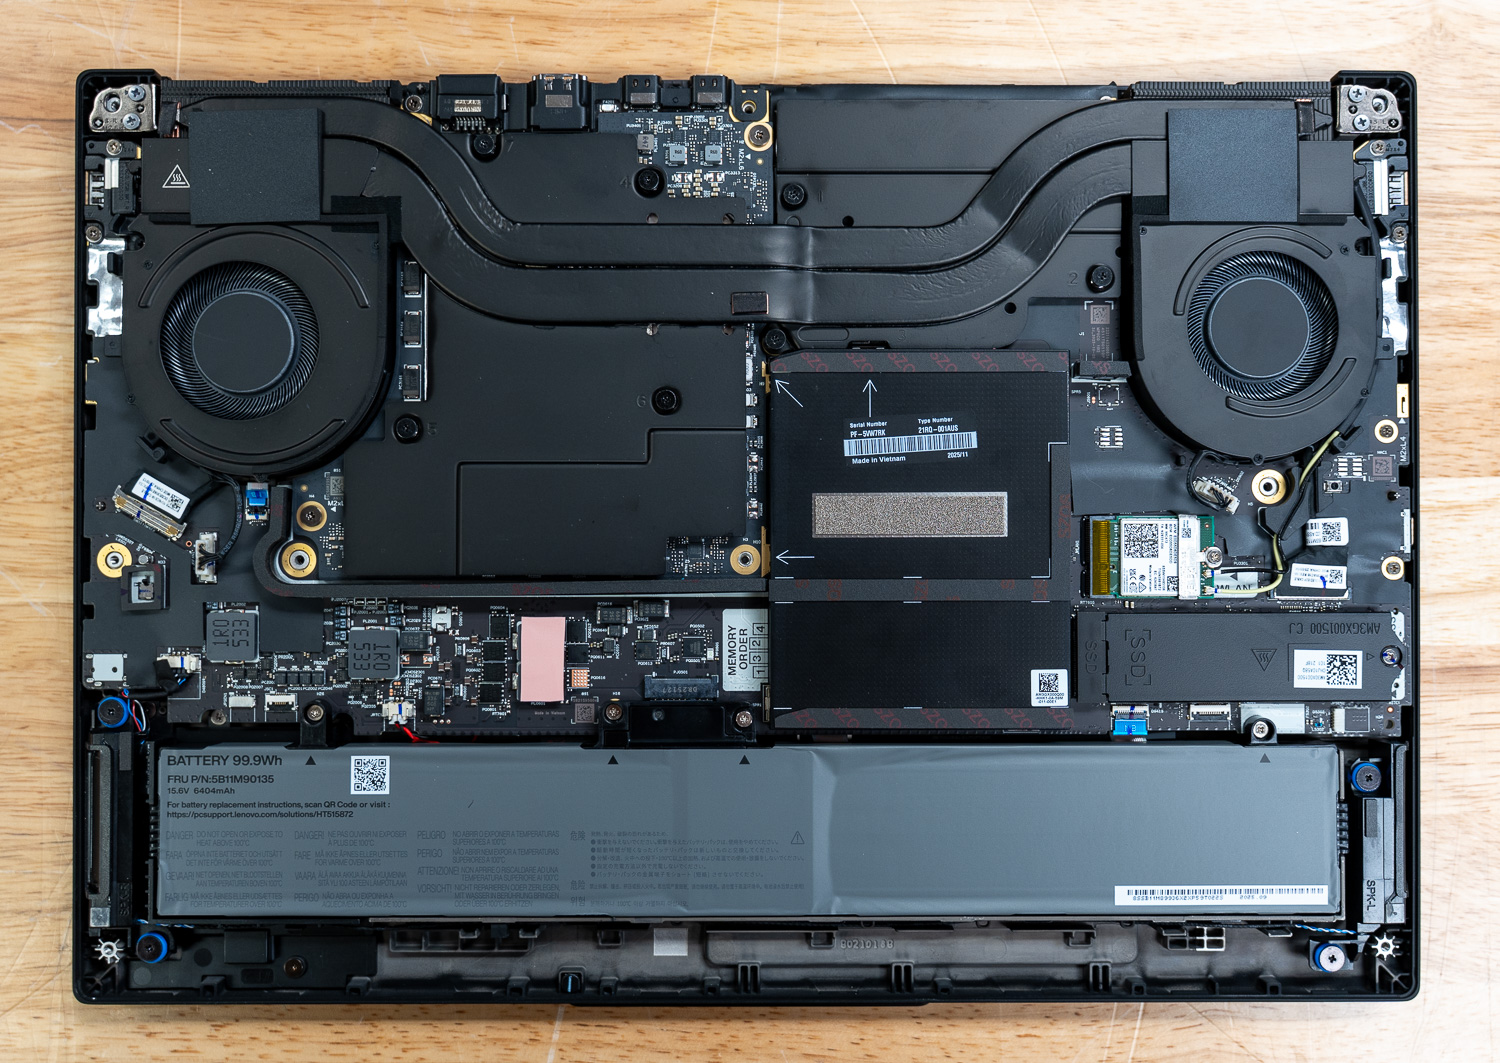
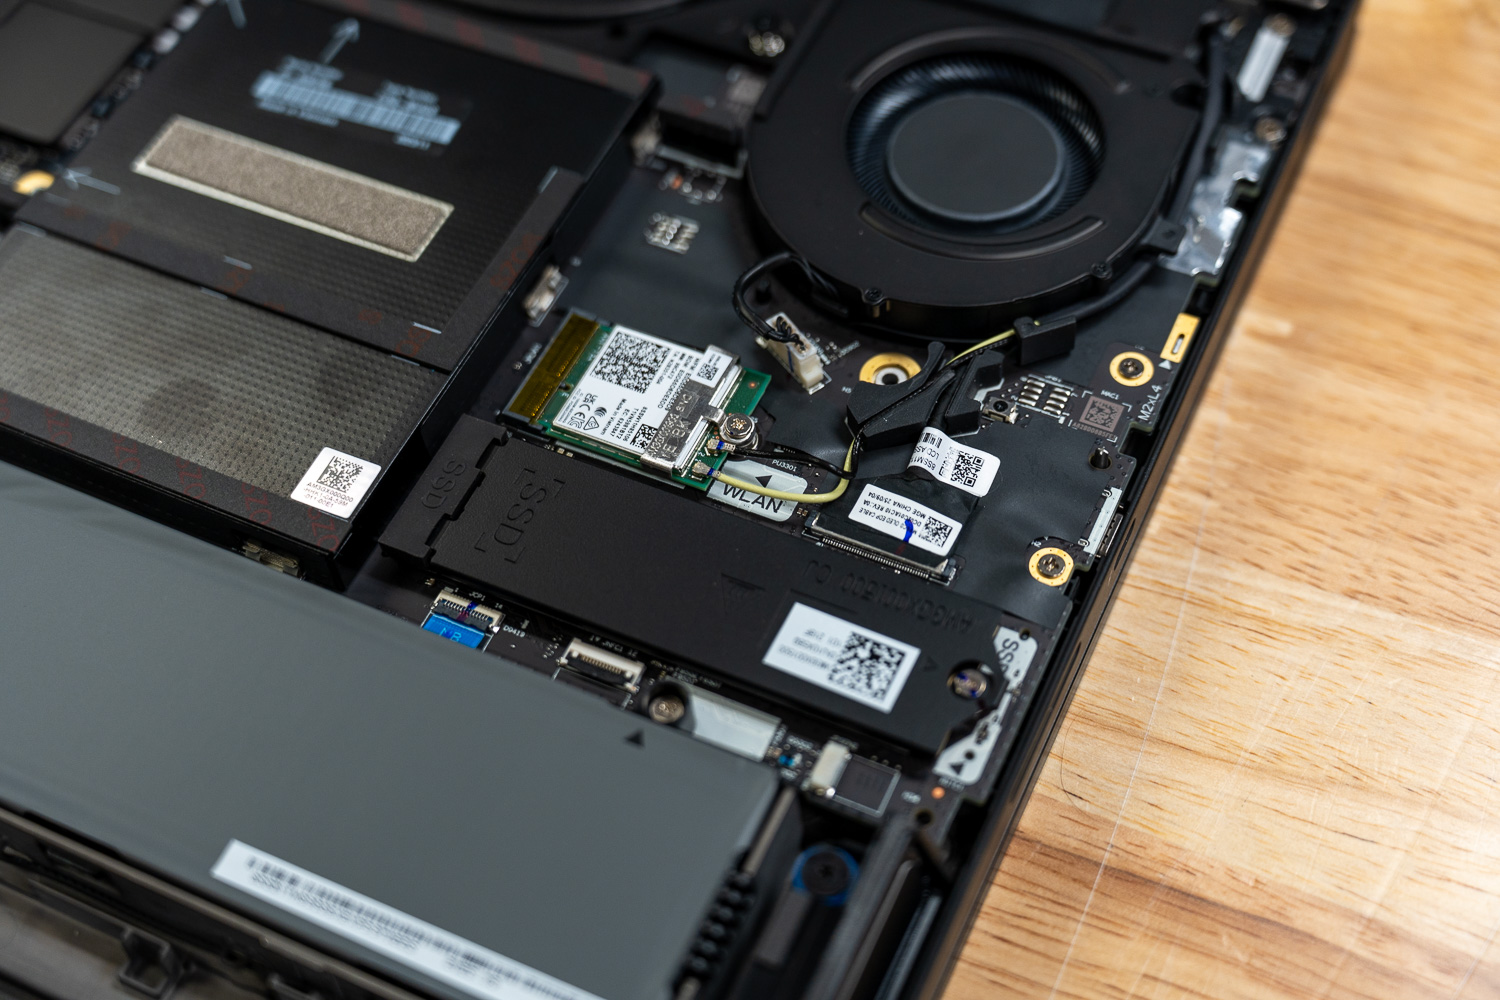
Internal Hardware and Expandability
As we discussed earlier, the P16 Gen 3 integrates Intel’s Core Ultra 9 275HX processor, featuring 24 cores divided into eight Performance cores operating up to 5.4 GHz and sixteen Efficiency cores up to 4.6 GHz, supported by 36 MB of L3 cache. Memory is configured with 32 GB of DDR5-5600 in a 2 x 16GB arrangement across four SO-DIMM slots, with support for expansion up to 192GB. Storage consists of a 1TB M.2 NVMe SSD installed in a PCIe 5.0 ×4 slot. Two additional PCIe 4.0 ×4 M.2 2280 slots are available for expansion.
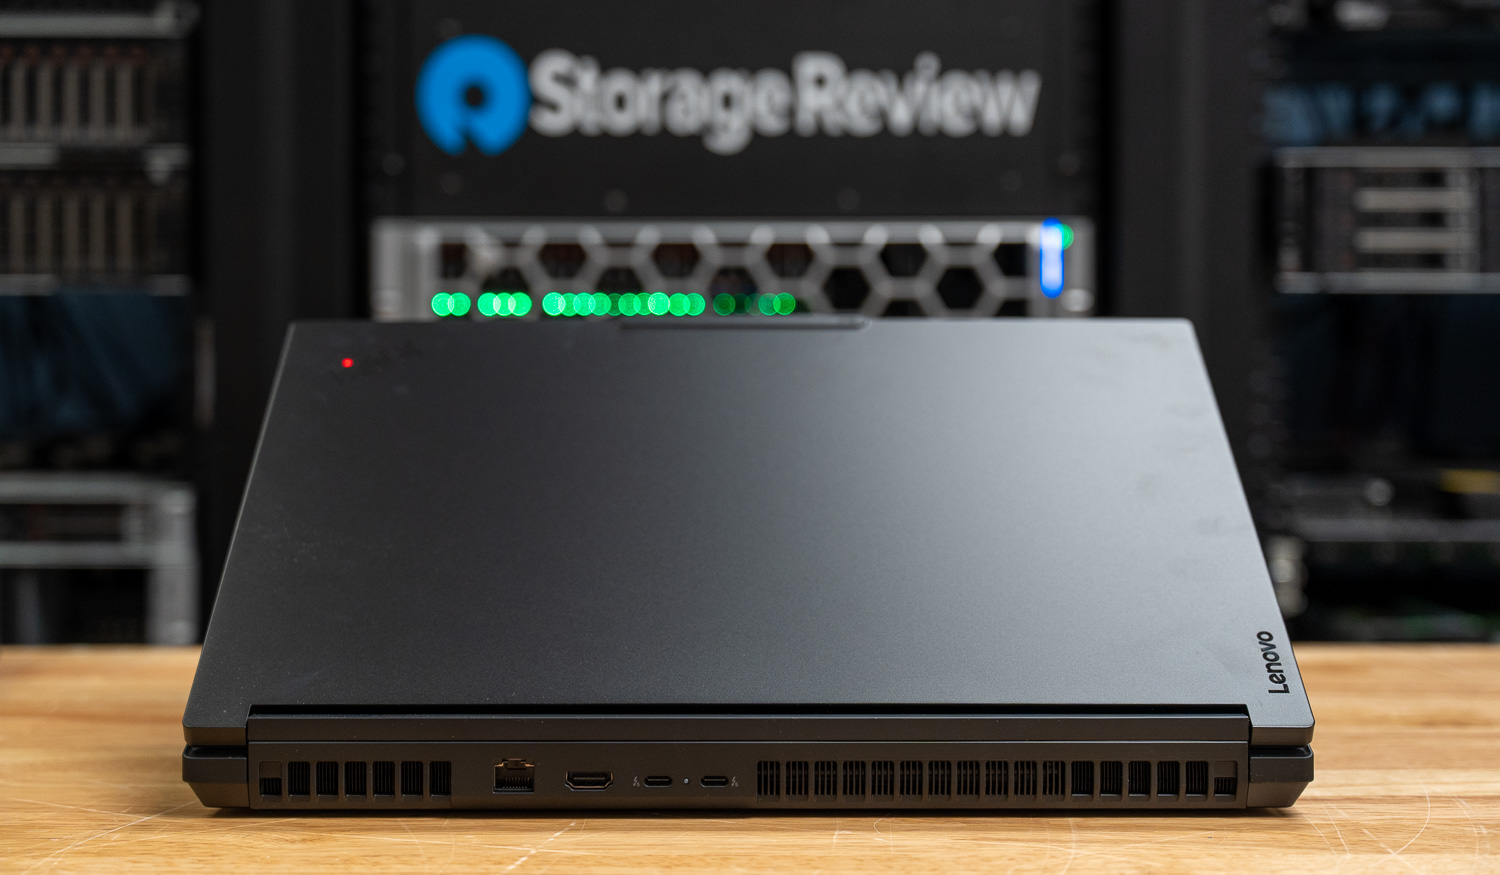
Left, Right, and Rear Side I/O
The P16 has enough ports so users don’t need external hubs for the most common tasks:
- Two Thunderbolt 5 ports supporting up to 80Gb/s and Power Delivery
- One Thunderbolt 4 port supporting up to 40Gb/s and Power Delivery
- Two USB-A 3.2 Gen 2 ports
- One HDMI 2.1 output
- One 2.5 GbE RJ45 Ethernet port
- One SD Express 8.0 card reader
- One 3.5 mm headset jack

As discussed earlier, Thunderbolt 5’s increased bandwidth over Thunderbolt 4 makes it easier to run multiple high-resolution displays, connect to fast external NVMe storage, and use a single-cable dock without worrying too much about bandwidth limits.
Wireless connectivity includes Wi-Fi 7 (802.11be) with 2×2 MU-MIMO support and Bluetooth 5.4.
Bottom and Power
Power comes from a 99.9 Wh lithium-ion polymer battery, which is just under the 100 Wh limit most airlines allow in carry-on luggage. In a system built around an HX-class processor and a workstation-grade GPU, that battery is meant for travel, meetings, and short bursts away from the desk, while sustained heavy workloads will still rely on a plugged-in power adapter.
Integrated speakers are rated at 2 x 2 W, which is sufficient for conferencing and general media use. Professional audio work will most certainly rely on professional headsets.
Lenovo’s ThinkPad P16 Gen 3 Performance
To evaluate the ThinkPad P16 Gen 3, we ran a collection of workstation, AI, rendering, storage, and general compute benchmarks designed to stress both CPU and GPU performance across professional workloads.
Our review configuration was equipped with an Intel Core Ultra 9 275HX processor featuring 24 cores and a boost speed of up to 5.38 GHz, paired with NVIDIA’s RTX PRO 5000 Blackwell Laptop GPU with 24GB of GDDR7 memory. The system was also configured with 128GB of system memory and a 4TB Samsung NVMe SSD.
In these tests, we compared the ThinkPad P16 Gen 3 to the following systems:
- Dell Pro Max 18 Plus configured with an Intel Core Ultra 9 285HX processor and NVIDIA RTX PRO 5000 GPU
- HP ZBook Fury G1i configured with an Intel Core Ultra 9 285HX processor and NVIDIA RTX PRO 5000 GPU
While the CPU and GPU baselines remain largely aligned between the Dell and HP systems, the Lenovo ThinkPad P16 Gen 3 introduces a slightly different tuning profile that reflects its own design priorities. Dell configures its RTX PRO 5000 with a 175 W ceiling and a graphics clock of 1807 MHz, while HP sets the same GPU at a 150 W maximum TDP with a 1740 MHz clock. Lenovo, by comparison, runs the RTX PRO 5000 with a noticeably lower GPU TDP of 105W, prioritizing thermals and sustained runtime.
On the CPU side, both the Dell and HP configurations rely on the Intel Core Ultra 9 285HX, whereas the Lenovo system steps down slightly to the Intel Core Ultra 9 275HX. Memory configuration also reflects different platform approaches. Dell utilizes its CAMM2 implementation rated for 7200 MT/s but operating at 6400 MT/s in this system, while HP sticks with traditional SODIMM memory rated at 5600 MT/s but running at 4400 MT/s. Lenovo follows a similar SODIMM approach, also operating at 4400 MT/s.
Procyon AI Computer Vision
The Procyon AI Computer Vision Benchmark measures AI inference performance across CPUs, GPUs, and dedicated accelerators using a range of state-of-the-art neural networks. It evaluates tasks such as image classification, object detection, segmentation, and super-resolution using models including MobileNet V3, Inception V4, YOLO V3, DeepLab V3, Real ESRGAN, and ResNet 50. Tests are run on multiple inference engines, including NVIDIA TensorRT, Intel OpenVINO, Qualcomm SNPE, Microsoft Windows ML, and Apple Core ML, providing a broad view of hardware and software efficiency. Results are reported for float- and integer-optimized models, providing a consistent, practical measure of machine vision performance for professional workloads.
In the Procyon AI Computer Vision benchmark, the ThinkPad P16 Gen 3 delivers solid but slightly behind-the-leader CPU results, posting an overall score of 160 compared to 195 on the Dell system and 185 on the HP. This difference is largely due to the newer Core Ultra 9 285HX processor used in the competing systems. Interestingly, the P16 performs well in certain models, such as YOLO V3, where it achieves faster inference times than both comparison systems. On the GPU side, results are much closer overall, with the P16’s RTX PRO 5000 remaining competitive across most models, suggesting that GPU-driven computer vision workloads will perform similarly across these high-end mobile workstation platforms.
| CPU Results (average time in ms) | Lenovo ThinkPad P16 Gen 3 (Intel Ultra 9 275HX)(NVIDIA RTX PRO 5000) | Dell Pro Max 18 Plus (Intel Core Ultra 9 285HX)(NVIDIA RTX PRO 5000) | HP ZBook Fury G1i (Intel Core Ultra 9 285HX)(NVIDIA RTX PRO 5000) |
|---|---|---|---|
| AI Computer Vision Overall Score | 160 | 195 | 185 |
| MobileNet V3 | 1.06 ms | 1.00 ms | 0.94 ms |
| ResNet 50 | 8.82 ms | 6.98 ms | 7.46 ms |
| Inception V4 | 23.17 ms | 19.53 ms | 20.47 ms |
| DeepLab V3 | 29.73 ms | 24.15 ms | 25.74 ms |
| YOLO V3 | 29.73 ms | 44.53 ms | 45.50 ms |
| REAL-ESRGAN | 2697.37 ms | 1,934.18 ms | 2,281.80 ms |
| GPU Results (average time in ms) | Lenovo ThinkPad P16 Gen 3 (Intel Ultra 9 275HX)(NVIDIA RTX PRO 5000) | Dell Pro Max 18 Plus (Intel Core Ultra 9 285HX)(NVIDIA RTX PRO 5000) | HP ZBook Fury G1i (Intel Core Ultra 9 285HX)(NVIDIA RTX PRO 5000) |
|---|---|---|---|
| AI Computer Vision Overall Score | 863 | 1,032 | 890 |
| MobileNet V3 | 0.56 ms | 0.55 ms | 0.57 ms |
| ResNet 50 | 1.49 ms | 1.20 ms | 1.54 ms |
| Inception V4 | 4.19 ms | 3.00 ms | 4.11 ms |
| DeepLab V3 | 13.78 ms | 13.05 ms | 12.78 ms |
| YOLO V3 | 7.11 ms | 5.63 ms | 6.78 ms |
| REAL-ESRGAN | 110.63 ms | 88.56 ms | 100.18 ms |
| TensorRT Results (average time in ms) | Lenovo ThinkPad P16 Gen 3 (Intel Ultra 9 275HX)(NVIDIA RTX PRO 5000) | Dell Pro Max 18 Plus (Intel Core Ultra 9 285HX)(NVIDIA RTX PRO 5000) | HP ZBook Fury G1i (Intel Core Ultra 9 285HX)(NVIDIA RTX PRO 5000) |
|---|---|---|---|
| Overall Score | 1,010 | 1,609 | 1,014 |
| MobileNet V3 | 0.43 ms | 0.26 ms | 0.43 ms |
| ResNet 50 | 1.65 ms | 0.98 ms | 1.69 ms |
| Inception V4 | 6.08 ms | 3.01 ms | 5.26 ms |
| DeepLab V3 | 5.03 ms | 3.97 ms | 5.89 ms |
| YOLO V3 | 5.83 ms | 3.22 ms | 5.76 ms |
| REAL-ESRGAN | 116.46 ms | 90.17 ms | 110.30 ms |
UL Procyon: AI Text Generation
The Procyon AI Text Generation Benchmark streamlines AI LLM performance testing by providing a concise and consistent evaluation method. It allows for repeated testing across multiple LLM models while minimizing the complexity of large model sizes and variable factors. Developed with AI hardware leaders, it optimizes the use of local AI accelerators to deliver more reliable, efficient performance assessments. The results measured below were tested using TensorRT.
For local LLM inference in the Procyon AI Text Generation benchmark, the ThinkPad P16 Gen 3 delivers strong results, but again slightly trails systems using the newer 285HX processor. Across models such as Phi, Mistral, Llama3, and Llama2, the P16 maintains consistent performance, though token generation rates fall slightly behind those of the Dell and HP systems. Time-to-first-token remains competitive, ensuring inference startup times are responsive. Overall, the system still provides capable local LLM performance, and with the RTX PRO 5000’s 24GB of VRAM.
| UL Procyon: AI Text Generation | Lenovo ThinkPad P16 Gen 3 (Intel Ultra 9 275HX)(NVIDIA RTX PRO 5000) | Dell Pro Max 18 Plus (Intel Core Ultra 9 285HX)(NVIDIA RTX PRO 5000) | HP ZBook Fury G1i (Intel Core Ultra 9 285HX)(NVIDIA RTX PRO 5000) |
|---|---|---|---|
| Phi | |||
| Phi Overall Score | 3,482 | 4,475 | 3,904 |
| Phi Output Time To First Token | 0.298 s | 0.237 s | 0.265 s |
| Phi Output Tokens Per Second | 141.217 tokens/s | 185.118 tokens/s | 157.446 tokens/s |
| Phi Overall Duration | 21.262 s | 16.314 s | 19.025 s |
| Mistral | |||
| Mistral Overall Score | 3,432 | 4,295 | 3,823 |
| Mistral Output Time To First Token | 0.418 s | 0.347 s | 0.379 s |
| Mistral Output Tokens Per Second | 108.118 tokens/s | 140.546 tokens/s | 121.511 tokens/s |
| Mistral Overall Duration | 27.881 s | 21.665 s | 24.843 s |
| Llama3 | |||
| Llama3 Overall Score | 3,115 | 3,763 | 3,418 |
| Llama3 Output Time To First Token | 0.387 s | 0.344 s | 0.357 s |
| Llama3 Output Tokens Per Second | 92.363 tokens/s | 119.741 tokens/s | 102.637 tokens/s |
| Llama3 Overall Duration | 32.204 s | 25.165 s | 29.068 s |
| Llama2 | |||
| Llama2 Overall Score | 3, 407 | 4,155 | 3,711 |
| Llama2 Output Time To First Token | 0.627 s | 0.546 s | 0.566 s |
| Llama2 Output Tokens Per Second | 53.8924 tokens/s | 69.709 tokens/s | 57.620 tokens/s |
| Llama2 Overall Duration | 54.436 s | 42.506 s | 50.608 s |
UL Procyon: AI Image Generation
The Procyon AI Image Generation Benchmark provides a consistent and accurate method for measuring AI inference performance across a range of hardware, from low-power NPUs to high-end GPUs. It includes three tests: Stable Diffusion XL (FP16) for high-end GPUs, Stable Diffusion 1.5 (FP16) for moderately powerful GPUs, and Stable Diffusion 1.5 (INT8) for low-power devices. The benchmark uses the optimal inference engine for each system, ensuring fair and comparable results.
The Procyon AI Image Generation results show a similar pattern, with the ThinkPad P16 Gen 3 performing well again but still behind the systems using the newer processor. For Stable Diffusion 1.5 FP16 workloads, the P16 generates images at roughly 2.3 seconds per image, while INT8 workloads improve throughput to just over one second per image. Stable Diffusion XL remains significantly heavier, with generation times exceeding 16 seconds per image, but this remains typical for mobile GPUs even at the high end. Overall, the P16 offers strong generative AI performance for development and experimentation with local diffusion models.
| UL Procyon: AI Image Generation | Lenovo ThinkPad P16 Gen 3 (Intel Ultra 9 275HX)(NVIDIA RTX PRO 5000) | Dell Pro Max 18 Plus (Intel Core Ultra 9 285HX)(NVIDIA RTX PRO 5000) | HP ZBook Fury G1i (Intel Core Ultra 9 285HX)(NVIDIA RTX PRO 5000) |
|---|---|---|---|
| Stable Diffusion 1.5 (FP16) | |||
| Stable Diffusion 1.5 (FP16) – Overall Score | 2,702 | 3,687 | 3,120 |
| Stable Diffusion 1.5 (FP16) – Overall Time | 37.005 s | 27.119 s | 32.043 s |
| Stable Diffusion 1.5 (FP16) – Image Generation Speed | 2.313 s/image | 1.695 s/image | 2.003 s/image |
| Stable Diffusion 1.5 (INT8) | |||
| Stable Diffusion 1.5 (INT8) – Overall Score | 30,210 | 44,101 | 32,824 |
| Stable Diffusion 1.5 (INT8) – Overall Time | 8.275 s | 5.669 s | 7.616 s |
| Stable Diffusion 1.5 (INT8) – Image Generation Speed | 1.034 s/image | 0.709 s/image | 0.952 s/image |
| Stable Diffusion XL (FP16) | |||
| Stable Diffusion XL (FP16) – Overall Score | 2,310 | 3,170 | 2,701 |
| Stable Diffusion XL (FP16) – Overall Time | 256.640 s | 189.260 s | 222.133 s |
| Stable Diffusion XL (FP16) – Image Generation Speed | 16.228 s/image | 11.829 s/image | 13.883 s/image |
SPECworkstation 4
The SPECworkstation 4.0 benchmark is a comprehensive tool for evaluating all key aspects of workstation performance. It offers a real-world measure of CPU, graphics, accelerator, and disk performance, ensuring professionals have the data to make informed decisions about their hardware investments. The benchmark includes a dedicated set of tests focusing on AI and ML workloads, including data science tasks and ONNX runtime-based inference tests, reflecting the growing importance of AI/ML in workstation environments. It encompasses seven industry verticals and four hardware subsystems, providing a detailed, relevant measure of today’s workstation performance.
Here, the ThinkPad P16 Gen 3 delivers balanced workstation performance across a range of professional workloads (though it generally trails the other two systems). Scores such as 2.14 in AI & Machine Learning and 1.99 in Energy place it slightly behind the Dell and HP systems, showing the modest CPU performance advantage those platforms hold in this benchmark. It performs particularly well in Life Sciences with a score of 2.31, outperforming the Dell configuration and coming close to the HP system. Overall, the results keep the P16 Gen 3 in the same performance class across most workstation workloads, offering solid capability for engineering, media, and data-focused applications (even if it doesn’t lead the group).
| SPECworkstation 4.0.0 (higher is better) | Lenovo ThinkPad P16 Gen 3 (Intel Ultra 9 275HX)(NVIDIA RTX PRO 5000) | Dell Pro Max 18 Plus (Intel Core Ultra 9 285HX)(NVIDIA RTX PRO 5000) | HP ZBook Fury G1i (Intel Core Ultra 9 285HX)(NVIDIA RTX PRO 5000) |
|---|---|---|---|
| Industry Verticals | |||
| AI & Machine Learning | 2.14 | 2.48 | 2.26 |
| Energy | 1.99 | 2.49 | 2.20 |
| Financial Services | 1.41 | 1.66 | 1.63 |
| Life Sciences | 2.31 | 1.50 | 2.46 |
| Media & Entertainment | 2.37 | 2.66 | 2.51 |
| Product Design | 2.02 | 2.35 | 2.16 |
| Productivity & Development | 1.10 | 1.35 | 1.19 |
SPECviewperf 15
SPECviewperf 15 is the industry-standard benchmark for evaluating 3D graphics performance across OpenGL, DirectX, and Vulkan APIs. It introduces new workloads, including blender-01 (Blender 3.6), unreal_engine-01 (Unreal Engine 5.4, DirectX 12), and enscape-01 (Enscape 4.0, Vulkan ray tracing), along with updated traces for 3ds Max, CATIA, Creo, Maya, and SolidWorks. With its redesigned GUI, modern application support, and advanced rendering workloads, SPECviewperf 15 provides consistent, real-world insights into professional graphics performance.
SPECviewperf 15 results show the ThinkPad P16 Gen 3 performing competitively across professional graphics workloads. The system stands out in particular in the Blender trace, where it achieves the highest score among the tested systems. Performance in CAD and design-focused workloads such as CATIA, Creo, and Solidworks trails slightly behind the Dell system but remains within the same performance tier. Overall, the P16 demonstrates strong GPU viewport performance.
| SPECviewperf (higher is better) | Lenovo ThinkPad P16 Gen 3 (Intel Ultra 9 275HX)(NVIDIA RTX PRO 5000) | Dell Pro Max 18 Plus (Intel Core Ultra 9 285HX)(NVIDIA RTX PRO 5000) | HP ZBook Fury G1i (Intel Core Ultra 9 285HX)(NVIDIA RTX PRO 5000) |
|---|---|---|---|
| 3dsmax-08 | 82.16 | 98.71 | 87.03 |
| blender-01 | 95.53 | 83.23 | 78.03 |
| catia-07 | 92.60 | 113.18 | 100.55 |
| creo-04 | 192.46 | 247.79 | 238.38 |
| energy-04 | 125.66 | 170.27 | 153.43 |
| enscape-01 | 68.15 | 86.70 | 77.57 |
| maya-07 | 200.26 | 232.48 | 217.67 |
| medical-04 | 173.61 | 210.51 | 183.39 |
| solidworks-08 | 114.57 | 145.56 | 110.66 |
| unreal_engine-01 | 69.74 | 93.46 | 79.85 |
LuxMark
LuxMark is a GPU benchmark that uses LuxRender, an open-source ray-tracing renderer, to evaluate a system’s performance with highly detailed 3D scenes. This benchmark is relevant for assessing the graphical rendering capabilities of servers and workstations, especially for visual effects and architectural visualization applications, where accurate light simulation is crucial.
Here, the ThinkPad P16 Gen 3 again lands between the two other systems. With a score of 25,640 in the Hallbench test and 10,754 in the Food scene, the RTX PRO 5000 in the P16 delivers strong ray-tracing throughput. While the Dell system posts higher numbers, the P16 remains competitive and ahead of the HP system in some cases. This means the P16 Gen 3 has some solid GPU compute capability for rendering and lighting simulation workloads.
| LuxMark (higher is better) | Lenovo ThinkPad P16 Gen 3 (Intel Ultra 9 275HX)(NVIDIA RTX PRO 5000) | Dell Pro Max 18 Plus (Intel Core Ultra 9 285HX)(NVIDIA RTX PRO 5000) | HP ZBook Fury G1i (Intel Core Ultra 9 285HX)(NVIDIA RTX PRO 5000) |
|---|---|---|---|
| Hallbench | 25,640 | 29,605 | 26,594 |
| Food | 10,754 | 13,042 | 11,500 |
7-Zip Compression
The 7-Zip Compression Benchmark evaluates CPU performance during compression and decompression tasks, measuring ratings in GIPS (Giga Instructions Per Second) and CPU usage. Higher GIPS and efficient CPU usage indicate superior performance.
Compression and decompression results place it slightly behind the Dell system, though it maintains competitive performance overall with a total rating of 127.8 GIPS. CPU utilization levels indicate that the processor effectively leverages its available cores under heavy workloads, resulting in strong performance for tasks such as file archiving, software compilation, and data compression.
| 7-Zip Compression Benchmark (higher is Better) | Lenovo ThinkPad P16 Gen 3 (Intel Ultra 9 275HX)(NVIDIA RTX PRO 5000) | Dell Pro Max 18 Plus (Intel Core Ultra 9 285HX)(NVIDIA RTX PRO 5000) | HP ZBook Fury G1i (Intel Core Ultra 9 285HX)(NVIDIA RTX PRO 5000) |
|---|---|---|---|
| Compression | |||
| Current CPU Usage | 1,973% | 1,905% | 1,796% |
| Current Rating/Usage | 5.766 GIPS | 7.275 GIPS | 5.692 GIPS |
| Current Rating | 113.740 GIPS | 138.244 GIPS | 102.234 GIPS |
| Resulting CPU Usage | 1,965% | 1,891% | 1,780% |
| Resulting Rating/Usage | 5.776 GIPS | 7.270 GIPS | 5.731 GIPS |
| Resulting Rating | 113.457 GIPS | 137.459 GIPS | 102.012 GIPS |
| Decompression | |||
| Current CPU Usage | 1,997% | 2,226% | 2,208% |
| Current Rating/Usage | 6.628 GIPS | 7.175 GIPS | 6.411 GIPS |
| Current Rating | 132.359 GIPS | 159.735 GIPS | 141.545 GIPS |
| Resulting CPU Usage | 2,040% | 2,242% | 2,213% |
| Resulting Rating/Usage | 6.933 GIPS | 7.276 GIPS | 6.608 GIPS |
| Resulting Rating | 142.143 GIPS | 163.149 GIPS | 146.208 GIPS |
| Total Rating | |||
| Total CPU Usage | 2,007% | 2,067% | 1,997% |
| Total Rating/Usage | 6.355 GIPS | 7.273 GIPS | 6.170 GIPS |
| Total Rating | 127.800 GIPS | 150.304 GIPS | 124.110 GIPS |
Blackmagic RAW Speed Test
The Blackmagic RAW Speed Test is a performance benchmark that measures a system’s capabilities for video playback and editing with the Blackmagic RAW codec. It evaluates how well a system can decode and playback high-resolution video files, reporting frame rates for CPU- and GPU-based processing.
The ThinkPad P16 Gen 3 performs well in the Blackmagic RAW Speed Test, demonstrating strong capabilities for video editing workloads. In the CPU decoding test, the system reaches 104 FPS for 8K playback, which is competitive for a mobile workstation. GPU acceleration further improves performance, achieving 143 FPS with OpenCL. Though the Dell and HP systems post higher GPU numbers, the P16 still provides more than enough throughput for high-resolution video editing workflows.
| Blackmagic RAW Speed Test | Lenovo ThinkPad P16 Gen 3 (Intel Ultra 9 275HX)(NVIDIA RTX PRO 5000) | Dell Pro Max 18 Plus (Intel Core Ultra 9 285HX)(NVIDIA RTX PRO 5000) | HP ZBook Fury G1i (Intel Core Ultra 9 285HX)(NVIDIA RTX PRO 5000) |
|---|---|---|---|
| 8K CPU | 104 | 128 | 112 |
| 8K OPENCL | 143 | 168 | 182 |
Blackmagic Disk Speed Test
The Blackmagic Disk Speed Test evaluates storage performance by measuring read and write speeds, providing insights into a system’s ability to handle data-intensive tasks, such as video editing and large file transfers.
Performance here is excellent, with nearly 8GB/s sequential read speeds and just under 6GB/s write speeds. These results slightly surpass the Dell system’s read performance and noticeably outperform the HP system in this test. Such throughput is typical of high-end PCIe Gen5 NVMe drives and ensures the P16 can handle large datasets, high-resolution media files, and demanding project workloads without storage bottlenecks.
| Disk Speed Test (higher is better) | Lenovo ThinkPad P16 Gen 3 (Intel Ultra 9 275HX)(NVIDIA RTX PRO 5000) | Dell Pro Max 18 Plus (Intel Core Ultra 9 285HX)(NVIDIA RTX PRO 5000) | HP ZBook Fury G1i (Intel Core Ultra 9 285HX)(NVIDIA RTX PRO 5000) |
|---|---|---|---|
| Read | 7,926.1 MB/s | 7,776.1 MB/s | 6,554.2 MB/s |
| Write | 5,932.1 MB/s | 6,022.0 MB/s | 5,728.0 MB/s |
Blender 4.5
Blender is an open-source 3D modeling application. This benchmark was run using the Blender Benchmark utility. The score is measured in samples per minute, with higher values indicating better performance.
CPU rendering performance is slightly behind the Dell system, but generally on par with or ahead of the HP system (depending on the scene). GPU rendering shows the RTX PRO 5000 withstrong throughput, although the Dell system again maintains a lead. For creators working with Blender, the P16 has enough performance for both viewport work and GPU rendering.
| Blender CPU (samples per minute, higher is better) | Lenovo ThinkPad P16 Gen 3 (Intel Ultra 9 275HX)(NVIDIA RTX PRO 5000) | Dell Pro Max 18 Plus (Intel Core Ultra 9 285HX)(NVIDIA RTX PRO 5000) | HP ZBook Fury G1i (Intel Core Ultra 9 285HX)(NVIDIA RTX PRO 5000) |
|---|---|---|---|
| Monster | 210.22 | 237.1 | 203.91 |
| Junkshop | 126.17 | 150.7 | 132.23 |
| Classroom | 93.70 | 94.5 | 88.19 |
| Blender GPU (samples per minute, higher is better) | Lenovo ThinkPad P16 Gen 3 (Intel Ultra 9 275HX)(NVIDIA RTX PRO 5000) | Dell Pro Max 18 Plus (Intel Core Ultra 9 285HX)(NVIDIA RTX PRO 5000) | HP ZBook Fury G1i (Intel Core Ultra 9 285HX)(NVIDIA RTX PRO 5000) |
|---|---|---|---|
| Monster | 3,361.80 | 3,928.6 | 3,710.99 |
| Junkshop | 1,866.04 | 2,150.1 | 2,056.19 |
| Classroom | 1,694.35 | 2010.2 | 1,888.38 |
y-cruncher
y-cruncher is a multithreaded and scalable program that can compute Pi and other mathematical constants to trillions of digits. Since its launch in 2009, it has become a popular benchmarking and stress-testing application for overclockers and hardware enthusiasts.
Here, the ThinkPad P16 Gen 3 consistently trails the Dell system but remains very close to the HP configuration in several tests. As the workload size increases from one billion to ten billion digits, the system maintains consistent scaling behavior. This means stable, sustained CPU performance under heavy computational loads.
| Y-Cruncher (Lower time is better) | Lenovo ThinkPad P16 Gen 3 (Intel Ultra 9 275HX)(NVIDIA RTX PRO 5000) | Dell Pro Max 18 Plus (Intel Core Ultra 9 285HX)(NVIDIA RTX PRO 5000) | HP ZBook Fury G1i (Intel Core Ultra 9 285HX)(NVIDIA RTX PRO 5000) |
|---|---|---|---|
| 1 Billion | 23.067 s | 20.081 s | 22.042 s |
| 2.5 Billion | 67.517 s | 59.228 s | 64.911 s |
| 5 Billion | 156.655 s | 142.822 s | 161.295 s |
| 10 Billion | 356.414 s | 311.805 s | 359.489 s |
Geekbench 6
Geekbench 6 is a cross-platform benchmark that measures overall system performance.
Results here show an interesting balance for the ThinkPad P16 Gen 3. In single-core performance, the system actually posts the highest score among the three systems tested, indicating excellent per-core performance and responsiveness. Multi-core performance trails the Dell system somewhat, reflecting the generational differences between the processors. GPU OpenCL results place the P16 between the two competing systems, showing off strong compute performance from the RTX PRO 5000.
| Geekbench 6 (higher is better) | Lenovo ThinkPad P16 Gen 3 (Intel Ultra 9 275HX)(NVIDIA RTX PRO 5000) | Dell Pro Max 18 Plus (Intel Core Ultra 9 285HX)(NVIDIA RTX PRO 5000) | HP ZBook Fury G1i (Intel Core Ultra 9 285HX)(NVIDIA RTX PRO 5000) |
|---|---|---|---|
| CPU | |||
| CPU Single-Core | 3,024 | 2,977 | 3,010 |
| CPU Multi-Core | 17,860 | 20,717 | 18,694 |
| GPU | |||
| GPU OpenCL | 220,751 | 240,530 | 194,740 |
V-Ray
The V-Ray Benchmark measures rendering performance for CPUs, NVIDIA GPUs, or both using advanced V-Ray 6 engines. It uses quick tests and a simple scoring system to let users evaluate and compare their systems’ rendering capabilities. It’s an essential tool for professionals seeking efficient performance insights.
The ThinkPad P16 Gen 3 scored 7,182, placing it just behind the Dell and HP systems. While the difference is noticeable, the system remains well within the same performance class. This indicates that the P16 can handle professional ray-traced rendering workloads effectively, particularly when leveraging GPU acceleration.
| Vray (higher is better) | Lenovo ThinkPad P16 Gen 3 (Intel Ultra 9 275HX)(NVIDIA RTX PRO 5000) | Dell Pro Max 18 Plus (Intel Core Ultra 9 285HX)(NVIDIA RTX PRO 5000) | HP ZBook Fury G1i (Intel Core Ultra 9 285HX)(NVIDIA RTX PRO 5000) |
|---|---|---|---|
| Score | 7,182 | 8,191 | 7,820 |
Topaz Video AI
Topaz Video AI is a professional application for enhancing and restoring video using advanced AI models. It supports tasks such as upscaling footage to 4K or 8K, sharpening blurry content, reducing noise, improving facial details, colorizing black-and-white footage, and interpolating frames for smoother motion. The suite includes an onboard benchmark that measures system performance across its different video-enhancing algorithms, giving a clear view of how well hardware platforms handle demanding AI video processing workloads.
While the Dell system generally leads in raw throughput, the ThinkPad still delivers strong performance across models such as Artemis, Iris, and Proteus. Frame rates decrease significantly as scaling factors increase, which is expected for these computationally intensive models. Overall, the system can handle AI-driven video enhancement and upscaling tasks, though heavier workloads will benefit from faster GPUs or CPUs.
| Topaz Video AI Benchmark (Frames per second, higher is better) | Lenovo ThinkPad P16 Gen 3 (Intel Ultra 9 275HX)(NVIDIA RTX PRO 5000) | Dell Pro Max 18 Plus (Intel Core Ultra 9 285HX)(NVIDIA RTX PRO 5000) | HP ZBook Fury G1i (Intel Core Ultra 9 285HX)(NVIDIA RTX PRO 5000) | ||||||
|---|---|---|---|---|---|---|---|---|---|
| Model | 1X | 2X | 4X | 1X | 2X | 4X | 1X | 2X | 4X |
| Artemis | 18.29 | 10.12 | 3.33 | 31.10 | 16.94 | 4.22 | 25.22 | 10.87 | 3.42 |
| Iris | 22.26 | 11.63 | 3.13 | 27.77 | 16.07 | 4.16 | 23.31 | 12.85 | 3.43 |
| Proteus | 18.02 | 11.48 | 3.03 | 28.56 | 18.70 | 4.70 | 24.45 | 13.22 | 3.68 |
| Gaia | 5.67 | 4.48 | 2.70 | 38.53 | 5.88 | 4.27 | 27.18 | 5.06 | 3.21 |
| Nyx | 9.55 | – | – | 0.86 | – | – | 0.78 | – | – |
| Nyx Fast | 17.94 | – | – | 19.64 | – | – | 17.39 | – | – |
| Rhea | – | – | 2.76 | – | – | 3.20 | – | – | 2.81 |
| RXL | – | – | 3.00 | – | – | 3.06 | – | – | 2.74 |
| Hyperion HDR | 18.96 | – | – | 19.39 | – | – | 18.76 | – | – |
| Apollo | 20.65 | – | – | 33.49 | – | – | 28.35 | – | – |
| Aion | 25.12 | – | – | 25.06 | – | – | 22.73 | – | – |
| APFast | 30.71 | – | – | 43.90 | – | – | 38.21 | – | – |
| Chronos | 14.10 | – | – | 20.43 | – | – | 18.25 | – | – |
| CHFast | 21.45 | – | – | 30.88 | – | – | 26.17 | – | – |
PCMark 10
PCMark 10 is an industry-standard benchmark designed to measure complete system performance for modern office environments. It features updated workloads for Windows 10 and evaluates everyday tasks, including productivity, web browsing, video conferencing, and content creation. The benchmark is easy to run, delivers multi-level scoring (from high-level overall to detailed workload scores), and includes dedicated battery life and storage tests. While UL Solutions now recommends Procyon for newer, application-based testing, PCMark 10 remains a reliable and widely-used tool for assessing general PC performance.
PCMark 10 results show the ThinkPad P16 Gen 3 delivering the highest overall system score among the tested systems, with a score of 10,618. This suggests excellent responsiveness across everyday workloads, including productivity applications, content creation, and web tasks.
| PCMark 10 (higher is better) | Lenovo ThinkPad P16 Gen 3 (Intel Ultra 9 275HX)(NVIDIA RTX PRO 5000) | Dell Pro Max 18 Plus (Intel Core Ultra 9 285HX)(NVIDIA RTX PRO 5000) | HP ZBook Fury G1i (Intel Core Ultra 9 285HX)(NVIDIA RTX PRO 5000) |
|---|---|---|---|
| Score | 10,618 | 8,581 | 8,667 |
3DMark CPU
The 3DMark CPU Profile evaluates processor performance across six threading levels: 1, 2, 4, 8, 16, and max threads. Each test runs the same boid-based simulation workload to assess how well the CPU scales under different thread counts, with minimal GPU involvement. The benchmark helps identify single-thread efficiency as well as multithreaded potential for tasks like gaming, content creation, and rendering. Scores across eight threads often align with modern DirectX 12 gaming performance, while 1–4-thread results reflect older or esports game scenarios.
The Lenovo ThinkPad P16 Gen 3 performs particularly well on mid-range thread workloads, such as 8-thread and 16-thread tests, where it either matches or exceeds competing systems. At maximum thread count, the Dell system pulls ahead slightly, again reflecting the advantage of the newer processor. Overall, the P16 still delivers strong CPU scalability across different workloads.
| 3DMark CPU (Higher Score is Better) | Lenovo ThinkPad P16 Gen 3 (Intel Ultra 9 275HX)(NVIDIA RTX PRO 5000) | Dell Pro Max 18 Plus (Intel Core Ultra 9 285HX)(NVIDIA RTX PRO 5000) | HP ZBook Fury G1i (Intel Core Ultra 9 285HX)(NVIDIA RTX PRO 5000) |
|---|---|---|---|
| Max Threads | 14,868 | 16,497 | 16,297 |
| 16 Threads | 13,785 | 13,224 | 13,868 |
| 8 Threads | 8,433 | 7,658 | 7,275 |
| 4 threads | 4,758 | 4,583 | 4,865 |
| 2 threads | 2,458 | 2,435 | 2,476 |
| 1 threads | 1,267 | 1,234 | 1,264 |
3DMark Storage
The 3DMark Storage Benchmark tests your SSD’s gaming performance by measuring tasks like loading games, saving progress, installing game files, and recording gameplay. It evaluates how well your storage performs in real-world gaming scenarios and supports the latest storage technologies to provide accurate performance insights.
Here, the ThinkPad P16 Gen 3 scores 1,945, slightly behind the Dell and HP systems. Despite this difference, the score still yields high-performance NVMe storage that can easily handle demanding workloads such as game installs, large asset loading, and data streaming. The strong sequential speeds seen earlier in the Blackmagic test further confirm that storage performance on the P16 remains very fast.
| 3DMark Storage (higher is better) | Lenovo ThinkPad P16 Gen 3 (Intel Ultra 9 275HX)(NVIDIA RTX PRO 5000) | Dell Pro Max 18 Plus (Intel Core Ultra 9 285HX)(NVIDIA RTX PRO 5000) | HP ZBook Fury G1i (Intel Core Ultra 9 285HX)(NVIDIA RTX PRO 5000) |
|---|---|---|---|
| Score | 1,945 | 2,368 | 2,304 |
PCMark battery
To measure battery life on mobile systems, we use PCMark 10. It includes a Modern Office benchmark, providing a realistic assessment of battery life during typical workday tasks. It simulates everyday office activities, such as writing documents, browsing the web, and participating in video conferences, with built-in periods of inactivity to mirror how people use their laptops. This isn’t just about peak performance; it focuses on sustained usage under a moderate workload. It is helpful for understanding how long you can expect a laptop to last through a day of office work.
The test operates in 10-minute cycles, balancing active tasks with periods of inactivity. Specifically, the Writing and Web Browsing workloads involve roughly 4.5 minutes of activity followed by 5.5 minutes of inactivity, while Video Conferencing is lighter, at 2 minutes of busy time and 8 minutes of idle time. This approach aims to provide a more accurate representation of real-world battery drain than running demanding tasks continuously, giving you a better idea of longevity for everyday productivity.
Battery testing shows strong results for the ThinkPad P16 Gen 3, which lasts roughly 7 hours on the PCMark Modern Office workload. This significantly exceeds both the Dell and HP systems, which fall under five hours in the same test. For a mobile workstation with high-end CPU and GPU hardware, this is a very respectable result and suggests Lenovo has tuned the system well for efficiency during lighter productivity tasks.
| Pcmark Battery (higher is better) | Lenovo ThinkPad P16 Gen 3 (Intel Ultra 9 275HX)(NVIDIA RTX PRO 5000) | Dell Pro Max 18 Plus (Intel Core Ultra 9 285HX)(NVIDIA RTX PRO 5000) | HP ZBook Fury G1i (Intel Core Ultra 9 285HX)(NVIDIA RTX PRO 5000) |
|---|---|---|---|
| Time Elapsed | 7 Hr | 3 Hr 39 Min | 4 Hr 48 Min |
Conclusion
The Lenovo ThinkPad P16 Gen 3 is a powerful mobile workstation that balances strong GPU performance, modern platform features, and workstation-class expandability in a relatively portable 16-inch form factor. Built around Intel’s Core Ultra 9 275HX and NVIDIA’s RTX PRO 5000 with 24GB of GDDR7 memory, the system is designed for professionals running GPU-accelerated workloads such as 3D rendering, AI inference, simulation, and high-resolution media production.
Across our benchmark suite, the P16 Gen 3 consistently performed in the same class as the Dell Pro Max 18 Plus and HP ZBook Fury G1i systems equipped with the newer Core Ultra 9 285HX processor. In many CPU-heavy tests, the newer processor holds a modest lead, evident in workloads such as AI inference, rendering, and compression. However, the differences are generally incremental rather than too noticeable, and the P16 often lands between the two competing systems. GPU-driven workloads remain highly competitive thanks to the RTX PRO 5000, and the system even leads in certain cases, such as the Blender viewport trace in SPECviewperf. The new Lenovo system also shows strong platform balance. Storage performance from the PCIe Gen5 NVMe drive approaches 8 GB/s for reads, ensuring fast handling of large project datasets and media files. Memory expandability up to 192GB across four SO-DIMM slots provides the system with ample flexibility for demanding workloads such as large CAD assemblies, simulation datasets, and virtualized development environments.
In our PCMark Modern Office test, the P16 reached roughly seven hours of runtime, noticeably exceeding both comparison systems. For a workstation-class laptop with an HX processor and high-end GPU, that efficiency is pretty impressive. It makes the system more practical for meetings, travel, and remote work between heavier workloads.
Overall, the ThinkPad P16 Gen 3 may not have claimed the top position in many of our benchmarks, but it consistently belonged in the same performance tier as its competitors. Combined with its excellent display, powerful GPU resources, ample memory, and modern I/O, it delivers a highly capable workstation platform for engineers, creators, and developers.


 Amazon