

After publishing our article about Microsoft’s opt-in native NVMe feature on Windows Server 2025, we received multiple requests for a direct comparison of storage performance between Windows Server 2025 with native NVMe and a Linux-based server OS. One especially enthusiastic Redditor even offered us beer to do it! Since there were obviously no other reasonable options, we decided to run the same tests on Linux.

A Long Time Ago, in an OS Version Far, Far Away
The Linux kernel has supported NVMe since version 3.3, released in March 2012. Similarly, the protocol has been supported on Windows Server (non-natively, via SCSI translation) since 2012 R2, around October 2013. More than a decade later, users are still debating whether Windows or Linux is better for storage, so we thought we’d add some more fuel to the fire with benchmark results comparing the two.
Since we have test results for Windows Server 2025 using both non-native and native storage stacks, we thought it was appropriate to evaluate two storage stacks on Linux. For our FIO benchmarks, we used both libaio and io_uring, two of the most popular APIs for storage transactions. While io_uring is considerably newer and provides many improvements for asynchronous I/O, libaio remains widely used for its flexibility and ease of use (Didona, Pfefferle, Ioannou, Metzler, & Trivedi, 2022). Complete architecture overviews for both stacks are beyond the scope of this article, but we are still providing results for a direct comparison.
Testing NVMe on Ubuntu Server 24.04.4 LTS
Our hardware platform for this comparison is the same server used in our Windows Server 2025 native NVMe article. To ensure maximum throughput and consistent results, it is equipped with two 128-core AMD EPYC 9754 CPUs, 768GB of DDR5 memory at 4800 MT/s, and fifteen 30.72 TB Solidigm P5316 NVMe SSDs with PCIe 4.0 in a JBOD configuration.
As we mentioned in our previous article, the Solidigm P5316 has an indirection unit size of 64 kilobytes, which means write performance for smaller sizes (such as 4K tests) is often worse than expected. Once again, we ran different test patterns at block sizes of 4K, 64K, and 128K to provide a broad range of results for read and write operations.
We selected Ubuntu Server 24.04.4 LTS as our Linux example because of its popularity and long-term support. It runs on the Linux kernel 6.8 by default, which isn’t the newest or most advanced, but likely represents a large portion of installations worldwide.
Highlights
- Windows Server 2025 native NVMe wins in three out of four read performance benchmarks
- Lower CPU usage observed with Windows Server during most tests
- Ubuntu Server 24.04.4 LTS wins in three out of four write performance benchmarks
| Metric | Random 4K | Random 64K | ||||||
|---|---|---|---|---|---|---|---|---|
| Windows Non-Native | Windows Native | Linux libaio | Linux io_uring | Windows Non-Native | Windows Native | Linux libaio | Linux io_uring | |
| Random Read | ||||||||
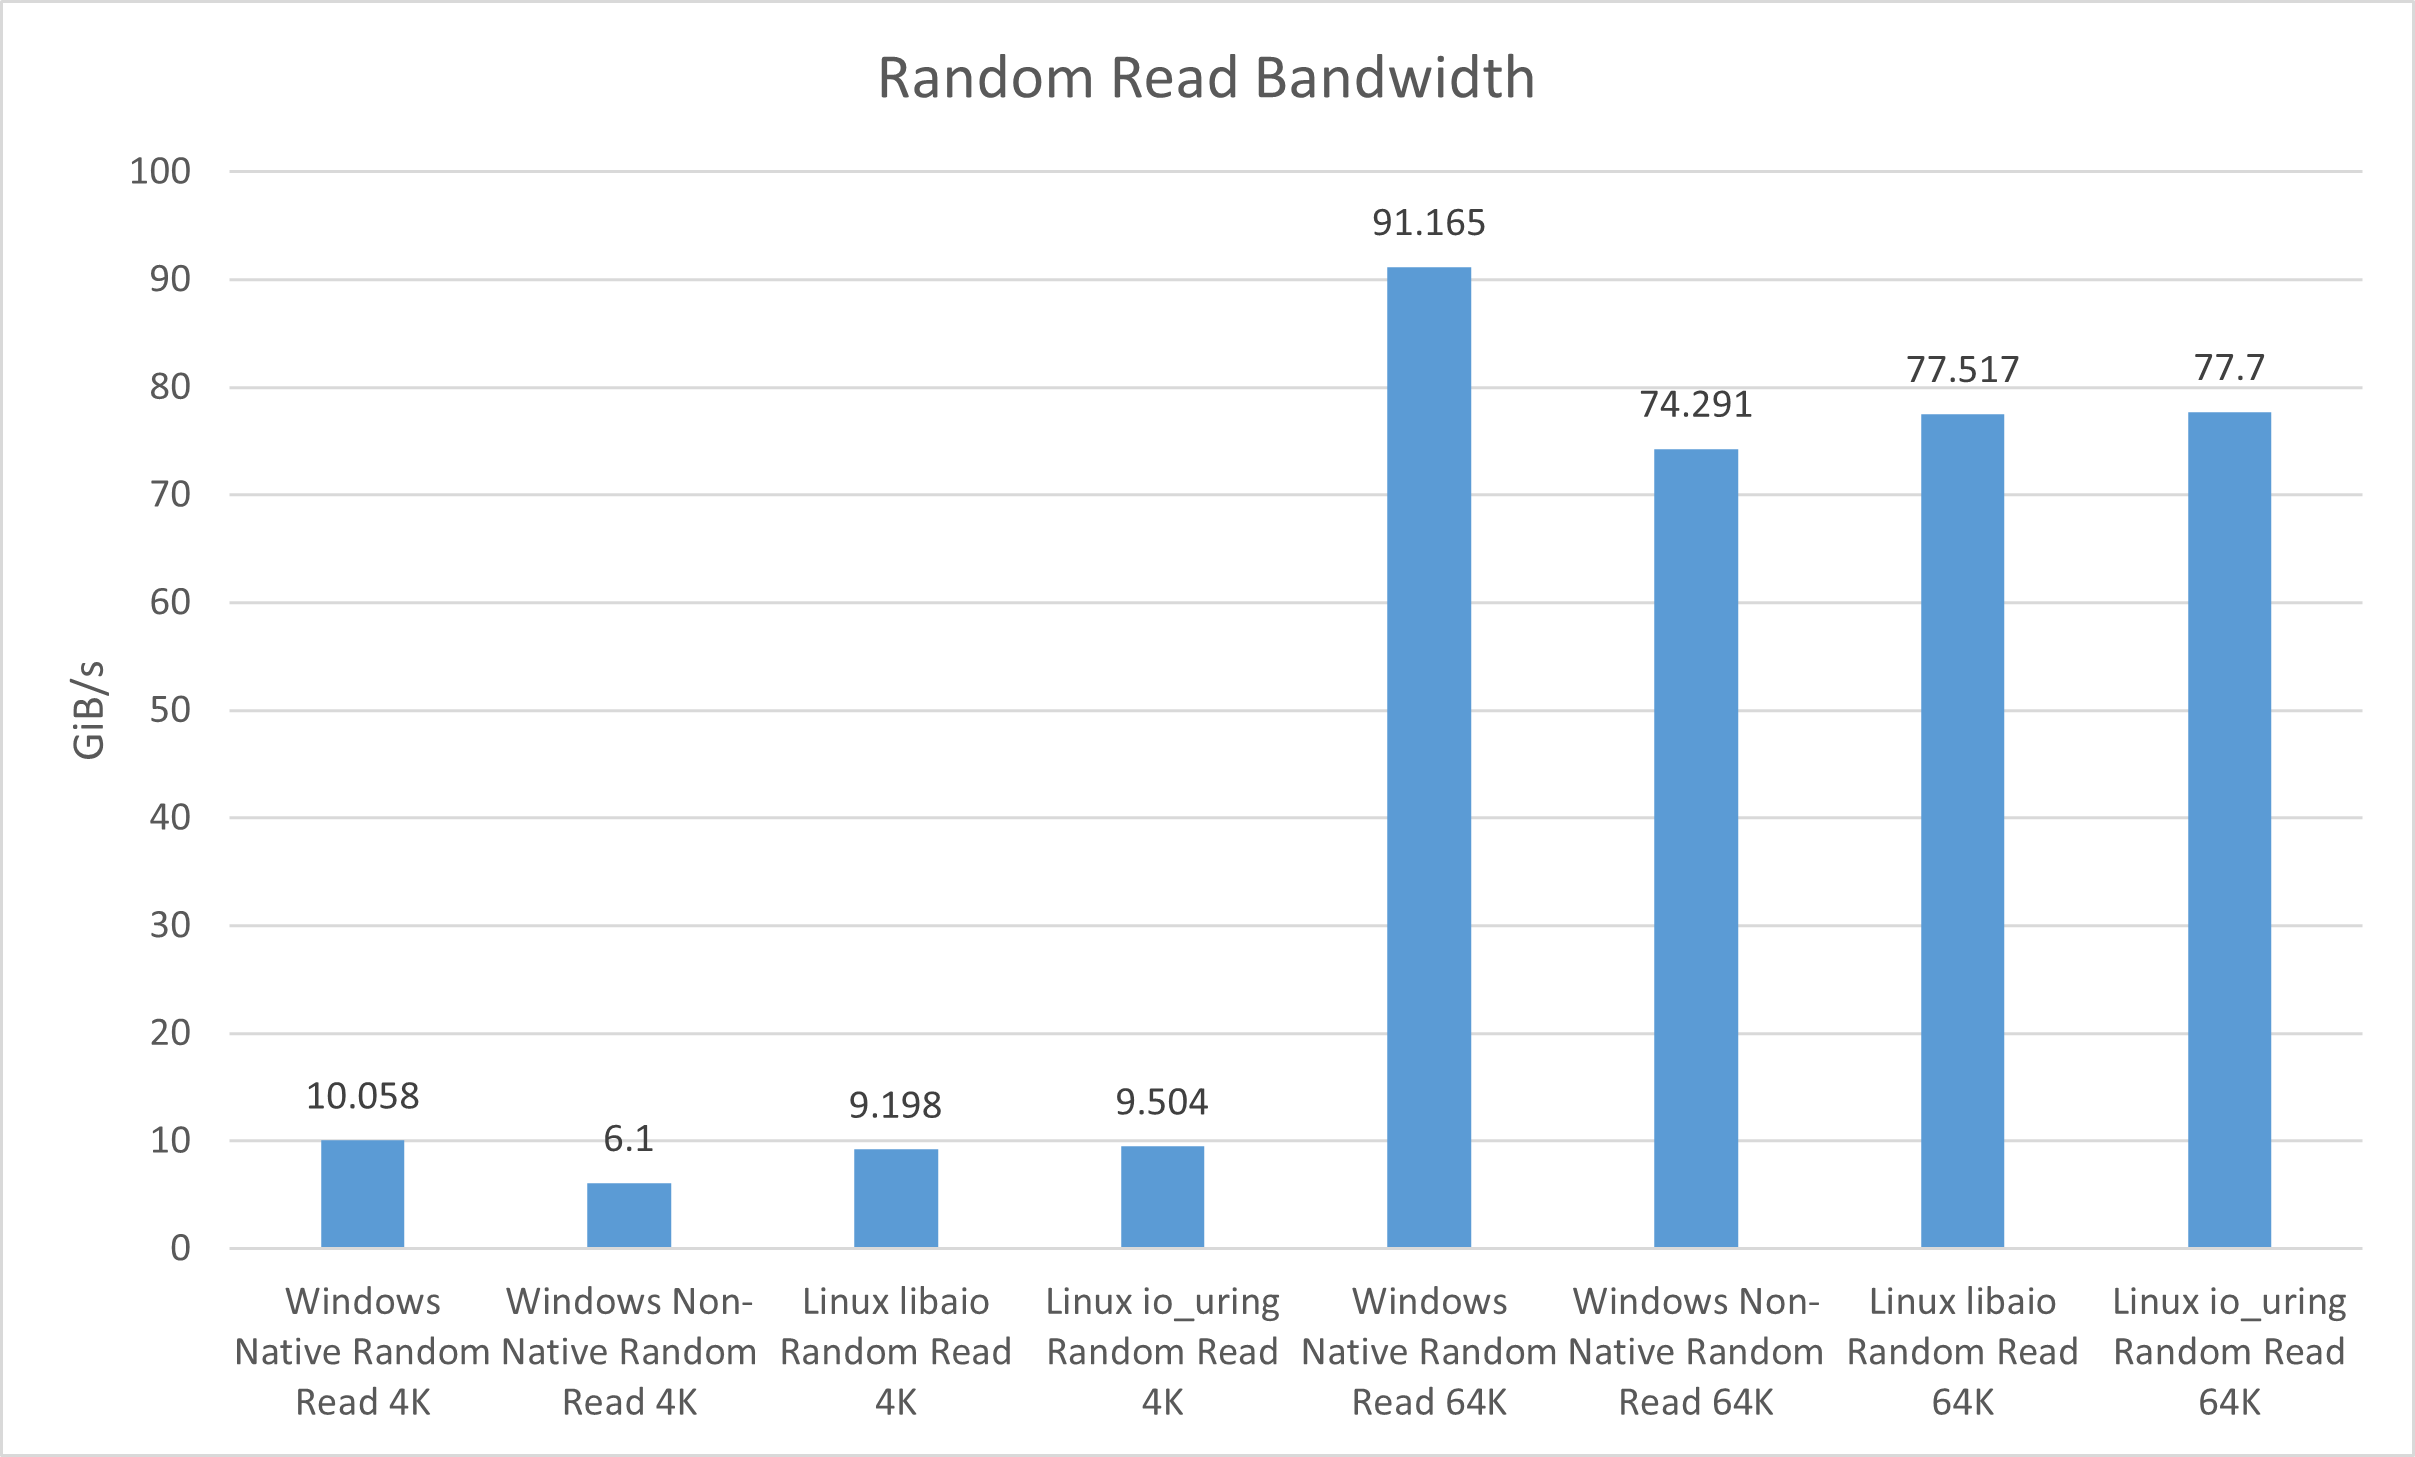
| Bandwidth (GiB/s) | 6.1 | 10.058 | 9.198 | 9.504 | 74.291 | 91.165 | 77.517 | 77.7 |
| IOPS | 1,598,959 | 2,636,516 | 2,411,000 | 2,491,000 | 1,217,176 | 1,493,637 | 1,270,000 | 1,273,000 |
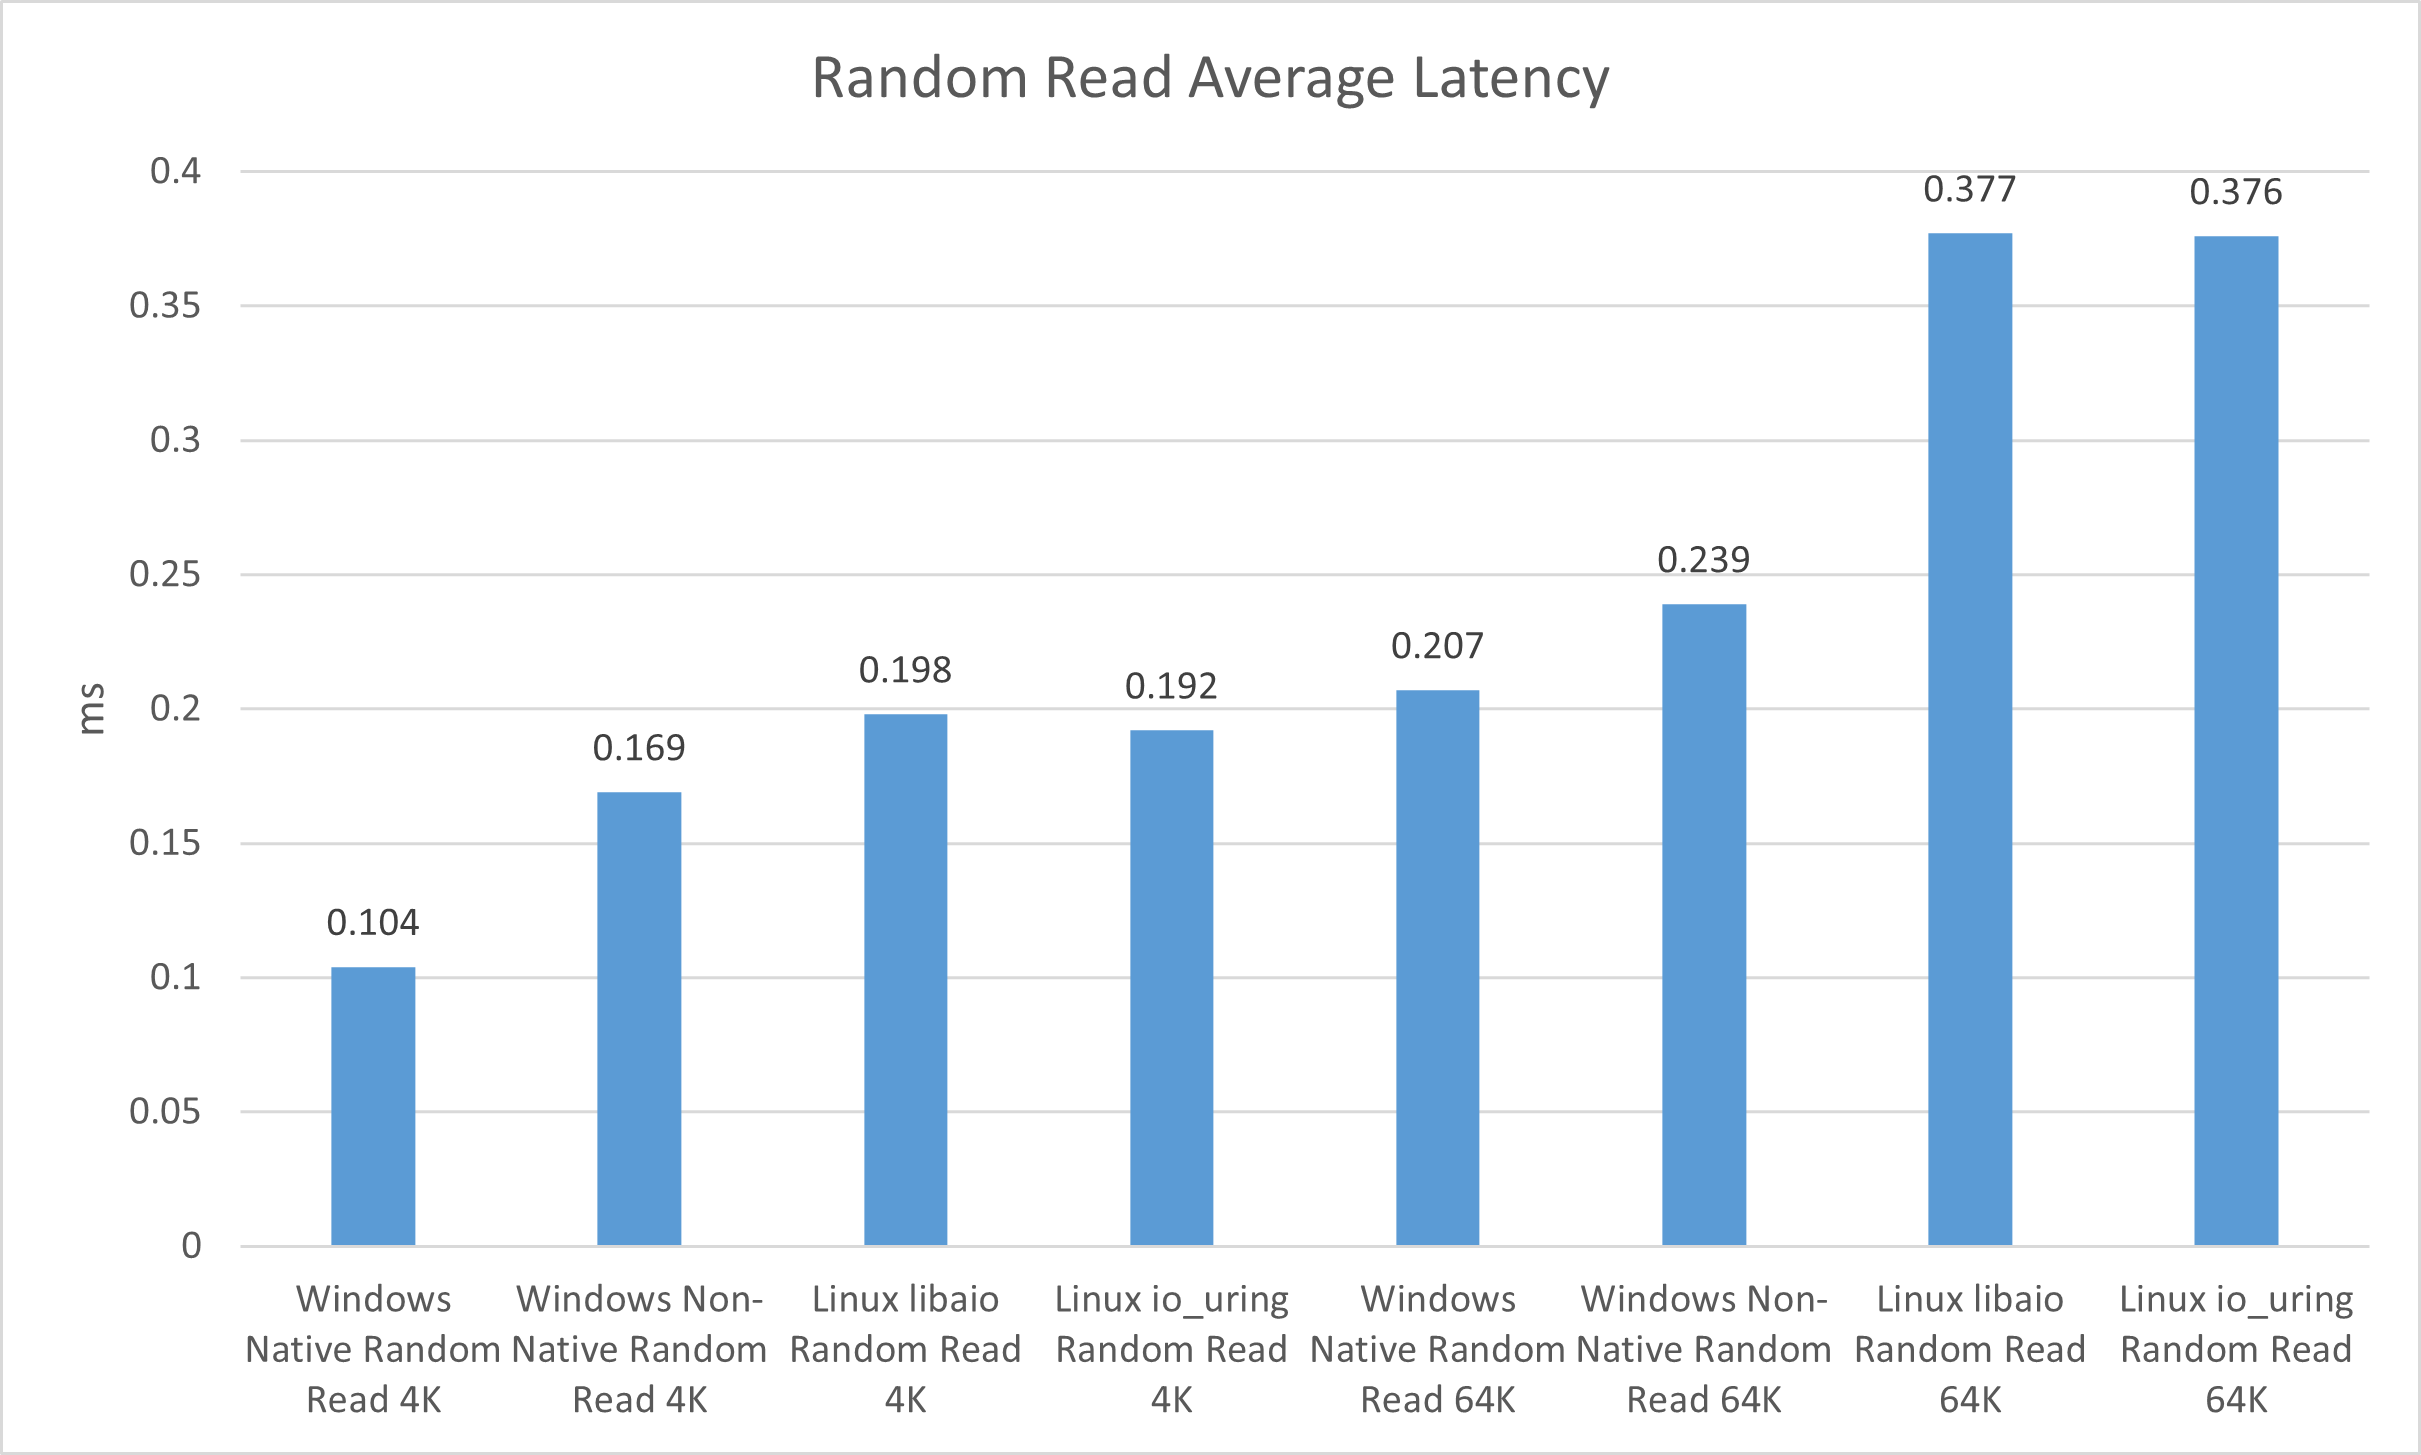
| Average latency (ms) | 0.169 | 0.104 | 0.198 | 0.192 | 0.239 | 0.207 | 0.377 | 0.376 |
| Total CPU Usage (%) | 72.67 | 74.22 | 99.77 | 99.76 | 68.44 | 65.11 | 83.16 | 84.72 |
| Metric | Sequential 64K | Sequential 128K | ||||||
|---|---|---|---|---|---|---|---|---|
| Windows Non-Native | Windows Native | Linux libaio | Linux io_uring | Windows Non-Native | Windows Native | Linux libaio | Linux io_uring | |
| Sequential Read | ||||||||
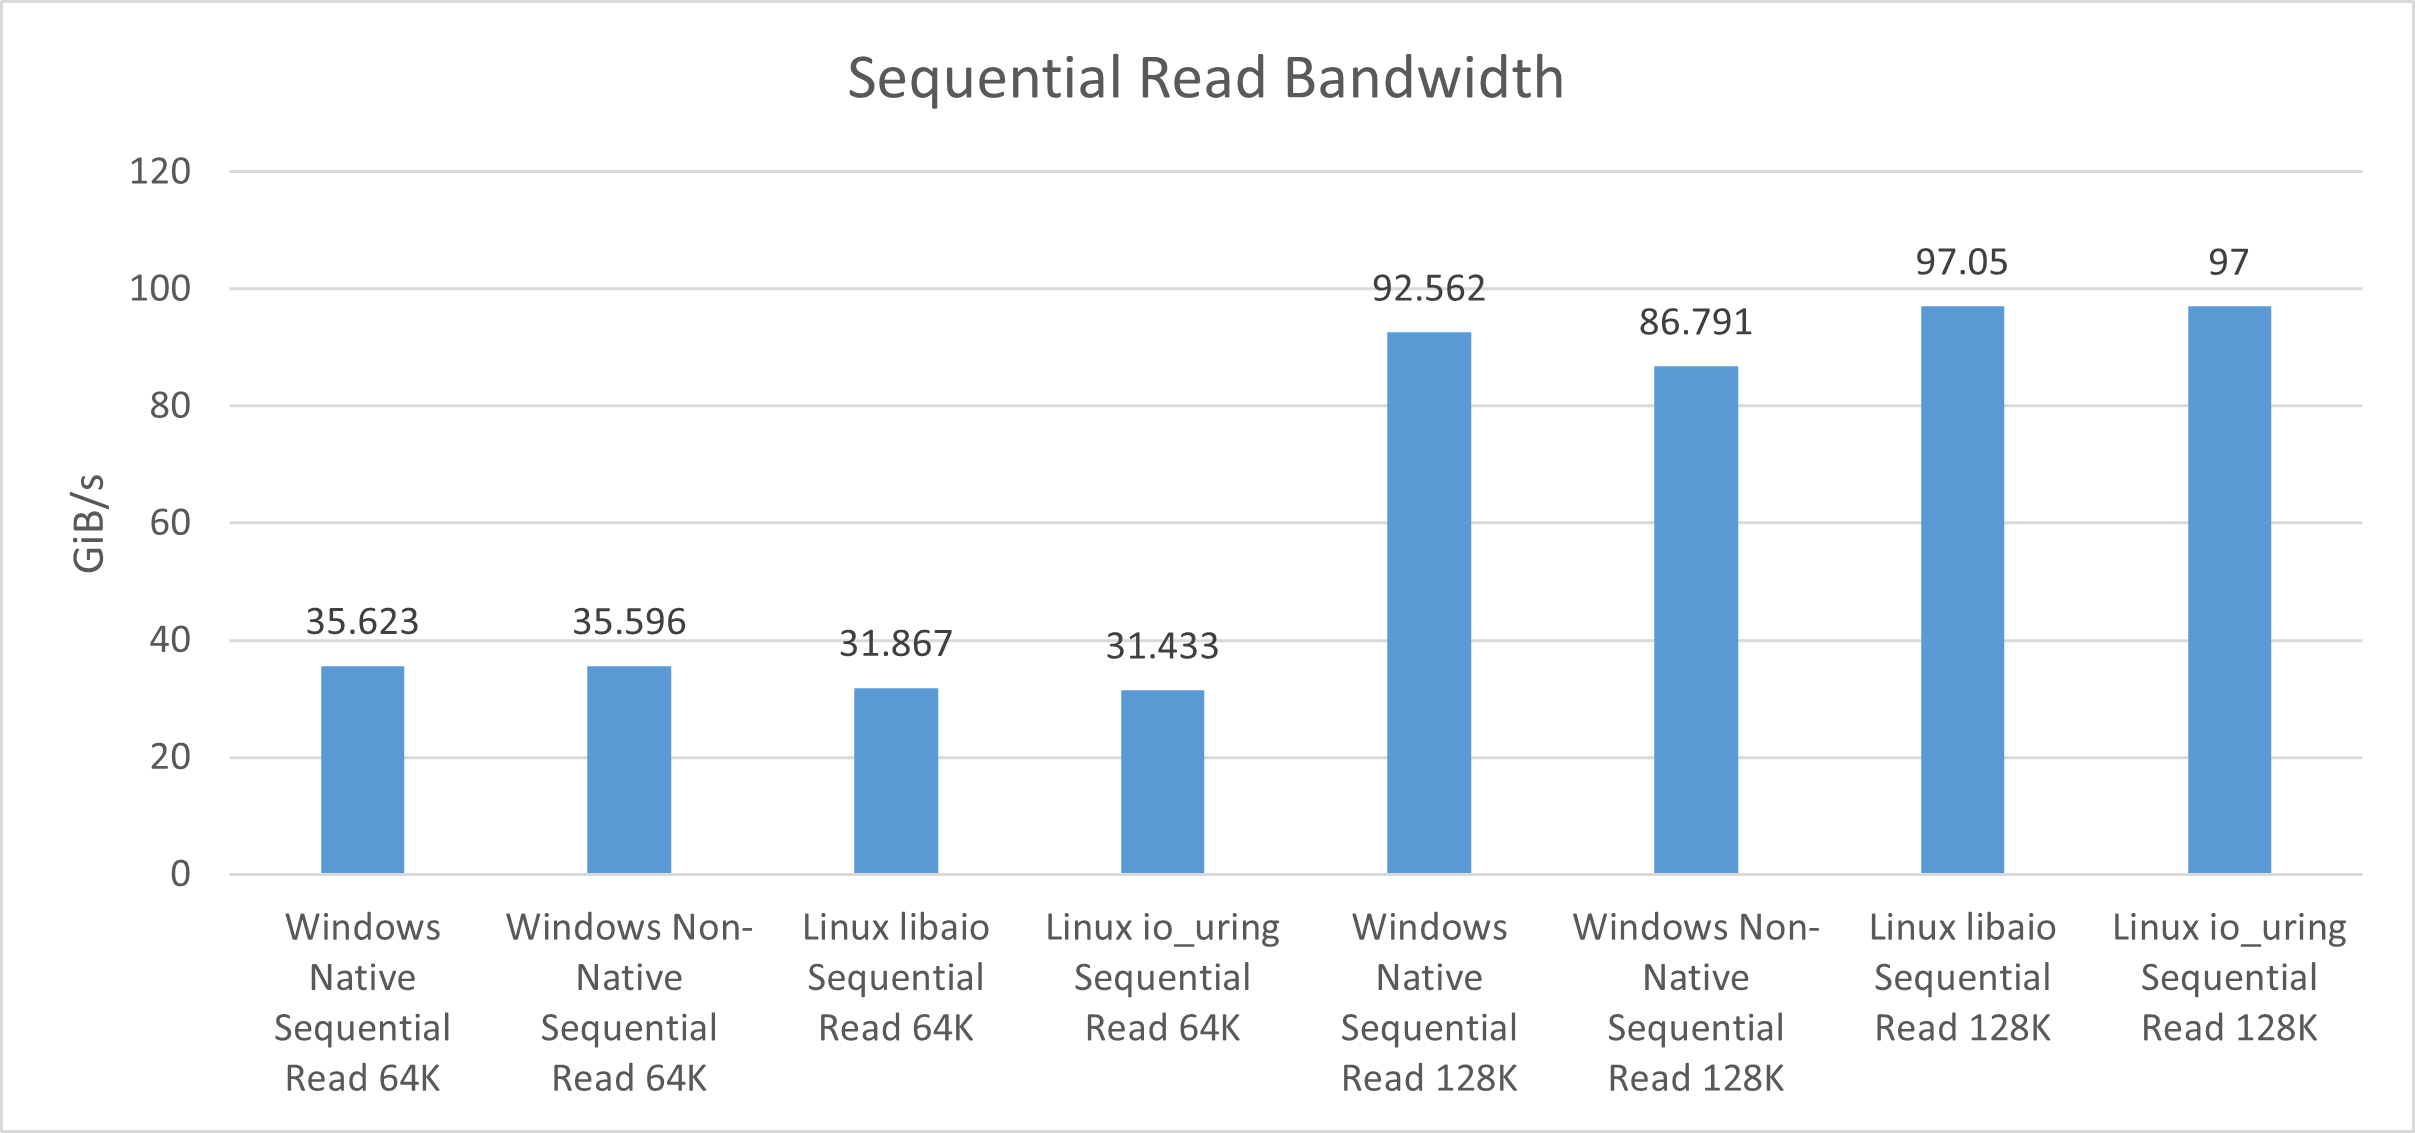
| Bandwidth (GiB/s) | 35.596 | 35.623 | 31.867 | 31.433 | 86.791 | 92.562 | 97.05 | 97 |
| IOPS | 583,192 | 583,638 | 522,000 | 515,000 | 710,978 | 758,252 | 795,000 | 795,000 |
| Average latency (ms) | 0.809 | 0.812 | 0.919 | 0.932 | 0.613 | 0.608 | 0.603 | 0.604 |
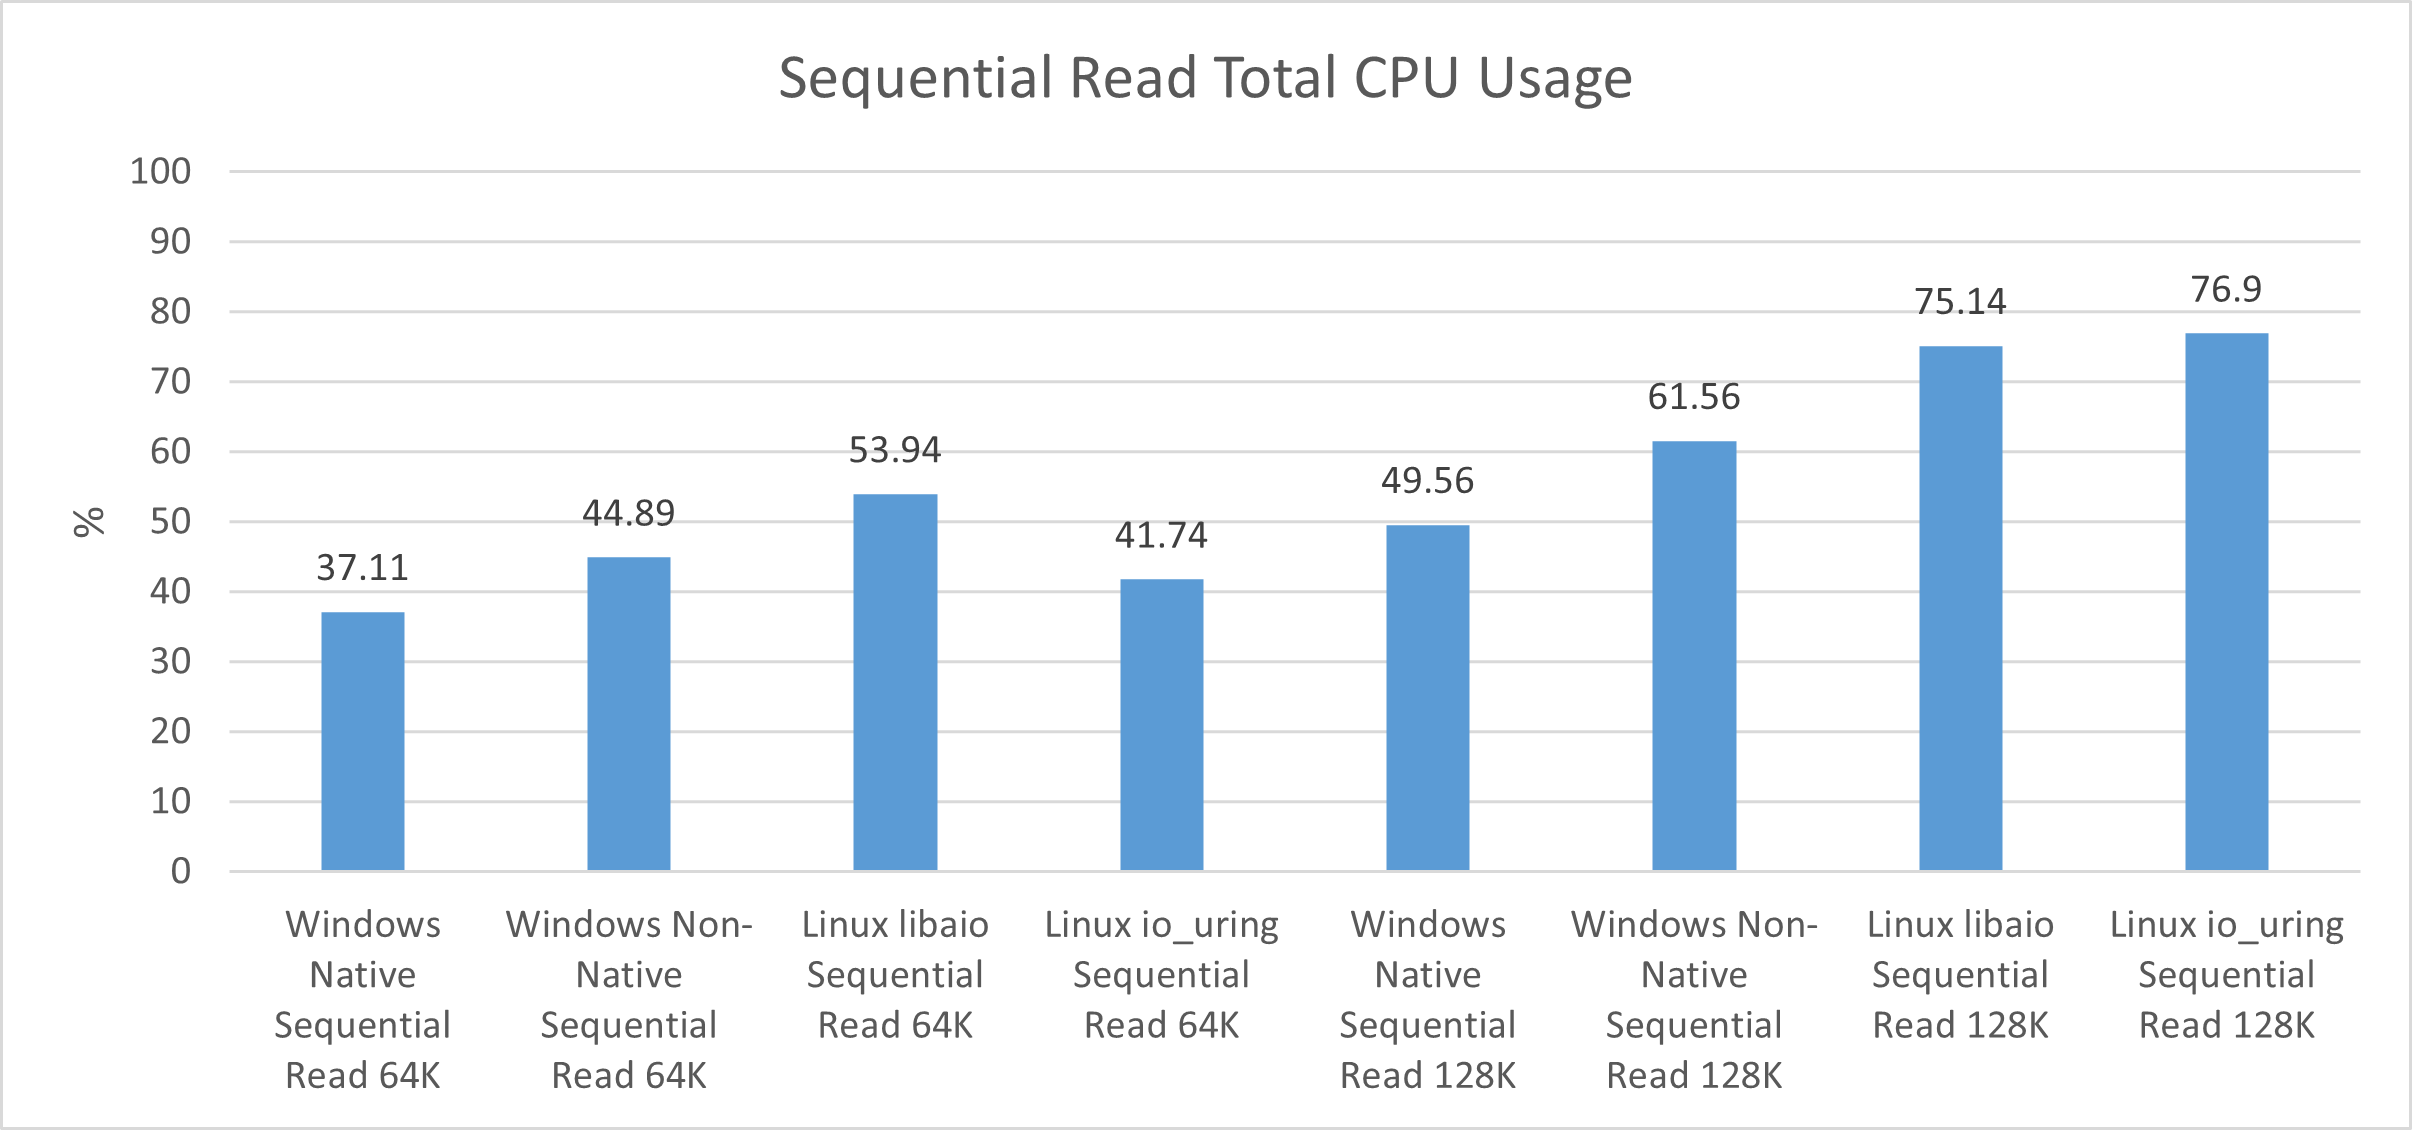
| Total CPU Usage (%) | 44.89 | 37.11 | 53.94 | 41.74 | 61.56 | 49.56 | 75.14 | 76.90 |
| Metric | Random 4K | Random 64K | ||||||
|---|---|---|---|---|---|---|---|---|
| Windows Non-Native | Windows Native | Linux libaio | Linux io_uring | Windows Non-Native | Windows Native | Linux libaio | Linux io_uring | |
| Random Write | ||||||||
| Bandwidth (GiB/s) | 1.803 | 1.756 | 1.876 | 1.815 | 7.654 | 7.655 | 7.652 | 7.651 |
| IOPS | 472,725 | 460,383 | 492,000 | 476,000 | 125,391 | 125,406 | 125,000 | 125,000 |
| Average latency (ms) | 0.992 | 1.028 | 0.974 | 1.007 | 3.814 | 3.816 | 3.827 | 3.828 |
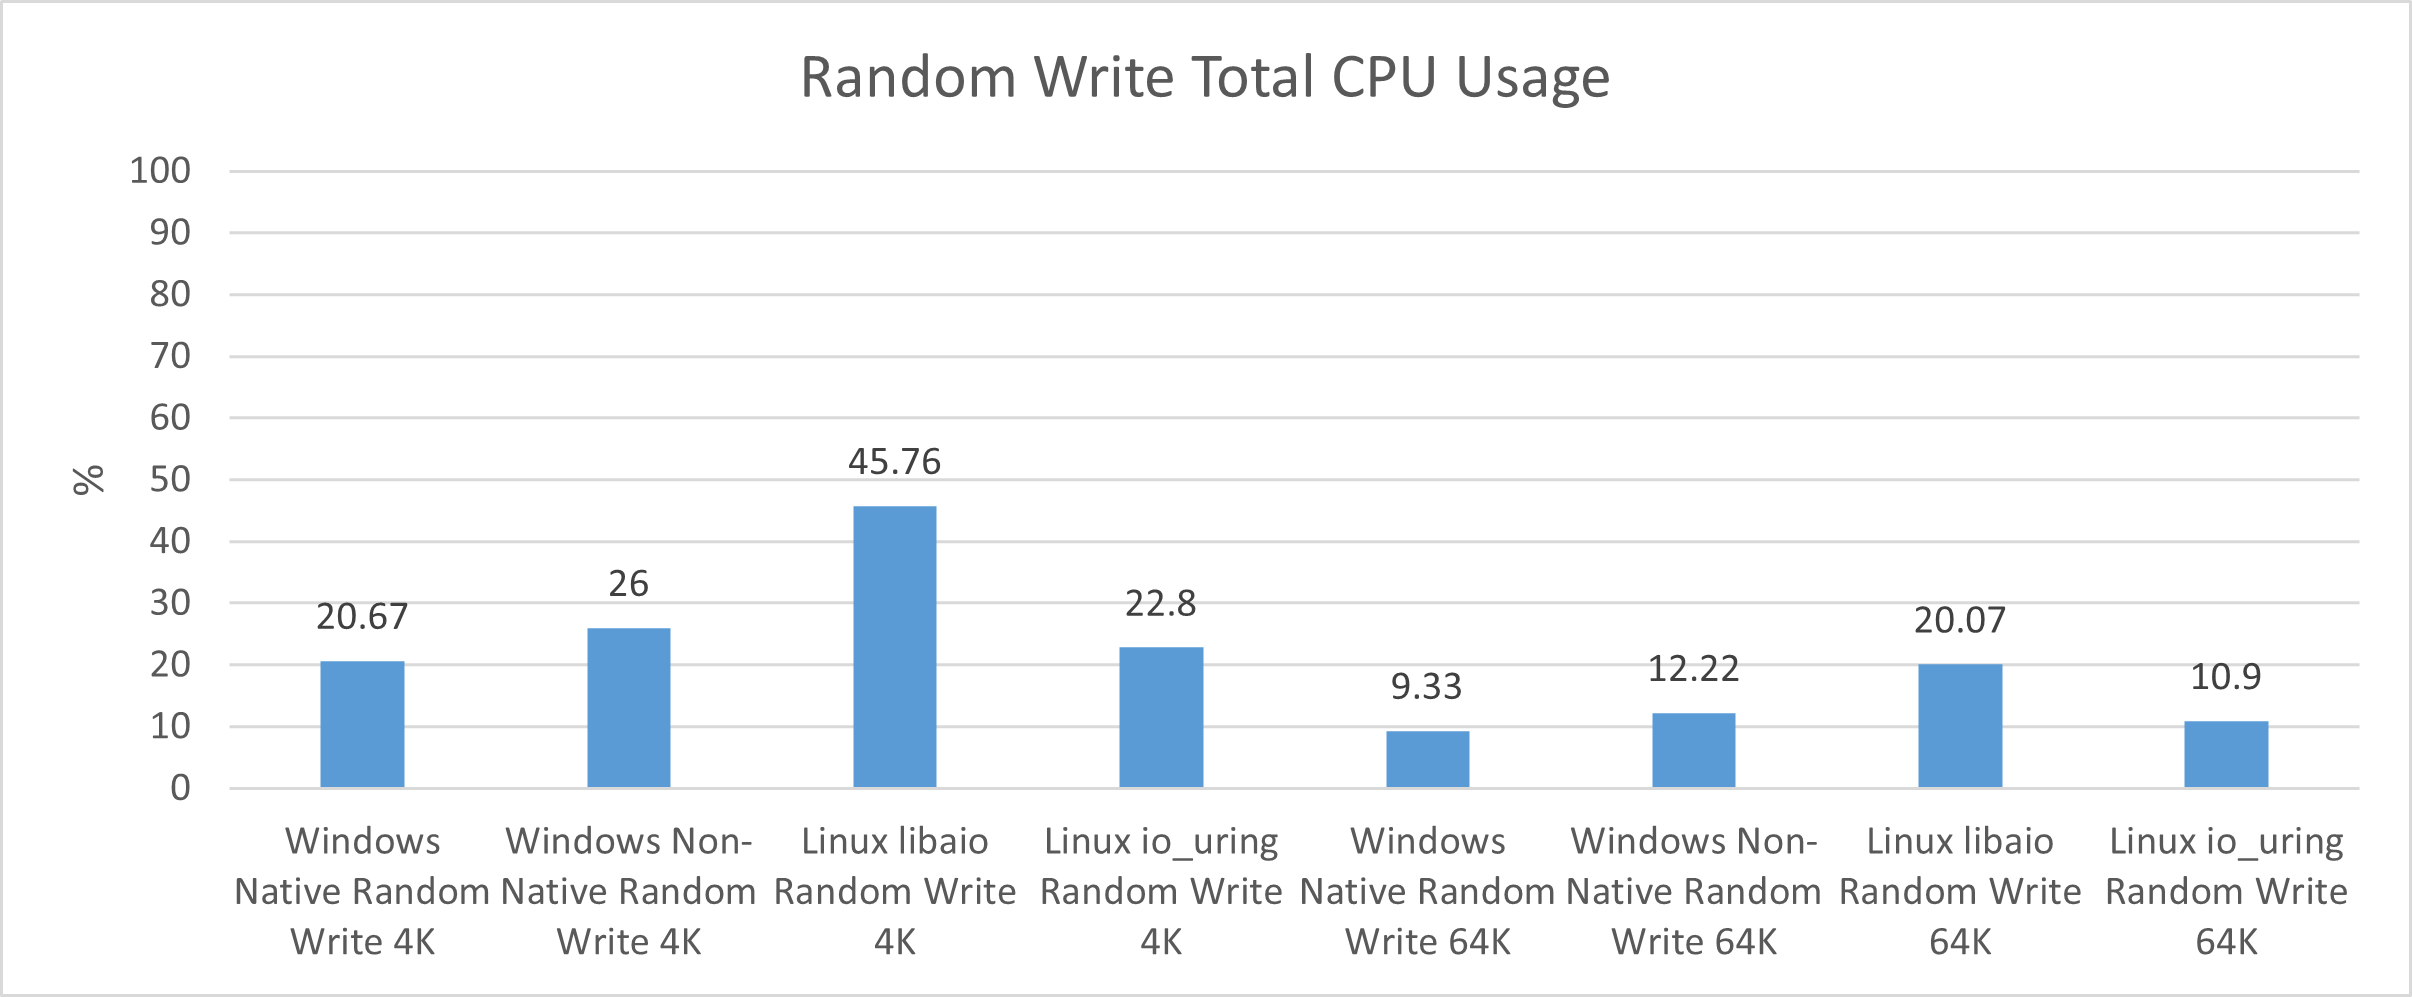
| Total CPU Usage (%) | 26.00 | 20.67 | 45.76 | 22.80 | 12.22 | 9.33 | 20.07 | 10.90 |
| Metric | Sequential 64K | Sequential 128K | ||||||
|---|---|---|---|---|---|---|---|---|
| Windows Non-Native | Windows Native | Linux libaio | Linux io_uring | Windows Non-Native | Windows Native | Linux libaio | Linux io_uring | |
| Sequential Write | ||||||||
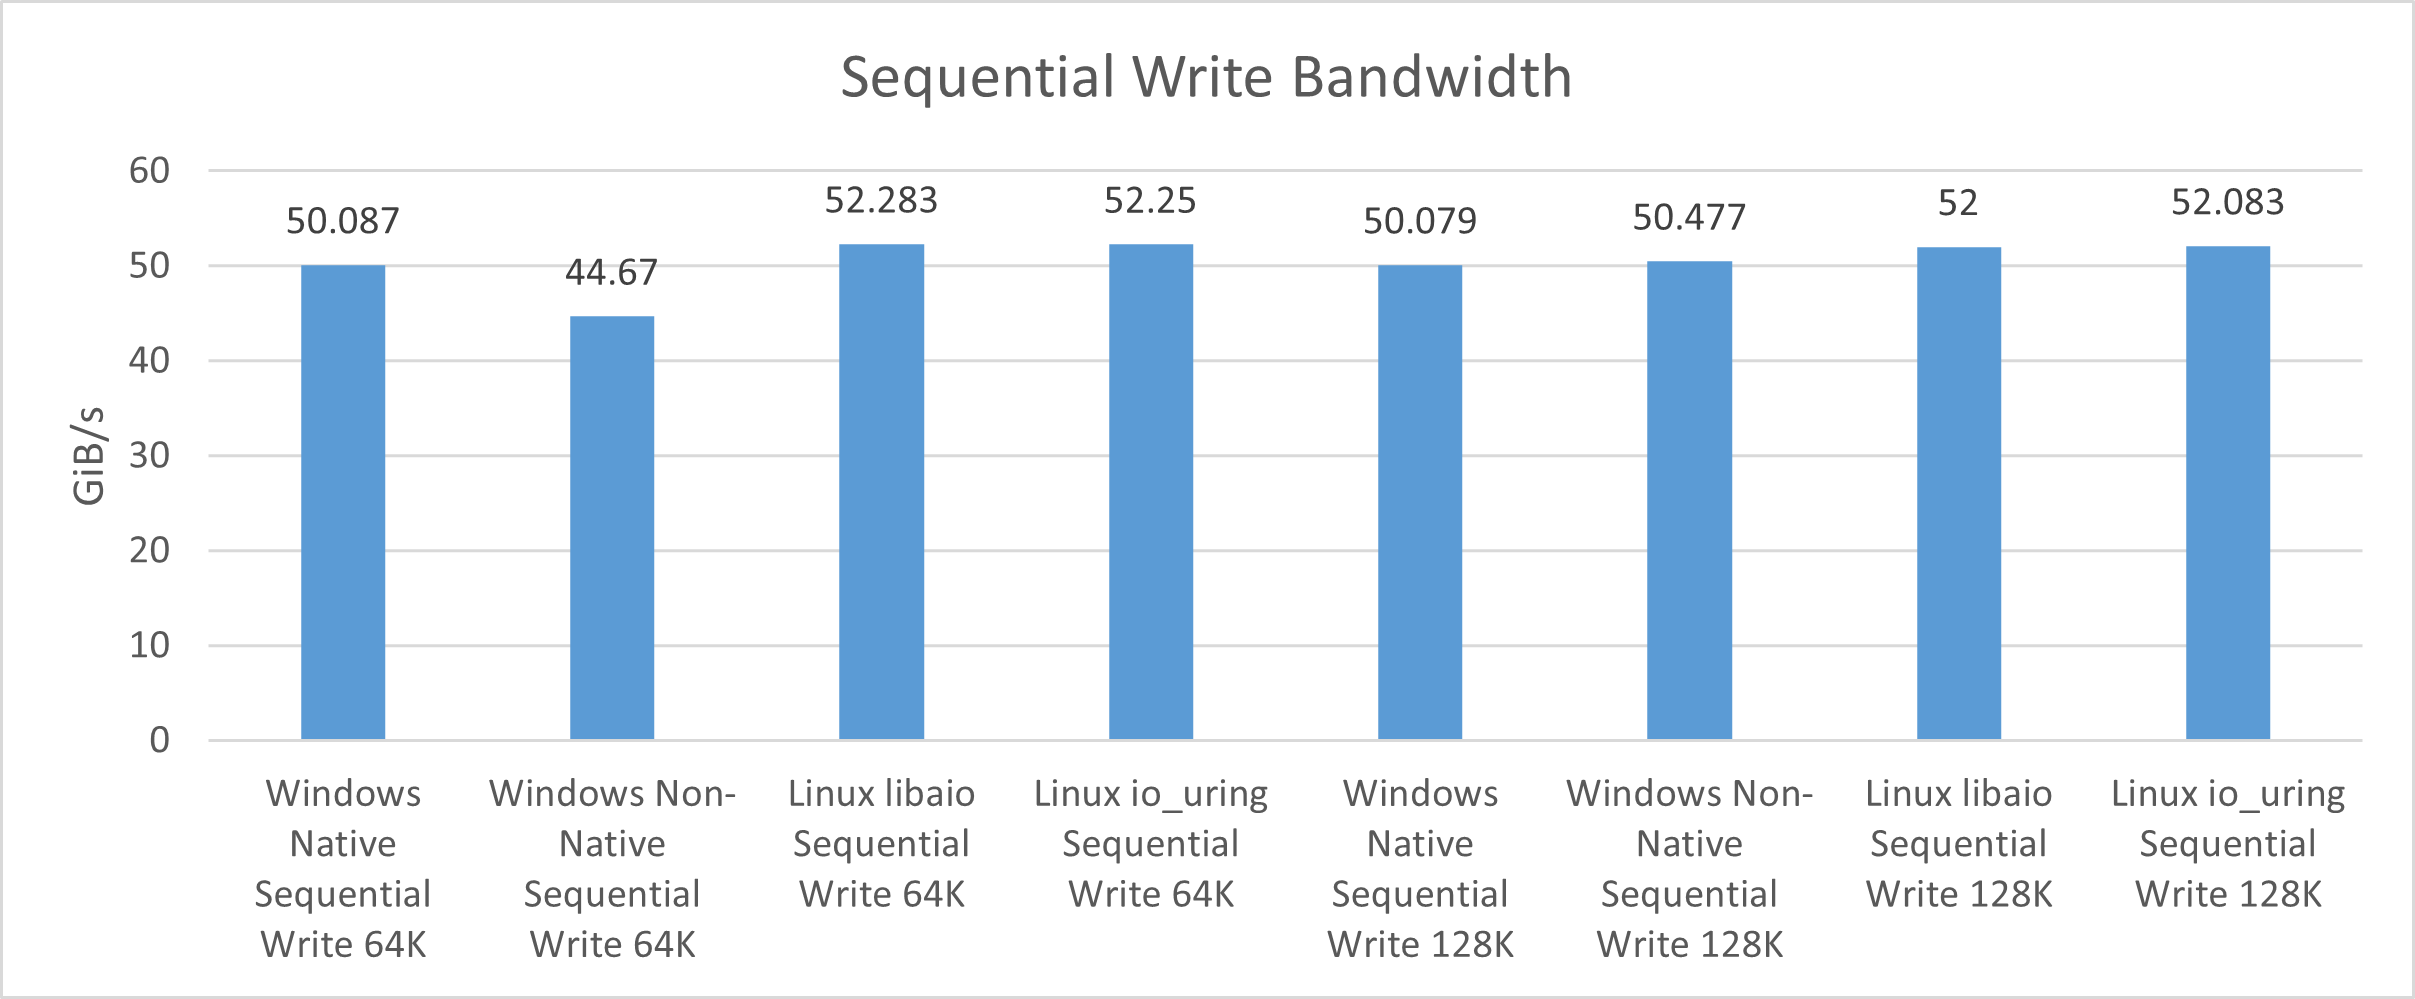
| Bandwidth (GiB/s) | 44.67 | 50.087 | 52.283 | 52.25 | 50.477 | 50.079 | 52 | 52.083 |
| IOPS | 731,859 | 820,603 | 856,000 | 856,000 | 413,495 | 410,232 | 426,000 | 427,000 |
| Average latency (ms) | 0.399 | 0.558 | 0.560 | 0.560 | 1.022 | 1.149 | 1.126 | 1.125 |
| Total CPU Usage (%) | 70.44 | 57.78 | 61.88 | 62.75 | 58.44 | 47.33 | 61.49 | 44.27 |
Note: Our Linux IOPS results are rounded to the nearest thousand due to differences in FIO reporting between Windows Server 2025 and Ubuntu Server 24.04.4 LTS. Bandwidth, latency, and CPU usage results are rounded consistently across both platforms.
The Numbers Don’t Lie
Immediately, we see that Ubuntu does not outperform Windows in every category. While libaio and io_uring delivered excellent throughput in our random-read bandwidth tests, they did not match the performance of Microsoft’s native NVMe stack. The Windows NT kernel beat the Linux kernel by about 17% in our random-read 64K tests, with a winning 91.165 GiB/s on native NVMe versus io_uring’s best of 77.7 GiB/s.
However, not all hope is lost for Torvalds’ technological terror. Ubuntu Server narrowly beat Windows Server in one of our read performance benchmarks: the sequential 128K test. Here, Linux’s libaio performed best at 97.05 GiB/s, compared to Windows’ native NVMe at 92.562 GiB/s, a difference of about 5%. This indicates that Linux may hold a slight edge when managing block sizes larger than the drives’ indirection units.
Random write bandwidth was consistent across both Linux and Windows, especially in 64K benchmarks. The best and worst results from those tests differed by only 0.05%, suggesting that all storage stacks realized the drives’ full potential.
Interestingly, the Linux 6.8 kernel claimed victory in sequential write bandwidth tests for block sizes of 64 K and 128 K. While the difference was not massive, the open-source software stacks beat Windows Server’s native NVMe by about 2 GiB/s in both cases.
Latency results generally followed throughput test results, shown best by the difference in random read averages. Unfortunately for Tux, libaio and io_uring had higher latency, with the largest difference of 0.17 ms between Windows Server native NVMe (0.207 ms) and libaio (0.377 ms) for 64 K random reads.
Perhaps the most shocking revelation from our benchmarks is the massive delta in CPU usage between Windows Server 2025 and Ubuntu Server 24.04.4 LTS. In three of four random and sequential-read benchmarks, Windows Server native NVMe had the lowest CPU usage. The most notable result was seen during the sequential read 128K benchmark run, where Windows used 27.34% less than Linux.
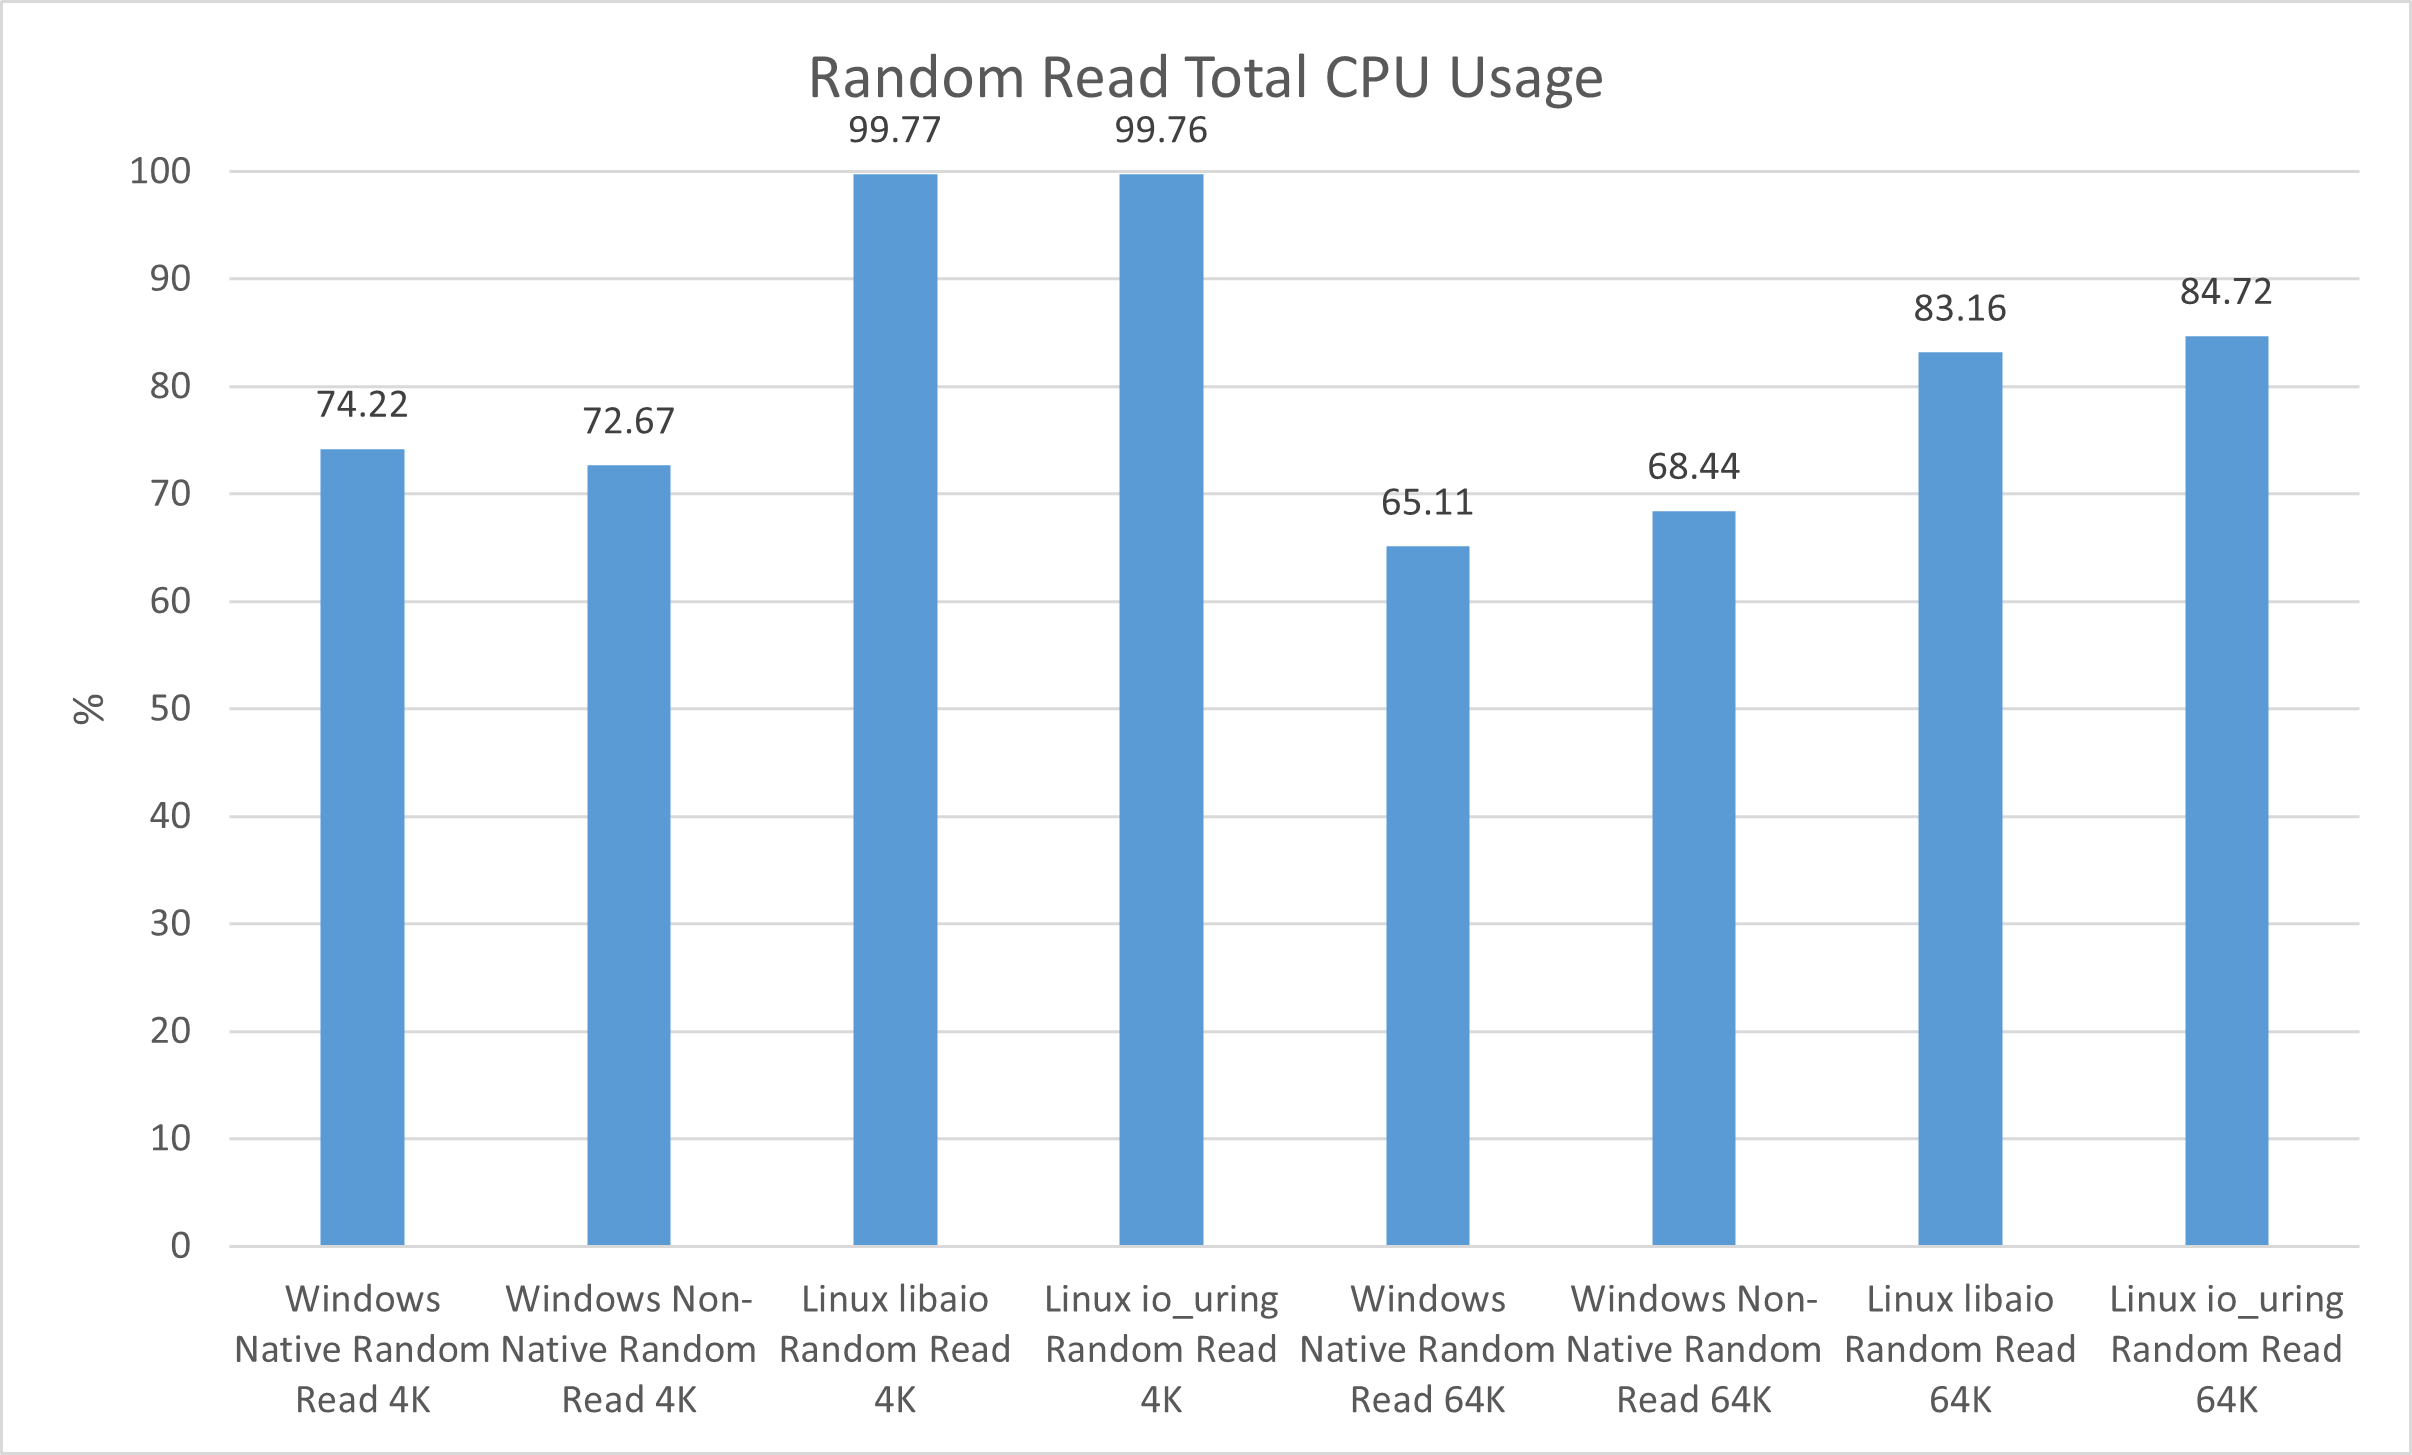
CPU usage with libaio and io_uring performed slightly better in random and sequential write tests, but it was still not enough to prevent native NVMe on Windows Server from winning in three of the benchmarks. A notable exception was libaio’s CPU usage during the random write 4K test, which reached 45.76% of the system’s CPU, while the other storage stacks hovered around 20%.
Winner Winner, CPU Dinner
As our results show, Windows Server and Ubuntu Server perform closely when tested head-to-head in both random and sequential performance tests at different block sizes. In terms of bandwidth, Windows Server 2025 with native NVMe generally outperformed Linux in most read tests, while Linux responded with slightly better results in our write tests. Our latency figures told a similar story, but the real highlight was Windows Server 2025’s CPU efficiency when using native NVMe.

Microsoft has clearly put effort into making their newest storage stack their best, and while it does not always win against libaio and io_uring, it puts up a good fight. While these results are not definitive across all use cases and server setups, they may help server administrators decide whether to deploy a Windows or Linux server when storage performance is more critical than OS compatibility.
Let us know what you think about these results by commenting on our social platforms or the SR Discord! Did you expect Windows Server to do so well in our tests, or were you rooting for Linux? Would you like to see more Linux server distributions or kernels tested? We’re always looking for your feedback, and reader-requested tests like these often become our favorite articles.
References
Didona, D., Pfefferle, J., Ioannou, N., Metzler, B., & Trivedi, A. (2022, June 13). Understanding Modern Storage APIs: A systematic study of libaio, SPDK, and io_uring. SYSTOR ’22, 120-121. Retrieved April 3, 2026, from https://atlarge-research.com/pdfs/2022-systor-apis.pdf


 Amazon