

The NetApp AFF A250 is an entry-level, end-to-end NVMe enterprise array. Embedded with NVMe SSDs on the back end and NVMe over FC host connectivity on the front end, the A250 is an incredible performer at an entry price point. This allows mid-size and small businesses to get the most out of their workloads at the edge.
Compared to the AFF A200, it offers an increase of 45% for performance with up to 33% more storage efficiency, which was easily demonstrated in our first review of the AFF A250. Our benchmarking results only emphasized this, demonstrating a huge step up from the last-gen model. This certainly isn’t surprising, as several of the NetApp systems we tested in the past took home our editor’s choice award.
Moreover, NetApp is one of the most consistent companies when it comes to replacing their older models for ones that better match the rapidly changing IT landscape. We always look forward to getting one of their new systems in our labs and expect an even better performance profile using NVMe over Fibre Channel (NVMe-oF), which we will be looking at in this review.
NetApp NVMe-oF – AFF A250 Components
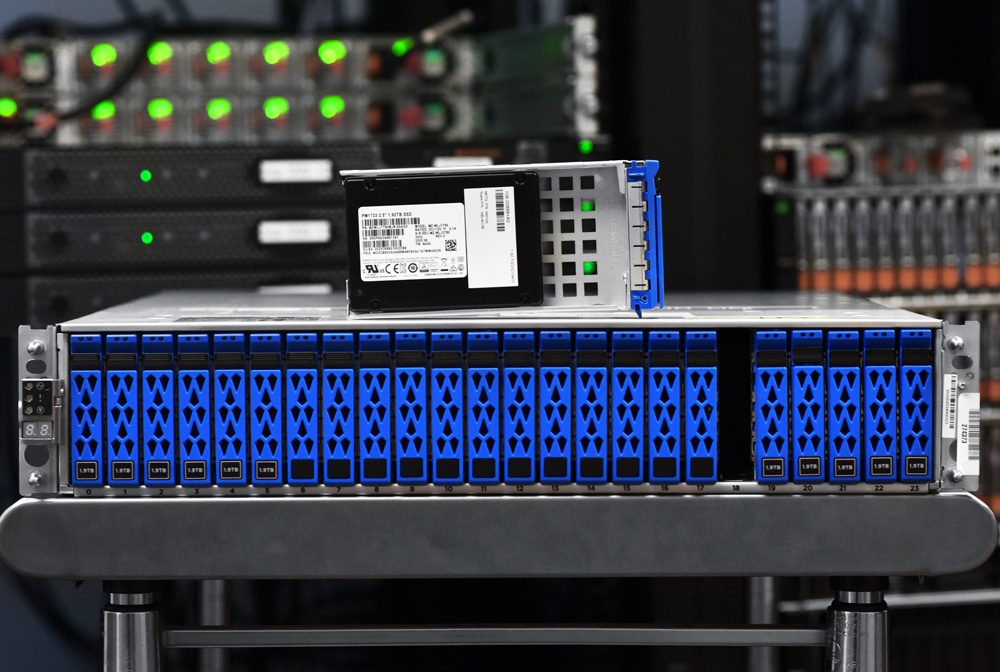
In order to hit this new bar in performance, the NetApp equipped the AFF A250 with 24-core CPUs and 128GB of memory per HA Pair, as well as the company’s NS224 storage shelf architecture. Internal storage supports up to 24 NVMe SSDs, though users can set it up with either 8, 12, or 24 drive configurations.
The internal SSDs can reach up to 15.3TB for each configuration or 24 external 30.2TB SSDs per controller. In addition, the A250 is outfitted with two 25Gb Ethernet ports for HA and cluster interconnects, two 10Gbase-T ports for host connectivity, and two mezzanine slots for I/O expansion. The A250 also supports SAS drives, with support of up to 30.6TB for each drive.
For a detailed rundown of its capabilities, potential use cases, and benefits, we encourage you to read our previous NetApp AFF A250 review.
ONTAP 9.9.1
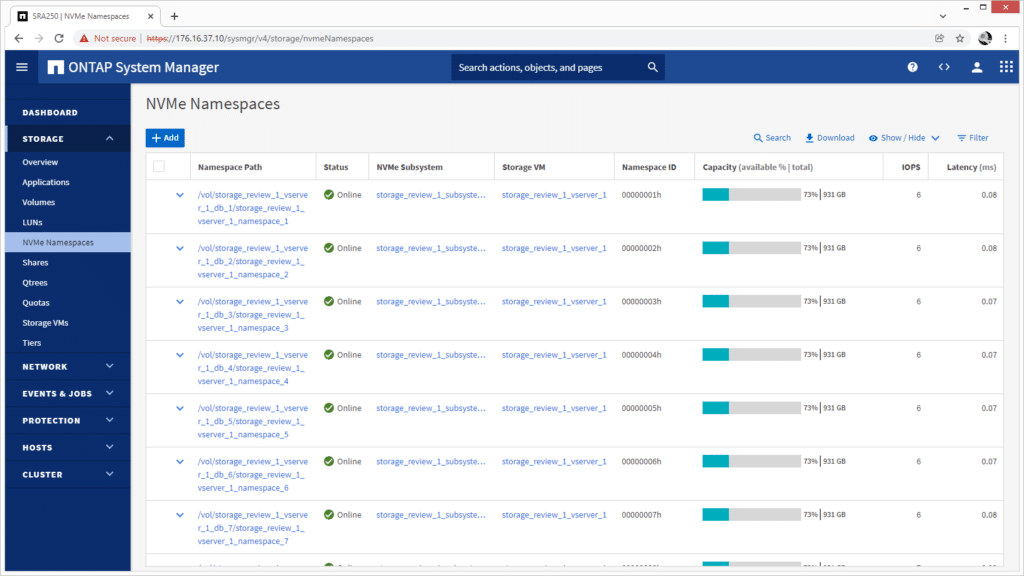
Looking at software, NetApp is now offering the AFF A250 with ONTAP 9.9.1. Our previous review of AFF A250 showcased version 9.8, an update that focused on simplifying the user experience. The newest version focuses on enhancements and additions to the system manager, SAN, data protection and more.
Highlights include:
- ONTAP also now supports up to 12 nodes, a huge step up from the previous releases in which an ASA could only be a two-node cluster. This means more scale-out for both performance and capacity.
- The System Manager in the newest version allows users to manually select the physical storage tier when provisioning new volumes. However, you can still choose to allow ONTAP to automatically make selections based on balanced placement logic.
- Other updates included revamping the GUI, which is comprised of changing the interface up a bit, adding new features and bringing back some missing functionality that was previously removed. For example, EMS events on the dashboard are now displayed after a user first logs in.
NetApp AFF A250 and NVMe over Fibre Channel (NVMe-oF)
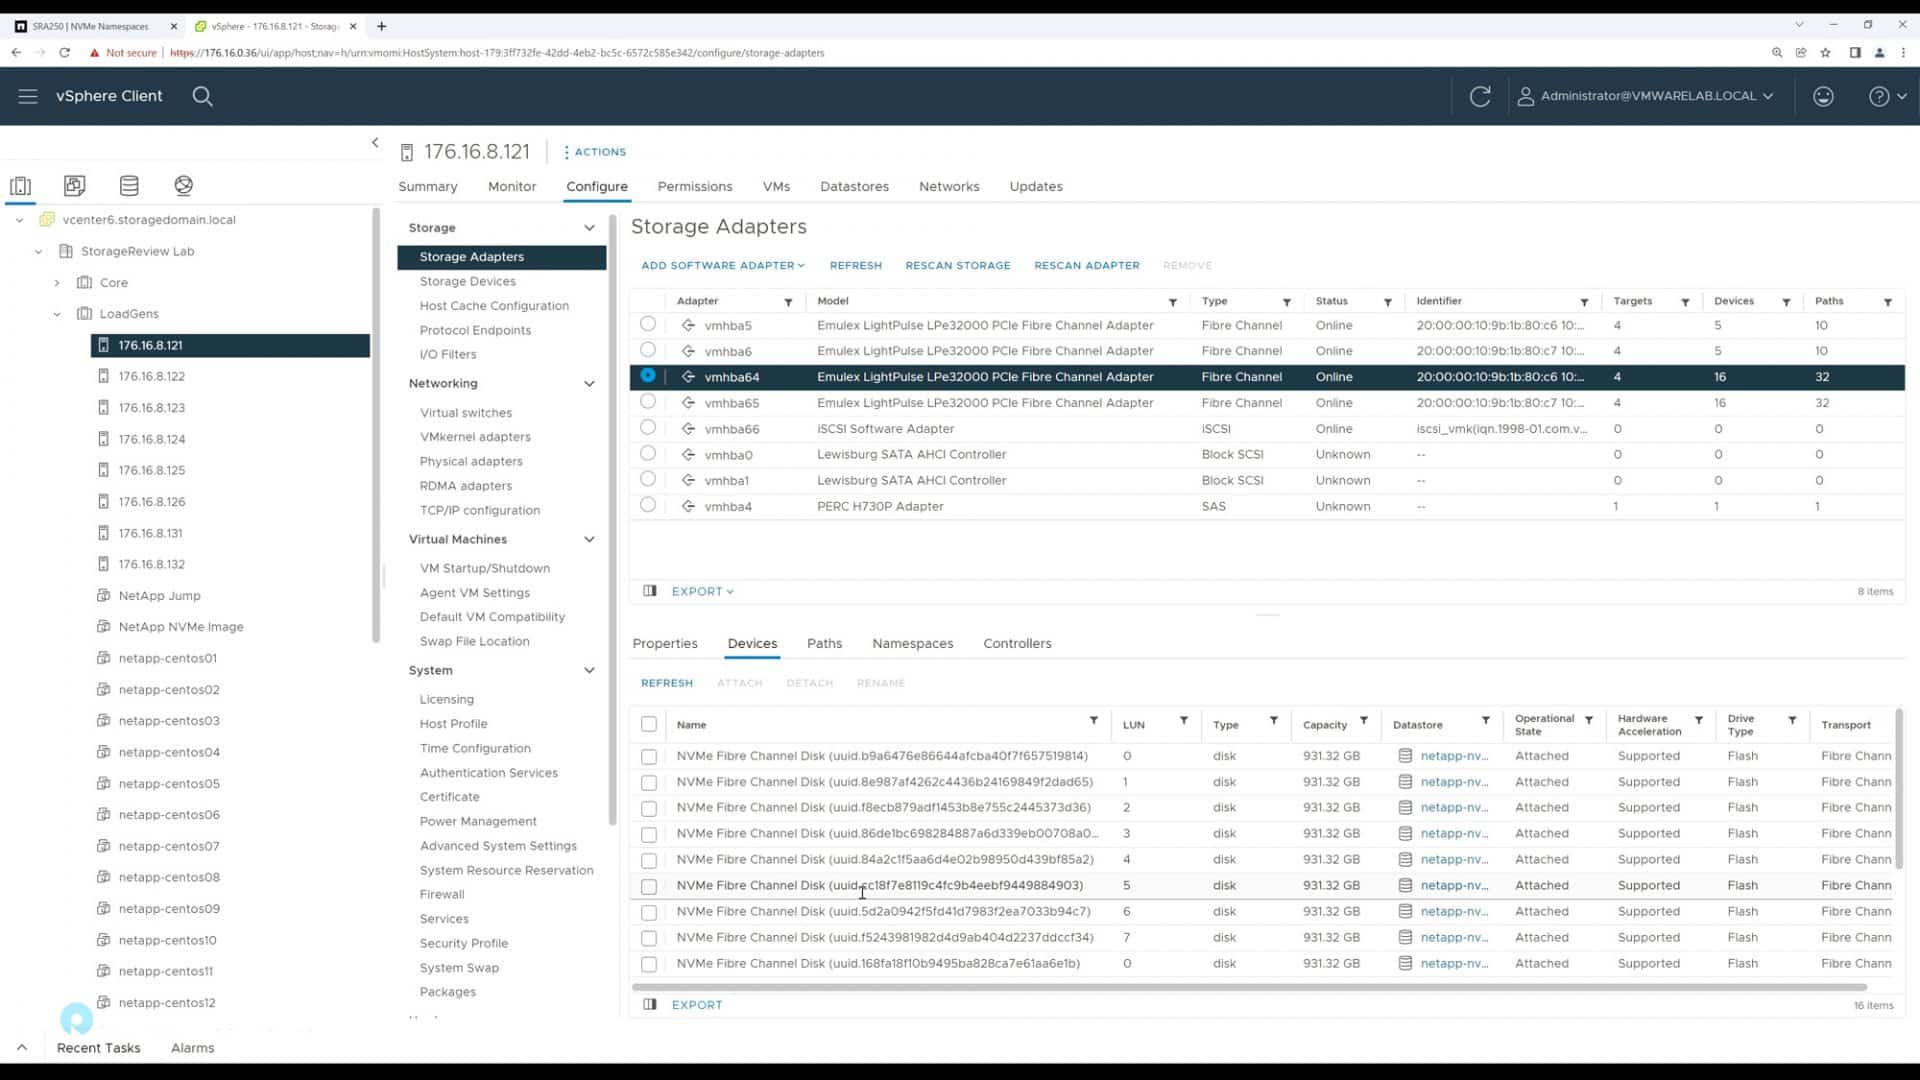
There is a range of other updates with version 9.9.1; however, the most important one for us (in this review, anyway) is that all SAN Arrays (ASA) can now use NVMe over Fibre Channel (NVMe-oF).
When we previously looked at the NetApp AFF A250, we tested the system using the traditional FC SAN mode with 12x 1.92TB NVMe SSDs (RAID-DP with two 3TB pools of storage). So, for this review, we will be looking at the system in NVMe-oF mode.
NVMe-oF is designed to enhance existing SAN workloads and is certainly the best choice for those looking to truly take advantage of NVMe, especially when it comes to overall performance and application response times.
Launched in 2016, the NVMe-oF protocol specification essentially extends the speedy performance of NVMe from the storage array controllers to the fabric via Ethernet, Fiber Channel, RoCE or InfiniBand. This protocol leverages over fabrics as a transport mapping instead of the PCIe bus without shared memory between endpoints. For a more detailed look, we did a deep dive on what is NVMe-oF last summer.
NetApp AFF A250 Specifications
| Maximum scale-out | 2–24 nodes (12 HA pairs) |
| Maximum SSDs | 48 |
| Maximum effective capacity | 1.1PB |
| Per-System Specifications (Active-Active Dual Controller) | |
| Controller form factor | 2U |
| PCIe expansion slots | 4 |
| FC target ports (32Gb autoranging) | Up to 16 |
| 100GbE ports (40GbE autoranging) | 4 |
| 25GbE ports (10GbE autoranging) | Up to 16 |
| 10Gbase-T (1GbE autoranging) | 4 |
| 12Gb/6Gb SAS ports | 4 |
| Storage networking supported | NVMe/FC, FC, iSCSI, NFS, pNFS, CIFS/SMB, Amazon S3 |
| OS version | ONTAP 9.9.1 or later |
| Shelves and media | NS224 (2U; 24 drives, 2.5” SFF NVMe); DS224C (2U; 24 drives, 2.5” SFF); DS2246 (2U; 24 drives, 2.5” SFF) |
NetApp AFF A250 Performance (NVMe-oF)
Our A250 configuration includes 12x 1.92TB NVMe SSDs and NetApp ONTAP 9.9.1. The array is configured by NetApp to be in RAID-DP with two 3TB pools of storage. Our testing for this review is in the NVMe-oF mode. Connectivity is provided using a dual-switch Fibre Channel fabric across two Brocade G620 32Gb switches.
SQL Server Performance
StorageReview’s Microsoft SQL Server OLTP testing protocol employs the current draft of the Transaction Processing Performance Council’s Benchmark C (TPC-C), an online transaction processing benchmark that simulates the activities found in complex application environments. The TPC-C benchmark comes closer than synthetic performance benchmarks to gauging the performance strengths and bottlenecks of storage infrastructure in database environments.
Each SQL Server VM is configured with two vDisks: 100GB volume for boot and a 500GB volume for the database and log files. From a system resource perspective, we configured each VM with 16 vCPUs, 64GB of DRAM, and leveraged the LSI Logic SAS SCSI controller. While our Sysbench workloads tested previously saturated the platform in both storage I/O and capacity, the SQL test looks for latency performance.
This test uses SQL Server 2014 running on Windows Server 2012 R2 guest VMs and is stressed by Dell’s Benchmark Factory for Databases. While our traditional usage of this benchmark has been to test large 3,000-scale databases on local or shared storage, in this iteration we focus on spreading out four 1,500-scale databases evenly across our servers.
SQL Server Testing Configuration (per VM)
- Windows Server 2012 R2
- Storage Footprint: 600GB allocated, 500GB used
- SQL Server 2014
-
- Database Size: 1,500 scale
- Virtual Client Load: 15,000
- RAM Buffer: 48GB
- Test Length: 3 hours
-
- 2.5 hours preconditioning
- 30 minutes sample period
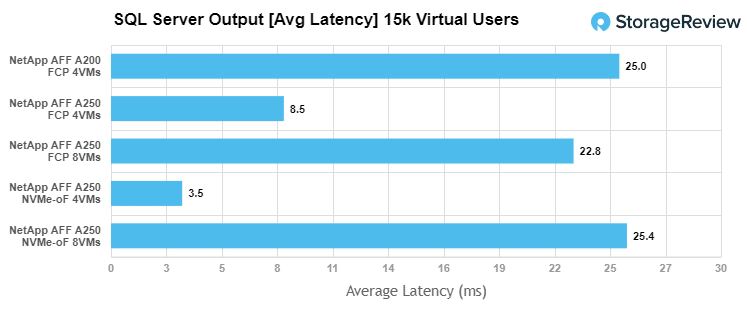
For SQL Server Latency, the A250 (NVMe-oF) had an aggregate score of score 3.5ms for 4VMs and 25.4ms for 8VMs. In FCP mode, the A250 posted an aggregate score of 22.75ms (8VM) and 8.5ms (4VMs). You can see a huge improvement for both modes of the A250 when compared to the last generation (A200), which measured 25ms at 4VMs.
Sysbench MySQL Performance
Our next storage application benchmark consists of a Percona MySQL OLTP database measured via SysBench. This test measures average TPS (Transactions Per Second), average latency, and average 99th percentile latency as well.
Each Sysbench VM is configured with three vDisks: one for boot (~92GB), one with the pre-built database (~447GB), and the third for the database under test (270GB). From a system resource perspective, we configured each VM with 16 vCPUs, 60GB of DRAM, and leveraged the LSI Logic SAS SCSI controller.
Sysbench Testing Configuration (per VM)
- CentOS 6.3 64-bit
- Percona XtraDB 5.5.30-rel30.1
- Tables: 100
-
- Size: 10,000,000
- Threads: 32 Database
- RAM Buffer: 24GB
- Test Length: 3 hours
-
- 2 hours preconditioning 32 threads
- 1 hour 32 threads
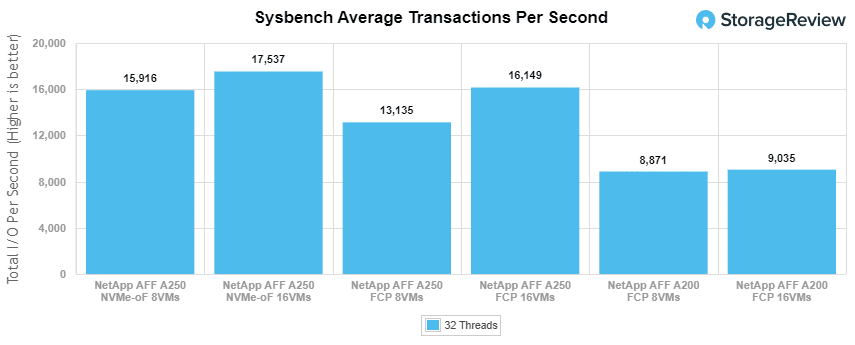
With the Sysbench OLTP, the 8VMs A250 (NVMe-oF) saw an aggregate score of 15,916 TPS while the 16VMs posted 17,537 TPS. In FCP mode, it posted an aggregate score of 13,135 TPS and 16,149 TPS for 8VMs and 16VMs, respectively. The A200 saw half the performance, posting 8.871 TPS and 9,035 TPS for 8VMs and 16VMs, respectively.
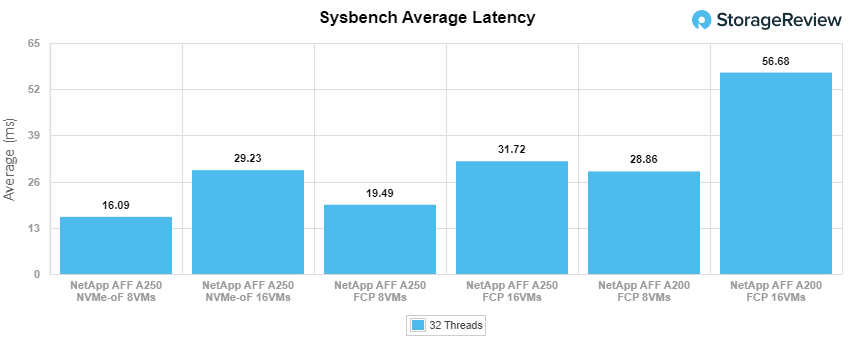
For Sysbench average latency, the 8VM A250 (NVMe-oF) saw an aggregate score of 16.09ms while the 16VM posted 29.23ms. In FCP mode, it posted an aggregate of 19.49ms and 31.72ms for 8VM and 16VM, respectively. Once again, performance gains over the last were significant, as the A200 posted 28.86ms (8VMs) and 56.88ms (16VMs).
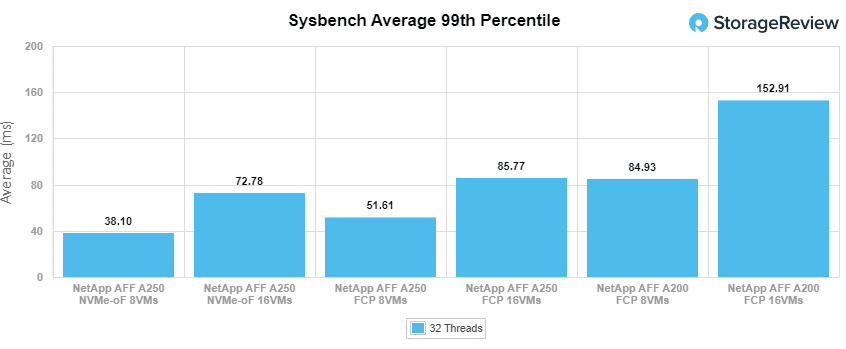
For our worst-case scenario latency (99th percentile), NVMe-oF saw an aggregate latency of 38.1ms (8VMs) and 72.78ms (16VM), while FCP showed 51.61ms (8VMs) and 85.77ms (16VMs). Unsurprisingly, this was a huge improvement over the A200, which posted 84.93ms and 152.91ms for 8VMs and 16 VMs, respectively.
VDBench Workload Analysis
When it comes to benchmarking storage arrays, application testing is best, and synthetic testing comes in second place. While not a perfect representation of actual workloads, synthetic tests do help to baseline storage devices with a repeatability factor that makes it easy to do apples-to-apples comparison between competing solutions.
These workloads offer a range of different testing profiles ranging from “four corners” tests, common database transfer size tests, as well as trace captures from different VDI environments. All of these tests leverage the common vdBench workload generator, with a scripting engine to automate and capture results over a large compute testing cluster. This allows us to repeat the same workloads across a wide range of storage devices, including flash arrays and individual storage devices.
Profiles:
- 4K Random Read: 100% Read, 128 threads, 0-120% iorate
- 4K Random Write: 100% Write, 64 threads, 0-120% iorate
- 64K Sequential Read: 100% Read, 16 threads, 0-120% iorate
- 64K Sequential Write: 100% Write, 8 threads, 0-120% iorate
- Synthetic Database: SQL and Oracle
- VDI Full Clone and Linked Clone Traces
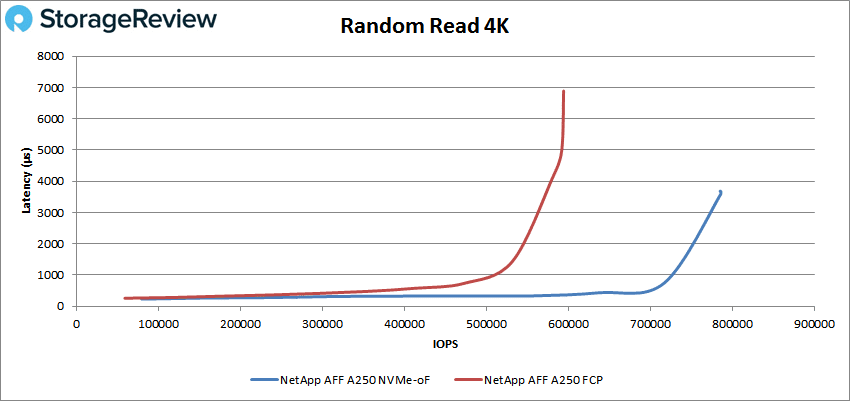
With random 4K read, the NetApp AFF A250 NVMe-oF showed a significant improvement over FCP mode, posting sub-millisecond latency until over 700K, peaking at 787,910 IOPS at a latency of 3.58ms. In FCP mode, the A250 showed sub-millisecond latency until over 500K and went on to peak at 594,388 IOPS and a latency of 6.9ms.
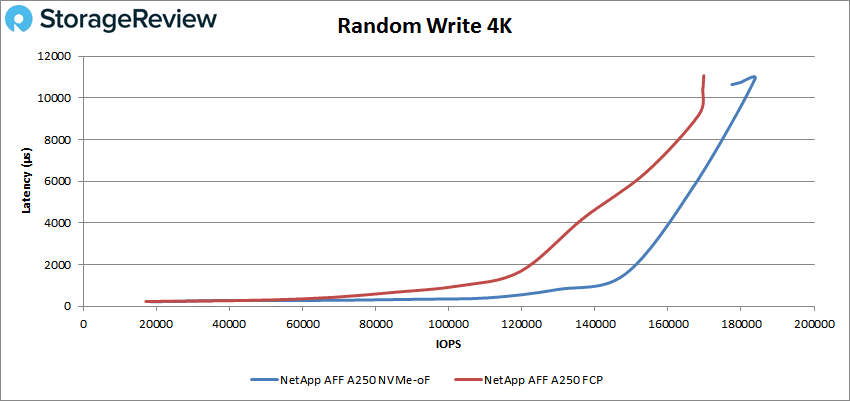
Random 4K write saw results that were a bit closer. Here, the A250 via NVMe-oF had a peak performance of 183,805 IOPS at 10.9ms before taking a slight hit at the very end. In FCP mode, it recorded 169,543 IOPS and a latency of 10.4ms.
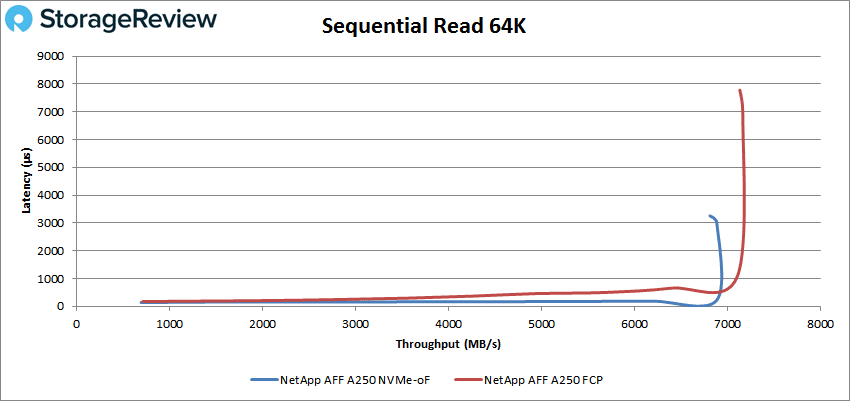
Switching over to sequential work, specifically our 64K workloads, we saw the A250 NVMe-oF stay under 1ms until about 110K IOPS or about 6.8GB/s and saw a peak of 110,100 IOPS or 6.9GB/s at a latency of 3.25ms. Though FCP mode showed better peak throughput at 114,060 IOPS (7.13GB/s), it had a much higher peak latency of 7.8ms.
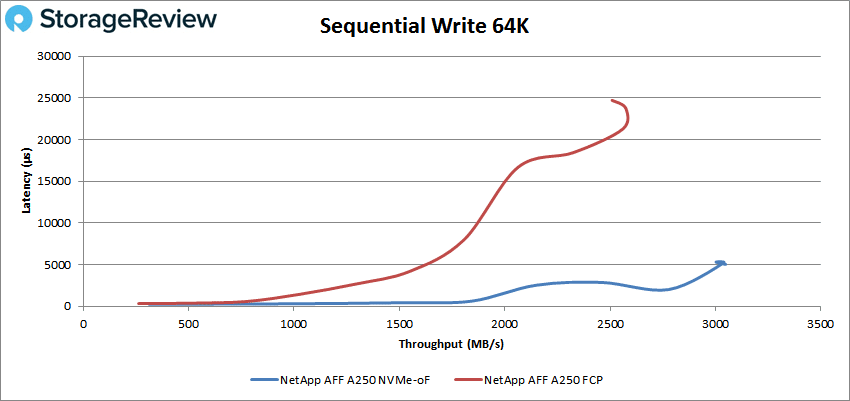
In 64K writes, had the A250 NVMe-oF peaked at roughly 47K IOPS or about 3.04GB/s with a latency of 5.2ms. FCP mode peaked at 41K IOPS or about 2.6GB/s with a much higher latency of 24ms (before performance dropped a bit and latency rose).
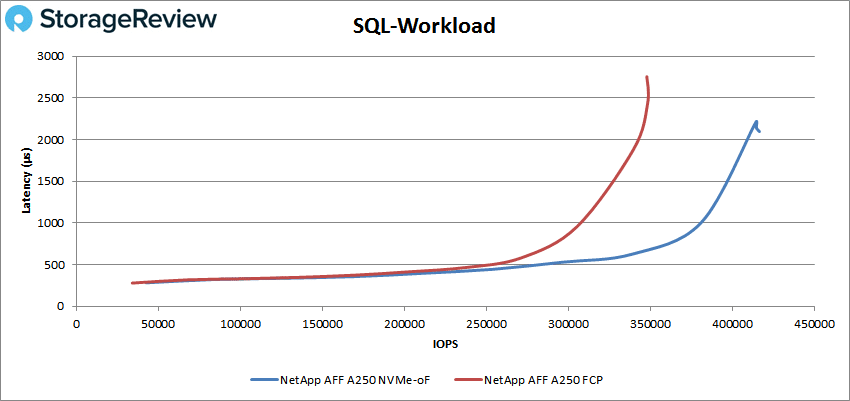
Next, we move on to our SQL tests, SQL, SQL 90-10, and SQL 80-20, where the AFF A250 in NVMe-oF mode showed significant improvements over FCP mode. In SQL, the A250 (NVMe-oF) stayed under 1ms until it broke 350K and went on to peak at 416,617 IOPS at 2.10ms. In FCP mode, it peaked at 348,403 IOPS with a latency of 2.4ms before a slight drop off.
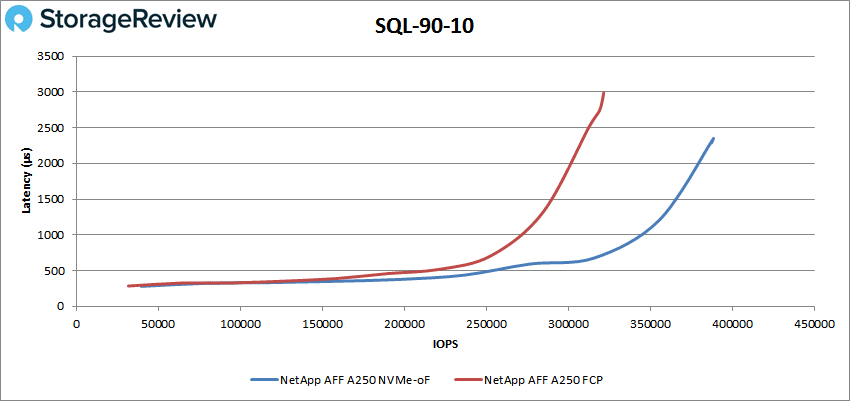
In SQL 90-10, the A250 (NVMe-oF) had sub-millisecond latency until it approached the 350K mark, peaking at 388,589 IOPS at 2.3ms. In FCP mode, the A250 had sub-millisecond latency until about 270K IOPS and went on to peak at 321,604 IOPS with a latency of just under 3ms.
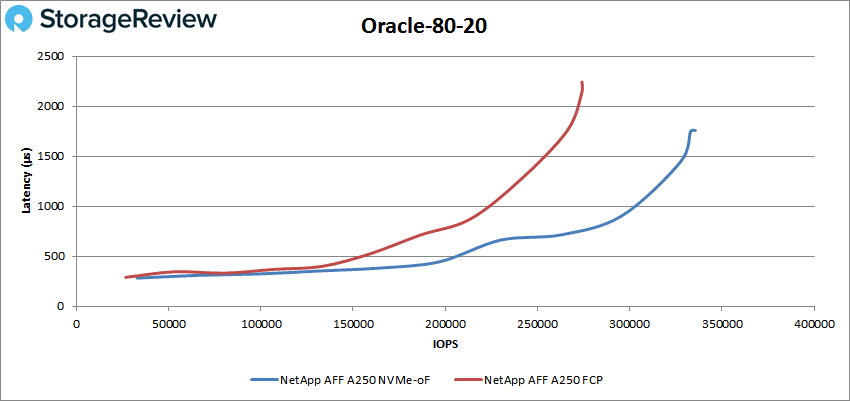
In SQL 80-20, the A250 (NVMe-oF) stayed under 1ms until about 270K IOPS, peaking at 314,616 IOPS at 2.96ms. Looking at the A250 in FCP mode, it stayed under 1ms until about 200K IOPS and went on to peak at 263,157 IOPS at a latency of 3.6ms.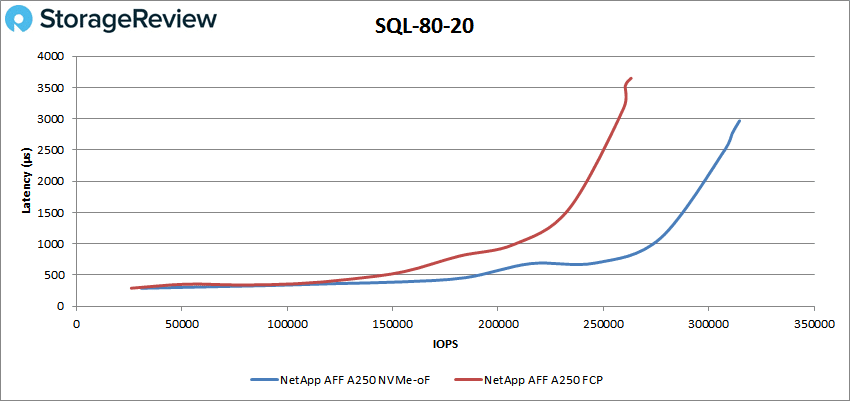
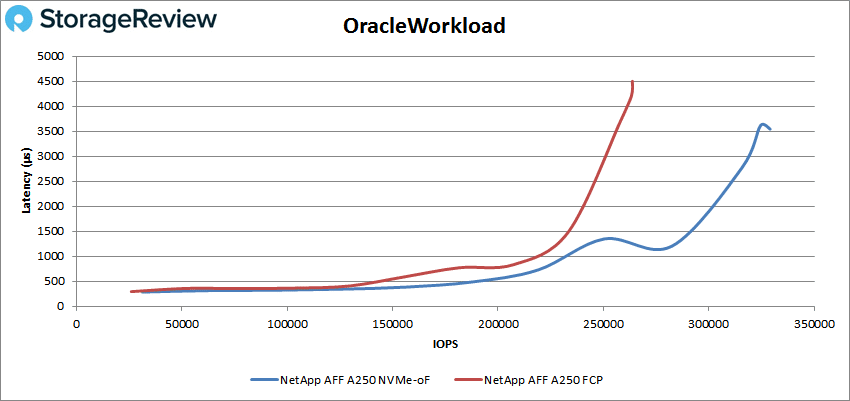
The next batch of tests is our Oracle tests: Oracle, Oracle 90-10, and Oracle 80-20. Again, NVMe-oF showed much better performance throughout. In the Oracle workload, it gave us sub-millisecond latency until roughly 230K IOPS, and went on to peak at 329,112 IOPS at a latency of just over 3ms. In FCP mode, the A250 gave us sub-millisecond latency until roughly 200K IOPS, and went on to peak at 263,802 IOPS at a latency of just over 4.5ms.
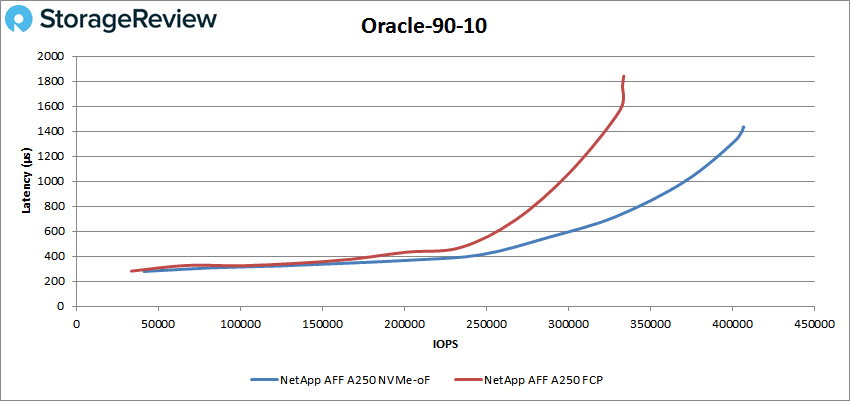
 For Oracle 90-10, the A250 remained under 1ms until about 370K IOPS, and went on to peak at 407,087 IOPS at a latency of 1.43ms. In FCP mode, it performed under 1ms until about 275K IOPS and went on to peak at 333,108 IOPS with 1.8ms for latency.
Oracle 80-20 saw the A250 (NVMe-oF) peak at 335,577 IOPS with 1.75ms in latency, while FCP mode showed a peak of 273,948 IOPS with 2.1ms in latency.
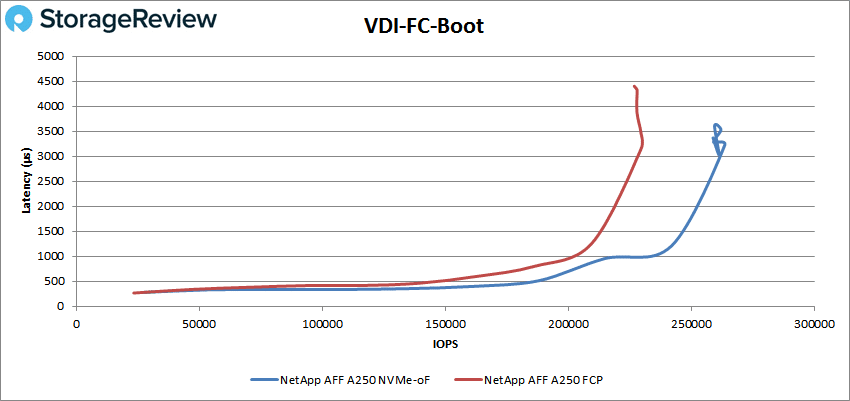
Next, we switched over to our VDI clone test, Full and Linked. For VDI Full Clone (FC) Boot, the NetApp AFF A250 (NVMe-oF) made it to 240K without surpassing 1ms in latency while peaking at 263,683 IOPS at 3.23ms before taking a spike in performance at the very end. In FCP mode, the A250 made it to 200K IOPS with less than 1ms for latency, then peaked at 229,571 IOPS at a latency just over 3ms before dropping off a bit.
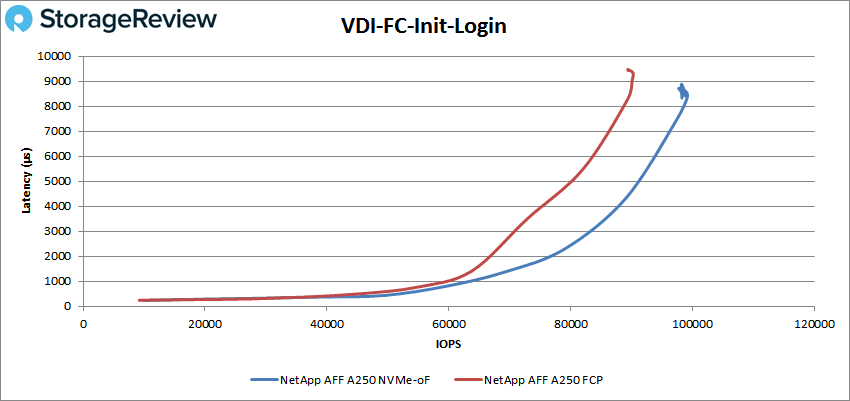
 In VDI FC Initial Login, the A250 (NVMe-oF) had sub-millisecond latency performance after passing the 60K mark, peaking at 98,897 IOPS with a latency of 8.42ms (again, taking a spike in performance at the end). In FCP mode, the A250 hit 55K IOPS before going over 1ms and went on to peak at 90,270 IOPS with a latency of 9.3ms.
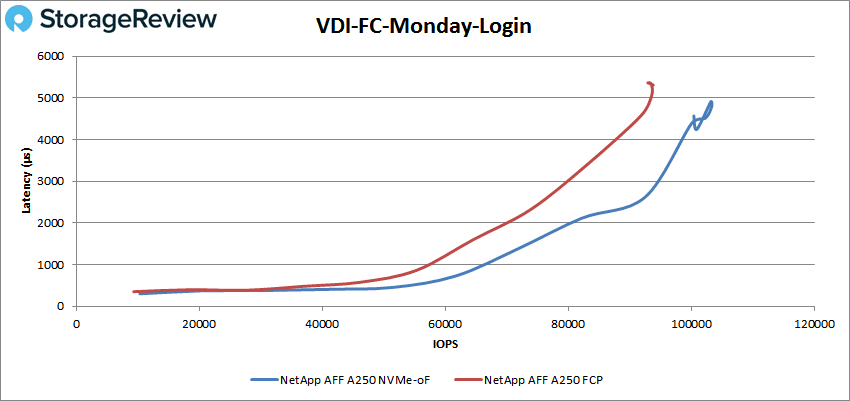
VDI FC Monday Login saw the A250 have latency under 1ms until roughly 68K IOPS, peaking at 103,184 IOPS with a latency of just under 5ms before hitting a spike again. In FCP mode, the A250 remained under 1ms until about 55K IOPS again and went on to peak at 93,574 IOPS and a latency of 5.1ms.
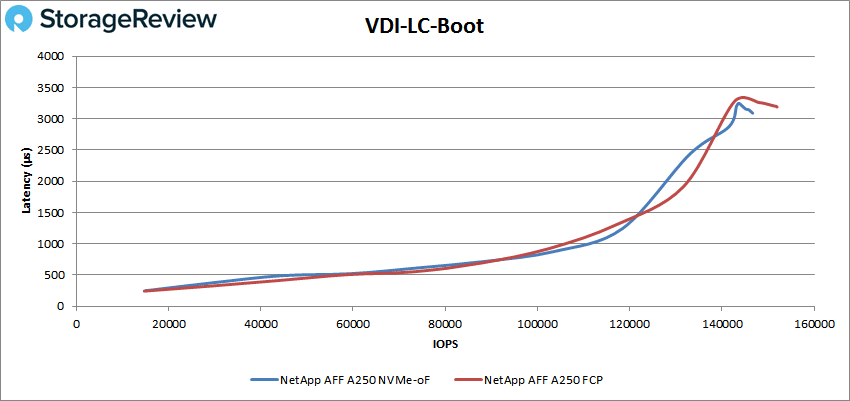
Now we move on to linked clone. In VDI LC Boot, both modes showed very similar performance with FCP mode actually peaking with a higher IOPS of 151,953 IOPS (3.2ms in latency). In NVMe-oF, the A250 peaked at 146,660 IOPS, though with better latency of 3.09ms.
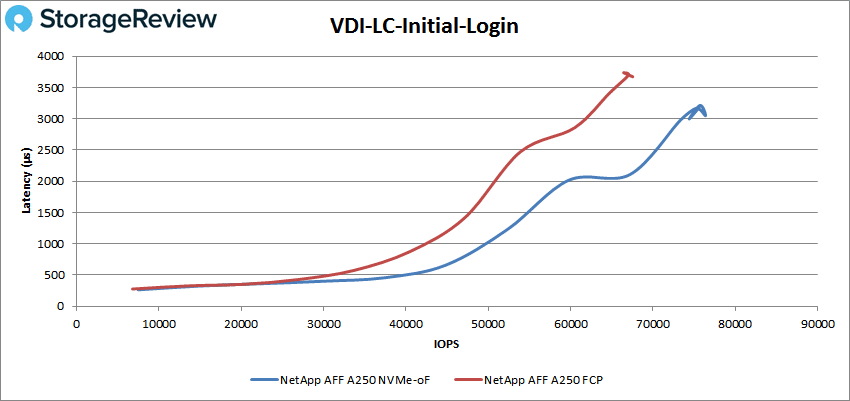
 With VDI LC Initial Login, the A250 (NVMe-oF) had sub-millisecond latency until it went over 50K IOPS, peaking at 76,386 IOPS at 3.05ms in latency before taking a slight hit in performance at the end. In FCP, the A260 had sub-millisecond latency until around 40K IOPS and went on to peak 67,557 IOPS and a latency of 3.7ms.
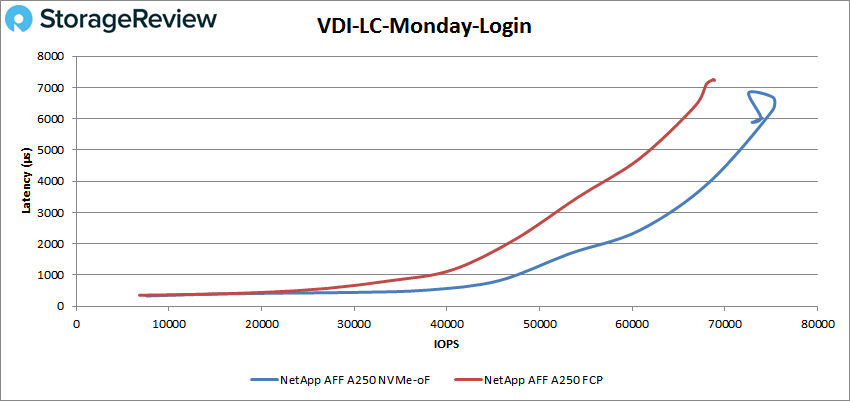
Finally, with VDI LC Monday Login, the A250 made it to roughly 48K IOPS before it surpassed 1ms in latency. It peaked at 75,259 IOPS at 6.67ms in latency before taking a dip in performance. In FCP, the A250 almost made it to 40K IOPS before going over 1ms, peaking at 68,751 IOPS with a latency of 7.3ms.
Conclusion
The NetApp AFF A250 shines as an entry-enterprise, end-to-end NVMe system for mid-size businesses looking to get great performance and consolidation of their data. The system itself can be embedded with NVMe SSDs on the front-end and NVMe over FC host connectivity on the back-end, the latter of which we did for this review. Customers will certainly get a power performer at an entry price point and a huge upgrade from their previous model, the AFF A220. This isn’t surprising, as NetApp is known to be conscious of the current needs of the IT industry. This allows them to offer fantastic system upgrades for the subsequent releases of their systems.
For performance, we ran both our Application Workload Analysis and VDBench workloads. As demonstrated above, NVMe-oF mode showed significant performance gains over the traditional SAN FCP (Fibre Channel Protocol) mode.
In our Application Workload Analysis, the A250 (NVMe-oF) had an aggregate score of score 3.5ms for 4VMs and 25.4ms for 8VMs. In comparison, FCP mode had an aggregate score of 22.75ms (8VM) and 8.5ms (4VMs).
With Sysbench the A250 (NVMe-oF) was equally impressive, with an aggregate TPS of 15,916 TPS for 8VM and 17,537 TPS for 16VM compared to the FCP mode’s 13,135 TPS and 16,149 TPS, respectively. Sysbench average latency saw aggregate scores of 16.09ms in 8M and 29.23ms in 16VM compared to 19.49ms and 31.72ms in FCP mode. In the worst-case scenario latency, we saw the A250 hit aggregate latencies of 38.1ms in 8VM and 72.78ms in 16VM compared to the FCP’s 51.61ms (8VMs) and 85.77ms (16VMs).
With VDBench the NetApp AFF A250 shined with significant drops in latency in our performance profiles. Highlights of the NetApp AFF A250 (NVMe-oF) include 788K IOPS in 4K read, 183K IOPS in 4K write, 6.8GB/s in 64K read, and 3.04GB/s in 64K write. In our SQL tests, we saw peaks of 417K IOPS, 389K IOPS in SQL 90-10, and 315K IOPS in SQL 80-20. With our Oracle tests, we saw peak performances of 329K IOPS, 407K IOPS in Oracle 90-10, and 335K IOPS in Oracle 80-20. In our VDI Clone tests, we saw Full Clone results of 264K IOPS Boot, 99K IOPS in Initial Login, and 103K IOPS in Monday Login. For Linked Clone, we saw peaks of 147K IOPS in Boot, 76K IOPS in Initial Login, and 75K IOPS in Monday Login.
Leveraging NVMe over Fibre Channel produces much better performance in virtually every workload you might have, which if you have the supporting hardware, there is no reason not to implement it. NetApp doesn’t even charge a premium to enable these features. In the end, NVMe-oF is a free performance bonus for NetApp customers, making NVMe-oF a massive win for ONTAP AFA users.


 Amazon