

NetApp has added to their line of all-flash storage arrays with the new entry-midrange NetApp AFF A250. It’s one thing to be all-flash at this price band. But NetApp takes flash further with end-to-end NVMe including support for NVMe over Fibre Channel (NVMe/FC). While NetApp is well known for high-performance all-flash arrays (check out our previous reviews here and here) they are promising 45% more performance and 33% more storage efficiency in the A250 (compared to the A200).
How the NetApp AFF A250 Sets Itself Apart
The new NetApp AFF A250 carries a lot of the same benefits as the rest of the AFF line. It accelerates applications like AI and ML, minimizes data center footprint with higher density, and simplifies IT operations. The big difference with the A250 is that it brings the above benefits at a lower cost while tossing in benefits like NVMe/FC that is often only found in more expensive arrays. Even with all of the improvements, organizations can expect a price similar to the previously offered A220.
From a hardware perspective, the NetApp AFF A250 uses a pair of active-active controllers like most of the other NetApp AFF arrays or A-series. While the company doesn’t specifically call it out, the array leverages 2×64-bit 12-core Skylake-D CPUs and 128GB RAM. Again, NetApp offers end-to-end NVMe using both NVMe storage and NVMe over Fabrics. The array touts up to 35PB of effective capacity (based on 5:1 storage efficiency and the maximum numbers of SSD installed).
Looking at software, NetApp is offering ONTAP 9.8P2. For ONTAP in general (specifically 9.7), we did a fairly deep dive here. 9.8 came out a few months back and focused on simplicity. The notion being, the easier it is to manage the array, the less time managing storage will take. NetApp has simplified ONTAP System Manager, NetApp Active IQ, and NetApp Cloud Insights and now claims that storage for applications can be provisioned in under ten minutes. Cloud integration in 9.8 allows for cloud tiering, caching data to the cloud, and back up to the cloud.
NetApp AFF A250 Specifications
| Maximum scale-out | 2–24 nodes (12 HA pairs) |
| Maximum SSDs | 48 |
| Maximum effective capacity | 1.1PB |
| Per-System Specifications (Active-Active Dual Controller) | |
| Controller form factor | 2U |
| PCIe expansion slots | 4 |
| FC target ports (32Gb autoranging) | Up to 16 |
| 100GbE ports (40GbE autoranging) | 4 |
| 25GbE ports (10GbE autoranging) | Up to 16 |
| 10Gbase-T (1GbE autoranging) | 4 |
| 12Gb/6Gb SAS ports | 4 |
| Storage networking supported | NVMe/FC, FC, iSCSI, NFS, pNFS, CIFS/SMB, Amazon S3 |
| OS version | ONTAP 9.8 RC1 or later |
| Shelves and media | NS224 (2U; 24 drives, 2.5” SFF NVMe); DS224C (2U; 24 drives, 2.5” SFF); DS2246 (2U; 24 drives, 2.5” SFF) |
NetApp AFF A250 Design and Build
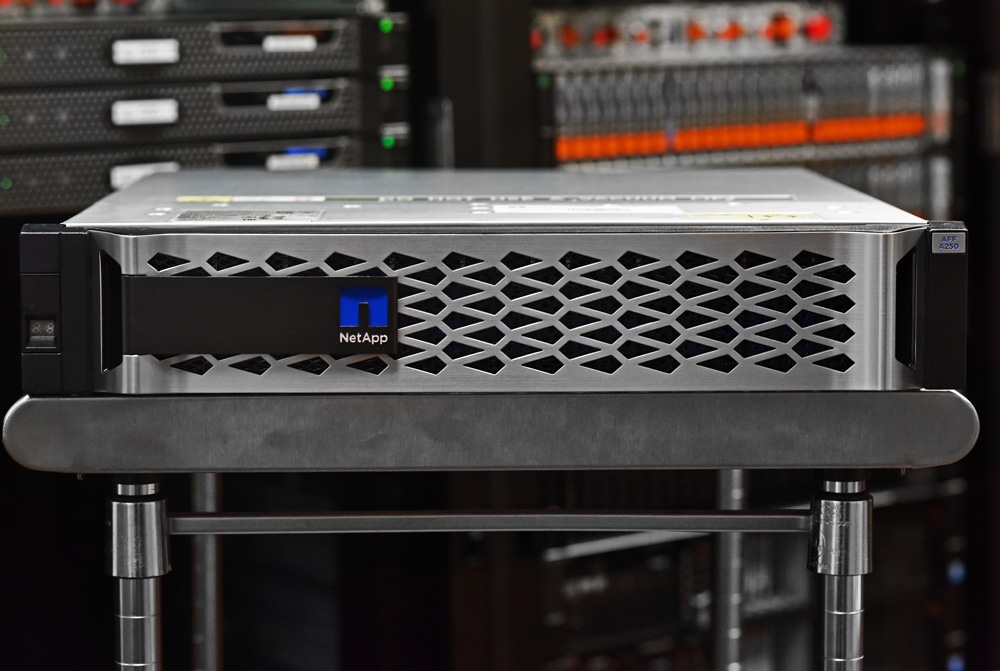
With the bezel on, the NetApp AFF A250 looks very much like the rest of the A-series. The bezel is silver and mainly designed for ventilation. NetApp branding is on the left side. This array is 2U in size.
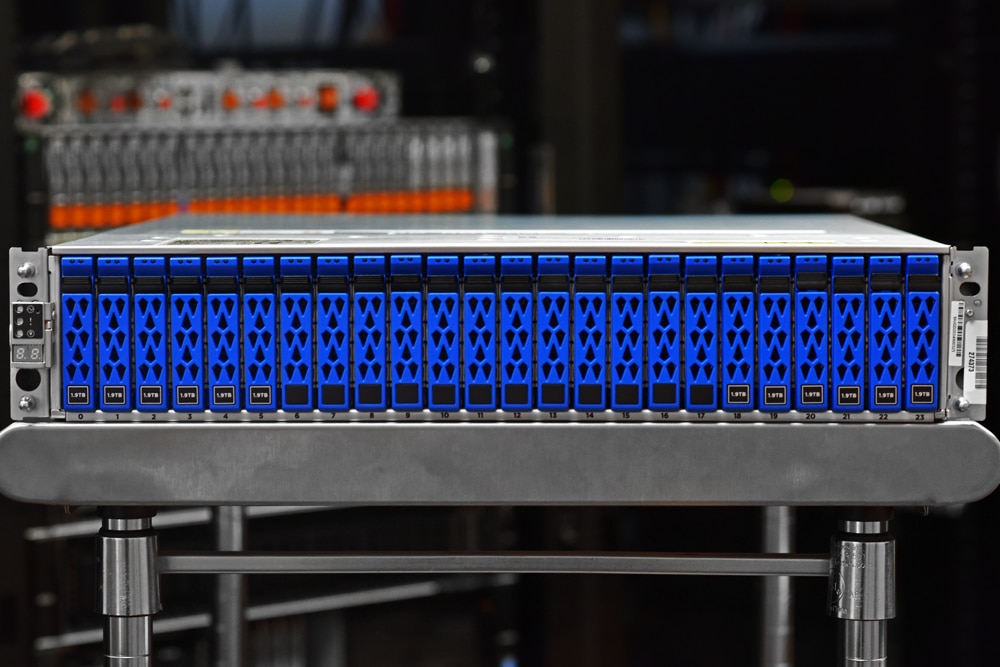
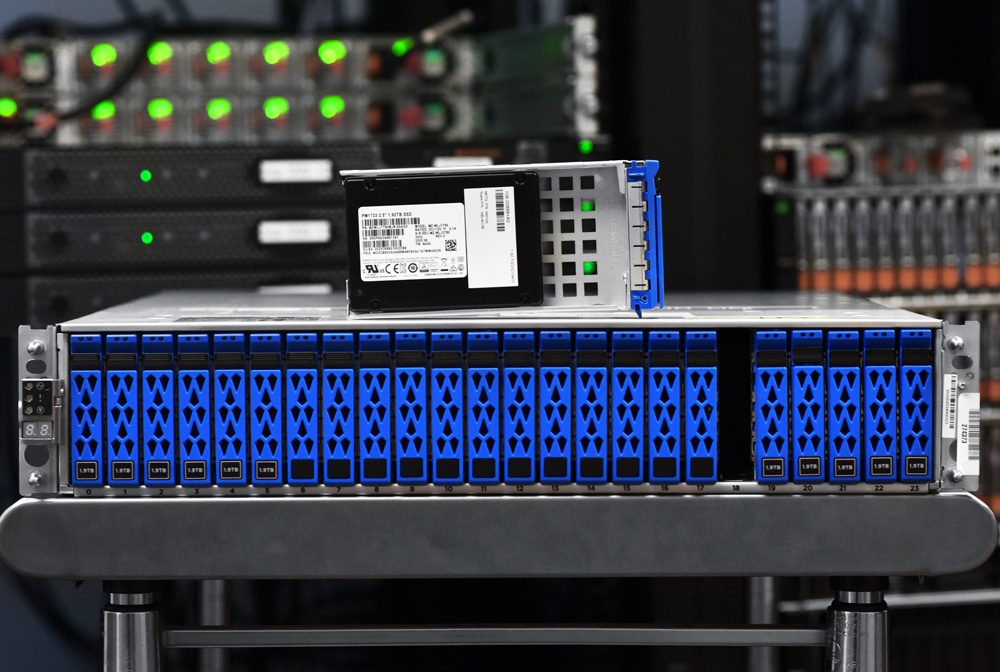
Taking off the bezel, one can see the drive bays that run across the front.
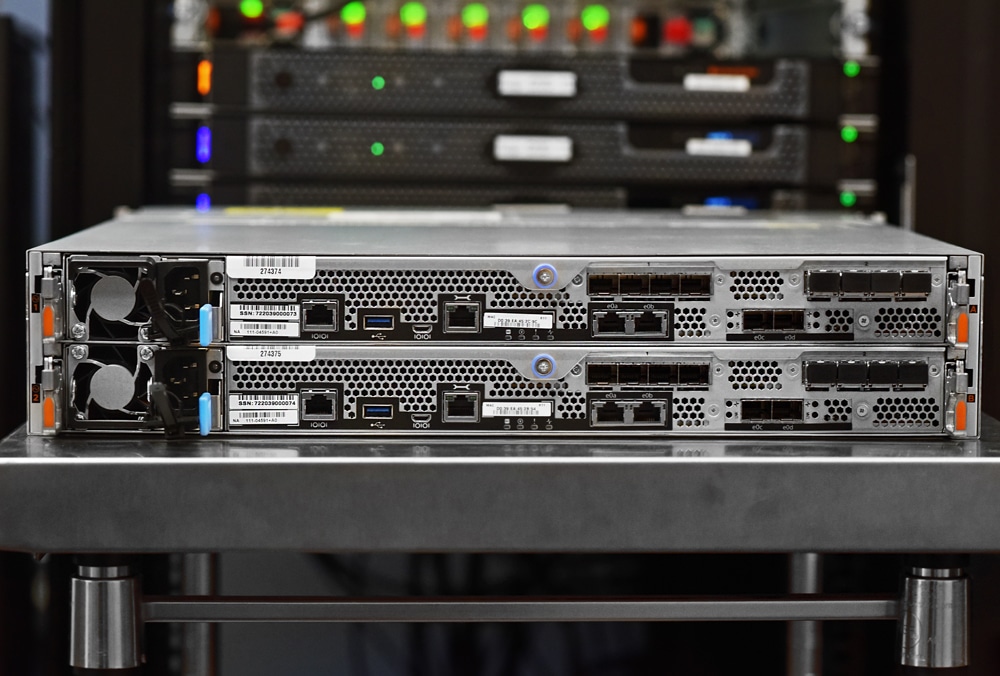
Flipping it around to the rear, we see the two controllers split right in the middle and stacked one on another. Each controller has a PSU on the left followed by a console port, a USB 3.0 port, a Micro USB port, a Management port, two 10Gbase-T ports, and two 25GbE ports. On the upper right side are two Mezzanine slots.
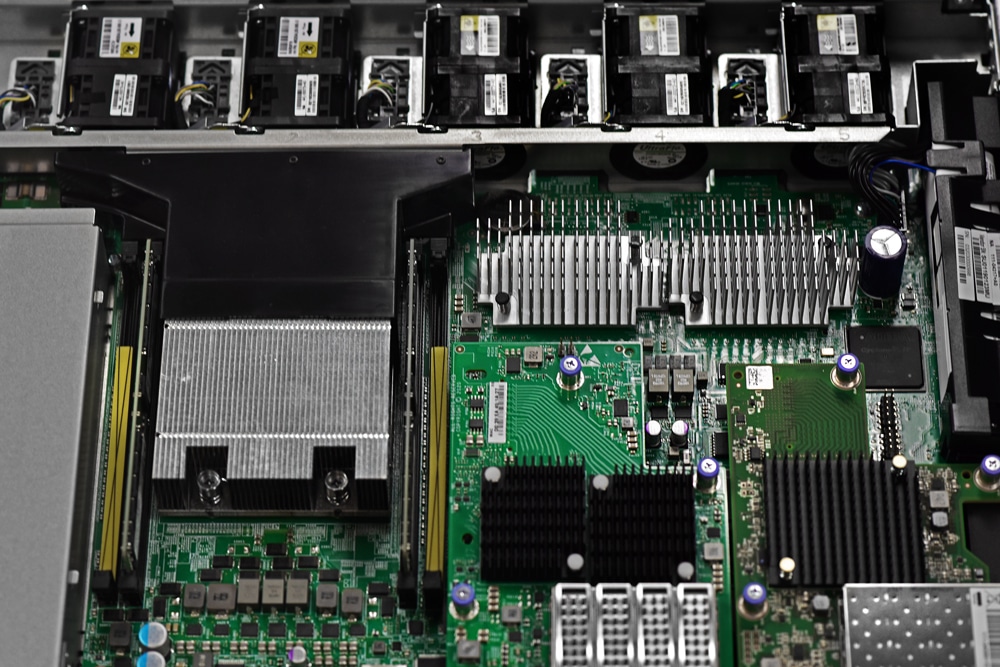
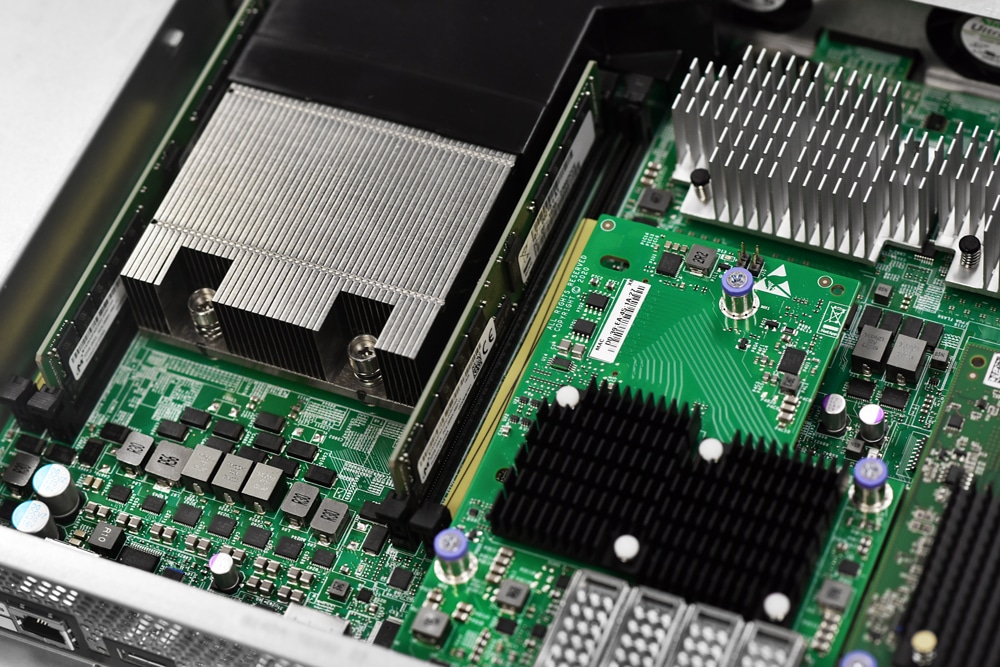
Opening up the array we are granted easy access to anything that needs to be swapped out. Here one would have access to the aforementioned 64-bit 12-core Skylake-D CPUs and RAM if need be. Storage can easily be accessed through the front of the device.
NetApp AFF A250 Performance
Our A250 configuration includes 12x 1.92TB NVMe SSDs and NetApp ONTAP 9.8P2. The array is configured by NetApp to be in RAID-DP with two 3TB pools of storage. Our testing for this review is in the traditional FC SAN mode. The NVMe/FC performance is outside the scope of this review. For connectivity, we used 8x 32Gb FC ports to our storage fabric, split evenly across both controllers.
SQL Server Performance
StorageReview’s Microsoft SQL Server OLTP testing protocol employs the current draft of the Transaction Processing Performance Council’s Benchmark C (TPC-C), an online transaction processing benchmark that simulates the activities found in complex application environments. The TPC-C benchmark comes closer than synthetic performance benchmarks to gauging the performance strengths and bottlenecks of storage infrastructure in database environments.
Each SQL Server VM is configured with two vDisks: 100GB volume for boot and a 500GB volume for the database and log files. From a system resource perspective, we configured each VM with 16 vCPUs, 64GB of DRAM, and leveraged the LSI Logic SAS SCSI controller. While our Sysbench workloads tested previously saturated the platform in both storage I/O and capacity, the SQL test looks for latency performance.
This test uses SQL Server 2014 running on Windows Server 2012 R2 guest VMs and is stressed by Dell’s Benchmark Factory for Databases. While our traditional usage of this benchmark has been to test large 3,000-scale databases on local or shared storage, in this iteration we focus on spreading out four 1,500-scale databases evenly across our servers.
SQL Server Testing Configuration (per VM)
- Windows Server 2012 R2
- Storage Footprint: 600GB allocated, 500GB used
- SQL Server 2014
-
- Database Size: 1,500 scale
- Virtual Client Load: 15,000
- RAM Buffer: 48GB
- Test Length: 3 hours
-
- 2.5 hours preconditioning
- 30 minutes sample period
For our Application Workload Analysis, we are running both the NetApp AFF A250 and A200 with data reduction (DR) turned on.
For SQL Server Latency, the 8VM A250 had an aggregate score of 22.75ms with individual VM ranging between 19ms and 25ms. The 4VM A250 had an aggregate score of 8.5ms with single VMs running between 6ms to 11ms. This compared to the A200 running 4VM which saw an aggregate of 25ms with individual VMs ranging between 24ms and 26ms.
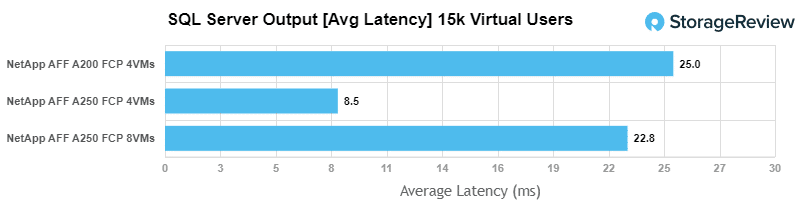
Overall we see the A250 making great strides in 4VM performance, but the scaling is what really stands out. The A250 can essentially handle more than twice as much work as the A200 when it comes to SQL.
Sysbench MySQL Performance
Our next storage application benchmark consists of a Percona MySQL OLTP database measured via SysBench. This test measures average TPS (Transactions Per Second), average latency, and average 99th percentile latency as well.
Each Sysbench VM is configured with three vDisks: one for boot (~92GB), one with the pre-built database (~447GB), and the third for the database under test (270GB). From a system resource perspective, we configured each VM with 16 vCPUs, 60GB of DRAM, and leveraged the LSI Logic SAS SCSI controller.
Sysbench Testing Configuration (per VM)
- CentOS 6.3 64-bit
- Percona XtraDB 5.5.30-rel30.1
- Tables: 100
- Size: 10,000,000
- Threads: 32 Database
- RAM Buffer: 24GB
- Test Length: 3 hours
- 2 hours preconditioning 32 threads
- 1 hour 32 threads
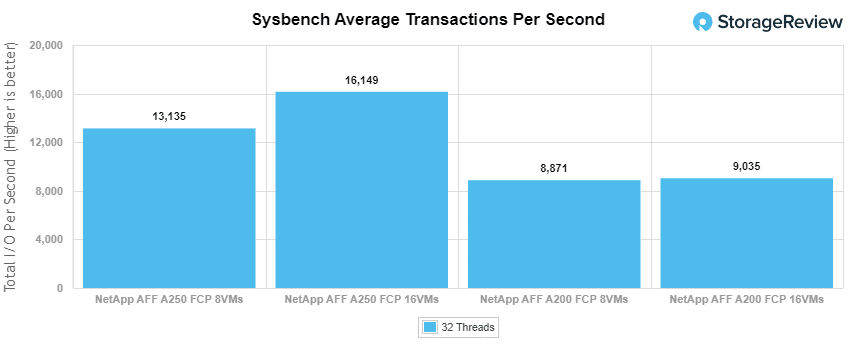
With the Sysbench OLTP, the 8VM A250 saw an aggregate score of 13,134.55 TPS and the 16VM saw an aggregate score of 16,149.06 TPS. Compare this to the A200’s 8VM aggregate score of 8,870.52 TPS and the 16VM aggregate score of 9,035.3 TPS.
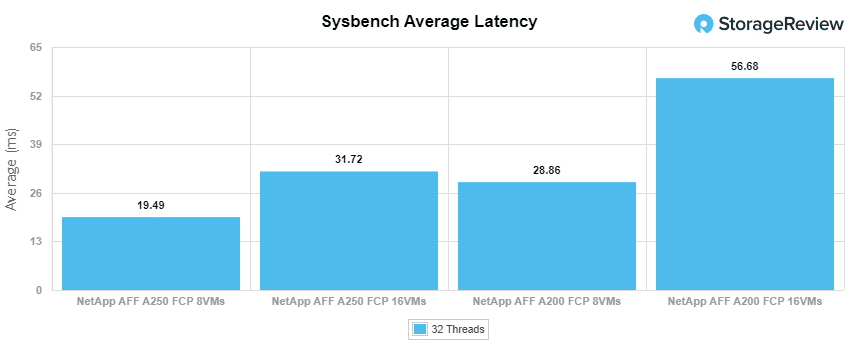
For Sysbench average latency, the 8VM A250 had an aggregate score of 19.49ms, and the 16VM hit 31.72ms. The A200 was 28.86ms for the 8VM and 56.68ms for the 16VM.
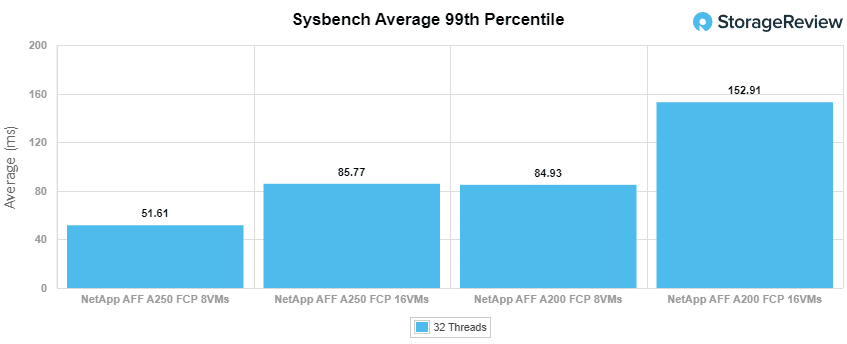
For our worst-case scenario latency (99th percentile), the A250’s 8VM saw an aggregate latency of 51.6ms, and its 16VM saw 85.77ms. The A200, on the other hand, hit 84.93ms aggregate with 8VM and 152.01ms with 16VM.
Similar to our findings in SQL Server, the new NetApp AFF 250 is able to crank out roughly twice the performance of the A200, with a much better latency profile.
VDBench Workload Analysis
When it comes to benchmarking storage arrays, application testing is best, and synthetic testing comes in second place. While not a perfect representation of actual workloads, synthetic tests do help to baseline storage devices with a repeatability factor that makes it easy to do apples-to-apples comparison between competing solutions.
These workloads offer a range of different testing profiles ranging from “four corners” tests, common database transfer size tests, as well as trace captures from different VDI environments. All of these tests leverage the common vdBench workload generator, with a scripting engine to automate and capture results over a large compute testing cluster. This allows us to repeat the same workloads across a wide range of storage devices, including flash arrays and individual storage devices.
Profiles:
-
-
- 4K Random Read: 100% Read, 128 threads, 0-120% iorate
- 4K Random Write: 100% Write, 64 threads, 0-120% iorate
- 64K Sequential Read: 100% Read, 16 threads, 0-120% iorate
- 64K Sequential Write: 100% Write, 8 threads, 0-120% iorate
- Synthetic Database: SQL and Oracle
- VDI Full Clone and Linked Clone Traces
-
For the VDBench tests, we will be running both arrays with data reduction turned on.
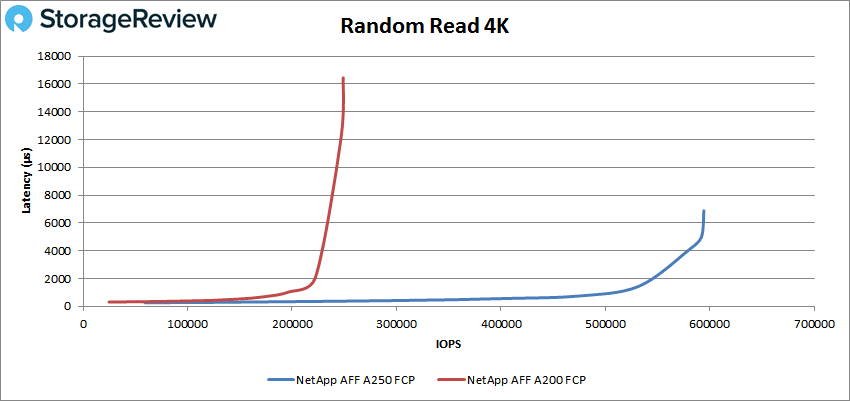
With random 4K read, the NetApp AFF A250 showed a fairly drastic improvement over the A200 with sub-millisecond latency until over 500K and going on to peak at 594,388 IOPS and a latency of 6.9ms. This is over twice the performance of the A200 with less than half the latency.
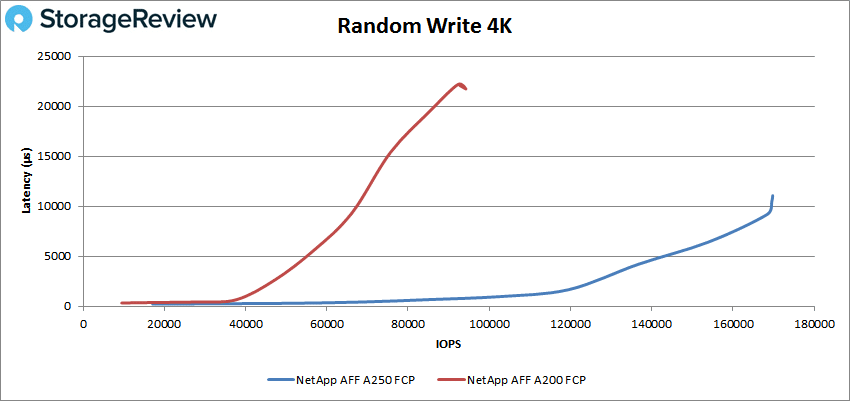
Random 4K write again saw the A250 blow past its predecessor with a peak performance of 169,543 IOPS and a latency of 10.4ms. Again, more than double the peak performance and roughly half the latency of the A200.
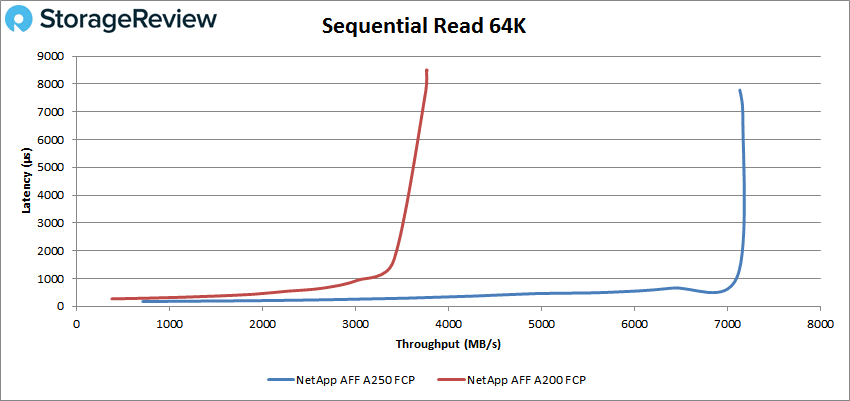
Switching over to sequential work, specifically our 64K workloads, in read we saw the A250 stay under 1ms until about 100K IOPS or about 7GB/s and saw a peak of 114,060 IOPS or 7.13GB/s at a latency of 7.8ms. Peak performance in the A250 was leaps and bounds over the A200 though top-end latency wasn’t too far apart.
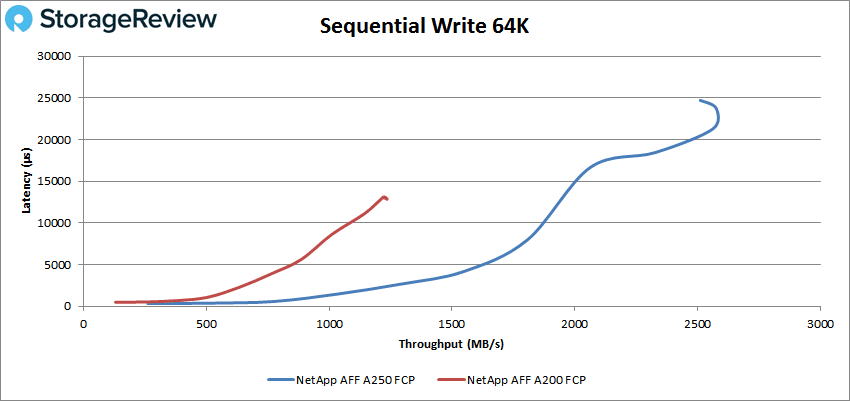
64K write had the A250 peak at about 41K IOPS or about 2.6GB/s with a latency of about 24ms before performance dropped a bit and latency rose. Here, the A250 had higher peak numbers though it had nearly twice the latency.
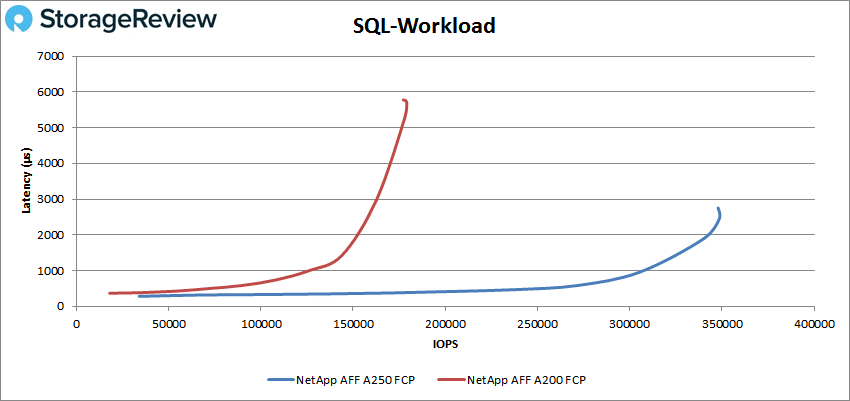
Moving on to our SQL tests, SQL, SQL 90-10, and SQL 80-20. In SQL, the NetApp AFF A250 stayed under 1ms until it broke 300K and went on to peak at 348,403 IOPS with a latency of 2.4ms before a slight drop off. It showed a marked improvement in both top-end performance and latency over the A200.
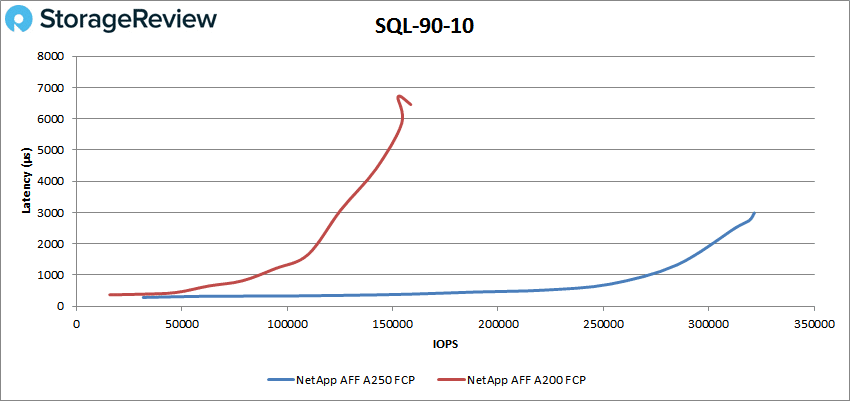
In SQL 90-10, the A250 had sub-millisecond latency until about 270K IOPS and went on to peak at 321,604 IOPS with a latency of 2.7ms. Again, double the performance with less than half the latency of the previous model.
In SQL 80-20, the A250 stayed under 1ms until about 200K IOPS and went on to peak at 263,157 IOPS at a latency of 3.6ms. It has almost become a pattern for the A250 to double the performance and half latency; the marketing department couldn’t write this better.

The next batch of tests is our Oracle tests: Oracle, Oracle 90-10, and Oracle 80-20. In Oracle, the A250 gave us sub-millisecond latency until over 200K IOPS, and went on to peak at 263,802 IOPS at a latency of 4.5ms. This is over 100K IOPS higher than the A200 with over 5ms lower latency.

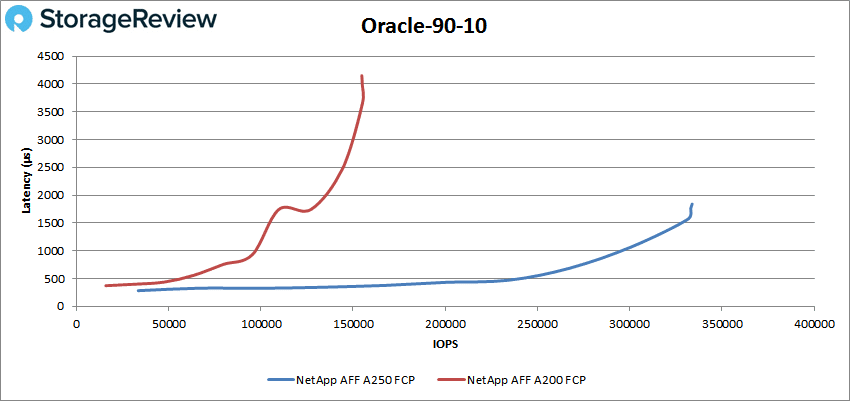
For Oracle 90-10, the A250 started and stayed under 1ms until about 275K IOPS. From there it went on to peak at 333,108 IOPS with 1.8ms for latency. The same impressive record of double the performance and less than half the latency.
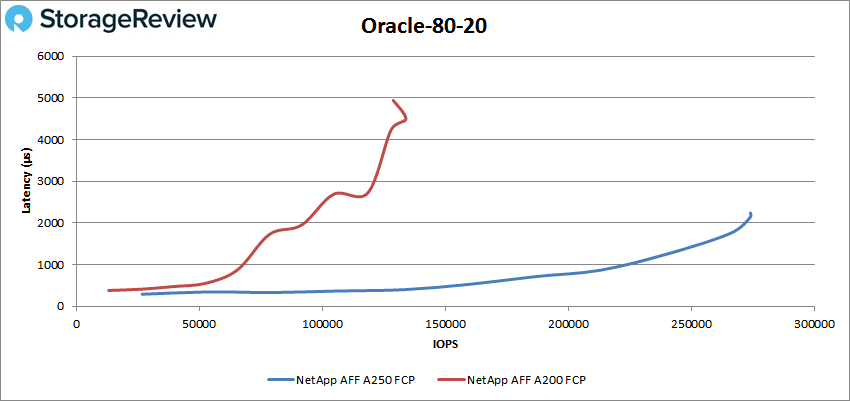
Oracle 80-20 saw the A250 have a long streak under 1ms, until about 220K IOPS, and then peak at 273,948 IOPS with a latency of 2.1ms. This puts peak performance at 143K IOPS over the A200 and the latency at 2/5 the A200.
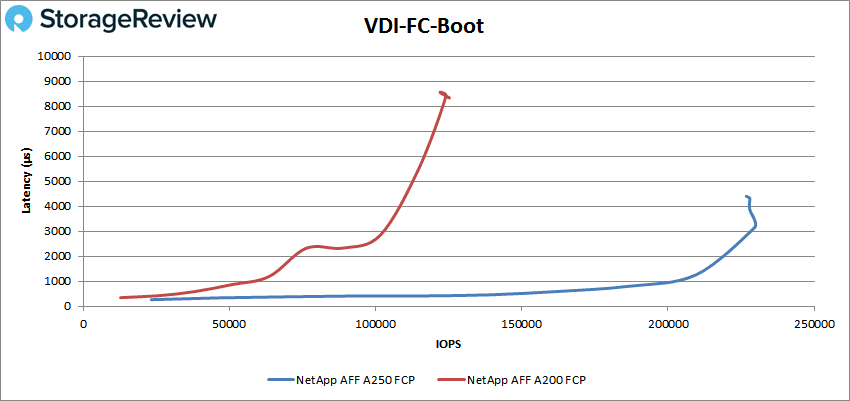
Next, we switched over to our VDI clone test, Full and Linked. For VDI Full Clone (FC) Boot, the NetApp AFF A250 made it to 200K IOPS with less than 1ms for latency, about 4 times that of the A200. The A250 peaked at 229,571 IOPS at a latency just over 3ms before dropping off a bit. This puts it 100K over the A200 with less than half the latency.
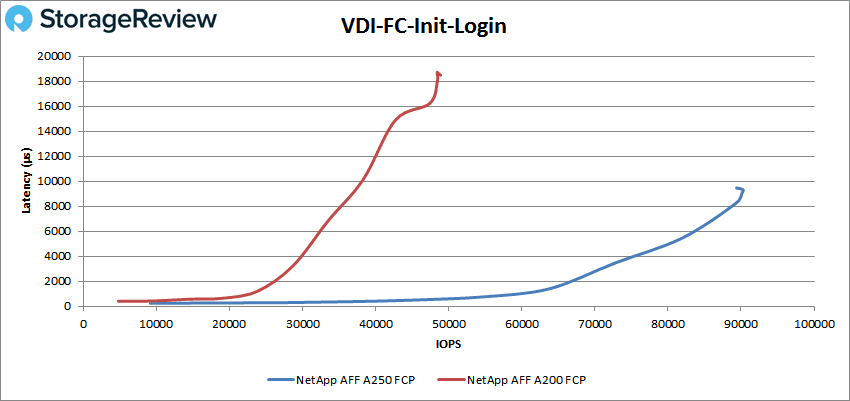
In VDI FC Initial Login, the A250 had sub-millisecond latency performance until about 55K IOPS and went on to peak at 90,270 IOPS with a latency of 9.3ms. This is half the latency of the A200 exactly and about 42K IOPS higher in performance.
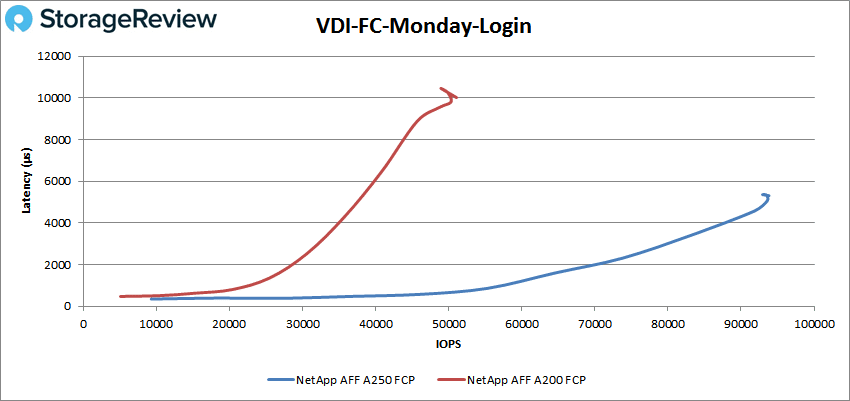
VDI FC Monday Login saw the A250 have performance with latency under 1ms until about 55K IOPS again and went on to peak at 93,574 IOPS and a latency of 5.1ms. While not quite double the performance of the A200, it is 44K IOPS higher and 5.3ms lower in latency.
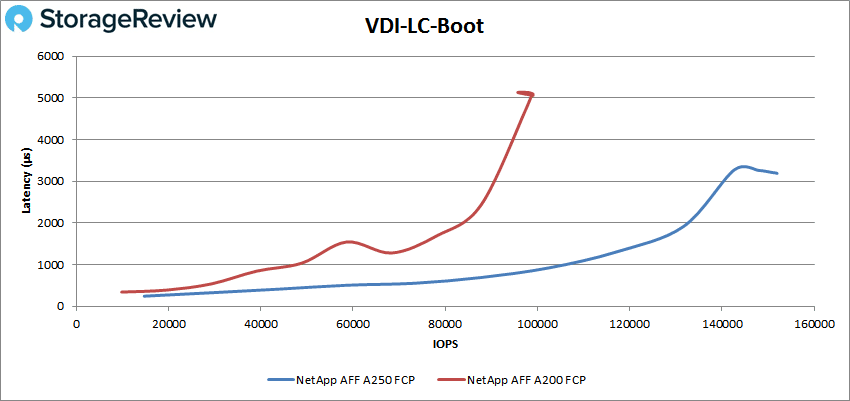
Now we move on to linked clone. In VDI LC Boot, the A250 stayed under 1ms until it was over 100K IOPS and peaked at 151,953 IOPS and a latency of 3.2ms.
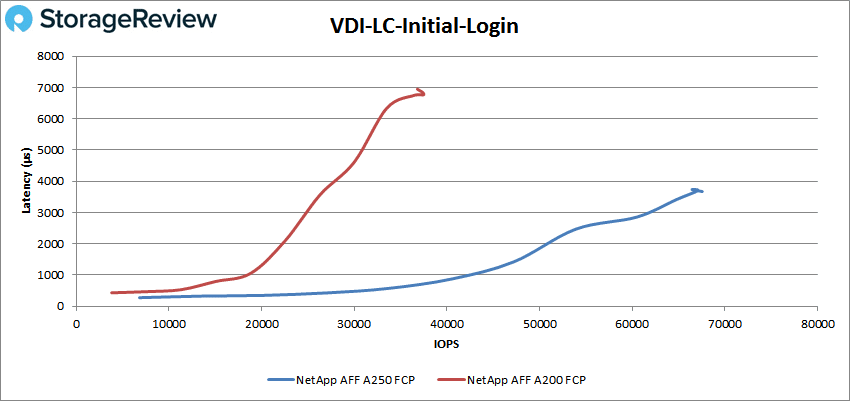
With VDI LC Initial Login, the A250 had sub-millisecond latency until it went over 40K IOPS and went on to peak 67,557 IOPS and a latency of 3.7ms. Not quite double the performance or half the latency, but impressive nonetheless.
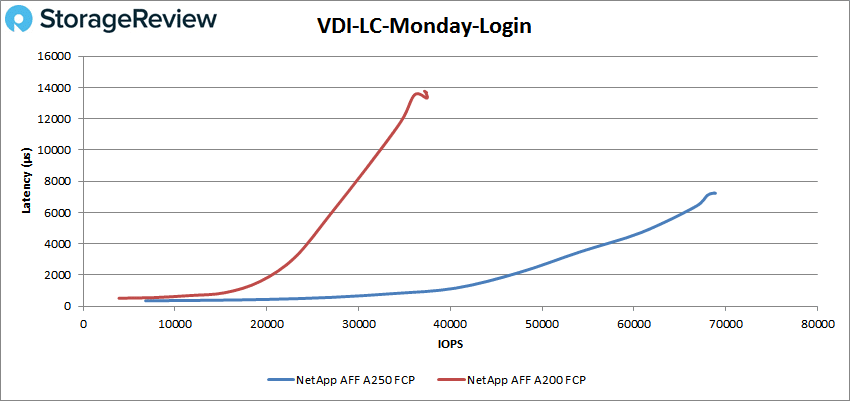
Finally, with VDI LC Monday Login, the A250 almost made it to 40K IOPS under 1ms for latency and went on to peak at 68,751 IOPS at a latency of 7.3ms. Another impressive jump in performance and drop in latency.
Conclusion
NetApp continues to expand and evolve its all-flash line to keep in check with the changing times and the changing needs. To this end, the company has rolled out the NetApp AFF A250, an updated entry-midrange storage array. Like most of the rest of the AFF line, the A250 comes with end-to-end NVMe that includes support for NVMe over FC (NVMe/FC) host connectivity. The A250 brings all of the top-end benefits of the AFF line at entry-level prices with some boots over the A200, 45% more performance, and 33% more storage efficiency. The new array leverages NetApp ONTAP 9.8 and all of the new benefits that come with the software.
For performance, we ran both our Application Workload Analysis and VDBench workloads. For comparison purposes, we looked at the previous model, the NetApp AFF A200. In our Application Workload Analysis, we turned DR on with both the A250 and the A200. That being the case, the A250 had aggregate average latencies in SQL Server of 22.75ms for 8VM and 8.5ms for 4VM. The A200 had 25ms for 4VM, almost triple the latency versus the A250 at VMs.
With Sysbench the A250 was equally impressive with an aggregate TPS of 13,135 for 8VM and 16,149 TPS for 16VM compared to the A200’s 8,871 TPS and 9,035 TPS, respectively. Sysbench average latency saw aggregate scores of 19.5ms in 8VM and 32ms in 16VM compared to the A200’s 29ms and 57ms respectively. In worst-case scenario latency, we saw the A250 hit aggregate latencies of 52ms in 8VM and 86ms in 16VM compared to the A200’s 85ms and 152ms.
With VDBench, highlights include 594K IOPS in 4K read, 170K IOPS in 4K write, 7.13GB/s in 64K read, and 2.6GB/s in 64K write. In our SQL tests, we saw peaks of 348K IOPS, 322K IOPS in SQL 90-10, and 263K IOPS in SQL 80-20. With our Oracle tests, we saw peak performances of 264K IOPS, 333K IOPS in Oracle 90-10, and 274K IOPS in Oracle 80-20. In our VDI Clone tests, we saw Full Clone results of 230K IOPS Boot, 90K IOPS in Initial Login, and 94K IOPS in Monday Login. For Linked Clone, we saw peaks of 152K IOPS in Boot, 68K IOPS in Initial Login, and 69K IOPS in Monday Login. For the two-thirds of our testing here, we saw nearly or more than double the performance with half the latency.
For an entry-midrange array, the NetApp AFF A250 is incredibly impressive. The A250 replaces the A200, to which we gave an Editor’s Choice award in 2017 and still leverage in the lab to this day. The A250, in several cases, was able to double performance while cutting latency in half. In almost any case, the A250 will act as an excellent storage array for its intended use cases at the edge or within a small business. Orgs that may not be ready for NCMe/FC today can rest assured that there’s even more performance available within the box, should it need to be called upon. Overall, the A250 is another fantastic offering from NetApp, earning them another Editor’s Choice Award. The A250 is simply a best-in-class solution.


 Amazon