

Two things tend to come up first whenever the conversation turns to the NVIDIA DGX Spark. The first is the headline spec: 128 GB of unified memory in a roughly $4,000 desktop box, a number that would have seemed implausible to put on an engineer’s desk even two years ago. The second is the 200 GB network on the back of the unit. The presence of a real datacenter-class fabric on a desktop appliance is what makes people lean forward, because it implies something more than a faster single-box workstation. It implies the ability to connect Sparks and replicate physically, the kind of multi-node setup that used to live exclusively in a rack.
This review examines that capability. We benchmark distributed inference across all three OEM Spark implementations we have on hand, paired into two-node clusters connected over the 200 Gb fabric, and swept across model variants and three workload shapes. We also make a deliberate methodological choice about how the model is split between the two boxes that diverges from NVIDIA’s default recommendation, and we defend it with data. Before any of that, though, two pieces of context shape everything that follows: the network that makes clustering possible in the first place, and the reasons a person might or might not want to use it.
The 200 GB Fabric
We covered the networking implementation in detail in our original DGX Spark review, but the basics are worth restating because everything in this review depends on them. The back of every Spark carries two QSFP56 cages driven by an integrated NVIDIA ConnectX-7 SmartNIC. On paper, the two cages suggest 400 GB of aggregate connectivity, but PCIe is the real ceiling: the ConnectX-7 lives behind a pair of Gen5 x4 links, and the platform tops out at 200 GB of usable bandwidth, no matter how the cages are wired. A single populated QSFP56 cage already gives you the full 200 Gb the box supports, so the second port is there for topology flexibility rather than additional throughput.
That flexibility shows up in three common configurations. The simplest is a single 200 GB port used as a direct Spark-to-Spark link, which is what NVIDIA’s validated two-node setup specifies and what we used for this review. The second is two 100 Gb ports setting up a ring-like topology between Sparks to cluster without a switch. The third is a split-role configuration where one cage goes to a peer Spark for clustering and the other goes to high-speed storage over NVMe-oF, which is useful when the working dataset will not fit on the Spark’s internal NVMe.
NVIDIA sells the Spark in three configurations that map directly to how that network gets used. A single Spark for individual desktop work, a validated two-Spark cluster directly connected over the 200 Gb fabric for stretched models, and, as of GTC this year, a four-unit configuration that NVIDIA demonstrated publicly in response to user demand to push past the two-node limit. The dual-Spark configuration is the one NVIDIA actively markets, the one most readers will actually deploy, and the one we believe represents the sensible upper bound for production-style inference on this hardware. It is also the one this review benchmarks end-to-end.
Why Cluster Sparks in the First Place
The obvious reason to cluster Sparks is the same as for any cluster: a single 128 GB box cannot hold every model that matters. Stretching a 120B-parameter model across two boxes opens up a class of workloads that would otherwise not fit. That is the headline use case, and it is the one that gets demoed the most.
The less obvious reason, and arguably the more important one for NVIDIA’s actual customer base on this platform, is learning. NVIDIA positions the Spark as an entry point. Their official documentation, sample notebooks, and partner playbooks treat the box as a teaching appliance. They include first-class guides for everything from spinning up a pre-built model behind a local chat interface to running a coding assistant against a hosted endpoint to fine-tuning small models to building end-to-end applications in PyTorch and JAX. The pitch is that someone who has never written a CUDA kernel in their life can get from zero to a working AI workflow at their desk in a weekend, and the same applies to engineers in a non-ML field who want a self-contained sandbox they fully control. A two-Spark cluster extends that teaching surface into multi-node territory: the same person can now also learn how tensor parallelism, pipeline parallelism, and collective communication libraries actually behave, with a network that is real enough to expose real bottlenecks.
What is conspicuously absent from any of NVIDIA’s own positioning, though, is a claim that the Spark is for production inference serving. Jensen has talked about hardware-software co-design in nearly every keynote for the last several years, and the principle applies here. Every NVIDIA platform is optimized for a specific workload shape, and Spark is optimized for individual exploration and learning, not for serving traffic. Our previous Spark reviews have already shown that the platform is heavily memory-bandwidth-bound on most inference tasks, and the network only sharpens that constraint as soon as you cluster. A single 200 Gb link, while impressive for a desktop, is meaningfully slower than a PCIe Gen5 x16 connection within a single chassis, and collective communication patterns that work cleanly across an NVLink-bridged pair of datacenter GPUs do not transplant to a 200 Gb fabric without incurring real latency penalties.
That is the real reason NVIDIA limited the officially supported configuration to two Sparks for so long, and why the four-unit demonstration at GTC was a response to user demand rather than an organic product expansion. Nothing prevents the software stack from running on four or eight nodes, and several users and outlets have published results from larger clusters. The performance numbers from those experiments are generally not flattering: the inter-node fabric becomes the dominant cost, and the collective performance degrades sharply, and to add to that, the per-user throughput at the tail end of those configurations can drop into the single-digit tokens per second range for any model large enough to justify the cluster in the first place. At that point, the setup is functionally a learning lab rather than a serving platform.
None of that is meant as a dismissal. Clustering Sparks is a genuinely excellent way to develop an intuition for distributed inference and training that is otherwise locked behind hundreds of thousands of dollars of datacenter hardware, and the educational value of being able to actually see pipeline bubbles, all-reduce bottlenecks, and parallelism trade-offs on a system you own is significant. Our own follow-up plan was to take this further by training a small 1B-parameter or sub-1 B model from scratch across a dual-Spark cluster, with a setup chosen to mirror as closely as possible the conditions under which a real distributed pre-training run operates, so we could show exactly where this class of cluster does and does not make sense. That project is currently on the back burner while we work through other coverage you may have already seen and wait for the optics for our new 800 Gb lab core switch to arrive. We expect to revisit it once the lab build settles.
What follows focuses on the use case for which the dual-Spark configuration is most defensible: distributed inference of models large enough to require both boxes, benchmarked across all three OEM implementations we have on hand. Before getting to the per-model numbers, the next section explains why we are reporting those numbers under a pipeline-parallel configuration rather than the tensor-parallel configuration that NVIDIA’s own documentation tends to default to.
Performance Testing
Why We Report Pipeline Parallel, Not Tensor Parallel
NVIDIA’s published DGX Spark guides and most of their reference material rely on tensor parallelism (TP) to describe how to scale a model across two Spark boxes. TP splits every matrix multiplication across both GPUs, so each layer runs on both devices simultaneously, and the partial results are combined through an all-reduce after every attention and MLP block. Pipeline parallelism (PP) takes a different route: it cuts the model in half by layer, places the first half on one box and the second half on the other, and then streams activations between them. Each request still flows through the full model, but at any given instant, only one box is doing the math for a given token while the other is working on the next microbatch.
The trade-off comes down to what travels over the wire. A dual-Spark stack connects the two systems via a ConnectX-7 200 GbE link, which is fast for a network link but slow compared to the memory bandwidth within a single Spark. TP’s all-reduce fires twice per transformer layer, so an 80-layer model running TP=2 generates 160 cross-box exchanges for every single token of output, with every one of those exchanges blocking the next computation. PP=2 only hands off activations once per token, at the seam between the model’s two halves. On a 200 GbE link with non-trivial latency, that difference dominates everything else.
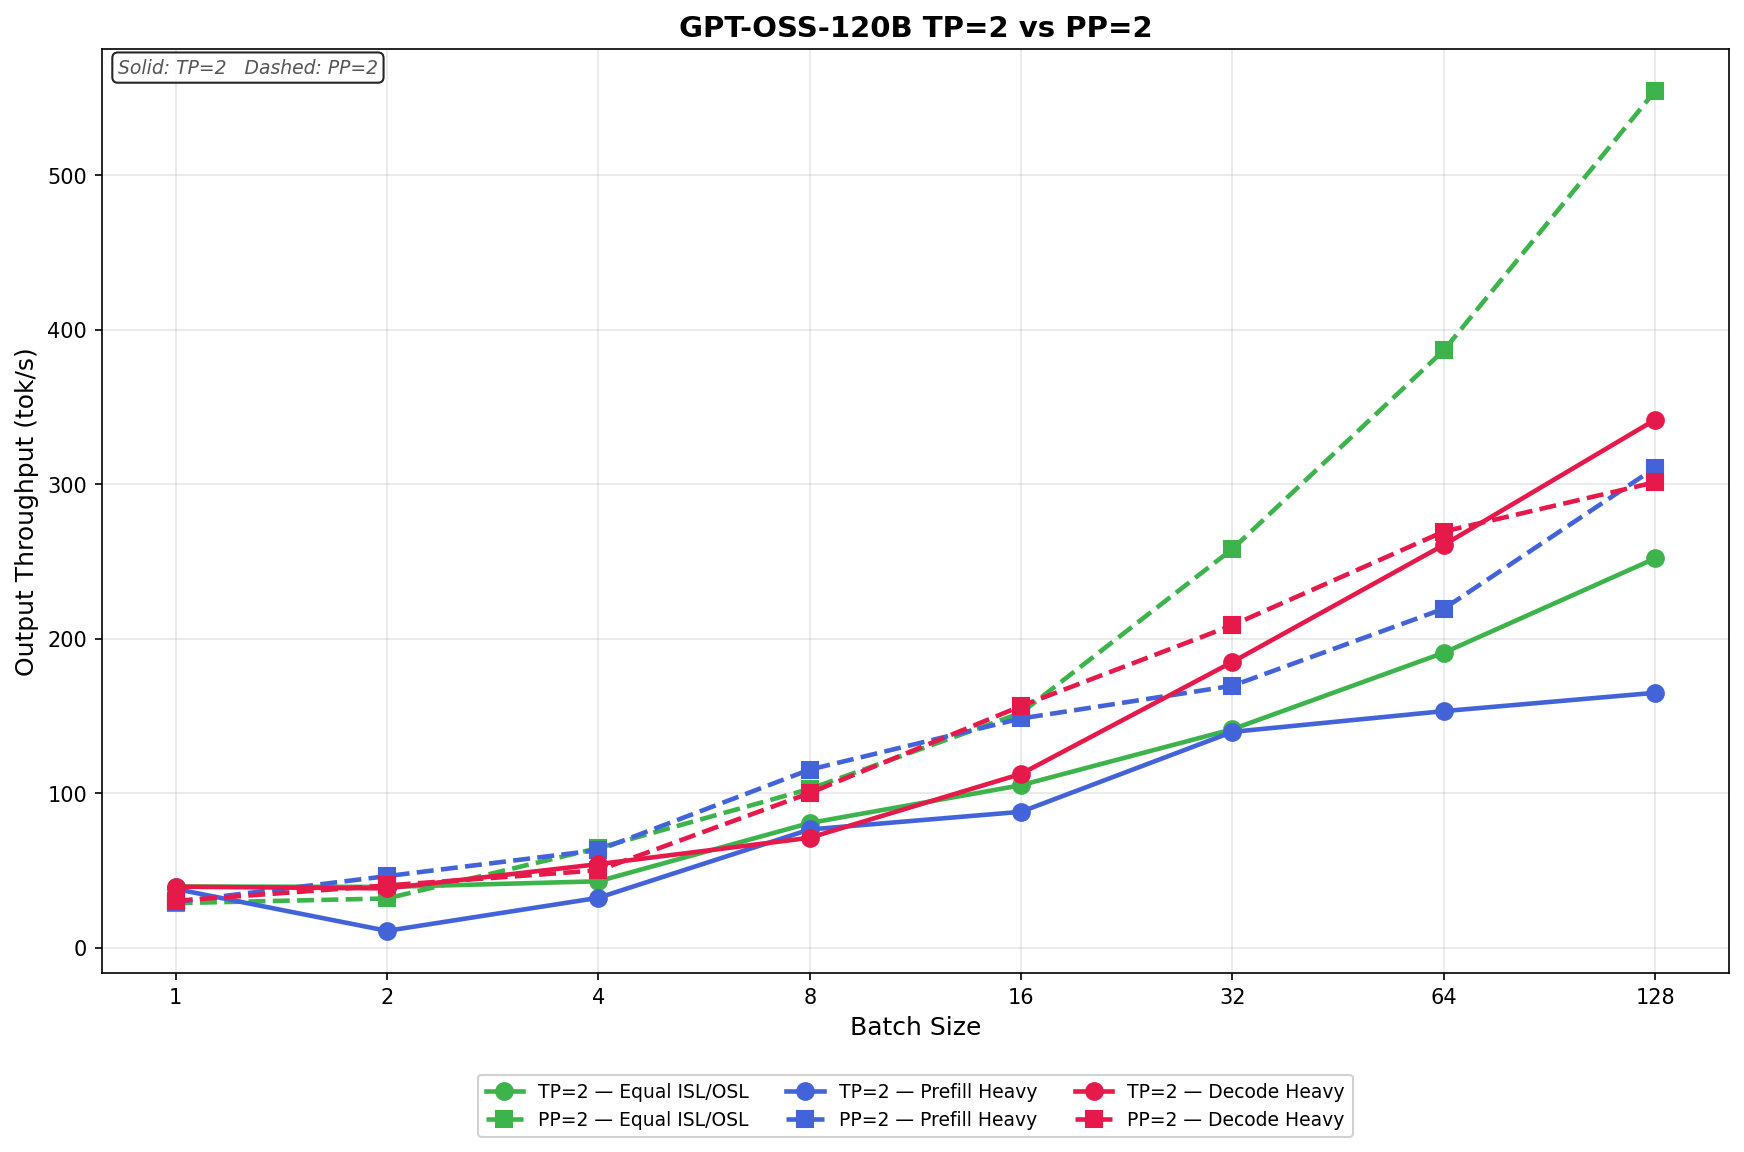
Our GPT-OSS-120B measurements clearly bear this out. Outside of batch size 1, where the workload is too thin to hide either strategy’s overhead, PP=2 takes the lead and maintains it as concurrency grows. In the Equal ISL/OSL workload, TP=2 reaches 252.01 tok/s at a batch size of 128, while PP=2 climbs to 554.69 tok/s on the same hardware, a 2.20x advantage. Prefill Heavy shows the same shape, with PP=2 finishing at 310.63 tok/s versus TP=2 at 164.99 tok/s. The Decode Heavy scenario is the closest of the three, but PP=2 still leads from batch size 8 through batch size 64, only handing back a modest lead at batch size 128, where the long 8K output amplifies pipeline bubble cost.
TP=2 does have a narrow window where it wins. At batch size 1 in every scenario, TP delivers a small but real edge: 39.55 tok/s vs 28.79 tok/s in Equal, 37.97 vs 29.60 in Prefill Heavy, and 39.42 vs 30.28 in Decode Heavy. With one request in flight, there is no second microbatch to keep the idle pipeline stage busy, so PP pays for an empty slot every step while TP gets to use both GPUs on the only token that exists. This is the regime NVIDIA’s TP guidance is built for: interactive single-stream serving where latency on the first and only request matters more than aggregate throughput. If a deployment is genuinely chat-style, with one user per box and tight TTFT targets, TP=2 is the right call, and this also aligns with how NVIDIA views the Spark.
For workloads that serve infrastructure at scale, with batched inference and many concurrent requests, Pipeline parallelism is the better fit when scaling across boxes, especially when strategies like Expert Parallelism are not in play. The 200 GbE fabric cannot sustain TP’s per-token all-reduce traffic without leaving compute idle, and once the batch size is 4 or 8, PP’s bubble cost vanishes into the steady-state stream. That is why every per-model number in the rest of this article is reported with TP=1 and PP=2. It is the configuration that actually represents what a dual-Spark deployment can deliver when asked to do real work.
We deliberately chose GPT-OSS-120B as the headline TP vs PP chart because it shows the widest gap. However, we also want to show that this does not hold for all models, and that these parameters depend on the model’s parameters. Llama-3.1-8B-Instruct at BF16 tells a much more conservative story. The model is small enough that each layer’s computation is fast and TP’s all-reduce traffic is correspondingly modest. In contrast, PP’s per-step coordination cost is fixed regardless of model size. The result is that TP=2 holds the lead across nearly the entire batch sweep. In Equal ISL/OSL, TP=2 leads from batch size 1 (23.2 vs 13.4 tok/s) through batch size 32 (388.7 vs 349.3 tok/s), and only loses the top at batch size 64 (524.8 vs 638.2 tok/s) and batch size 128 (679.2 vs 1,047.1 tok/s). Prefill Heavy follows the same pattern, with TP=2 ahead through batch size 32 before PP=2 takes over at 64 and 128. Decode Heavy is the most decisive: TP=2 wins at every single batch size, finishing at 366.7 tok/s versus 330.5 tok/s for PP=2 at batch size 128.
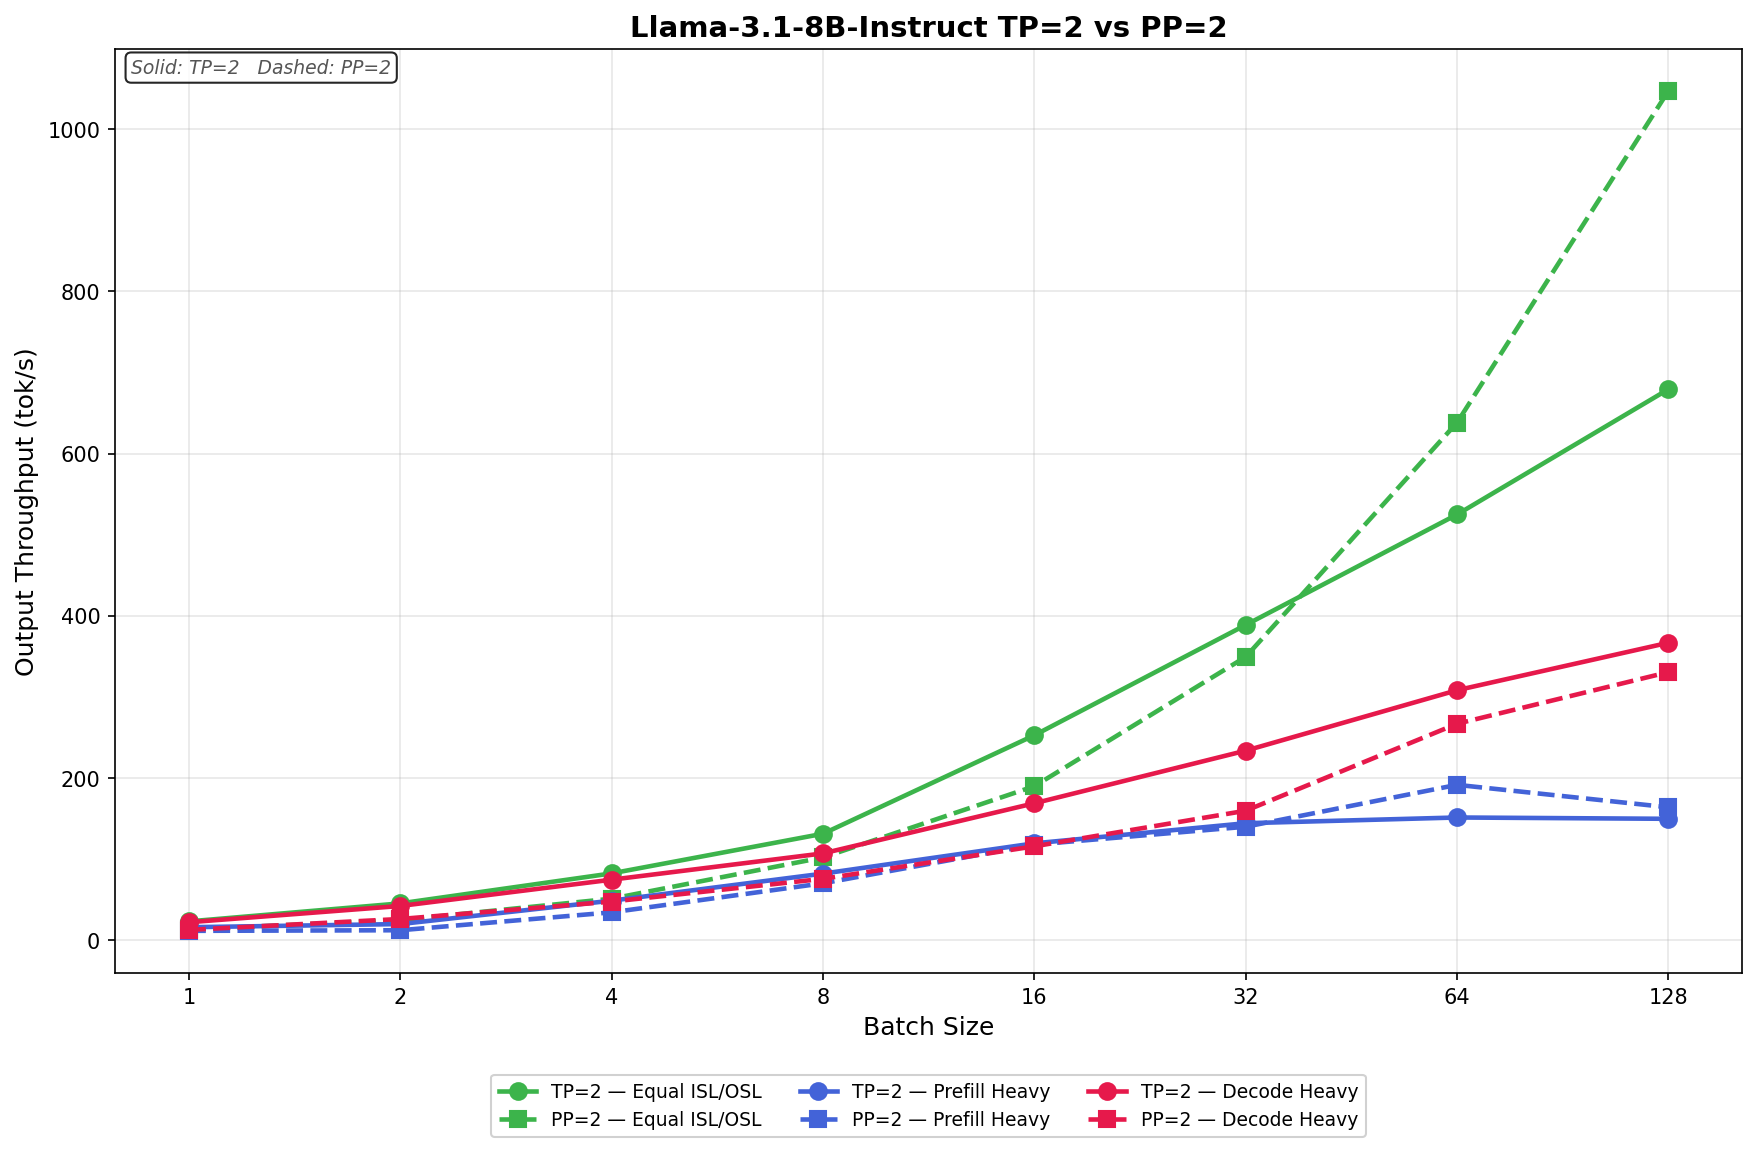
This counterexample reinforces, rather than contradicts, the underlying mechanics. PP=2 only wins once batch sizes are high enough to fill the pipeline and fully amortize the bubble cost, and when the model itself is small enough that TP’s per-layer all-reduce is cheap; that crossover point gets pushed further out. The Decode Heavy result is also consistent: longer output sequences mean more decode steps, more pipeline bubbles paid back back-to-back, and a smaller window for PP to make up the difference. In other words, the same physics that hands PP a 2.20x win on GPT-OSS-120B at batch size 128 also explains why it only wins the top two batch sizes on an 8B model and never wins the decode-heavy sweep.
GPT-OSS-120B
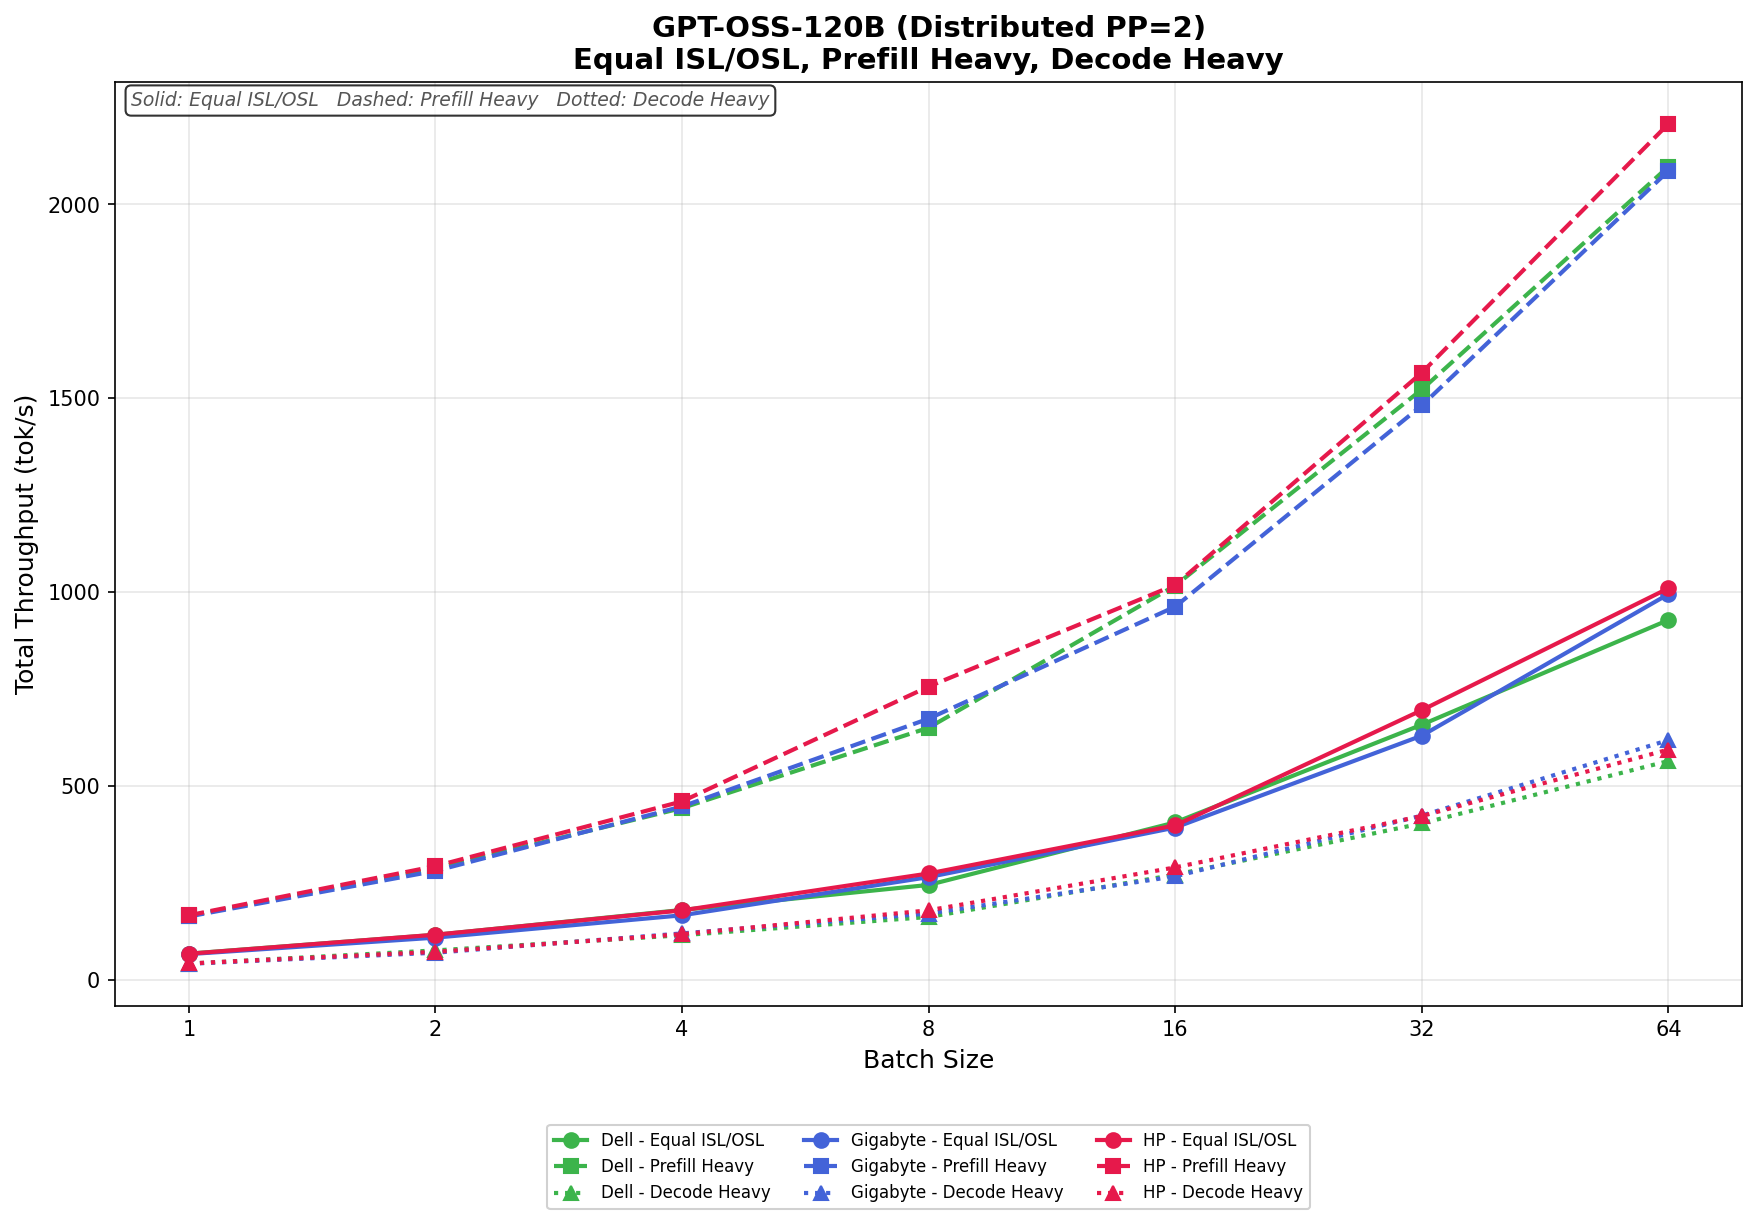
In Equal ISL/OSL, Dell starts at 67.06 tok/s and scales up to 927.93 tok/s with a batch size of 64. GIGABYTE begins slightly lower at 65.77 tok/s but finishes stronger at 994.53 tok/s, while HP leads the group at the top end with 1,009.75 tok/s. The spread remains tight through most of the sweep, with HP pulling ahead from batch size 32 onward.
In Prefill Heavy, throughput increases much more aggressively across the board. Dell scales from 164.42 tok/s to 2,097.80 tok/s, GIGABYTE moves from 162.96 tok/s to 2,086.72 tok/s, and HP posts the strongest result, climbing from 165.95 tok/s to 2,208.16 tok/s. HP leads at nearly every batch size, while Dell and GIGABYTE remain tightly grouped, especially at batch sizes 32 and 64.
In Decode Heavy, overall performance is lower, as expected for the decode workload. Dell ranges from 41.20 tok/s to 563.98 tok/s, GIGABYTE scales from 40.83 tok/s to 617.96 tok/s, and HP moves from 41.63 tok/s to 593.56 tok/s. GIGABYTE has the strongest finish at a batch size of 64, while HP leads in the mid-range, and Dell remains close but trails slightly at higher concurrency.
GPT-OSS-20B
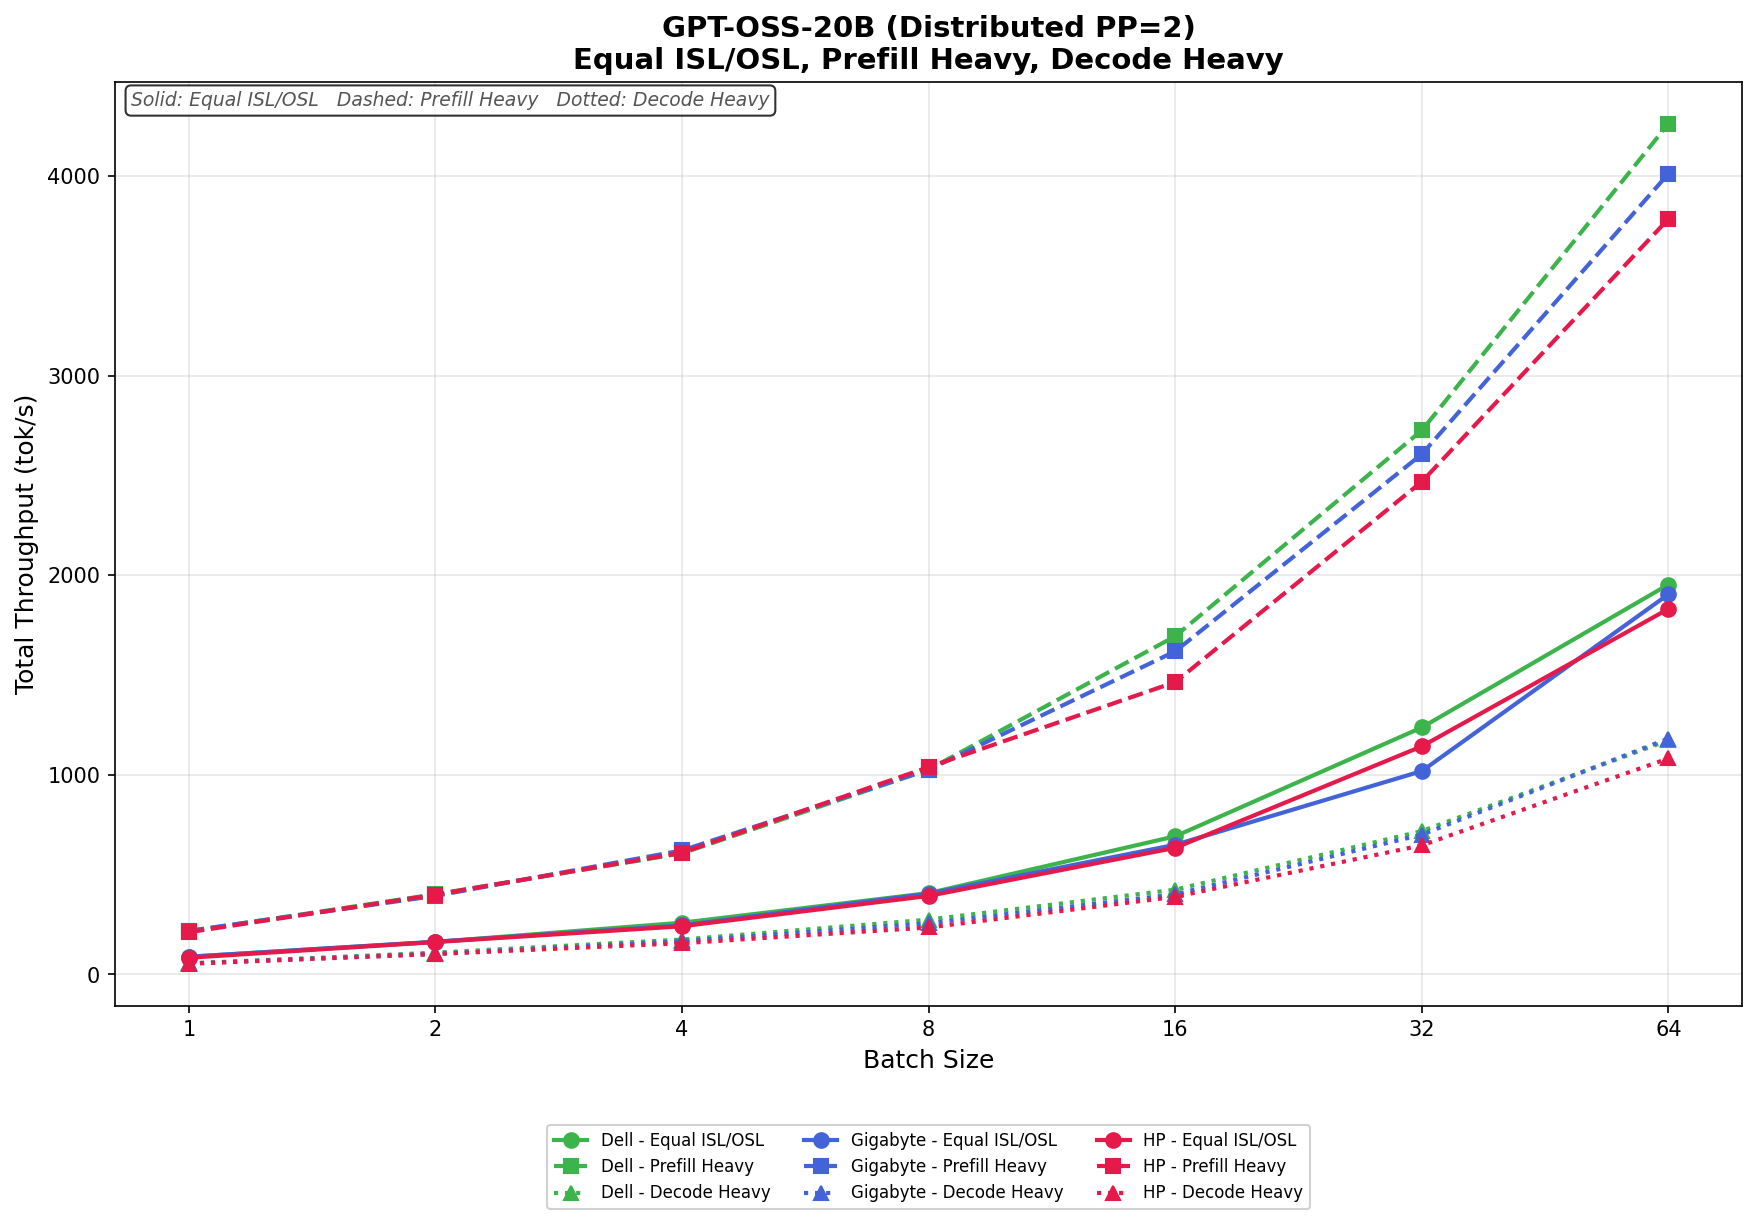
In Equal ISL/OSL, Dell leads most of the sweep, scaling from 88.73 tok/s at batch size 1 to 1,953.55 tok/s at batch size 64. GIGABYTE follows closely, increasing from 88.42 tok/s to 1,904.62 tok/s, while HP ranges from 83.49 tok/s to 1,831.45 tok/s. Dell maintains the strongest upper-end scaling overall, particularly from batch size 16 onward.
In Prefill Heavy, throughput ramps aggressively across all three systems. Dell delivers the highest result in this test, scaling from 216.05 tok/s to 4,261.96 tok/s at a batch size of 64. GIGABYTE follows at 4,011.86 tok/s, while HP reaches 3,785.25 tok/s. The three systems remain tightly grouped at smaller batch sizes, but Dell begins to separate itself at batch size 16 and extends its lead through the remainder of the sweep.
In Decode Heavy, scaling is more gradual but remains strong across all platforms. Dell ranges from 54.88 tok/s to 1,173.31 tok/s, GIGABYTE scales from 55.24 tok/s to 1,181.94 tok/s, and HP increases from 53.20 tok/s to 1,082.23 tok/s. GIGABYTE narrowly edges out Dell at the highest batch size, while HP trails both systems at higher concurrency levels.
Llama 3.1 8B Instruct Base
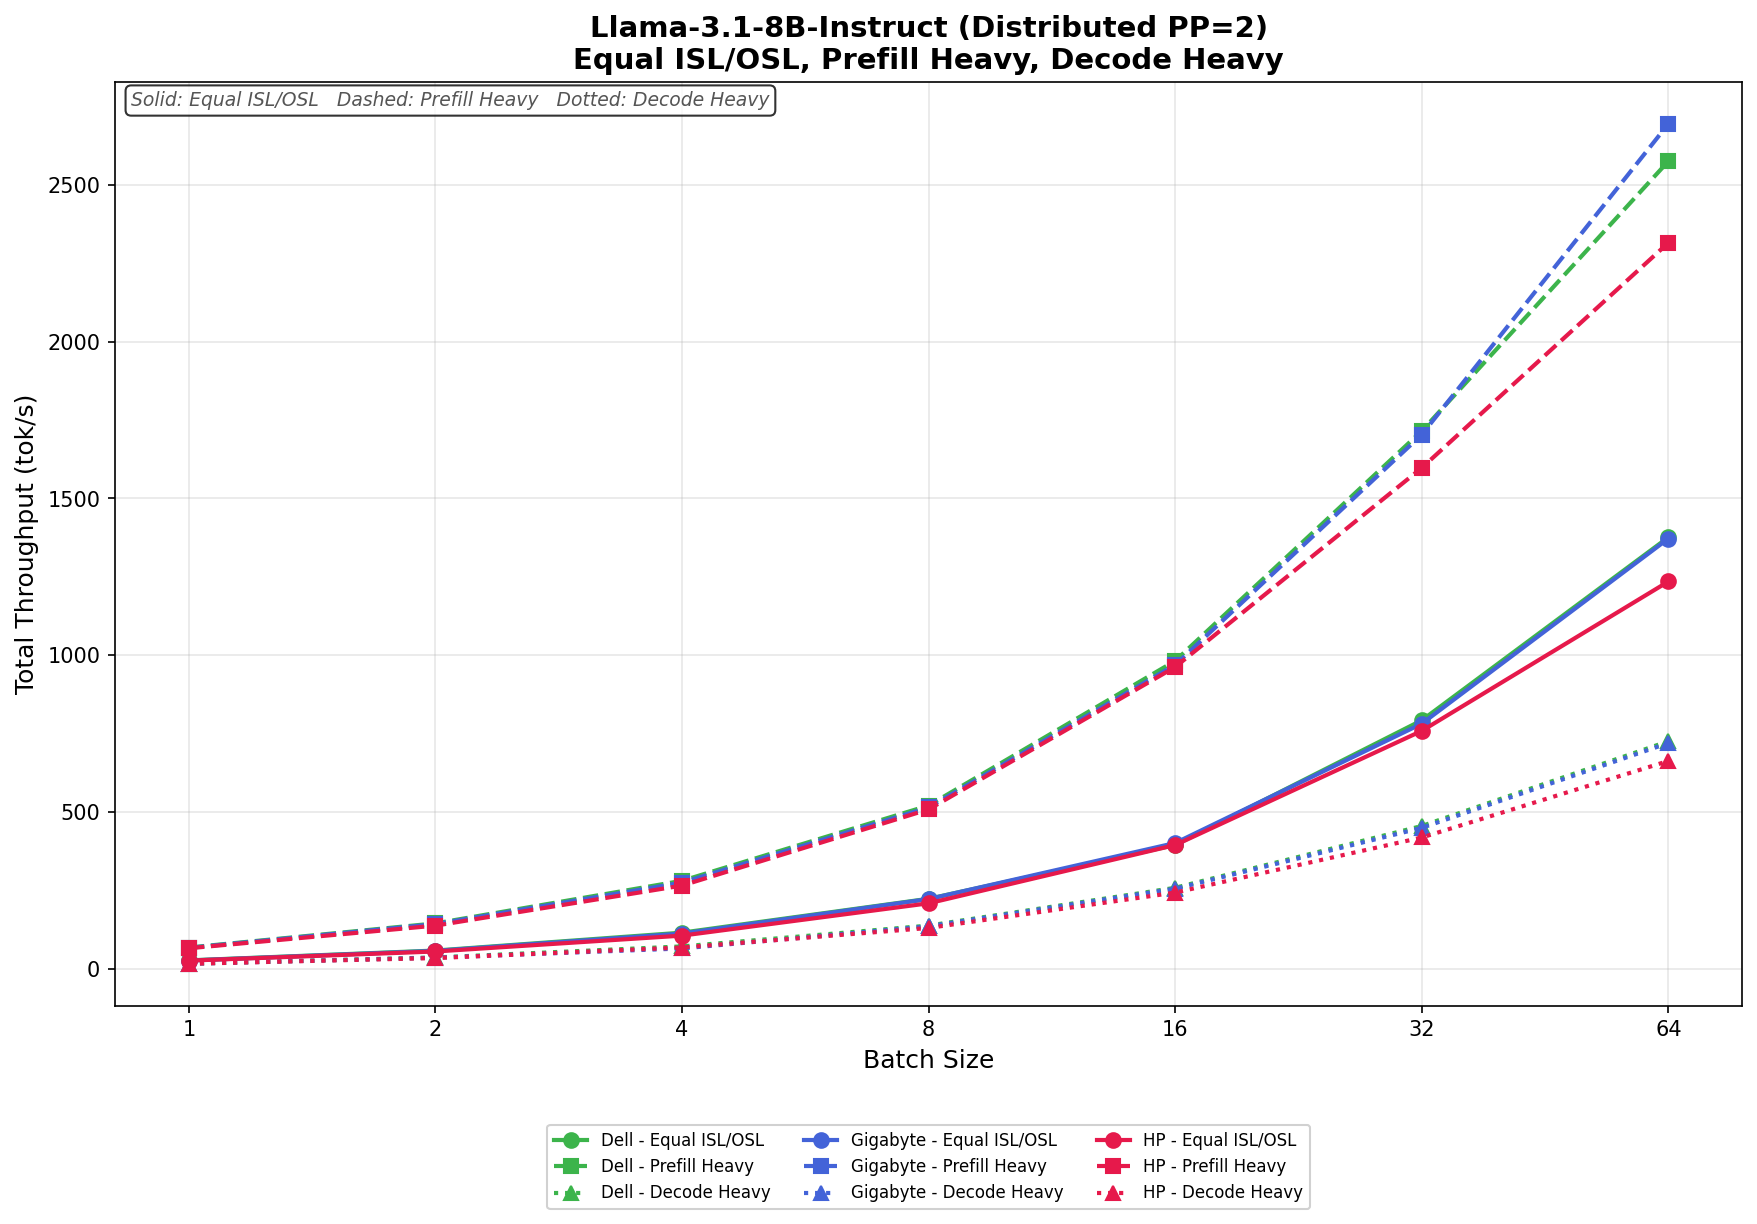
In Equal ISL/OSL, Dell scales from 27.69 tok/s to 1,376.38 tok/s at batch size 64, narrowly ahead of GIGABYTE, which ranges from 27.23 tok/s to 1,372.27 tok/s. HP trails slightly throughout the sweep, scaling from 26.89 tok/s to 1,235.32 tok/s. All three systems track very closely through a batch size of 16 before Dell begins to open a small lead at higher concurrency levels.
In Prefill Heavy, throughput increases aggressively as batch sizes rise. Dell grows from 68.60 tok/s to 2,575.25 tok/s, while GIGABYTE ultimately posts the strongest result, scaling from 67.49 tok/s to 2,694.25 tok/s at batch size 64. HP reaches 2,315.15 tok/s, remaining competitive but consistently behind Dell and GIGABYTE at higher batch sizes. GIGABYTE takes the lead at the upper end, particularly for batch sizes of 64 or more.
In Decode Heavy, scaling remains steady across the sweep. Dell ranges from 17.19 tok/s to 726.22 tok/s, GIGABYTE scales from 16.96 tok/s to 720.57 tok/s, and HP moves from 16.79 tok/s to 663.31 tok/s. Dell and GIGABYTE remain nearly identical throughout most of the test, with Dell holding a narrow advantage at the highest concurrency levels. At the same time, HP falls slightly behind at larger batch sizes.
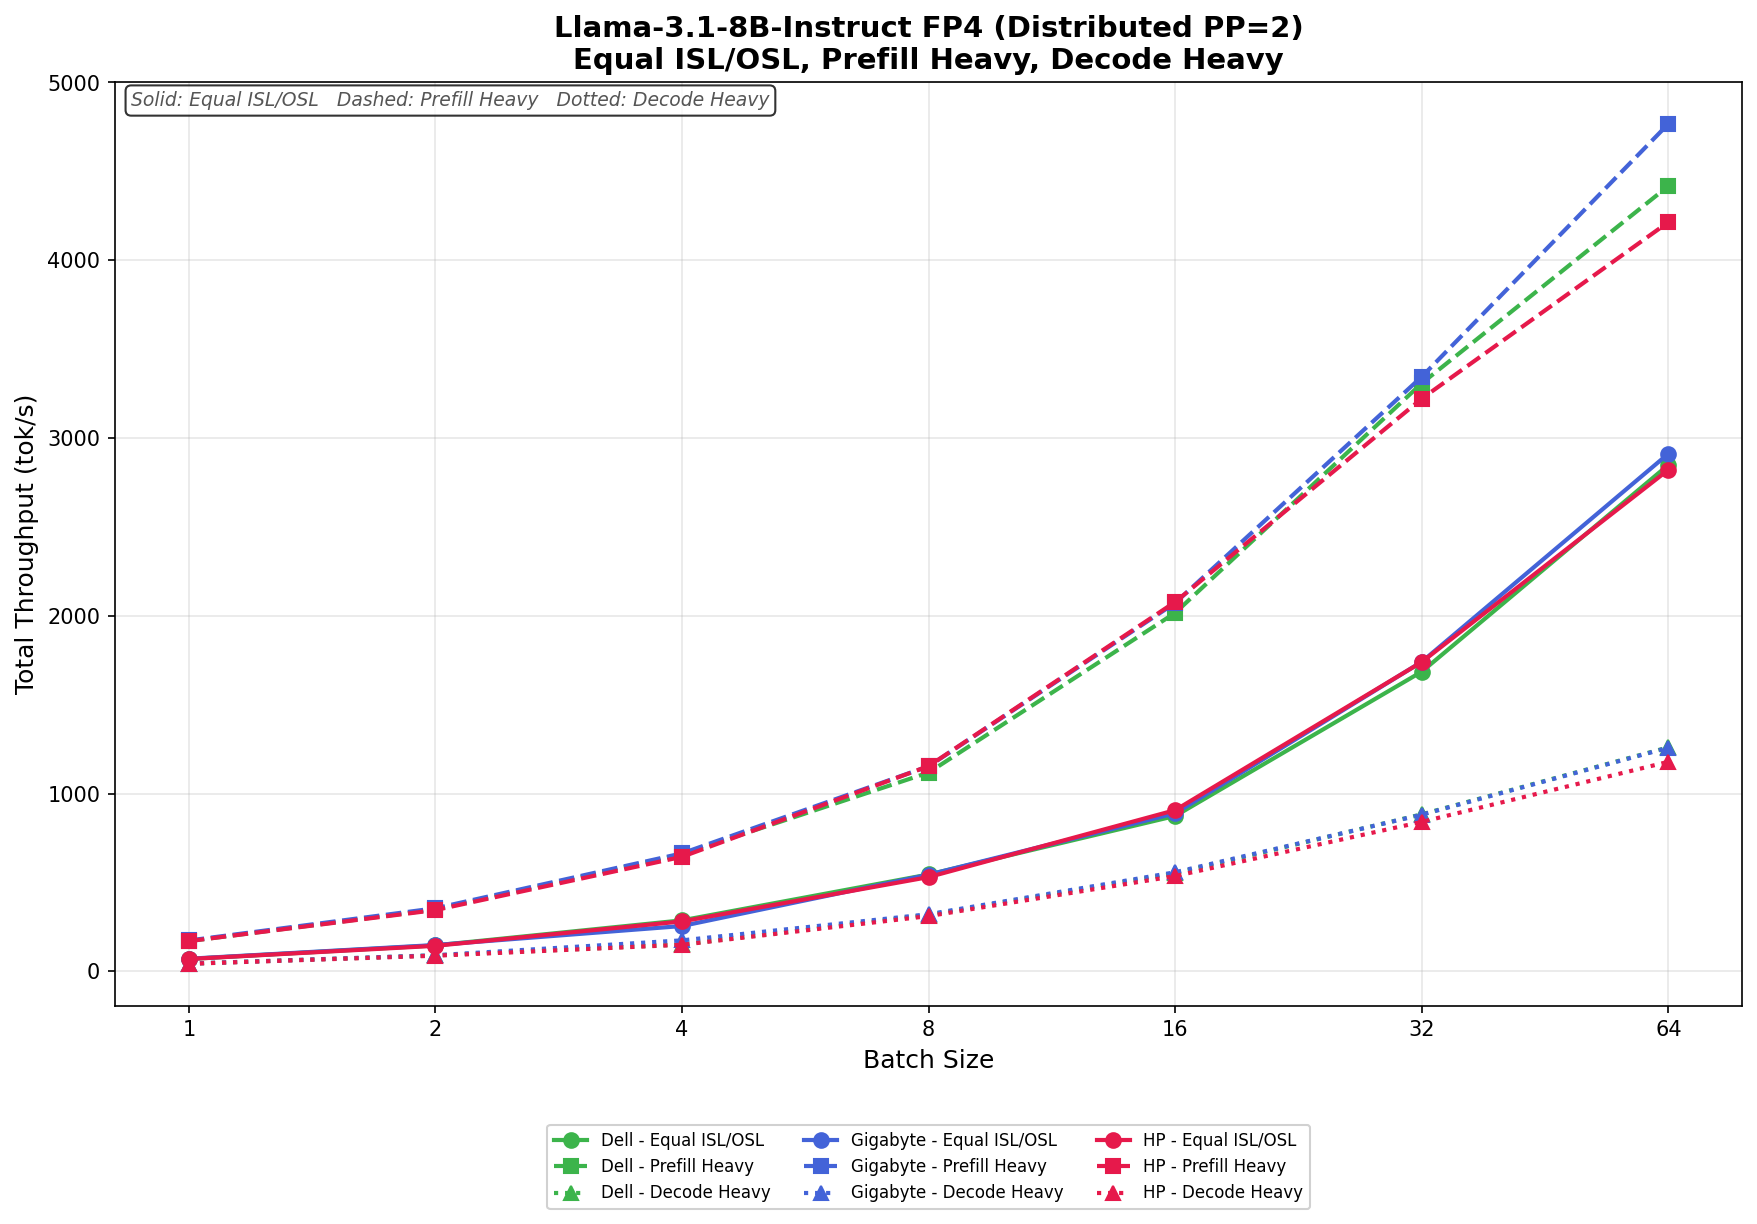
Llama 3.1 8B Instruct FP4
In Equal ISL/OSL, Dell scales from 69.71 tok/s to 2,849.20 tok/s at batch size 64, while GIGABYTE edges slightly ahead, growing from 70.92 tok/s to 2,912.03 tok/s. HP remains competitive, ranging from 69.52 tok/s to 2,821.50 tok/s. The three systems stay tightly grouped across the entire workload, with only a small separation appearing at higher concurrency levels.
In Prefill Heavy, scaling becomes much more aggressive, particularly at larger batch sizes. Dell increases from 170.09 tok/s to 4,417.65 tok/s, while GIGABYTE posts the strongest result of the group, climbing from 173.55 tok/s to 4,767.43 tok/s at batch size 64. HP scales from 170.12 tok/s to 4,214.57 tok/s. GIGABYTE begins to separate from the field after a batch size of 32, delivering the strongest upper-end throughput on this workload.
In Decode Heavy, all three systems again remain closely aligned through most of the sweep. Dell ranges from 43.19 tok/s to 1,260.24 tok/s, GIGABYTE scales from 43.53 tok/s to 1,258.05 tok/s, and HP increases from 42.54 tok/s to 1,178.74 tok/s. Dell and GIGABYTE effectively trade the lead depending on batch size, while HP trails slightly behind both systems at the largest concurrency levels.
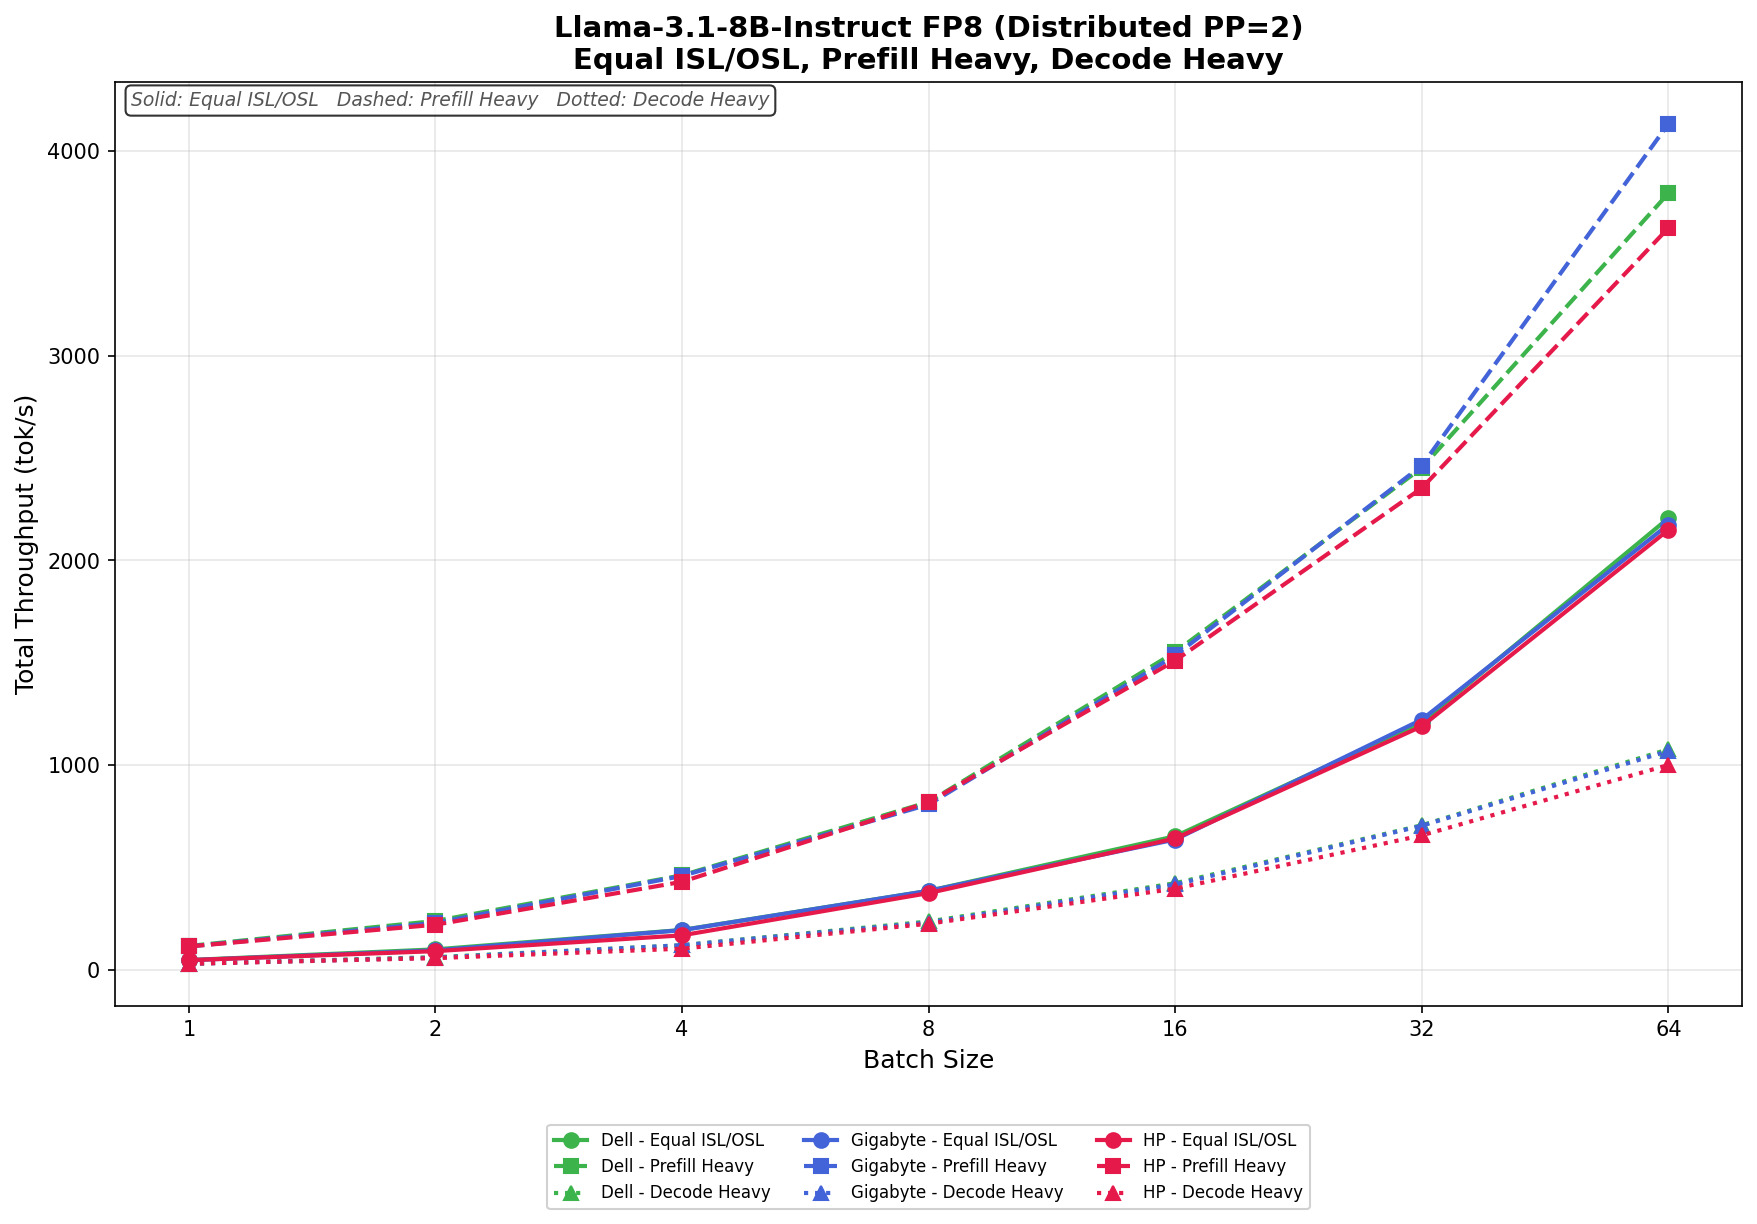
Llama 3.1 8B Instruct FP8
In Equal ISL/OSL, Dell scales from 46.93 tok/s to 2,206.52 tok/s at batch size 64, while GIGABYTE ranges from 46.16 tok/s to 2,175.44 tok/s. HP follows closely behind, increasing from 46.40 tok/s to 2,149.15 tok/s. The overall spread remains narrow throughout the test, with all three systems maintaining nearly identical scaling behavior through batch size 32.
In Prefill Heavy, throughput ramps more aggressively as concurrency increases. Dell grows from 115.85 tok/s to 3,794.52 tok/s, while GIGABYTE posts the strongest overall result, scaling from 113.34 tok/s to 4,133.76 tok/s at batch size 64. HP reaches 3,624.73 tok/s. GIGABYTE begins to establish a more pronounced lead at higher batch sizes, particularly from batch size 32 onward.
In Decode Heavy, the three systems remain tightly grouped at low concurrency levels before small separations emerge at high concurrency. Dell ranges from 29.11 tok/s to 1,077.07 tok/s, GIGABYTE scales from 28.64 tok/s to 1,068.92 tok/s, and HP increases from 28.68 tok/s to 1,000.20 tok/s. Dell maintains a narrow lead through most of the workload, with GIGABYTE tracking extremely close behind, while HP trails slightly at larger batch sizes.
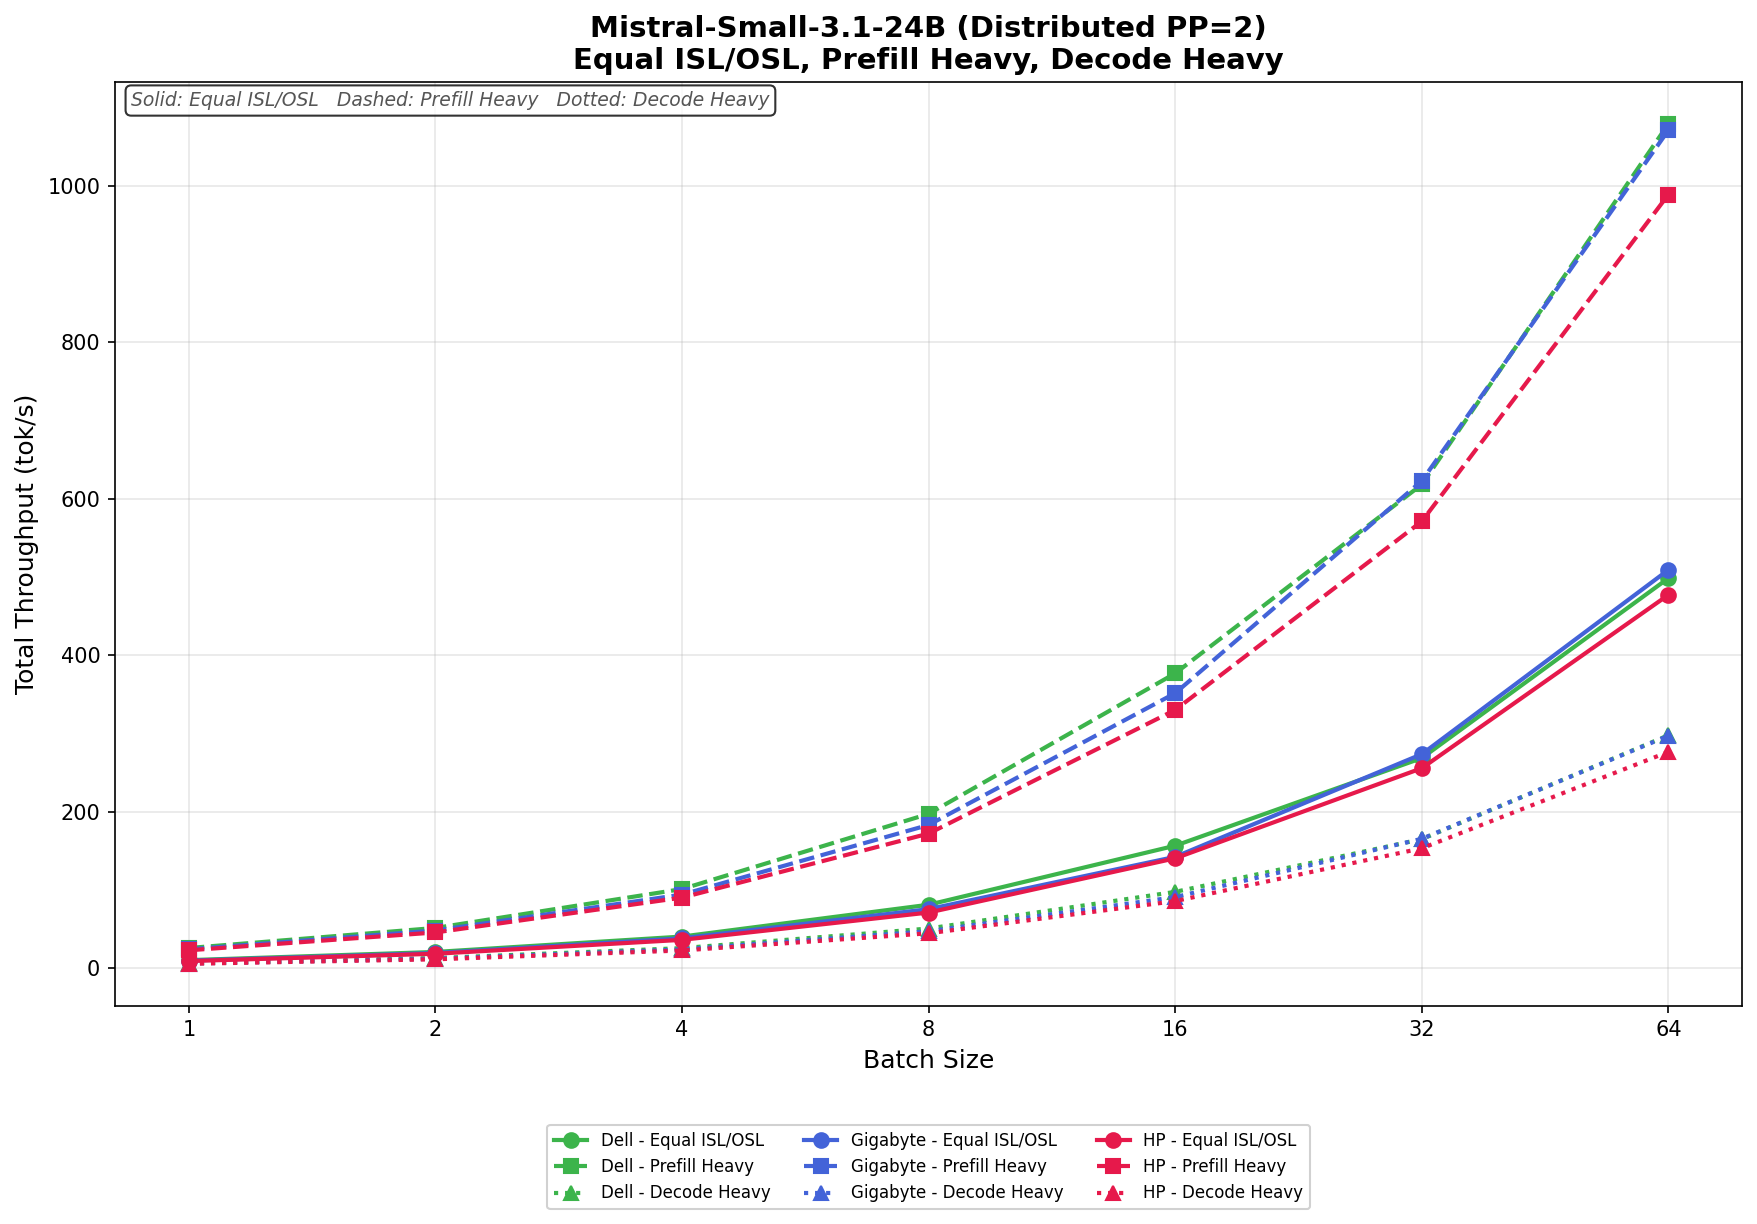
Mistral Small 3.1 24B
In Equal ISL/OSL, Dell scales from 10.41 tok/s to 498.56 tok/s at batch size 64, while GIGABYTE slightly edges ahead at the upper end, growing from 9.76 tok/s to 509.18 tok/s. HP trails modestly behind both systems, ranging from 9.25 tok/s to 477.25 tok/s. The gap between systems remains relatively small throughout the workload, particularly at lower and mid-range concurrency levels.
In Prefill Heavy, scaling improves substantially across all three systems. Dell increases from 25.91 tok/s to 1,079.19 tok/s, while GIGABYTE scales from 24.25 tok/s to 1,071.07 tok/s. HP reaches 988.82 tok/s with a batch size of 64. Dell and GIGABYTE remain nearly identical through most of the sweep, with Dell holding a slight advantage at the highest concurrency level.
In Decode Heavy, throughput remains significantly lower overall, as expected for the decode-focused workload on a larger model. Dell ranges from 6.49 tok/s to 297.82 tok/s, GIGABYTE scales from 6.10 tok/s to 297.23 tok/s, and HP increases from 5.77 tok/s to 276.55 tok/s. Dell and GIGABYTE are neck and neck throughout the test, while HP consistently trails slightly behind both systems at larger batch sizes.
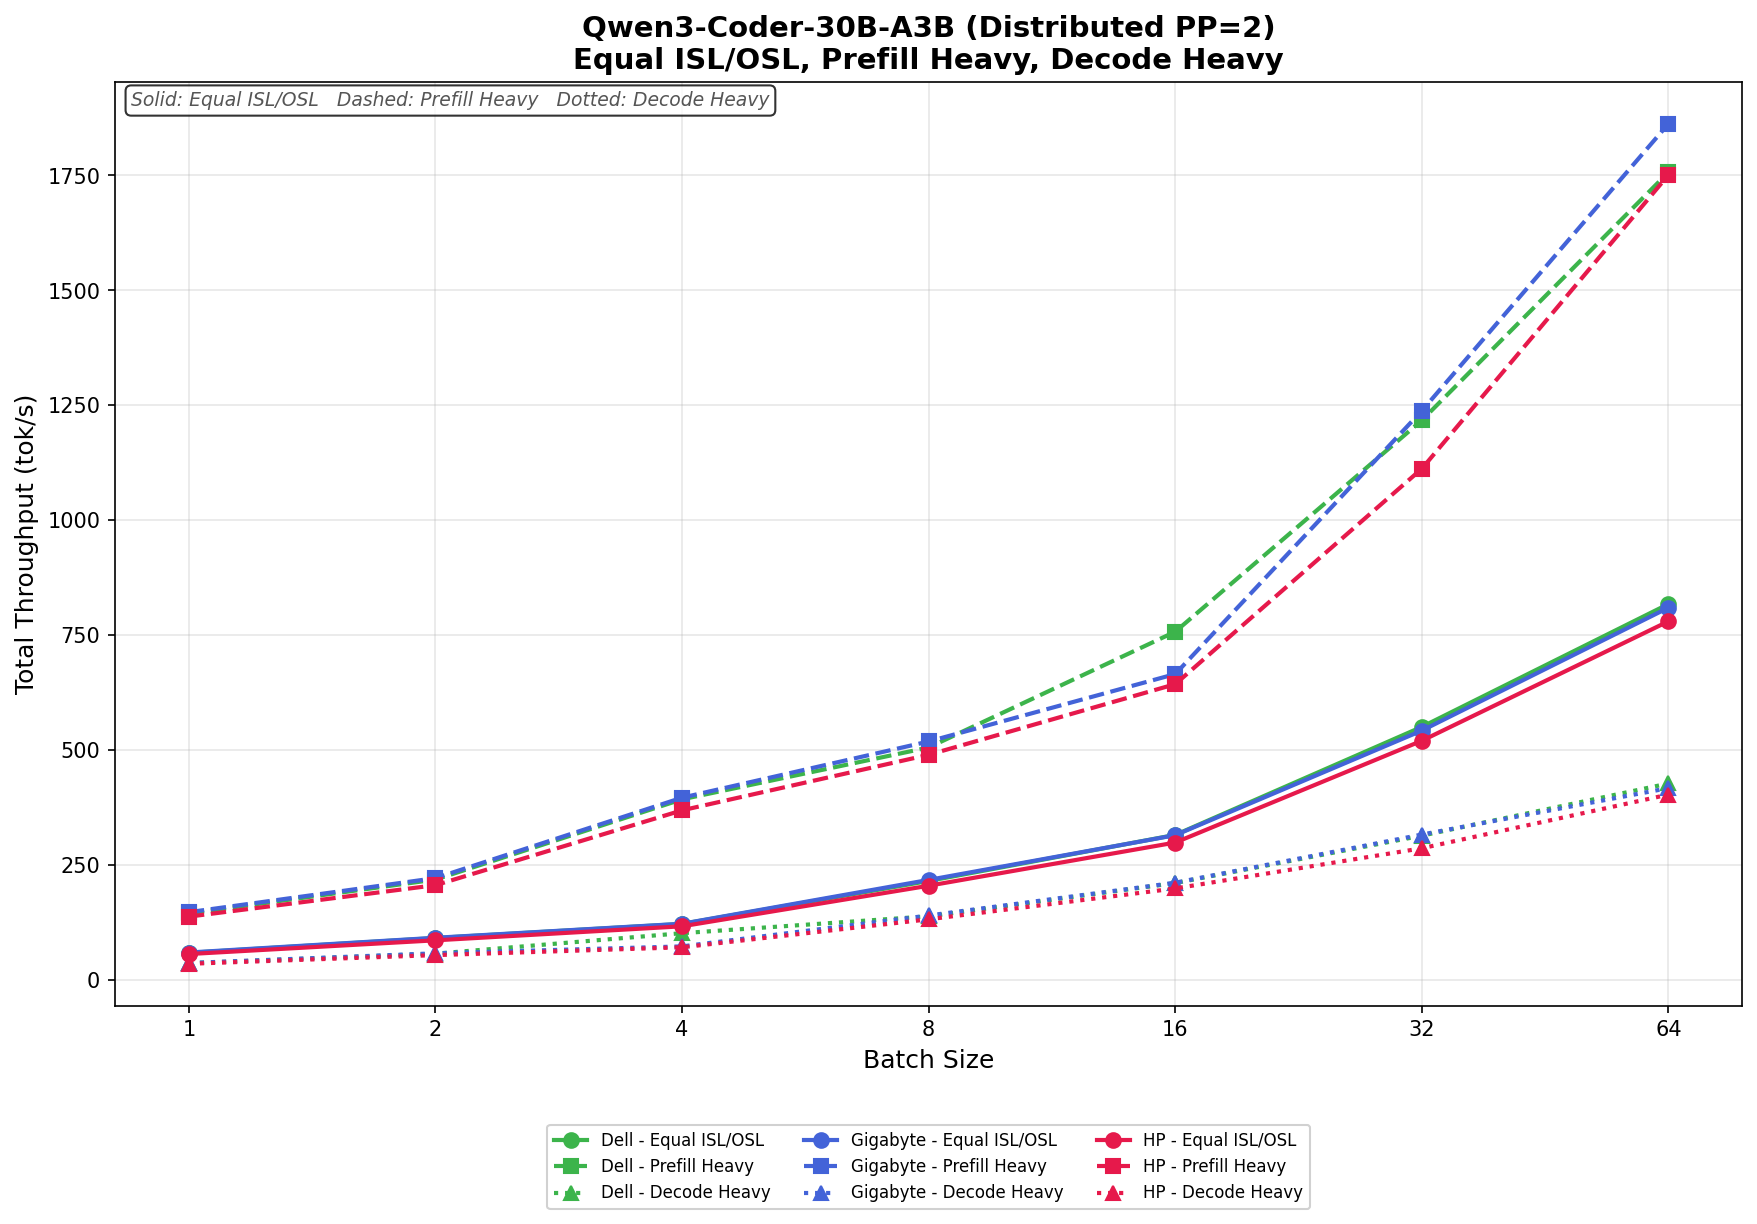
Qwen3 coder 30B A3B Base
In Equal ISL/OSL, Dell scales from 59.05 tok/s to 817.82 tok/s at batch size 64, while GIGABYTE ranges from 59.81 tok/s to 809.88 tok/s. HP trails slightly behind both systems, increasing from 56.51 tok/s to 780.21 tok/s. Performance between Dell and GIGABYTE remains nearly identical through most of the sweep, with only small variances appearing at higher batch sizes.
In Prefill Heavy, throughput ramps significantly as concurrency increases. Dell grows from 144.81 tok/s to 1,756.99 tok/s, while GIGABYTE posts the strongest overall scaling, increasing from 147.55 tok/s to 1,862.40 tok/s at batch size 64. HP reaches 1,751.17 tok/s, remaining competitive but slightly behind the other two systems at the upper end. GIGABYTE establishes a modest lead beginning around batch size 32 and extends it through the final stage of the test.
In Decode Heavy, the three systems again remain closely aligned through most of the workload. Dell ranges from 36.69 tok/s to 427.48 tok/s, GIGABYTE scales from 36.92 tok/s to 417.42 tok/s, and HP increases from 35.30 tok/s to 403.32 tok/s. Dell maintains a small advantage at the highest batch sizes, while HP trails slightly behind both Dell and GIGABYTE across the decode-focused workload.
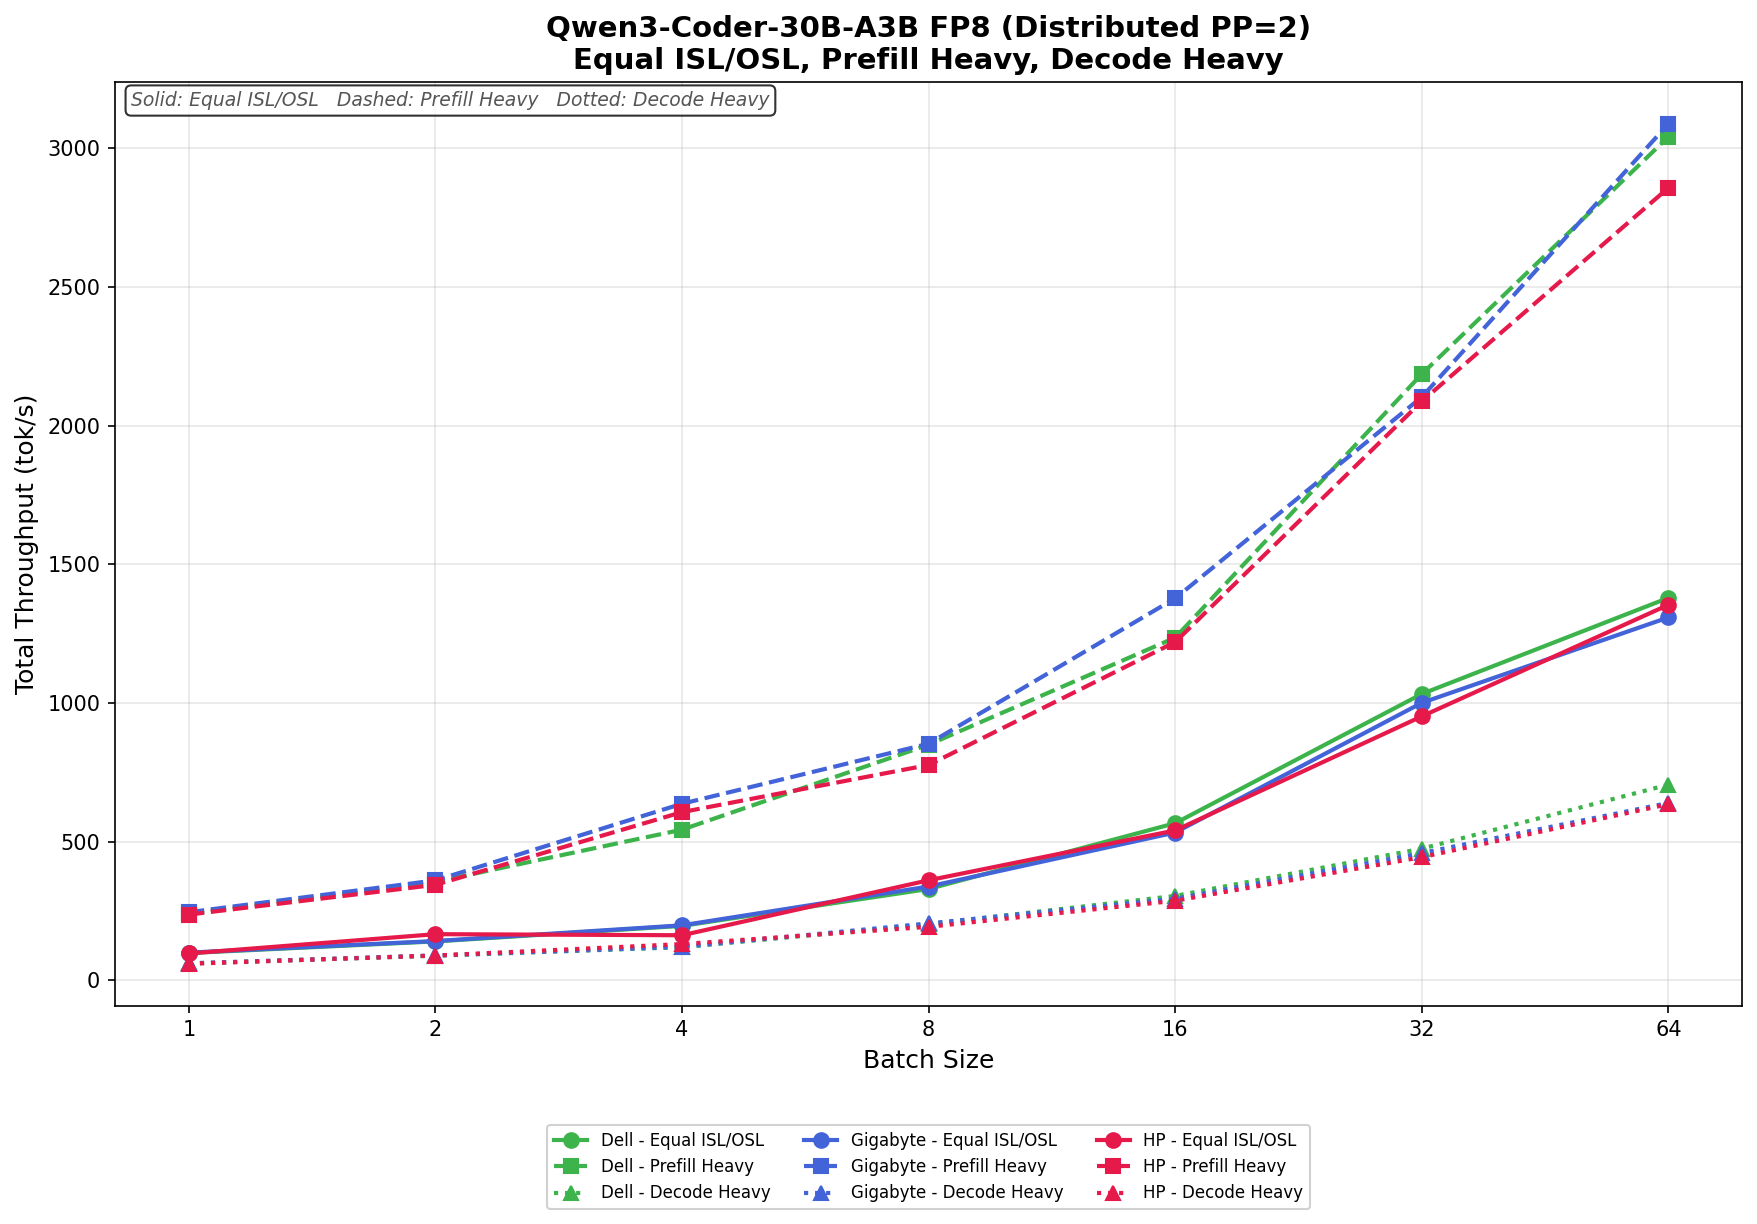
Qwen3 coder 30B A3B FB8
In Equal ISL/OSL, Dell scales from 98.65 tok/s to 1,379.26 tok/s at batch size 64, while GIGABYTE ranges from 100.20 tok/s to 1,308.79 tok/s. HP remains competitive throughout, increasing from 97.06 tok/s to 1,354.23 tok/s. HP briefly leads at several lower and mid-range batch sizes, though Dell finishes with the strongest overall upper-end throughput.
In Prefill Heavy, throughput scales aggressively across all three systems. Dell grows from 240.43 tok/s to 3,041.72 tok/s, while GIGABYTE posts the strongest overall result, scaling from 245.92 tok/s to 3,088.62 tok/s at batch size 64. HP reaches 2,857.80 tok/s. GIGABYTE establishes a noticeable lead beginning at batch size 4 and maintains it through the remainder of the sweep.
In Decode Heavy, Dell holds the strongest upper-end scaling overall. Dell ranges from 60.91 tok/s to 705.77 tok/s, while GIGABYTE scales from 61.53 tok/s to 639.80 tok/s, and HP increases from 59.85 tok/s to 635.25 tok/s. HP briefly leads at smaller batch sizes, but Dell pulls ahead at larger concurrency levels, finishing with the strongest decode throughput of the group.
Dual Spark Systems Peak Output Summary
The table below summarizes the peak token output throughput observed during Distributed PP=2 testing across the Dell, GIGABYTE, and HP dual-Spark systems. Each value represents the highest measured output throughput (tok/s) achieved for that workload scenario at the tested batch size. Bolded figures indicate the top-performing system within that specific workload scenario.
| Model | Scenario (BS – 64) | Dell Peak Output | GIGABYTE Peak Output | HP Peak Output |
|---|---|---|---|---|
| GPT-OSS Models | ||||
| GPT-OSS-120B | Equal ISL/OSL | 463.97 tok/s | 497.26 tok/s | 504.88 tok/s |
| GPT-OSS-120B | Prefill Heavy | 419.56 tok/s | 417.34 tok/s | 441.63 tok/s |
| GPT-OSS-120B | Decode Heavy | 451.18 tok/s | 494.37 tok/s | 474.85 tok/s |
| GPT-OSS-20B | Equal ISL/OSL | 976.77 tok/s | 952.31 tok/s | 915.72 tok/s |
| GPT-OSS-20B | Prefill Heavy | 852.39 tok/s | 802.37 tok/s | 757.05 tok/s |
| GPT-OSS-20B | Decode Heavy | 938.65 tok/s | 945.55 tok/s | 865.78 tok/s |
| Llama Models | ||||
| Llama-3.1-8B-Instruct | Equal ISL/OSL | 689.53 tok/s | 687.48 tok/s | 618.87 tok/s |
| Llama-3.1-8B-Instruct | Prefill Heavy | 515.45 tok/s | 539.27 tok/s | 463.39 tok/s |
| Llama-3.1-8B-Instruct | Decode Heavy | 581.43 tok/s | 576.91 tok/s | 531.07 tok/s |
| Llama-3.1-8B-FP4 | Equal ISL/OSL | 1427.39 tok/s | 1458.86 tok/s | 1413.51 tok/s |
| Llama-3.1-8B-FP4 | Prefill Heavy | 884.22 tok/s | 954.23 tok/s | 843.57 tok/s |
| Llama-3.1-8B-FP4 | Decode Heavy | 1008.98 tok/s | 1007.23 tok/s | 943.73 tok/s |
| Llama-3.1-8B-FP8 | Equal ISL/OSL | 1105.42 tok/s | 1089.85 tok/s | 1076.68 tok/s |
| Llama-3.1-8B-FP8 | Prefill Heavy | 759.50 tok/s | 827.40 tok/s | 725.51 tok/s |
| Llama-3.1-8B-FP8 | Decode Heavy | 862.33 tok/s | 855.81 tok/s | 800.78 tok/s |
| Mistral and Qwen Models | ||||
| Mistral-Small-3.1-24B | Equal ISL/OSL | 249.77 tok/s | 255.09 tok/s | 239.09 tok/s |
| Mistral-Small-3.1-24B | Prefill Heavy | 216.01 tok/s | 214.38 tok/s | 197.92 tok/s |
| Mistral-Small-3.1-24B | Decode Heavy | 238.44 tok/s | 237.97 tok/s | 221.41 tok/s |
Conclusion
The most useful finding from this round of testing has little to do with which OEM came out ahead on which workload. Across all models and workload shapes we tested, the three Spark implementations from Dell, GIGABYTE, and HP performed within a narrow band. Small leads emerged at specific batch sizes, but no platform won outright, and no platform consistently trailed. Buyers choosing among the three should base their decision on chassis design, thermal behavior, warranty terms, and support relationship rather than on benchmark deltas, which are close to the run-to-run variance any desktop-class system produces under sustained load.
The more interesting result is methodological. On the 200 GbE fabric connecting two Sparks, the choice between tensor parallelism and pipeline parallelism matters more than any difference between the three OEMs, and for batched inference at any reasonable concurrency, pipeline parallelism is the better fit. TP=2’s per-layer all-reduce traffic does not survive the trip across a ConnectX-7 link without leaving compute idle, and PP=2’s pipeline bubble cost amortizes into the steady-state stream as soon as the batch fills the pipeline. NVIDIA’s documentation defaults to TP for a defensible reason: their primary positioning for Spark is interactive single-stream serving with tight TTFT, which is the one regime where TP=2 wins outright. The moment the workload looks like serving infrastructure rather than a chat interface, the calculus inverts.
That inversion reinforces what the Spark is and is not. A two-node Spark cluster is a development and learning platform that lets a single engineer see distributed inference behavior firsthand on a network fast enough to mimic a real datacenter fabric, yet constrained enough to expose the bottlenecks that production deployments work around at scale.
Larger Spark configurations are worth examining on their own terms, with workloads and parallelism strategies suited to that scale, and we have that work on the roadmap. Separately, the next experiment queued behind this one shifts from inference to training: a sub-1B-parameter model trained from scratch on a dual-Spark cluster, configured to mirror the distributed pre-training conditions of much larger systems. That work is paused while we wait for the optics for our new 800 Gb lab core switch, and we expect to publish it once the new core is online.


 Amazon