

First demonstrated at CES 2023, the Predator GM7 is the company’s newest entry-level consumer SSD. The GM7 is powered by the Maxio MAP1602 controller and 2400MT/s YMTC Xtacking 3.0 3D NAND. Available in capacities of 512GB, 1TB, and 2TB, the drive has a classic M.2 2280 form factor and NVMe interface that is compatible with laptops, desktops, and the PS5 external drives.
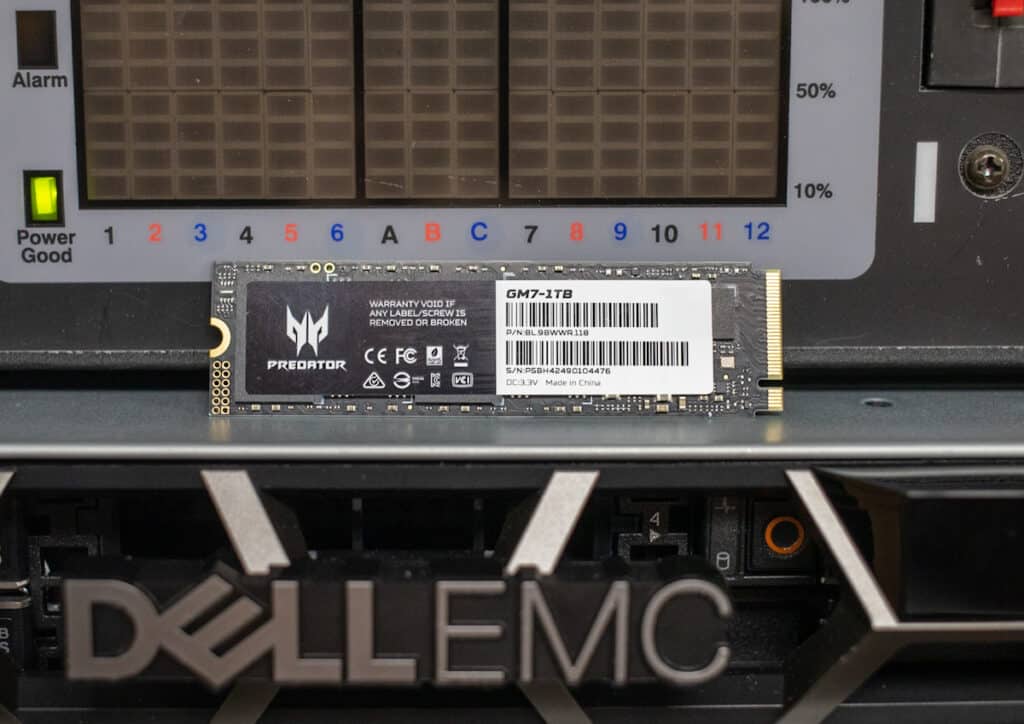
Predator GM7
It should be noted that it can be somewhat unclear which company it actually belongs to, as it could be either branded as an Acer or HP drive (and there is little to no information on the Predator website regarding official specifications). There’s also a bit of import confusion around this drive as well, as the GM7 uses controversial Chinese YTMC NAND. While this NAND type is permitted to be imported as a packaged product in numerous countries, it is expected that OEMs in the US will choose to avoid using it in their products. That said, there are plenty of other parts of the world where this drive will ship.
As far as performance goes, the GM7 is quoted to reach up to the usual 7,400MB/s read and 6,300MB/s write as well as up to 100,000 IOPS. The new Predator drive does not use a DRAM cache, which typically helps drive down costs and lowers power consumption (in this case, a maximum of just 5.67 W) compared to an SSD with DRAM. This makes it a very attainable drive for those with strict budgets and mainstream use cases. That said, DRAM-less drives like the GM7 often have slower performance, such as during large sequential transfers.
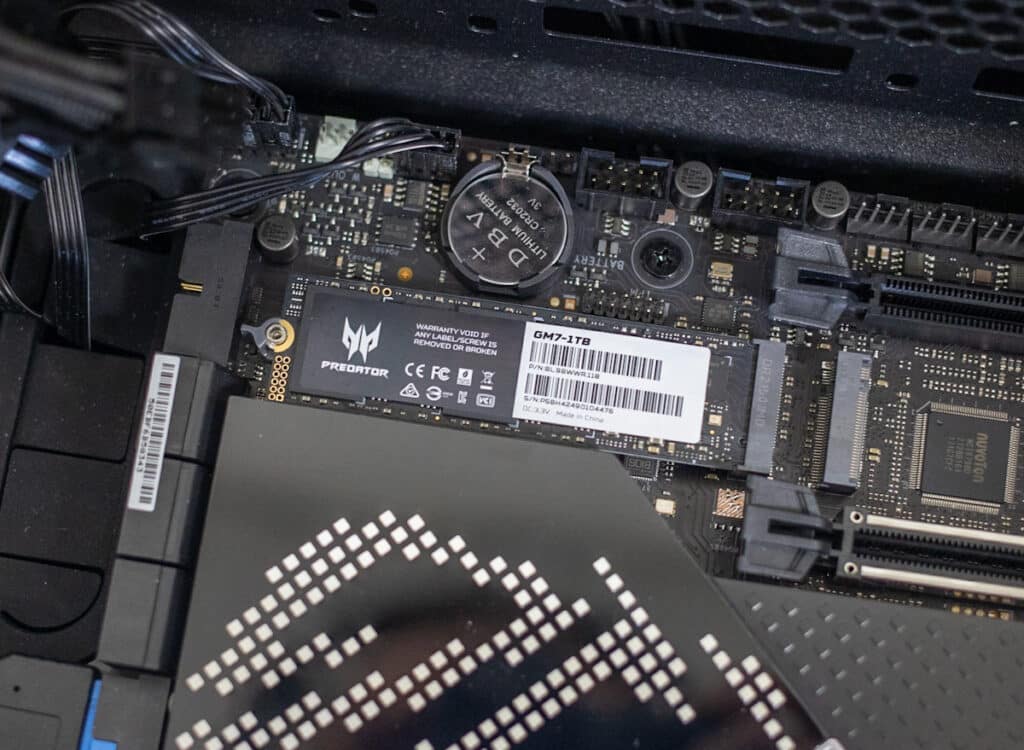
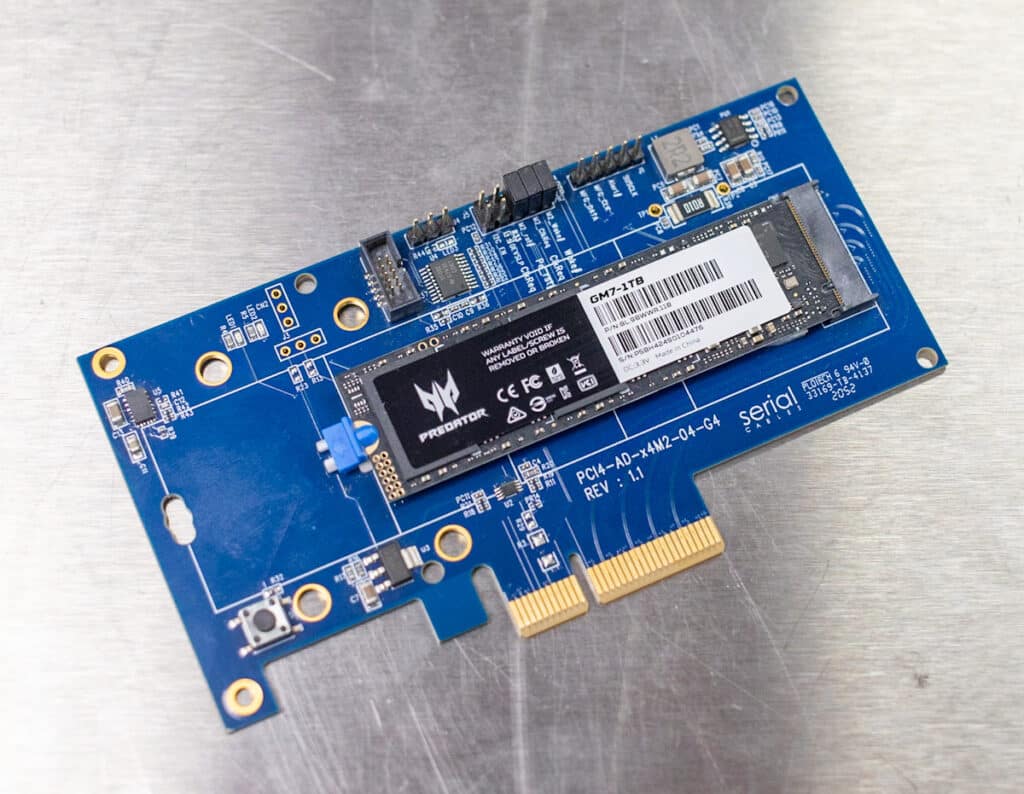
Predator GM7 in Client Test Platform
The GM7 does include HMB (Host Memory Buffer) and SLC cache to help provide burst performance without the DRAM by reducing the time it takes to read and write data; however, gains in performance will depend on the size of the cache and the workload being performed.
Backed by a 5-year warranty, the Predator GM7 goes for roughly $49.99 (512GB), $89.99 (1TB), and $159.99 (2TB).
Predator Storage GM7 SSD Specifications
| Model | GM7 |
| Capacity | 512 GB/1 TB/2 TB |
| Interface | PCIe Gen 4 x 4, NVMe 2.0 |
| Max. Reading Speed | 7400 MB/s |
| Max. Writing Speed | 6300 MB/s |
| Storage Temperature | -40 °C to 85 °C |
| Working Temperature | 0 °C to 70 °C |
| Dimensions | 80 x 22 x 2.2 mm |
| Limited Warranty | 5-Year |
Predator GM7 Performance
For database and synthetic testing, we leverage the Lenovo ThinkSystem SR635 server, equipped with an AMD 7742 CPU and 512GB of 3200Mhz DDR4 memory. NVMe is tested natively through an M.2 to PCIe adapter card in the edge-card slot. A large focus is put on drive latency across the entire load range of the drive, not just at the smallest QD1 (Queue-Depth 1) levels. We do this because many of the common consumer benchmarks don’t adequately capture end-user workload profiles. For our added BlackMagic Disk Speed Test performed in Windows, we use our self-built StorageReview desktop.
We are reviewing the 2TB version of the Predator GM7 drive and will be comparing it to the following PCIe Gen4x4 drives:
- Corsair MP600 GS
- Samsung 990 Pro
- WD SN770
- Seagate Firecuda 530
- WD SN850X
- Fantom VENOM8
- Solidigm P44 Pro
Predator GM7 SQL Server Performance
Each SQL Server VM is configured with two vDisks: 100GB volume for boot and a 500GB volume for the database and log files. From a system resource perspective, we configured each VM with 16 vCPUs, 64GB of DRAM and leveraged the LSI Logic SAS SCSI controller. While our Sysbench workloads tested previously saturated the platform in both storage I/O and capacity, the SQL test is looking for latency performance.
This test uses SQL Server 2014 running on Windows Server 2012 R2 guest VMs and is stressed by Quest’s Benchmark Factory for Databases. StorageReview’s Microsoft SQL Server OLTP testing protocol employs the current draft of the Transaction Processing Performance Council’s Benchmark C (TPC-C), an online transaction-processing benchmark that simulates the activities found in complex application environments.
The TPC-C benchmark comes closer than synthetic performance benchmarks to gauging the performance strengths and bottlenecks of storage infrastructure in database environments. Each instance of our SQL Server VM for this review uses a 333GB (1,500 scale) SQL Server database and measures the transactional performance and latency under a load of 15,000 virtual users.
SQL Server Testing Configuration (per VM)
- Windows Server 2012 R2
- Storage Footprint: 600GB allocated, 500GB used
- SQL Server 2014
-
- Database Size: 1,500 scale
-
- Virtual Client Load: 15,000
-
- RAM Buffer: 48GB
- Test Length: 3 hours
-
- 2.5 hours preconditioning
-
- 30 minutes sample period
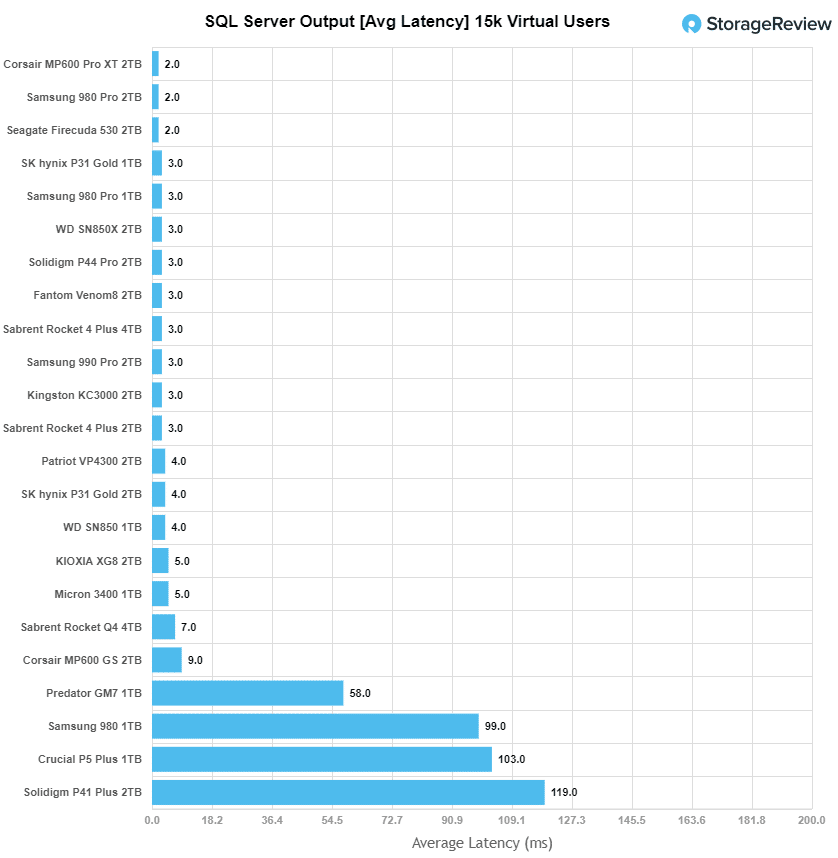
Starting with SQL average latency, the Predator GM7 showed 58ms, placing it near the bottom of consumer NVMe SSD leaderboard.
VDBench Workload Analysis
When it comes to benchmarking storage devices, application testing is best, and synthetic testing comes in second place. While not a perfect representation of actual workloads, synthetic tests do help to baseline storage devices with a repeatability factor that makes it easy to do an apples-to-apples comparison between competing solutions. These workloads offer a range of different testing profiles ranging from “four corners” tests, common database transfer size tests, to trace captures from different VDI environments.
All of these tests leverage the common vdBench workload generator, with a scripting engine to automate and capture results over a large compute testing cluster. This allows us to repeat the same workloads across a wide range of storage devices, including flash arrays and individual storage devices. Our testing process for these benchmarks fills the entire drive surface with data, then partitions a drive section equal to 1% of the drive capacity to simulate how the drive might respond to application workloads. This is different from full entropy tests which use 100% of the drive and take them into a steady state. As a result, these figures will reflect higher-sustained write speeds.
Profiles:
- 4K Random Read: 100% Read, 128 threads, 0-120% iorate
- 4K Random Write: 100% Write, 64 threads, 0-120% iorate
- 64K Sequential Read: 100% Read, 16 threads, 0-120% iorate
- 64K Sequential Write: 100% Write, 8 threads, 0-120% iorate
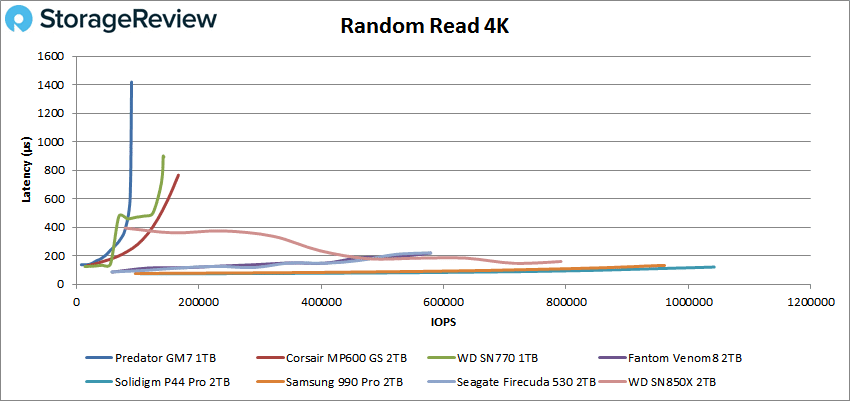
Starting with 4k random read, the Predator GM7 showed some of the weakest performance we’ve seen with a Gen4 drive, showing peak of just 90K IOPS at a latency of 1,419µs.
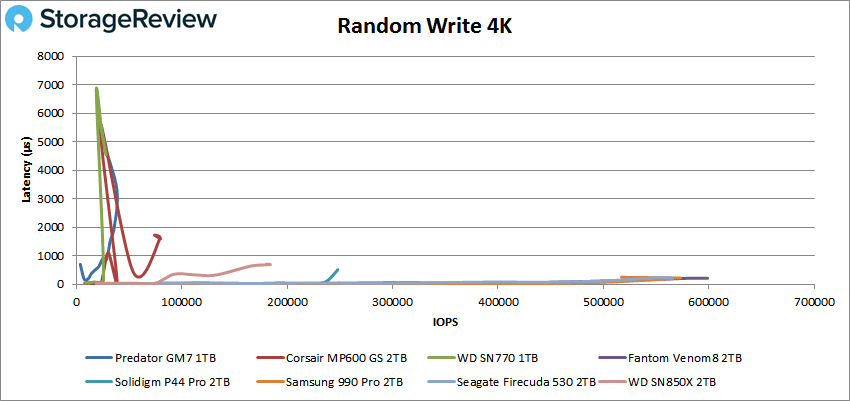
For 4K random writes, results were much of the same. Here, the Predator GM7 ended the test at just 26K IOPS and just under 5,000µs. Just to compare, the top performing Fantom Venom8 showed a peak of 600K IOPS at 208.1 µs.
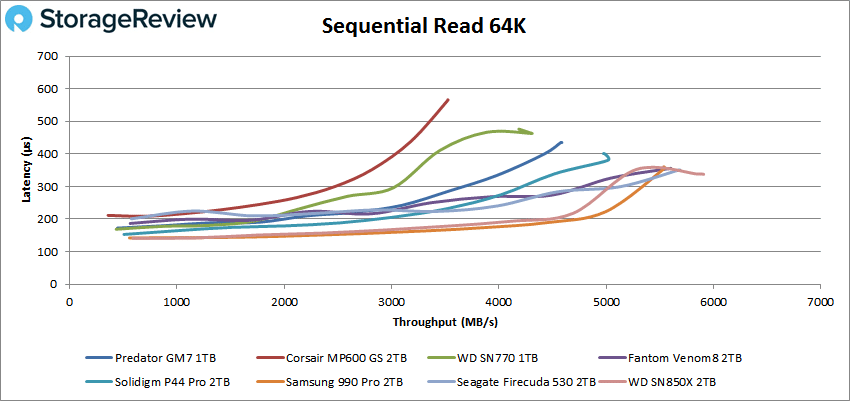
The Predator GM7 performed leagues better when switching to sequential 64K workloads, specifically in reads. That said, it was still well back of the leaders. Here, the Predator GM7 had a peak throughput of 4.58GB/s read with a latency of 435µs.
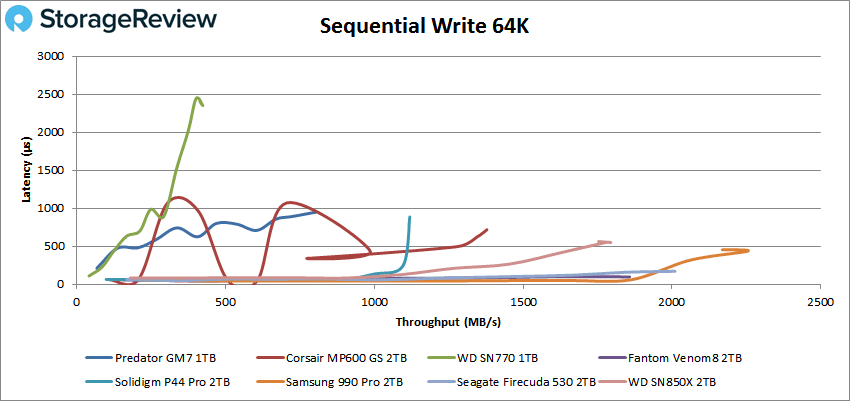
In sequential writes, the Predator GM7 fell back once again, peaking at 805MB/s (or 13K IOPS) with a latency of just 949.3µs. This placed it second to last.
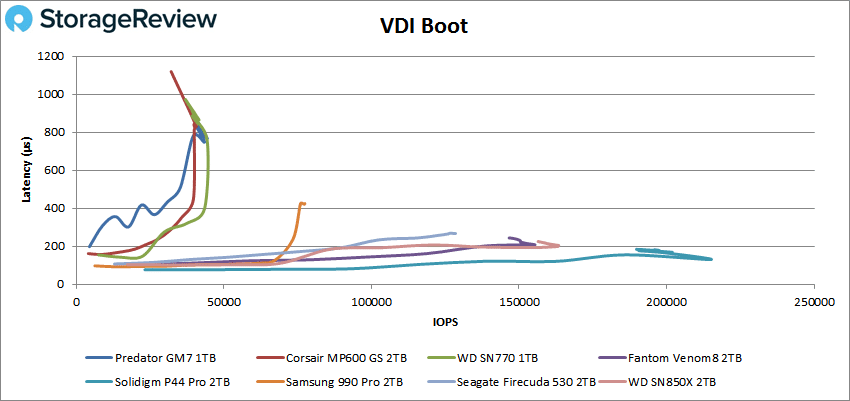
Next, we looked at our VDI benchmarks, which are designed to tax the drives even further. These tests include Boot, Initial Login, and Monday Login. The Predator GM7 didn’t fare any better during these workloads, consistently showing high latency and well back in the leaderboard when it comes to IOPS. Starting with Boot, the Predator GM7 ended the test at 41K IOPS (at 869.5µs), which was slightly better than the WD SN770 and Corsair MP600GS.
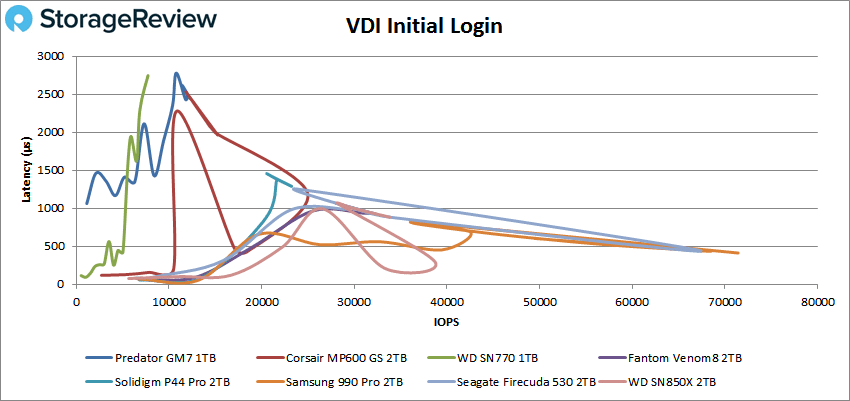
 For VDI Initial Login, the Predator GM7 came second to last with a peak of 12K IOPS (at 2,447µs).
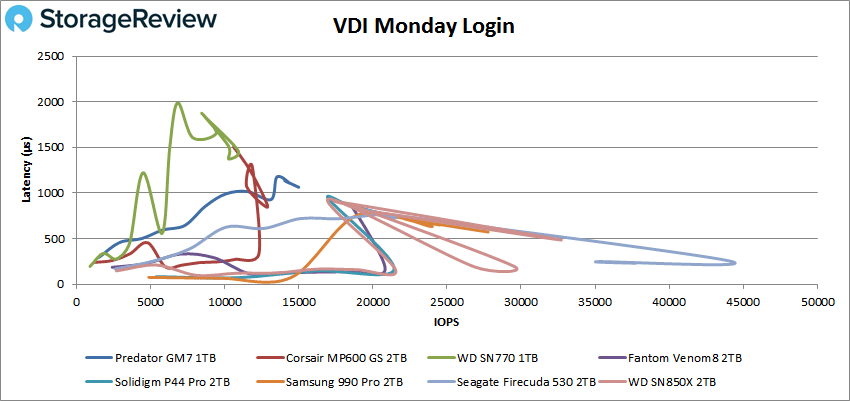
Finally, is the VDI Monday Login benchmark, where the Predator GM7 remained alongside the Corsair and WD drives at the bottom of the leaderboard. Here, we saw a peak of just 15K IOPS with a latency of 1,064µs, which placed it third last.
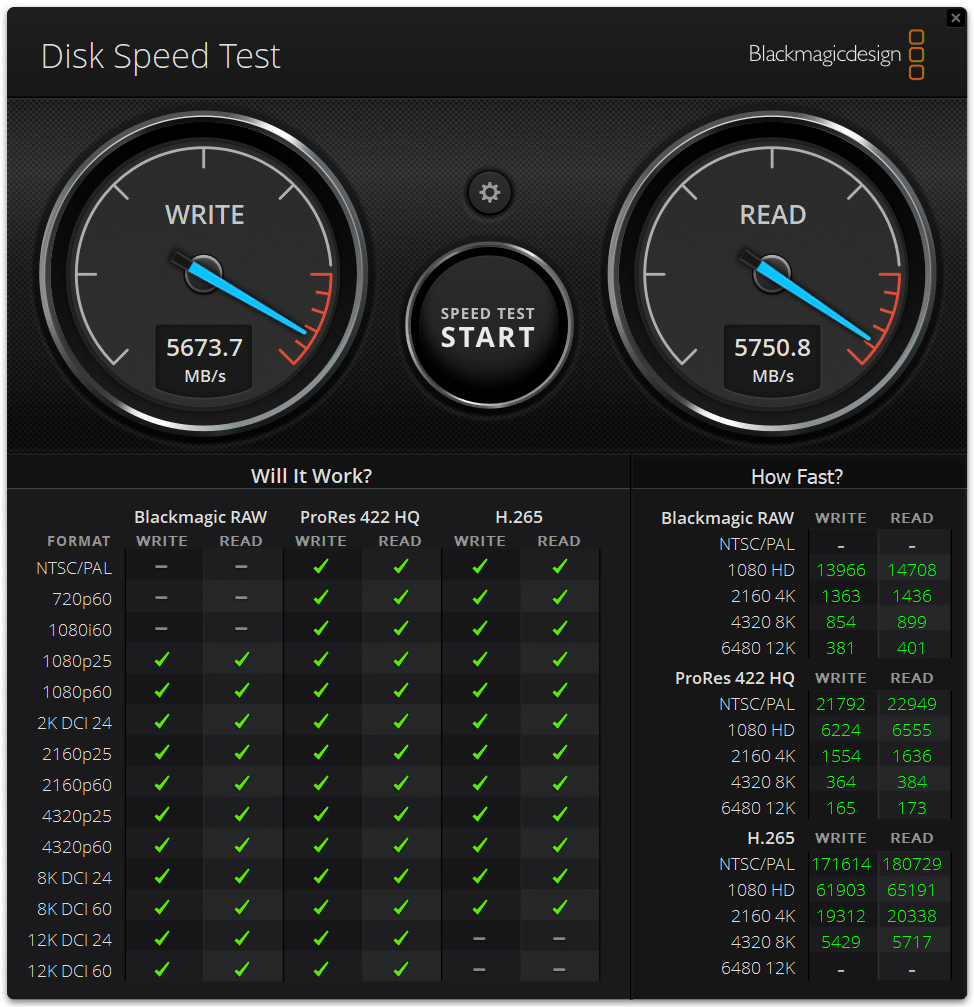
Predator GM7 Blackmagic Disk Speed Test
We measured performance inside a Windows 11 environment on our consumer test platform via the popular Blackmagic test. Here, the Predator GM7 was able to just 5,751MB/s read and 5,674GB/s write, which are mid-range results in the consumer NVMe drive spectrum.
BootBench
BOOT-BENCH-1 is a workload profile adopted by OCP to profile SSDs that are designed for server boot duty. While this is intuitively a job for enterprise SSDs, client SSDs are often selected for their performance, capacity, and cost combination. The boot drive issue is germane not just to hyperscalers, but also to server and storage system providers as well as they face similar challenges.
This boot workload executes a relatively intense test plan that fills the drive entirely with writes before testing a read-heavy workload sequence. For each test, it performs a 32K random read async operation alongside a 15MiB/s synchronous 128k random write as well as a 5MiB/s synchronous 128k random write/trim background workload. The script starts with the random-read activity at a 4-job level and scales up to 256-jobs at its peak. The final result is the read-operations performed during its peak run.
The OCP goal for this benchmark is a pass/fail at 60K read IOPS. Most drives we test will far exceed the minimum, but the results are instructive regardless.
| SSD | Read IOPS |
| Sk hynix Platinum P41 | 220,884 IOPS |
| WD SN850X | 219,883 IOPS |
| Solidigm P44 Pro | 211,999 IOPS |
| Fantom VENOM8 | 190,573 IOPS |
| Samsung 990 Pro | 176,677 IOPS |
| Sabrent Rocket 4 Plus | 162,230 IOPS |
| Predator Storage GM7 | 35,302 IOPS |
As you can see in the table below, the Predator GM7 produced the slowest boot results we’ve seen (by far) for a consumer NVMe SSD with 35,302 IOPS. That said, it did actually complete the test (albeit failing), whereas drives like the Corsair MP600 GS wouldn’t even give us a number.
Conclusion
The Predator GM7 is an entry-level, budget-friendly consumer SSD, powered by the Maxio MAP1602 controller and 2400MT/s YMTC Xtacking 3.0 3D NAND. The GM7 is available in capacities of 512GB, 1TB, and 2TB, via the classic M.2 2280 interface and offers a DRAM-less configuration.
Looking at the details of its VDBench performance revealed very weak results, with numbers placing it far back from the leading consumer SSDs in virtually all of our workloads (with the exception of sequential reads). Highlights include peak scores of 90K IOPS in 4K read, 26K IOPS in 4K write, 4.58GB/s in 64K read, and 805MB/s in 64K write. In our VDI Full clone tests, we saw 41K IOPS in boot, 12K IOPS in initial login, and 15K IOPS for Monday login. In our SQL Server test, the Predator GM7 posted a very high 58ms, placing it at the bottom of the leaderboard.
In the Blackmagic disk speed burst test, the GM7 performed more on par with Gen4 drives, showing 5.75GB/s read and 5.68GB/s write. These results were good for drives of its class. At the same time though, it failed to pass the IOPS floor of the OCP boot drive test.
Overall, the Predator GM7 is a mixed bag. While its performance during the vast majority of our benchmarking was poor, its pricing profile somewhat makes up for this. Going for roughly $50 (512GB), $90 (1TB), and $160 (2TB), the GM7 is certainly a very accessible drive for those who plan on using it for non-intensive purposes. That said, depending on your use case, it might be worth your while to spend a little bit more for a superior drive (e.g., the performance-driven Samsung 980 Pro and Fantom VENOM8 consumer SSDs are priced at $110 for the 1TB model). Moreover, the similar-performing WD Black SN770 is currently on sale for $70 (1TB ) while the 500GB model is priced at only $35.
Ultimately, the Predator GM7 falls well short of our expectations and its own specifications, which makes it difficult for us to recommend–even at its current price point.


 Amazon