

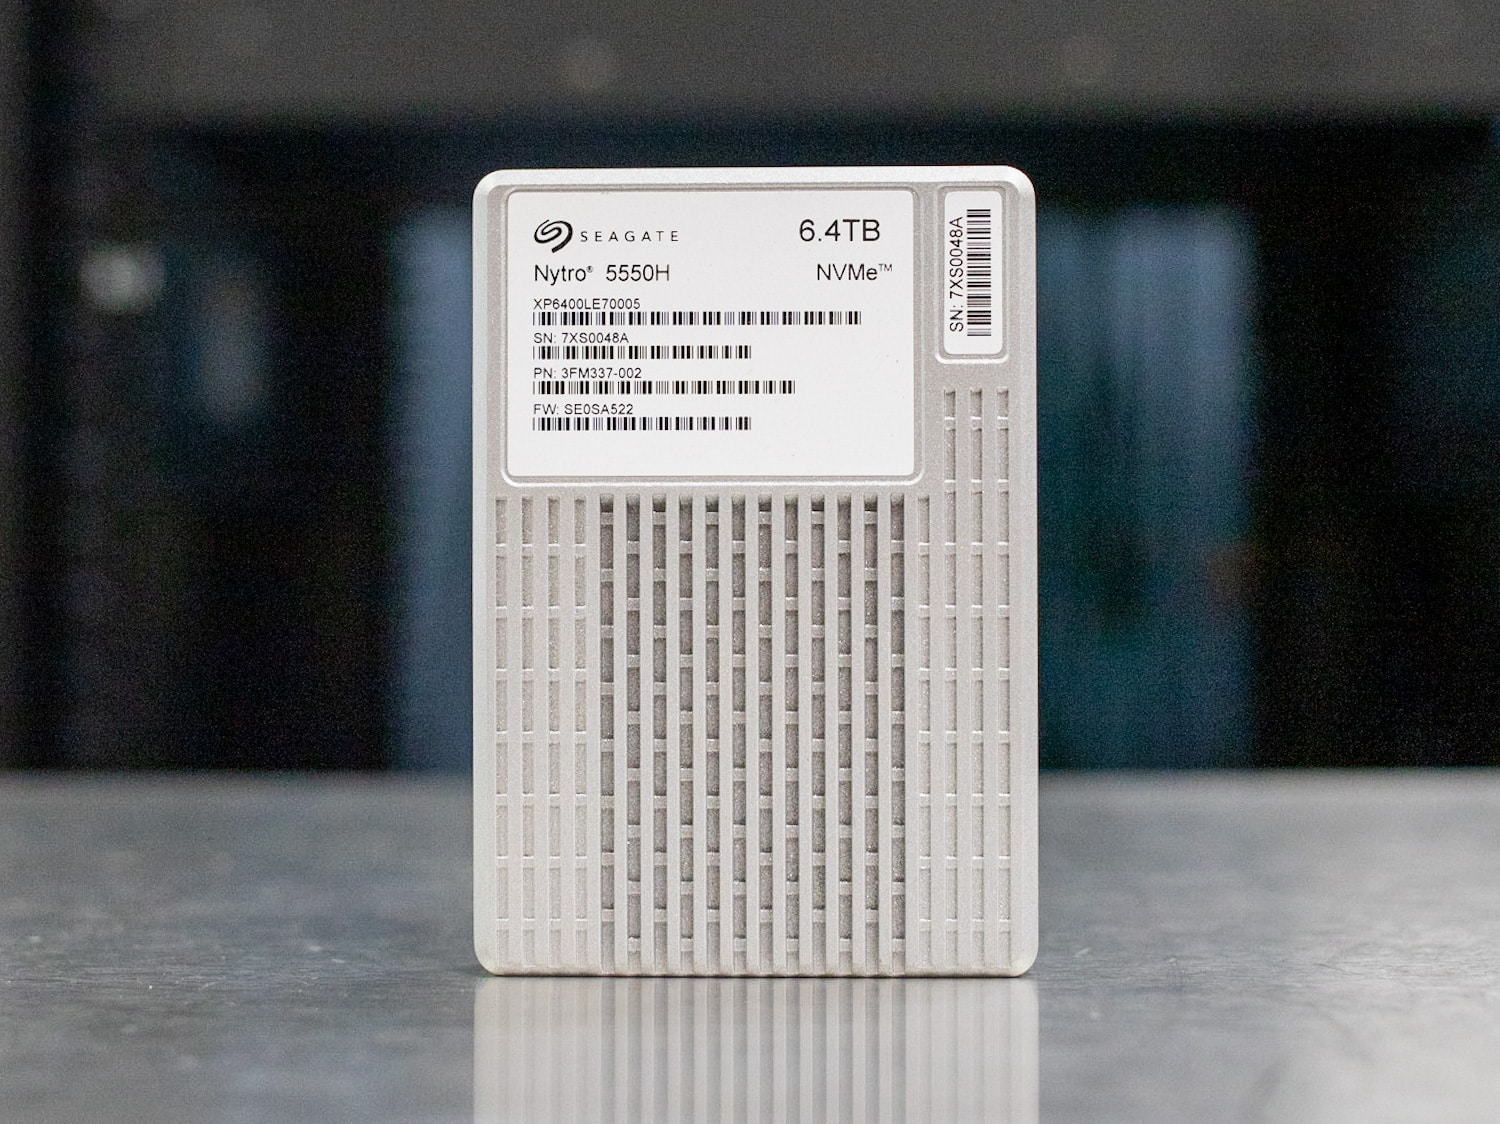
The Seagate Nytro 5550H SSD is part of a broad family of the Nytro 5050 series enterprise SSDs designed to meet a variety of needs in the data center. The Nytro 5550 Gen4 SSDs use Phison’s PS5020-E2 enterprise SSD controller paired with TLC NAND.
The Nytro 5050 family contains a vast number of SKUs. At a high level, the Nytro 5350 is a single drive write per day drive that is available in capacities up to 15.36TB and tunes for read-heavy workloads. The Nytro 5550 is a three DWPD drive for mixed workloads, with capacities of up to 12.80TB. As with other enterprise SSDs, endurance, and capacity are inverse trade-offs. The hardware itself is effectively the same, the difference comes down to the firmware and NAND provisioning.
What’s a little more odd is that Seagate offers both of these families, the 5550 and 5350 in another fragmentation designated with H, M, and S. The H drives are “high-performance” and lead the spec sheet numbers with the highest 3 DWPD endurance rating. The M drives are “mainstream” and offer a much lower performance profile and 1DWPD endurance, ostensibly for a lower price too. Then we have S drives which are another subset of read-intensive drives, also carrying the 1 DWPD endurance rating, which matches the mainstream offering.
Lastly, the drive Z-height is variable, the M drives are 7mm or 15mm and the H drives use 15mm cases. Seagate does not support any EDSFF (E1.S, E3.S) with these drives. Even without EDSFF Seagate has dozens of total SKUs in this family accounting for endurance, performance, z-height, and encryption options. At the time of this review, counting all the options for versions, capacities, drive height options, and encryption Seagate offers nearly 150 SKUs for the Nytro 5050 family.
Looking into the Nytro 5550H a little further, we see the spec sheet topping out with 7,400MB/s sequential reads and 7,200MB/s sequential writes. Flipping to IOPS, the spec sheet lists 1.7 million read and 445K write. The 5550M by comparison takes a little hit to sequential writes with 3,400MB/s, but it takes a severe random read and random write IOPS hit dropping to 1.2 million and 250K respectively. It should be noted these specifications are for the 6.4 TB drive.
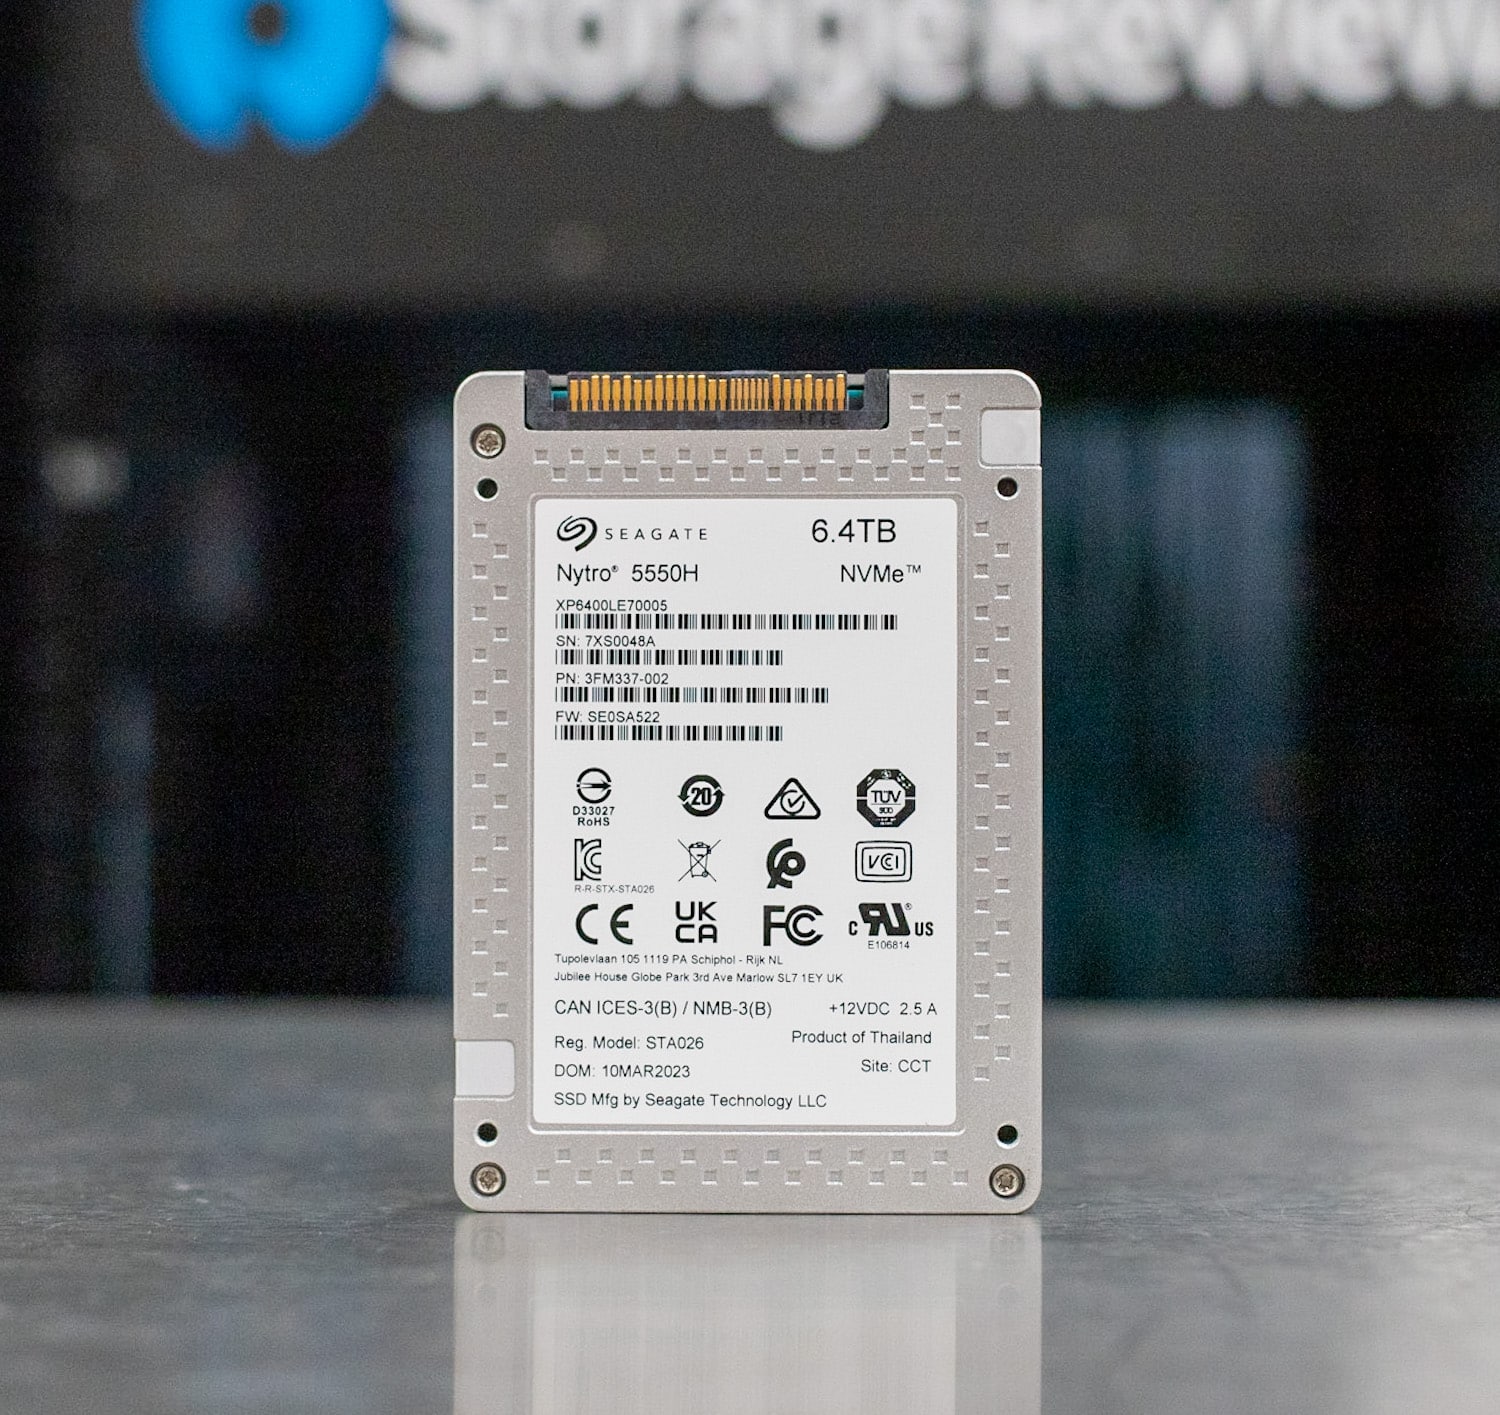
Nytro 5050 SSDs are dual-ported, offer power loss data protection, SED TCG security, support U.2 and U.3 interfaces, and have a 5-year limited warranty.
Seagate Nytro 5550H Specifications (6.4TB)
| Nytro 5550H 6.4TB | |
|---|---|
| Standard Model | XP6400LE70005 |
| SED Model | XP6400LE70015 |
| FIPS 140-3/Common Criteria Model | XP6400LE70025 |
| Interface | PCIe Gen4 ×4 NVMe |
| NAND Flash Type | 3D eTLC |
| Form Factor | 2.5 in × 15mm |
| Sequential Read (MB/s) Sustained, 128KB | 7400 |
| Sequential Write (MB/s) Sustained, 128KB | 7200 |
| Random Read (IOPS) Sustained, 4KB QD64 | 1,700,000 |
| Random Write (IOPS) Sustained, 4KB QD64 | 445,000 |
| Average Read Latency (μs), 4KB QD1 | 75 |
| Average Write Latency (μs), 4KB QD1 | 12 |
| Lifetime Endurance (Drive Writes per Day) | 3 |
| Total Bytes Written (TB) | 35000 |
| Nonrecoverable Read Errors per Bits Read | 1 per 10E17 |
| Mean Time Between Failures (MTBF, hours) | 2,500,000 |
| Limited Warranty (years) | 5 |
| 12V Overall Average Power (W) | 21 |
| Average Idle Power (W) | 6 |
Seagate Nytro 5550H Performance
Testing Background and Comparables
The StorageReview Enterprise Test Lab provides a flexible architecture for conducting benchmarks of enterprise storage devices in an environment comparable to what administrators encounter in real deployments. The Enterprise Test Lab incorporates a variety of servers, networking, power conditioning, and other network infrastructure that allows our staff to establish real-world conditions to accurately gauge performance during our reviews.
We incorporate these details about the lab environment and protocols into reviews so that IT professionals and those responsible for storage acquisition can understand the conditions under which we have achieved the following results. None of our reviews are paid for or overseen by the manufacturer of the equipment we are testing. Additional details about the StorageReview Enterprise Test Lab and an overview of its networking capabilities are available on those respective pages.
Comparables:
Of note, all of the comparable drives in this testing carry a single DWPD endurance rating. The industry has largely focused on single DWPD drives for most enterprise workloads. As such, we don’t have a stable of 3 DWPD comparables. That said, the performance charts below will skew the drive’s performance some, making it appear more favorable than it would if it were up against similarly over-provisioned SSDs.
Testbed
Our PCIe Gen4 Enterprise SSD reviews leverage a Lenovo ThinkSystem SR635 for application tests and synthetic benchmarks. The ThinkSystem SR635 is a well-equipped single-CPU AMD platform, offering CPU power well in excess of what’s needed to stress high-performance local storage. Synthetic tests don’t require a lot of CPU resources but still leverage the same Lenovo platform. In both cases, the intent is to showcase local storage in the best light possible that aligns with storage vendor maximum drive specs.
PCIe Gen4 Synthetic and Application Platform (Lenovo ThinkSystem SR635)
-
- 1 x AMD 7742 (2.25GHz x 64 Cores)
- 8 x 64GB DDR4-3200MHz ECC DRAM
- CentOS 7.7 1908
- ESXi 6.7u3
Sysbench Performance
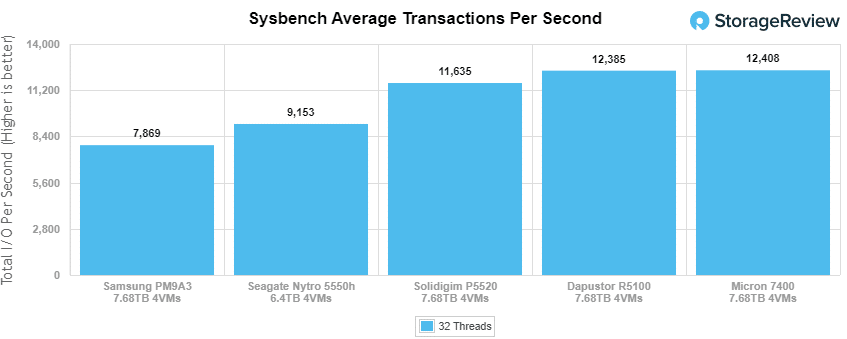
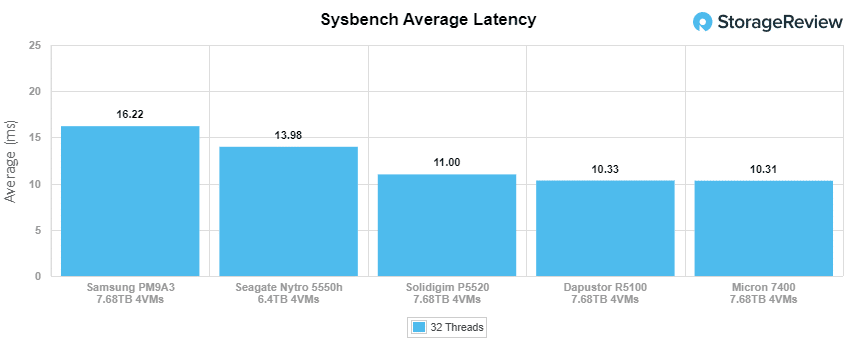
The next application benchmark consists of a Percona MySQL OLTP database measured via SysBench. This test measures average TPS (Transactions Per Second), average latency, and average 99th percentile latency as well.
Each Sysbench VM is configured with three vDisks: one for boot (~92GB), one with the pre-built database (~447GB), and the third for the database under test (270GB). From a system resource perspective, we configured each VM with 8 vCPUs, 60GB of DRAM and leveraged the LSI Logic SAS SCSI controller.
Sysbench Testing Configuration (per VM)
- CentOS 6.3 64-bit
- Percona XtraDB 5.5.30-rel30.1
- Database Tables: 100
- Database Size: 10,000,000
- Database Threads: 32
- RAM Buffer: 24G
- Test Length: 3 hours
-
- 2 hours preconditioning 32 threads
- 1 hour 32 threads
-
For the average TPS test, the Nytro 5550H unfortunately only hit 9152.89 in our Sysbench transactional benchmark. This puts the drive second to last towards the end of the pack.
In average latency, the Nytro 5550H again came second to last showing 13.98ms.
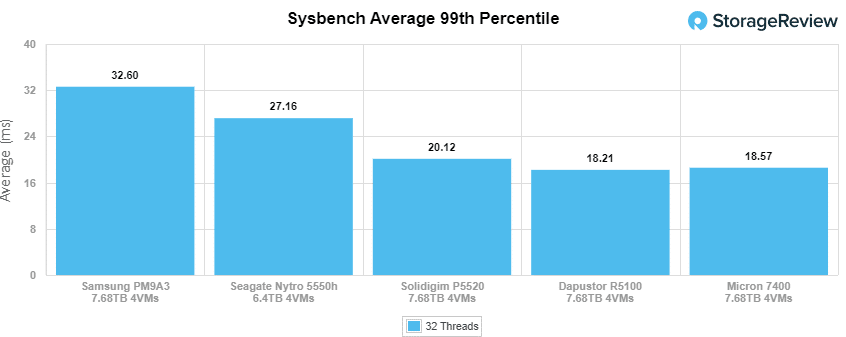
Our worst case (99th percentile) Sysbench test sees the Nytro with 27.16ms. This once again puts the drive second to last.
VDBench Workload Analysis
When it comes to benchmarking storage devices, application testing is best, and synthetic testing comes in second place. While not a perfect representation of actual workloads, synthetic tests do help to baseline storage devices with a repeatability factor that makes it easy to do apples-to-apples comparisons between competing solutions. These workloads offer a range of different testing profiles ranging from “four corners” tests, common database transfer size tests, to trace captures from different VDI environments.
All of these tests leverage the common vdBench workload generator, with a scripting engine to automate and capture results over a large compute testing cluster. This allows us to repeat the same workloads across a wide range of storage devices, including flash arrays and individual storage devices. Our testing process for these benchmarks fills the entire drive surface with data, and then partitions a drive section equal to 25% of the drive capacity to simulate how the drive might respond to application workloads. This is different from full entropy tests which use 100% of the drive and takes them into a steady state. As a result, these figures will reflect higher-sustained write speeds.
Profiles:
- 4K Random Read: 100% Read, 128 threads, 0-120% iorate
- 4K Random Write: 100% Write, 128 threads, 0-120% iorate
- 16K Sequential Read: 100% Read, 32 threads, 0-120% iorate
- 16K Sequential Write: 100% Write, 16 threads, 0-120% iorate
- 64K Sequential Read: 100% Read, 32 threads, 0-120% iorate
- 64K Sequential Write: 100% Write, 16 threads, 0-120% iorate
- 4K, 8K, and 16K 70R/30W Random Mix, 64 threads, 0-120% iorate
- Synthetic Database: SQL and Oracle
- VDI Full Clone and Linked Clone Traces
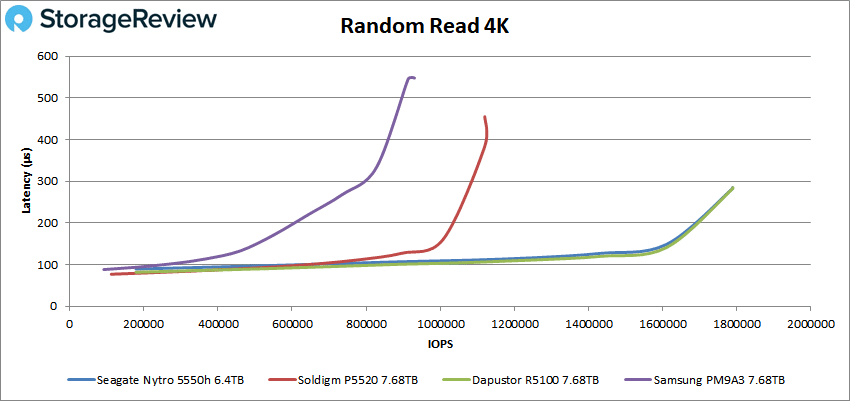
Our first VDBench test is random read 4K. The Seagate Nytro 5550H finished at 1.789 million IOPS at 284.7µs. This put it just barely behind the Dapustor R5100 in terms of performance.
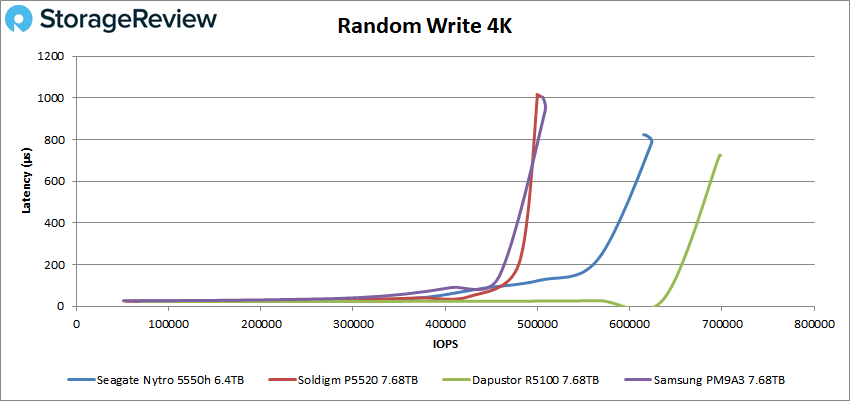
In writes, the Nytro 5550H fell behind a bit, ending at 618k IOPS and 818.6µs. The drive still came a solid second but did not reach the performance levels of the Dapustor R5100.
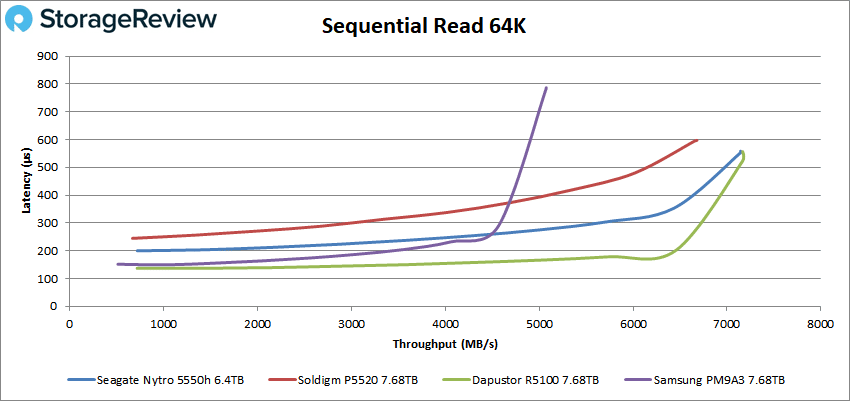
Next are our sequential tests, starting with read. Here, the Nytro tied for the first spot with the Solidigm drive at the very end, peaking at 7.15GB/s at 554µs.
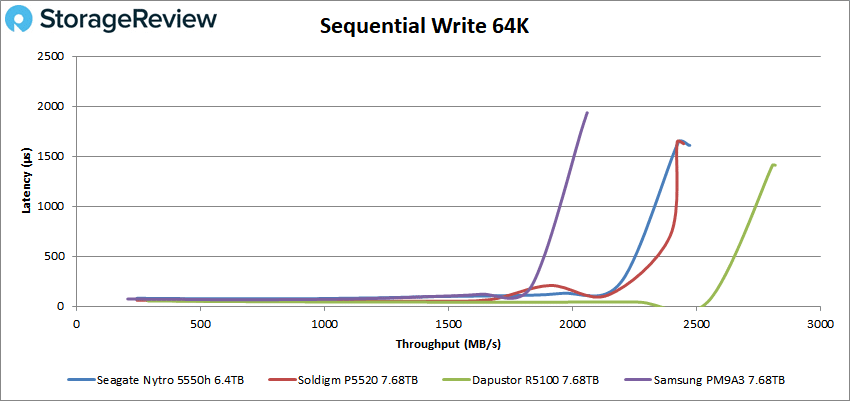
The Nytro 5550H fell behind in writes again, hitting 2.47GB/s at 1,609µs. This placed it second, but it was more so towards the middle of the pack and far from the Dapustor R5100
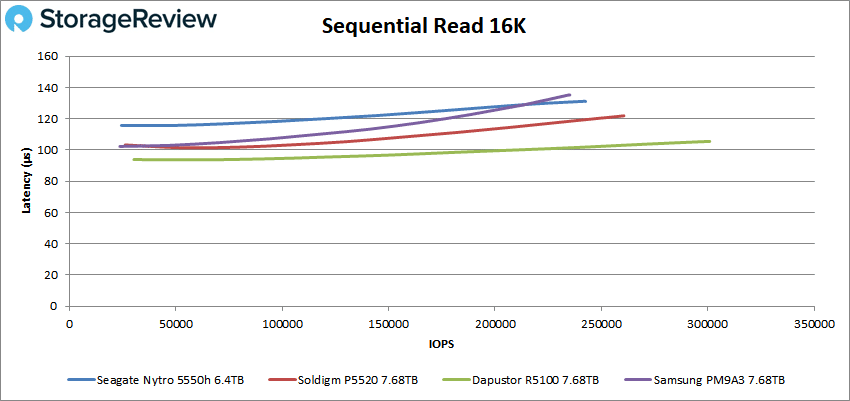
Let’s move on to the 16K tests. The Nytro 5550H was mediocre in the read test, finishing at 242.5k IOPS and 131.1µs. This placed it second to last.
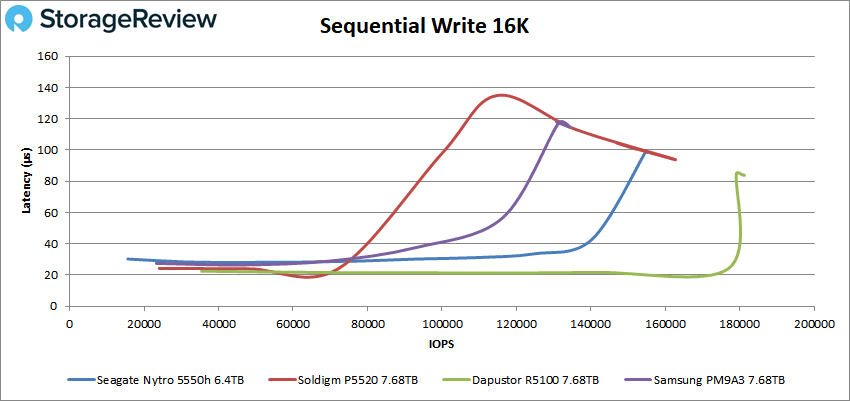
The Nytro 5550H performed similarly in writes (16K), achieving 155.2k IOPS at 98.7µs.
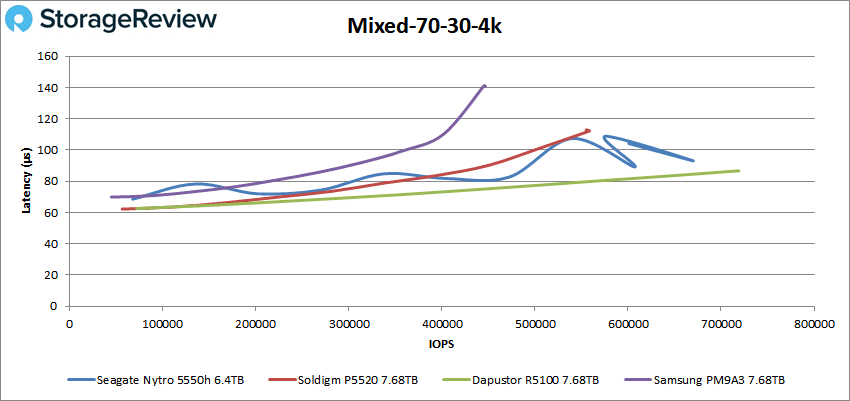
Now for our mixed read/write profiles, starting with 70/30 4K. Here, Nytro 5550H came second and posted a peak of 670k IOPS at 93.1µs but fell in performance quite a bit after the peak. The Nytro 5550 was the most unstable drive out of the four.
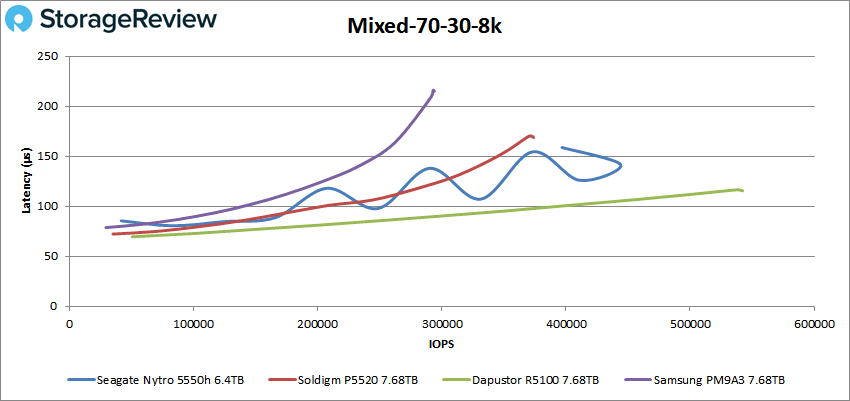
The Nytro 5550H maintained its second-place performance in the mixed 8K profile, peaking at 444K IOPS at 141.6µs. Performance once again waned after the peak, and it was again the most unstable drive on the list.
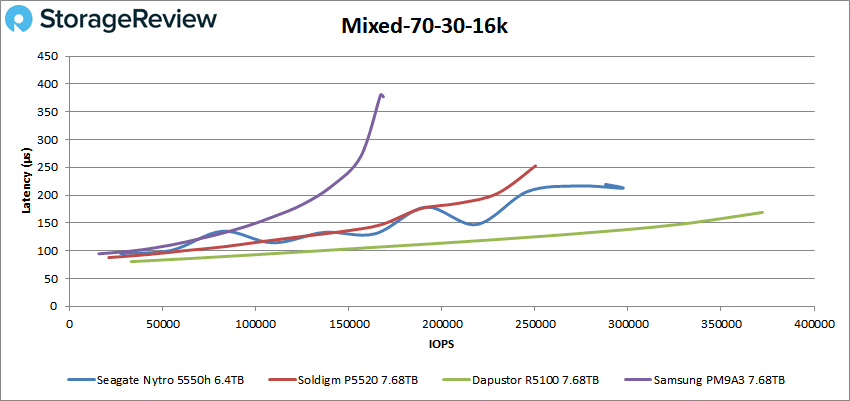
For the 70/30 16K profile, the new Seagate Nytro drive peaked at 297K IOPS and 212.5µs for another second-place finish. However, just like the other tests the Nytro 5550 was unstable.
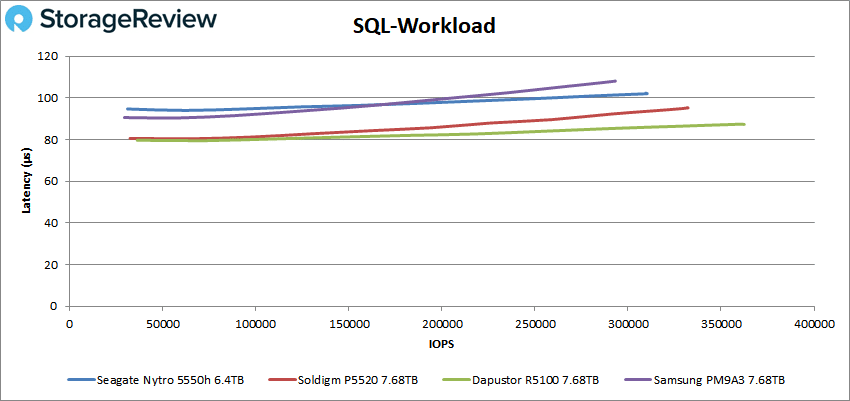
Next up is the database testing, starting with SQL Workload. The Nytro 5550 came second to last in this test, peaking at 310.3K IOPS and 102.1µs.
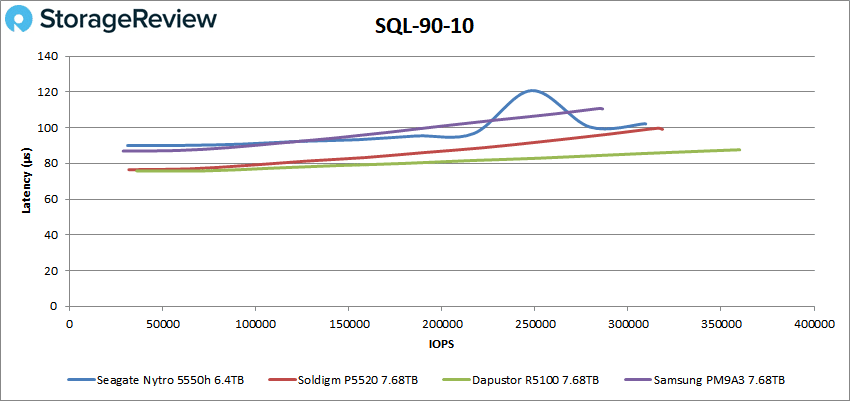
In SQL 90-10, the Nytro 5550H completed the test at 309.5K IOPS at 102.3µs, which puts it at about the middle of the pack.
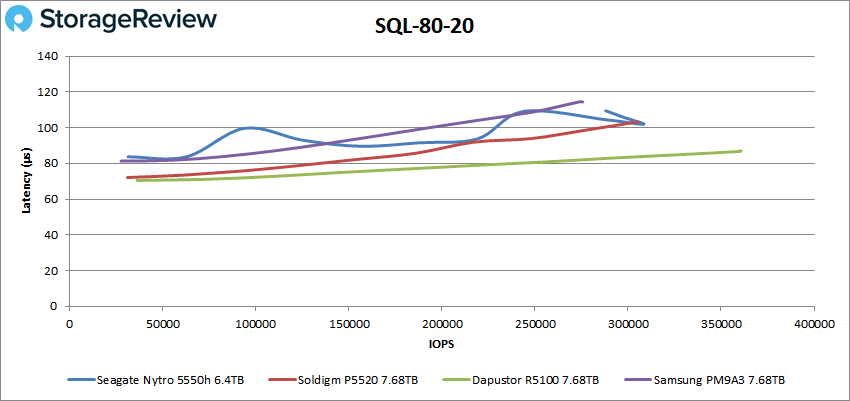
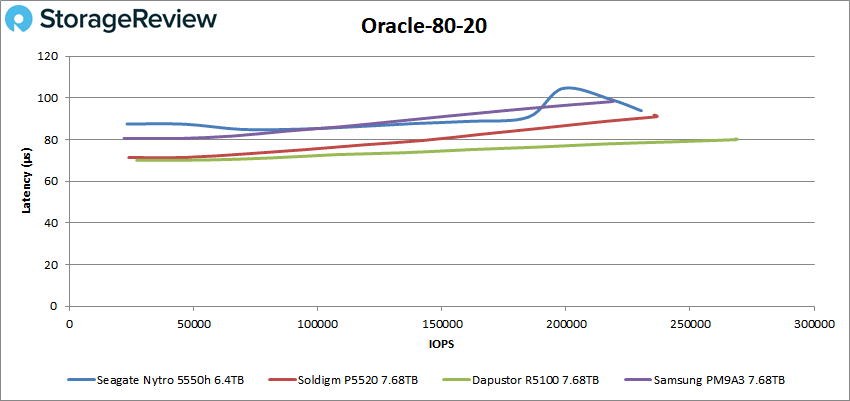
In SQL 80-20, it peaked at 305.4K IOPS at 103.1µs before taking a performance spike, ending at 287.9k IOPS and 109.5µs. This once again puts the drive in the middle of the pack.
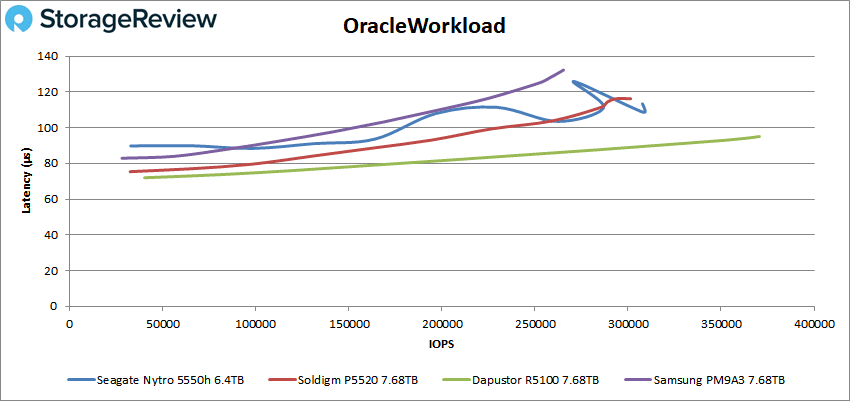
Now for our Oracle tests, starting with Oracle Workload. Here we see the Nytro stagger in performance quite frequently, but the drive still finished the test second place at 307.7K IOPS and 113.4 µs.
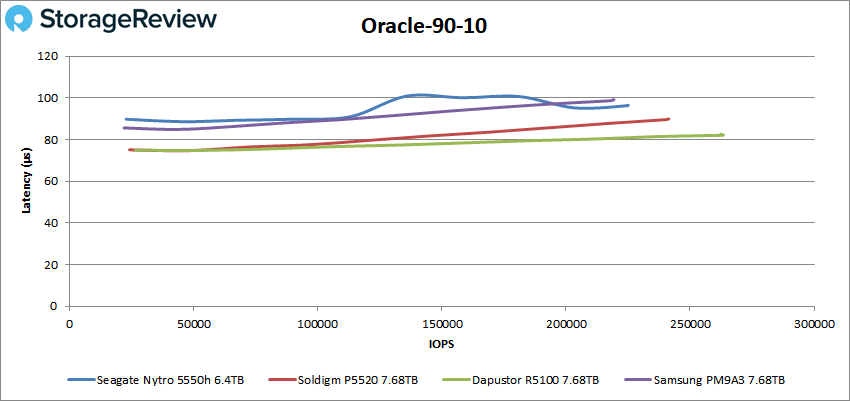
Moving on to Oracle 90-10, the Nytro 5550H ended the test at 225.1K IOPS with 96.5µs in latency, which put it close to last.
In Oracle 80-20, the Nytro 5550H fell to second last (due to the blip at the end), posting at 229.8K IOPS at 94.1µs when it finished the test. Of note, the Dapustor R5100 has remained the top-performing drive throughout the database tests.
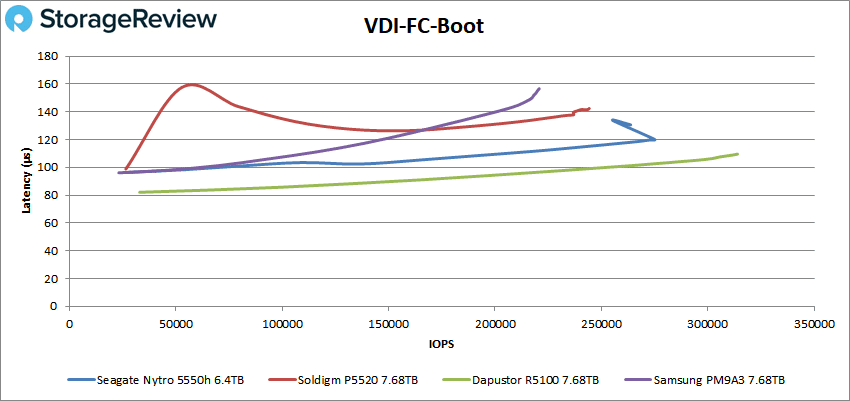
Our final series of tests are VDI full clone (FC) and linked clone (LC). We start with full VDI FC boot, where the Nytro 5550H had a comfortable second place with 263.7K IOPS at 130.6µs.
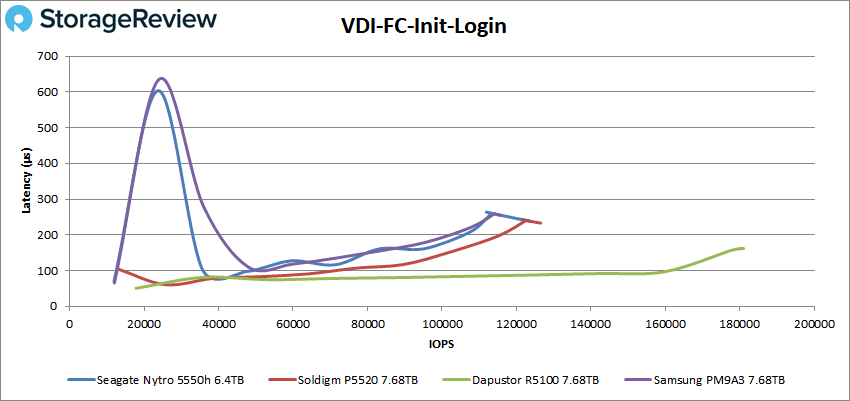
It’s a bit hard to determine where it settled based on the chart below for VDI FC Initial Login; however, take it from us it peaked at 123.8K IOPS (238.2µs) before taking a small spike in performance.
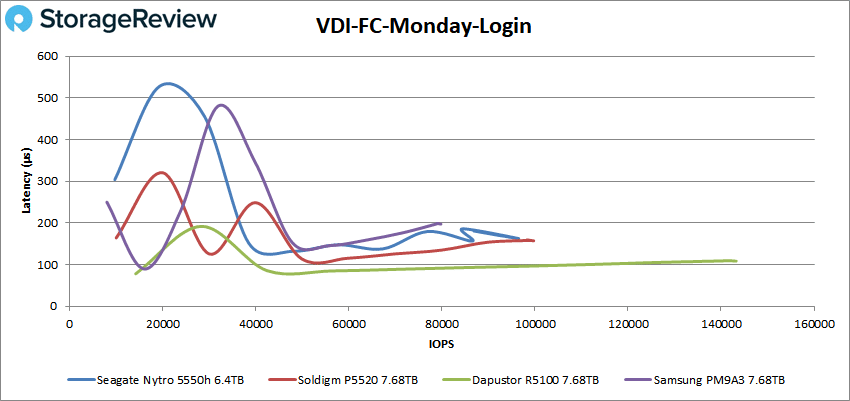
The Seagate drive did okay during the VDI FC Monday Login test, as it placed in the middle of the pack with a peak of 96.5K IOPS and 162.6µs.
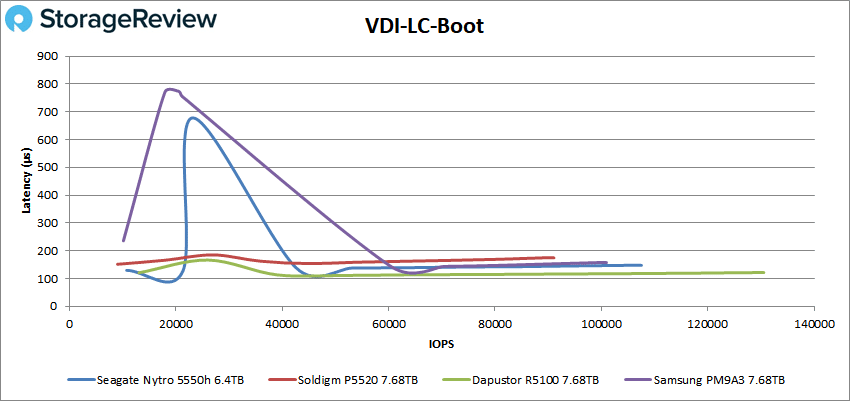
The VDI Linked Clone (LC) tests are next. First up is boot, where the Seagate Nytro drive did pretty well, just ranking second among the four competitors. The drive reached a peak of 10.54K IOPS at 756.2µs.
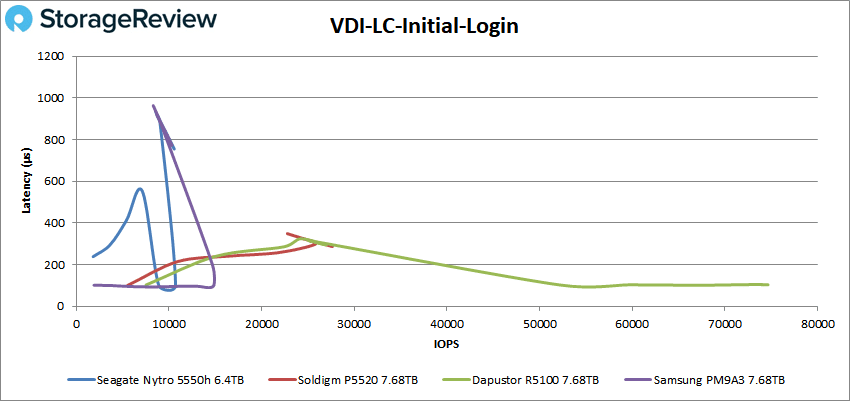
Unfortunately, VDI LC Initial Login saw the Nytro 5550H close to dead last with unfavorable results, finishing the test at 123.8K IOPS at 238.2µs.
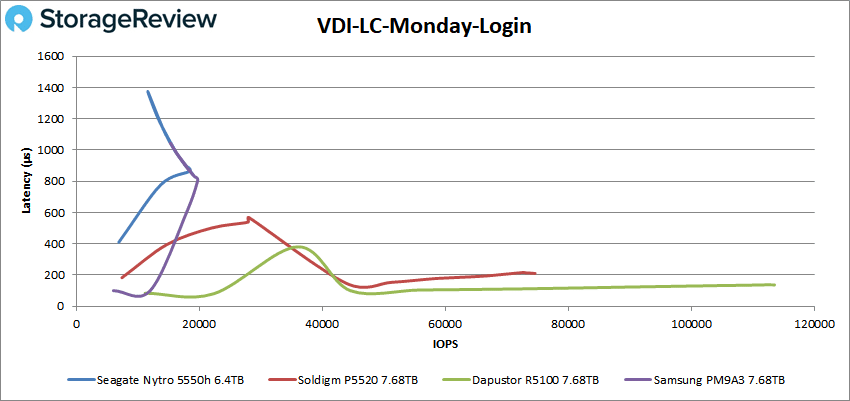
In our last test, VDI LC Monday Login, the Nytro 5550H came dead last and did even worse in performance. It peaked at 18.96K IOPS and 841.5µs in latency, before taking a huge spike in performance.
Conclusion
The Seagate Nytro 5050-series launch is a little confusing, with the extent of the portfolio surpassing nearly 150 parts. It probably would be a little more helpful for Seagate to better define the swimlanes for each model to reduce confusion. The end result is highly fragmented, with overlapping drives and configurations offered. Beyond the overwhelming SKU list, we have a hard time imagining how Seagate plans to support this entire family for the next five or more years. The cost to maintain inventory, support matrixes, and other background information for each individual drive is immense.
Drive family marketing decisions aside, Seagate made a critical strategic decision to leverage Phison’s controller to deliver an enterprise NVMe SSD to battle Samsung, Solidigm, Kioxia, Micron, and others. Unfortunately for Seagate, the decision to put so many eggs in this particular Phison basket didn’t work out. As a reminder, this is the first mass-market enterprise SSD controller Phison has brought to market.
In this review, all of the comps are 1 DWPD NVMe SSDs, as that’s what makes up the vast majority of enterprise SSDs shipped. Seagate sent us their 3 DWPD model, which should have a performance advantage over 1 DWPD comps. With that advantage, we saw the Nytro 5550H slip in our application workload covering a MySQL Sysbench scenario. In our synthetic tests, read performance came through quite strong, nearly matching the Dapustor R5100 at the top of the pack. That advantage though started to waiver as the workloads started to skew more towards write activity, or mixed read/write activity.
That said, is there a silver lining? Only if the drives are extremely inexpensive. In that case, they’ll be fine for many mainstream enterprise applications, where cost and power consumption may trump overall performance. In a market with so many excellent options, we expect Seagate to find very tough sledding with the latest Nytro family.
.


 Amazon