

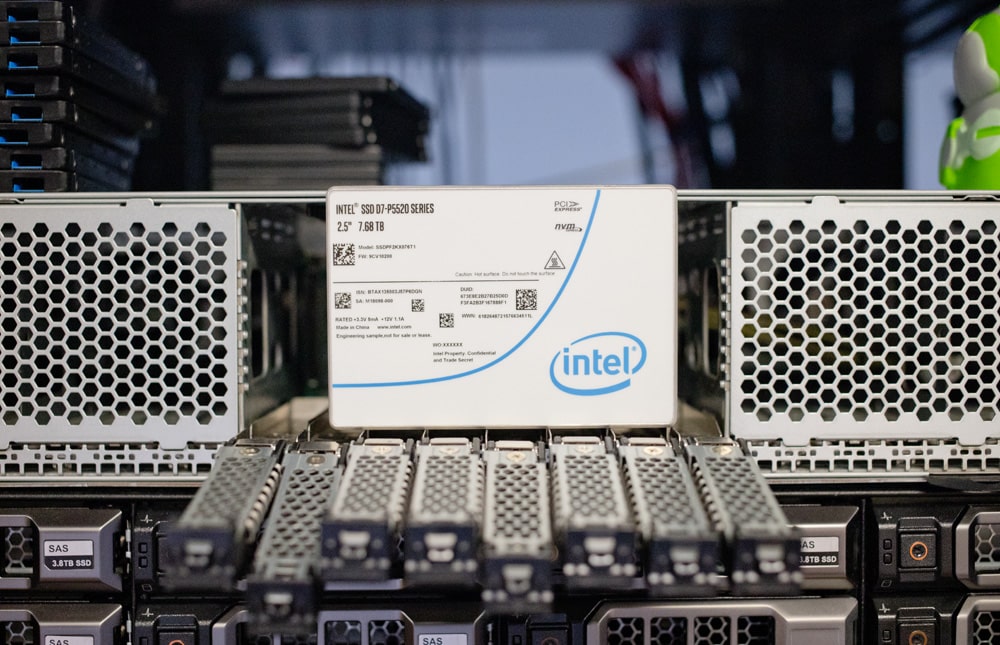
The Solidigm D7-P5520 is an enterprise SSD from the performance-driven D7 series, featuring zero tolerance for data errors, consistent performance and offered in a broad range of capacities and form factors. Powered by the company’s 144-layer TLC 3D NAND technology, P5520 is the first broad release from the newly formed Solidigm.
Solidigm P5520
Solidigm Technology was launched earlier this year by SK hynix, which was born from the company’s $9 billion acquisition of Intel’s NAND and SSD technology. Based in San Jose, Solidigm operates as a standalone U.S. subsidiary of SK hynix Inc. and now manages product development, manufacturing, and sales of these acquired assets.
Solidigm P5520
That said, the release of the P5520 is a bit unique. It started out as an Intel drive and carries an Intel P5520 sticker, but it was announced in its general availability form as a Solidigm SSD. So, it lies somewhere in between, but given the success of the P5510 predecessor, The P5520 has very high expectations within the new company.
The Solidigm P5520 is available in various capacities and form factors, including the usual U.2 15mm, which is available in 1.92 TB, 3.84 TB, 7.68 TB, and 15.36TB models. Organizations also have the option of several E1 (or “ruler”) models, a form factor that has been growing in popularity in recent times. This is important because it will allow for more interesting server builds due to their unique combination of size, built-in thermal capabilities, and performance. Of course, rulers are popular with hyperscalers as well.
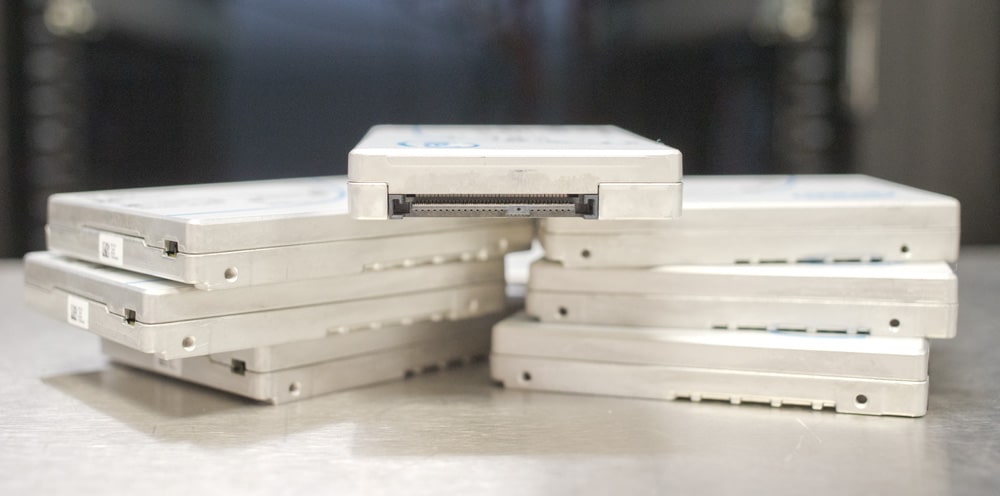
Solidigm P5520 Stacked
As such, the P5520 line is available in E1.S (9.5 mm/15 mm) in capacities of 1.92 TB, 3.84 TB, and 7.68TB. Solidigm also offers the E1.L 9.5mm form factor (a much larger version of the ruler), which is only available in a 15.36 TB model. This form factor will likely be meant for only very large-scale deployments that need the density that E1.L can offer. This is also a standard TLC NAND drive, the other high capacity ruler SSDs (P5316) have been QLC to date. Solidigm has opted to not include E3.S in this release, which is interesting, as that form factor appears to have traction with some server and storage array manufacturers.
Solidigm P5520 vs. P5510
Solidigm’s new D7 series has been noticeably improved over the previous generation of PCIe 4.0 drives, including better performance in mixed and read-intensive applications. For example, compared to the P5510, Solidigm indicates an improvement up to 42% higher in random reads with 1.1 million IOPS and 17% higher in random 4K writes with 200,000 IOPS. Sequential performance is quoted at 7.1GB/s read and 4.2GB/s write.
This upgraded performance profile, coupled with its expanded capacity range, can translate into more cost-saving opportunities for organizations. For example, when looking at a 365TB configuration (via the 15.36TB model), Solidigm claims a 50% smaller physical footprint and a 44% reduction in overall power compared to the 8TB P4510.
The Solidigm P5520 also comes with a range of improved enterprise features, including support for multiple sector sizes (512/520/4,096/4,104/4,160 B), OPAL 2.0, configurable namespace locking, secure erase, improved telemetry logs (including intelligent error tracking and logging), dynamic multiple namespaces and device self-test.
Backed by a 5-year warranty, we will be looking at the 7.68TB U.2 P5520 in this review.
Solidigm P5520 SSD Specifications
| NAND | Solidigm 144-L 3rd generation 3D NAND |
| Capacities and form factors |
|
| Interface | PCIe 4.0 x4, NVMe 1.4, NVMe-MI 1.1 |
| Drive manageability |
|
| Performance |
|
| Endurance (DWPD, 5 years) | Up to 1 |
| Warranty | Five-year limited warranty |
Solidigm D7-P5520 SSD Performance
Testing Background and Comparables
The StorageReview Enterprise Test Lab provides a flexible architecture for conducting benchmarks of enterprise storage devices in an environment comparable to what administrators encounter in real deployments. The Enterprise Test Lab incorporates a variety of servers, networking, power conditioning, and other network infrastructure that allows our staff to establish real-world conditions to accurately gauge performance during our reviews.
We incorporate these details about the lab environment and protocols into reviews so that IT professionals and those responsible for storage acquisition can understand the conditions under which we have achieved the following results. None of our reviews are paid for or overseen by the manufacturer of equipment we are testing. Additional details about the StorageReview Enterprise Test Lab and an overview of its networking capabilities are available on those respective pages.
Comparables:
Testbed
Our PCIe Gen4 Enterprise SSD reviews leverage a Lenovo ThinkSystem SR635 for application tests and synthetic benchmarks. The ThinkSystem SR635 is a well-equipped single-CPU AMD platform, offering CPU power well in excess of what’s needed to stress high-performance local storage. It is also the only platform in our lab (and one of the few on the market currently) with PCIe Gen4 U.2 bays. Synthetic tests don’t require a lot of CPU resources but still leverage the same Lenovo platform. In both cases, the intent is to showcase local storage in the best light possible that aligns with storage vendor maximum drive specs.
PCIe Gen4 Synthetic and Application Platform (Lenovo ThinkSystem SR635)
- 1 x AMD 7742 (2.25GHz x 64 Cores)
- 8 x 64GB DDR4-3200MHz ECC DRAM
- CentOS 7.7 1908
- ESXi 6.7u3
SQL Server Performance
Each SQL Server VM is configured with two vDisks: 100GB volume for boot and a 500GB volume for the database and log files. From a system resource perspective, we configured each VM with 8 vCPUs, 64GB of DRAM and leveraged the LSI Logic SAS SCSI controller. While our Sysbench workloads tested previously saturated the platform in both storage I/O and capacity, the SQL test is looking for latency performance.
This test uses SQL Server 2014 running on Windows Server 2012 R2 guest VMs and is stressed by Quest’s Benchmark Factory for Databases. StorageReview’s Microsoft SQL Server OLTP testing protocol employs the current draft of the Transaction Processing Performance Council’s Benchmark C (TPC-C), an online transaction-processing benchmark that simulates the activities found in complex application environments. The TPC-C benchmark comes closer than synthetic performance benchmarks to gauging the performance strengths and bottlenecks of storage infrastructure in database environments. Each instance of our SQL Server VM for this review uses a 333GB (1,500 scale) SQL Server database and measures the transactional performance and latency under a load of 15,000 virtual users.
SQL Server Testing Configuration (per VM)
- Windows Server 2012 R2
- Storage Footprint: 600GB allocated, 500GB used
- SQL Server 2014
-
- Database Size: 1,500 scale
- Virtual Client Load: 15,000
- RAM Buffer: 48GB
- Test Length: 3 hours
- 2.5 hours preconditioning
- 30 minutes sample period
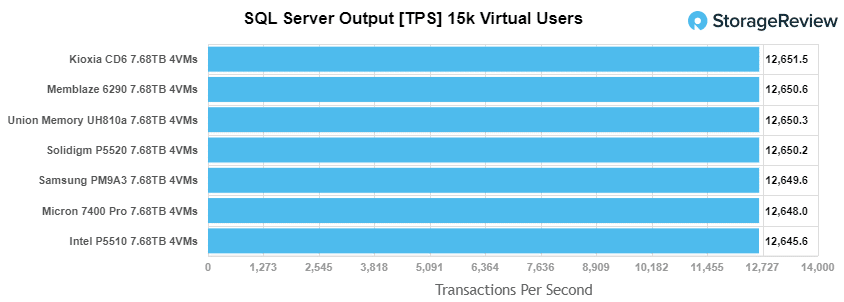
For our SQL Server transactional benchmark, the Solidigm P5520 placed among the leaders with 12,650.2 TPS.
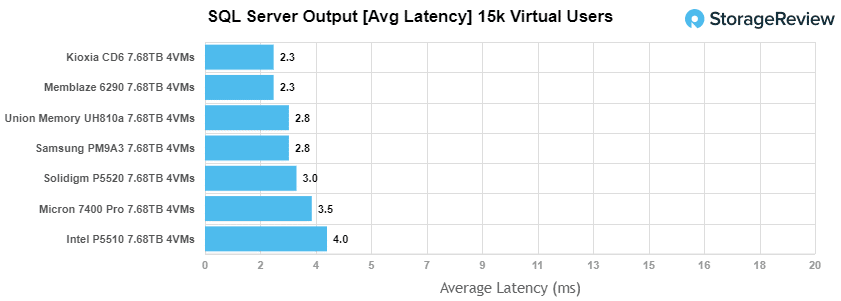
 With SQL Server average latency, the P5520 posted an average latency of just 3ms—a solid score that placed the drive 5th (both first and second place drives had ties).
Sysbench Performance
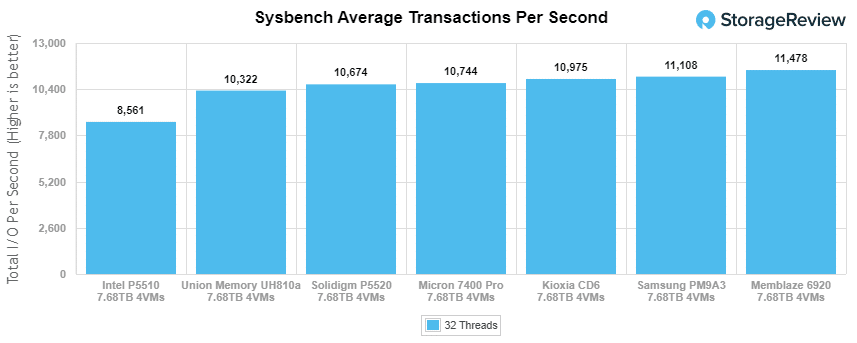
The next application benchmark consists of a Percona MySQL OLTP database measured via SysBench. This test measures average TPS (Transactions Per Second), average latency, and average 99th percentile latency as well.
Each Sysbench VM is configured with three vDisks: one for boot (~92GB), one with the pre-built database (~447GB), and the third for the database under test (270GB). From a system resource perspective, we configured each VM with 8 vCPUs, 60GB of DRAM and leveraged the LSI Logic SAS SCSI controller.
Sysbench Testing Configuration (per VM)
- CentOS 6.3 64-bit
- Percona XtraDB 5.5.30-rel30.1
-
- Database Tables: 100
- Database Size: 10,000,000
- Database Threads: 32
- RAM Buffer: 24GB
- Test Length: 3 hours
- 2 hours preconditioning 32 threads
- 1 hour 32 threads
Looking at our Sysbench transactional benchmark, the Solidigm P5520 had mid-range results (5th) with 10,674 TPS.
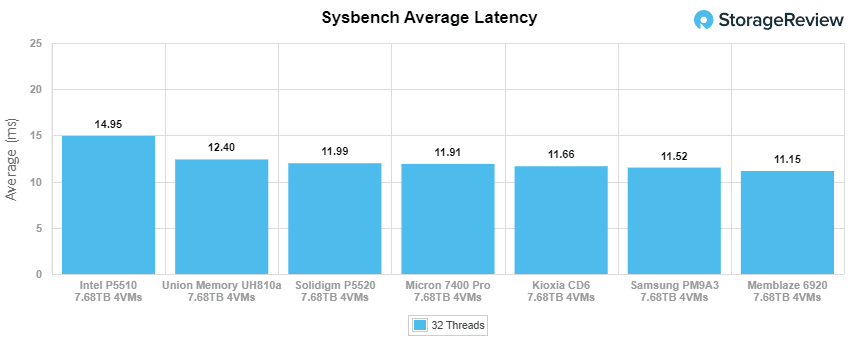
With Sysbench average latency, the P5520 posted 11.99ms, which was good enough for 5th place among the tested drives (a hair behind the Micron drive).
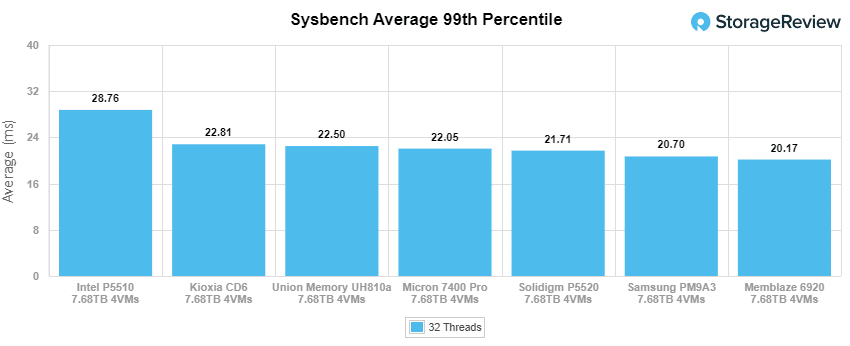
For our worst-case scenario latency (99th percentile) the Solidigm P5520 placed third with 21.71ms.
VDBench Workload Analysis
When it comes to benchmarking storage devices, application testing is best, and synthetic testing comes in second place. While not a perfect representation of actual workloads, synthetic tests do help to baseline storage devices with a repeatability factor that makes it easy to do apples-to-apples comparisons between competing solutions. These workloads offer a range of different testing profiles ranging from “four corners” tests, common database transfer size tests, to trace captures from different VDI environments.
All of these tests leverage the common vdBench workload generator, with a scripting engine to automate and capture results over a large compute testing cluster. This allows us to repeat the same workloads across a wide range of storage devices, including flash arrays and individual storage devices. Our testing process for these benchmarks fills the entire drive surface with data, then partitions a drive section equal to 25% of the drive capacity to simulate how the drive might respond to application workloads. This is different than full entropy tests which use 100% of the drive and takes them into a steady state. As a result, these figures will reflect higher-sustained write speeds.
Profiles:
- 4K Random Read: 100% Read, 128 threads, 0-120% iorate
- 4K Random Write: 100% Write, 128 threads, 0-120% iorate
- 16K Sequential Read: 100% Read, 32 threads, 0-120% iorate
- 16K Sequential Write: 100% Write, 16 threads, 0-120% iorate
- 64K Sequential Read: 100% Read, 32 threads, 0-120% iorate
- 64K Sequential Write: 100% Write, 16 threads, 0-120% iorate
- 4K, 8K, and 16K 70R/30W Random Mix, 64 threads, 0-120% iorate
- Synthetic Database: SQL and Oracle
- VDI Full Clone and Linked Clone Traces
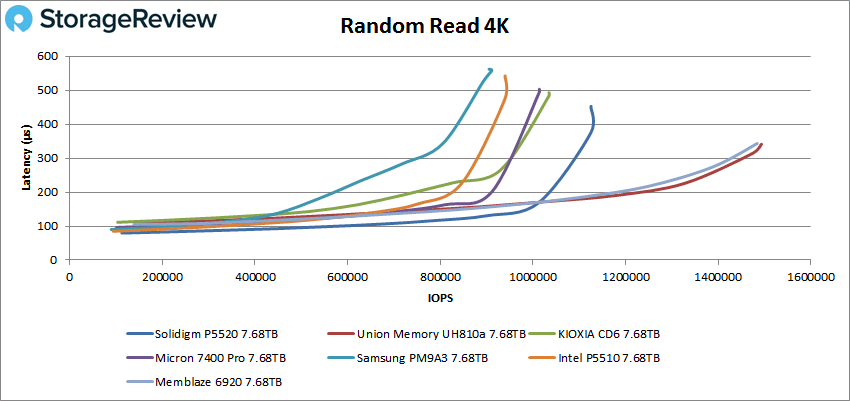
In our first VDBench Workload Analysis, Random 4K Read, the Solidigm P5520 had a solid peak performance of 1.12 million IOPS at a latency of 450µs, placing 3rd among the tested drives (though still well back of the Union Memory and Memblaze drives).
 In 4K random write, the P5520 fell to fourth place (just behind the Samsung PM9A3), peaking at 492K IOPS with a latency of 1,026.7µs.
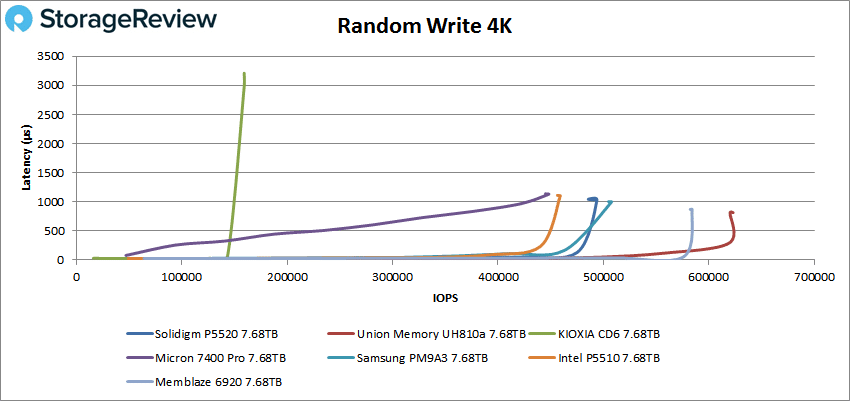
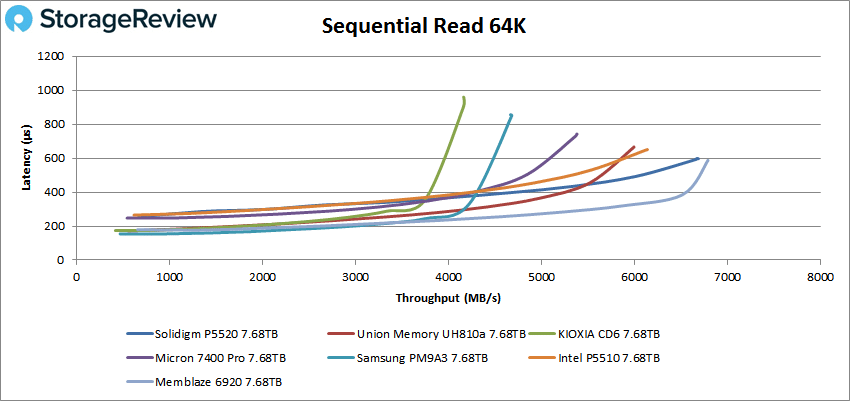
Switching over to 64k sequential workloads, the P5520 had a great showing, posting 6.66GB/s read (106,640 IOPS) at 599µs in latency in reads. This placed it just behind the Samsung drive for second among the tested SSDs and just slightly behind the first place Memblaze drive.
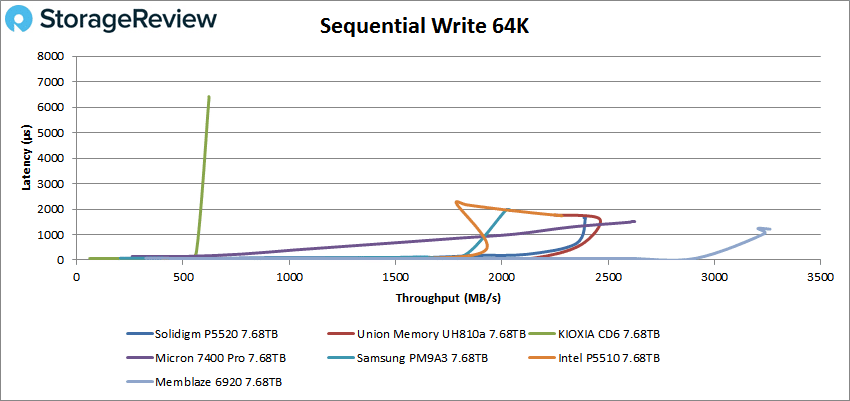
In 64K write, the P5520 peaked at 2.39GB/s (38,286 IOPD) with a latency of 1,662µs, placing third.
Next up is our 16K sequential performance. In reads, the P5520 posted an impressive and leading 3.95GB/s (252,523 IOPS) 125.8µs in latency.
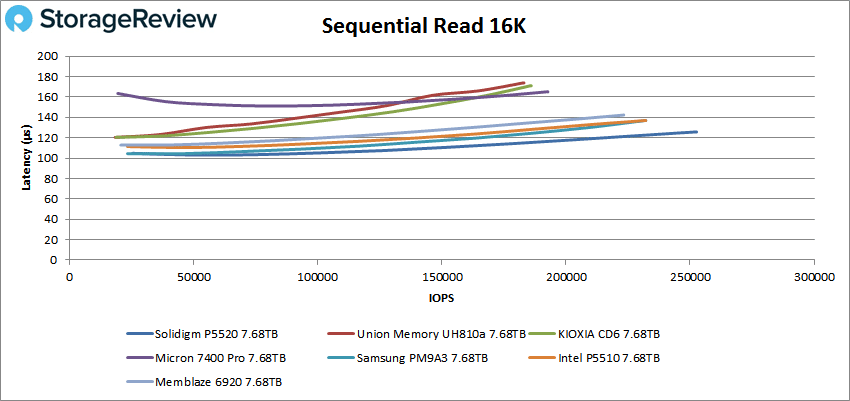
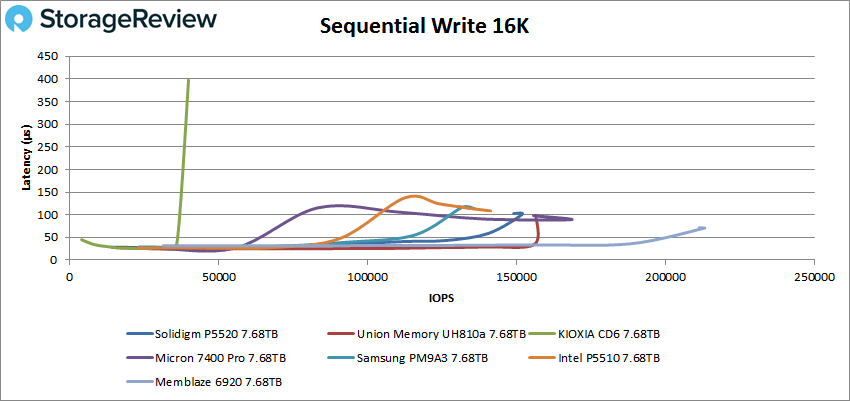
The Solidigm drive fell back a few places in 16K, peaking at just 2.37GB/s (151,874 IOPS) with 100.7µs in latency.
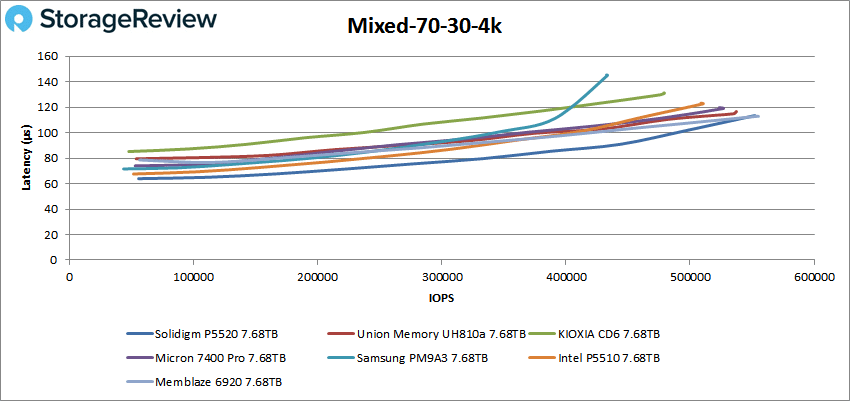
In our mixed 70/30 4k profile (70% read, 30% write), the P5520 had another impressive showing, posting a peak of 552K IOPS at 113.4µs in latency. This was just a hair behind the Memblaze 6920 for second place.
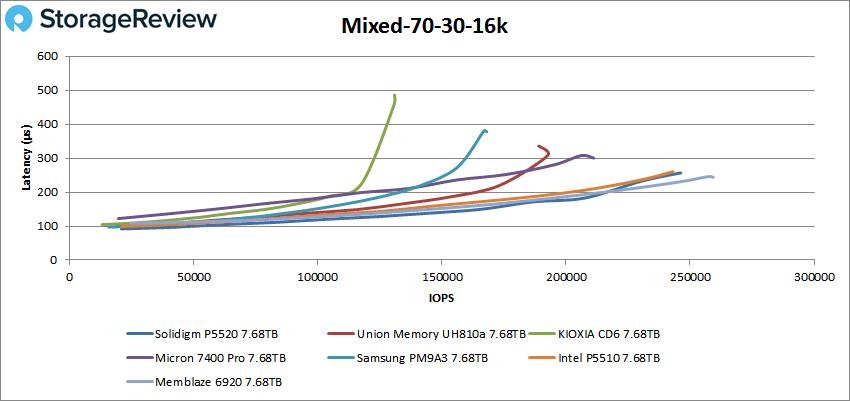
In our mixed 70/30 16k profile, the P5520 hit 246K IOPS at 256.9µs in latency placing last, again only slightly trailing the Memblaze.
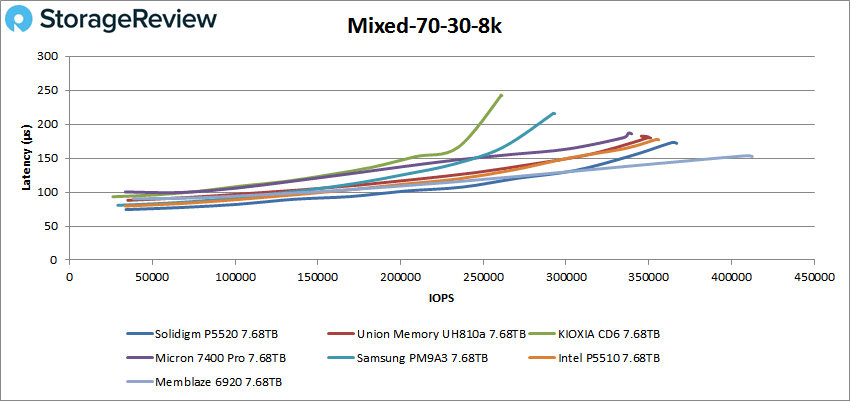
In our last mixed profile (70/30 8k), the P5520 peaked at a solid 364,134 IOPS with a latency of 171.8µs.
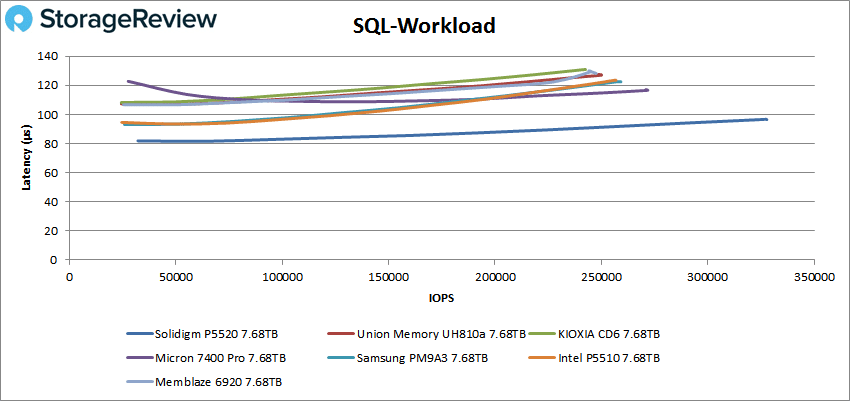
Our next set of tests is our SQL workloads: SQL, SQL 90-10, and SQL 80-20, all of which showed the Solidigm drive in the lead by a noticeable margin. Starting with SQL, the P5520 posted a peak performance of 327K IOPS with a latency of just 96.7µs. The next best drive was the Micron 7400 Pro, which was well behind the Solidigm drive with 271K IOPS.
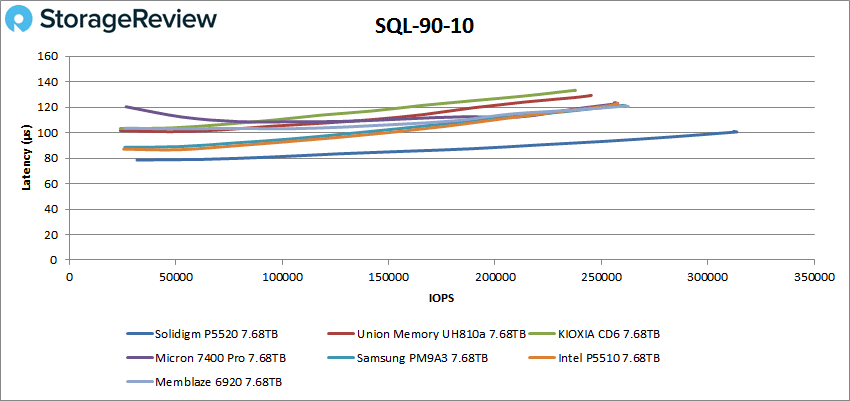
 In SQL 90-10, we saw a similar story, as the P5520 was by far the best performing drive, peaking at 314K IOPS with a latency of 101.1µs.
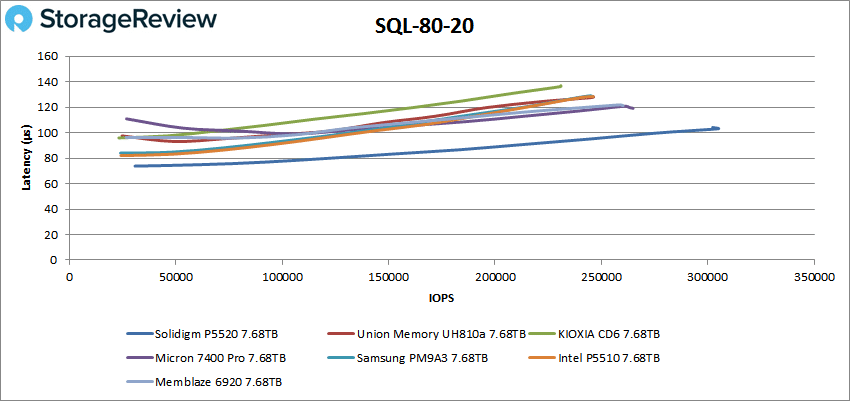
With SQL 80-20, the P5520 peaked at an impressive 305K IOPS with a latency of 103.1µs, again placing it first by a noticeable margin.
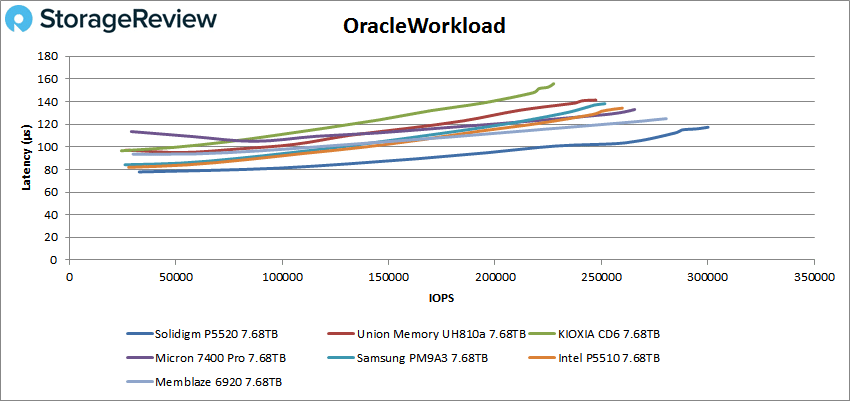
Next up are our Oracle workloads: Oracle, Oracle 90-10, and Oracle 80-20. Like with the SQL benchmarks, the P5520 continued to finish in first place in all of our tests. Starting with the general Oracle workload, the P5520 had a peak performance of 300K IOPS at 117.3µs.
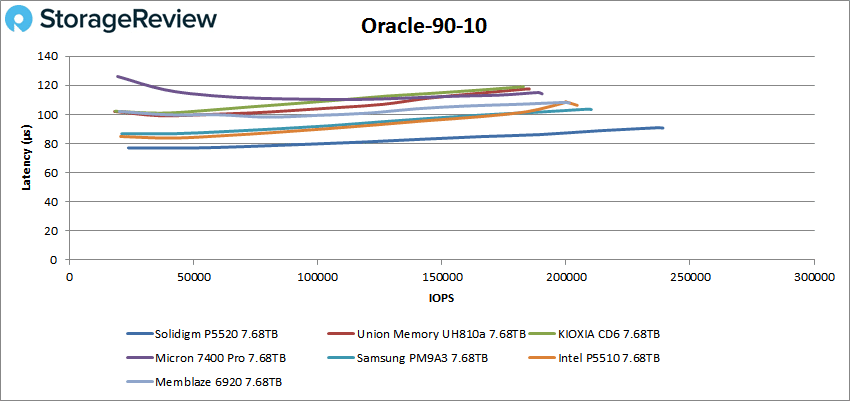
 For Oracle 90-10, the P5520 peaked at 237K IOPS with a latency 90.7µs.
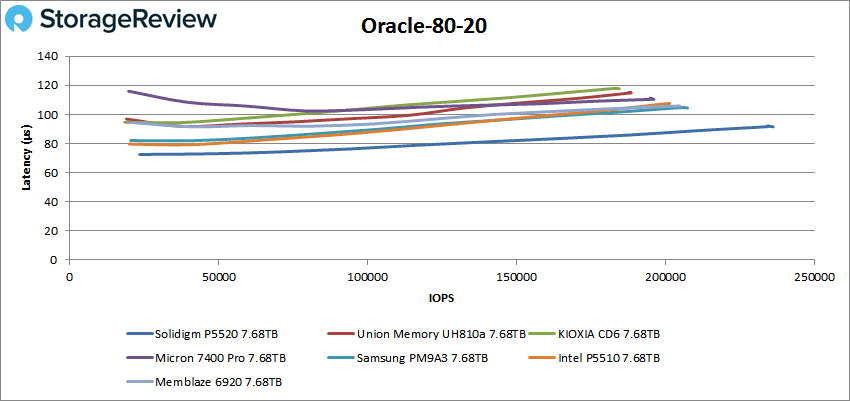
Looking at Oracle 80-20, the P5520 took posted a peak performance of 236K IOPS at 91.5µs.
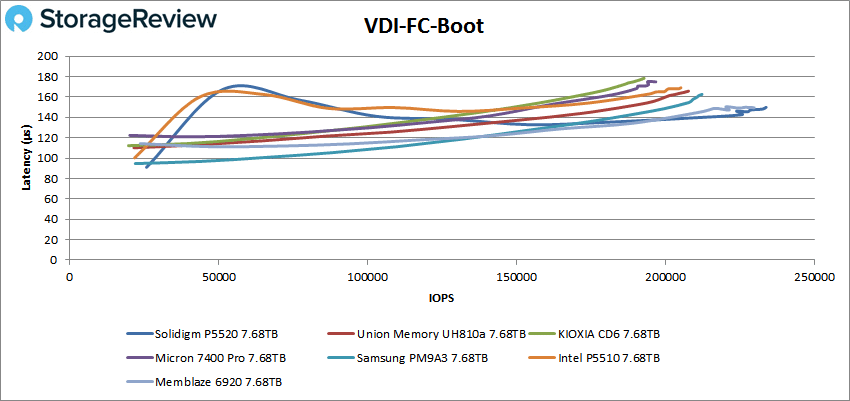
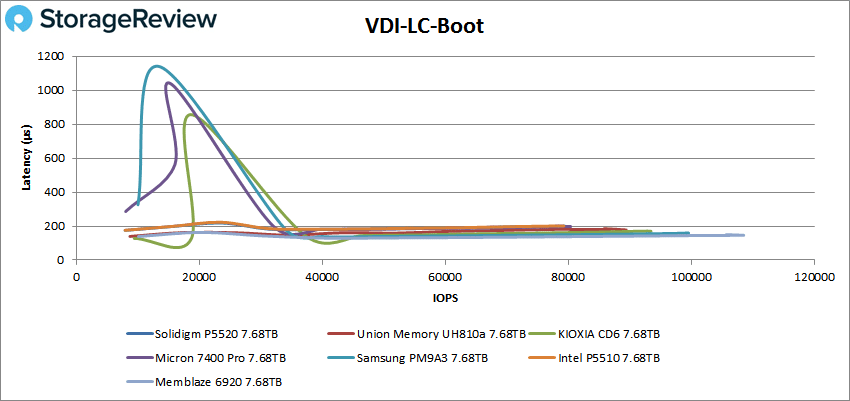
Next, we switched over to our VDI clone test, Full and Linked. For VDI Full Clone (FC) Boot, the P5520 continued its great performance, peaking at 233K IOPS with a latency of 148.2µs.
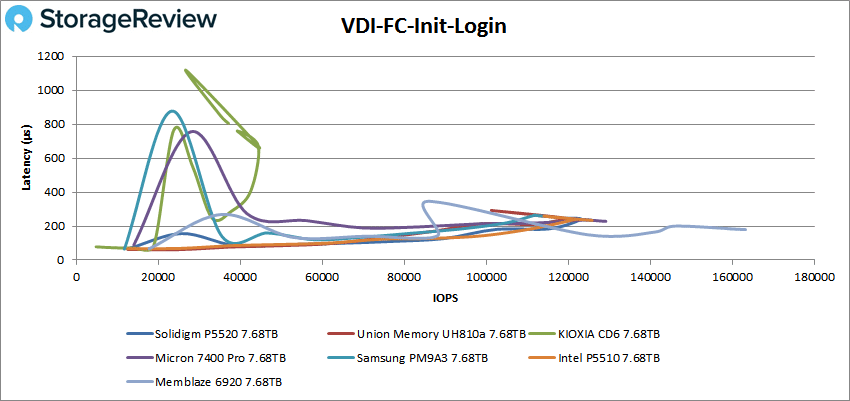
 Though it might be hard to see from the chart below, the P5520 was one of the more stable drives during VDI FC Initial Login, peaking at 127K IOPS with a latency of 232.8µs.
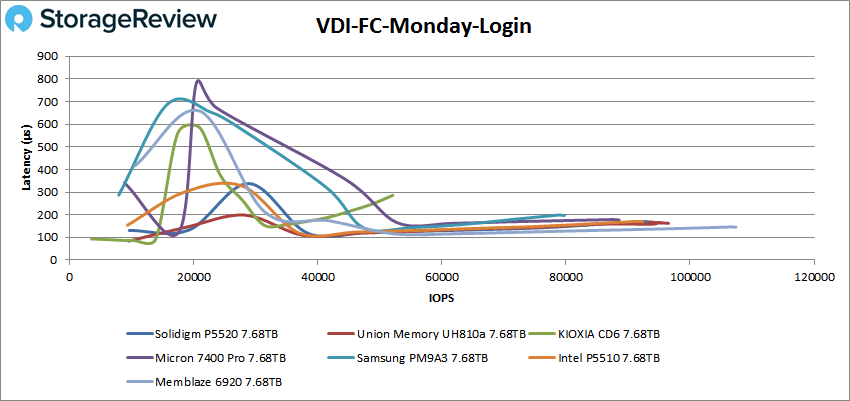
With VDI FC Monday Login, the Solidigm P5520 placed third (just behind the Union Memory drive) with 95K IOPS at a latency of 164.4µs.
For VDI Linked Clone (LC) Boot, the P5520 continued its stable performance (though falling back a bit on the leaderboard), peaking at 79K IOPS with 200.2µs.
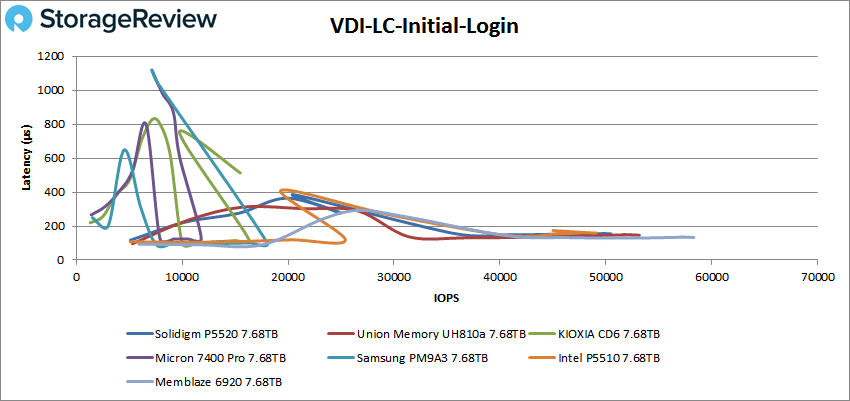
In VDI LC Initial Login, the P5520’s performance struggled a bit at the beginning (like all of the other drives), but eventually peaked at a solid 50K IOPS with 149µs for third place.
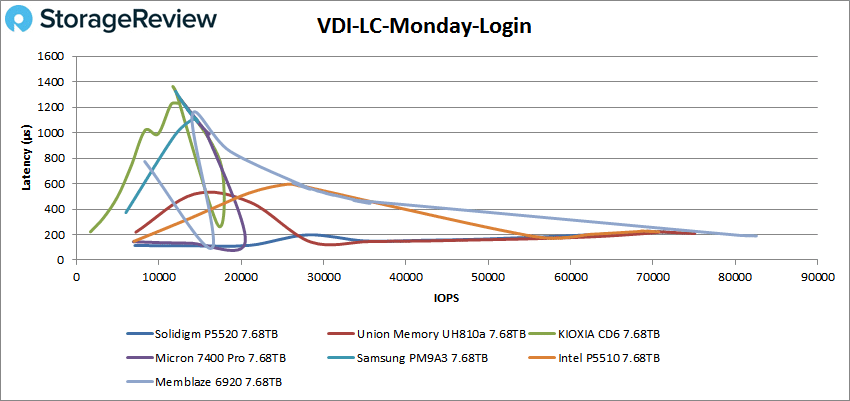
For VDI LC Monday Login, the P5520 boasted very stable performance, peaking at 72K IOPS with a latency of 218.7µs.
Conclusion
The Solidigm P5520 is clearly a successful release by the newly formed company. This enterprise drive leverages the PCIe 4.0 interface and is available in a range of form factors and capacities, including the usual U.2 format as well as E1.S and E1.L ruler models. In addition, the P5520 is built with Solidigm’s 144-L 3rd generation 3D NAND and comes with a range of advanced enterprise features, including OPAL 2.0, configurable namespace locking, sanitize, secure erase, and data security.
That said, its overall performance was the main highlight, as the P5520 found itself consistently among the leaders during our benchmarking. We tested the Solidigm drive against six other PCIe Gen4 enterprise 7.68TB SSDs with similar specifications and applications: the Samsung PM9A3, Memblaze 6920, Intel P5510, KIOXIA CD6, Intel P5510, and Micron 7400 Pro. We looked at both application workload analysis and VDBench workloads during our analysis.
In our Sysbench tests, we saw the P5520 has mid-range results with aggregate scores of 10,674 TPS, 11.99ms in average latency, and 21.71ms in a worst-case scenario. Results were much better during our SQL Server transactional benchmark, posting 12,650.2TPS and an average latency of 3ms.
When switching over to VDBench, the P5520 showed great overall performance. Highlights include 1.12 million IOPS read and 492K IOPS write in our 4k workloads, while hitting 6.66GB/s in 64K read, 2.39GB/s in 64K write, 3.95GB/s read in 16K read, 2.37GB/s in 623MB/s again in writes, during our sequential workloads. Our mixed 70/30 profiles recorded 552K IOPS in 4K, 364K IOPS in 8K, and 246K IOPS in 16K.
In our SQL testing, the P5520 saw peaks of 327K IOPS (first by a noticeable margin), 314K IOPS in SQL 90-10, and 305K IOPS in SQL 80-20, leading the pack throughout. Oracle workloads told a similar story, recording 300K IOPS, 237K IOPS in Oracle 90-10, and 236K IOPS in Oracle 80-20.
Next up were our VDI Clone tests, Full and Linked. In Full Clone, we saw 233K IOPS in boot, 127K IOPS in Initial Login, and 95K IOPS in Monday Login. In Linked Clone, the Solidigm drive showed a peak of 79K IOPS in boot, 50K IOPS in Monday Login, and 72K in Initial Login.
Coupled with this impressive performance profile and its range of available form factors and capacity models, the P5520 will fit pretty much any data center need. Though our review unit is an Intel-branded drive, if the P5520 is any indication of what we can expect from future Solidigm releases, we will be looking forward to seeing more of their SSDs come through the lab. Overall the P5520 is a great progression and should be a popular choice for OEMs and system builders.


 Amazon