

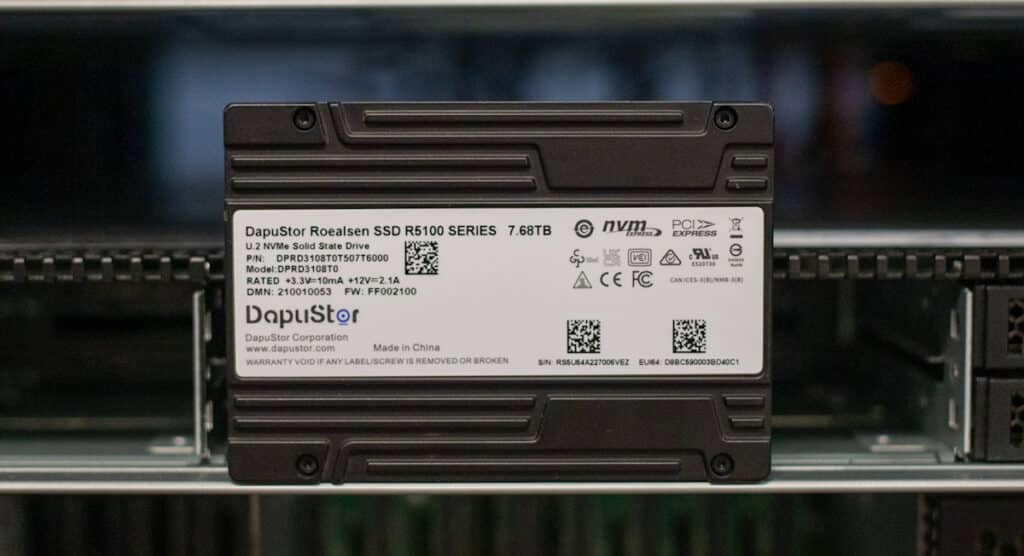
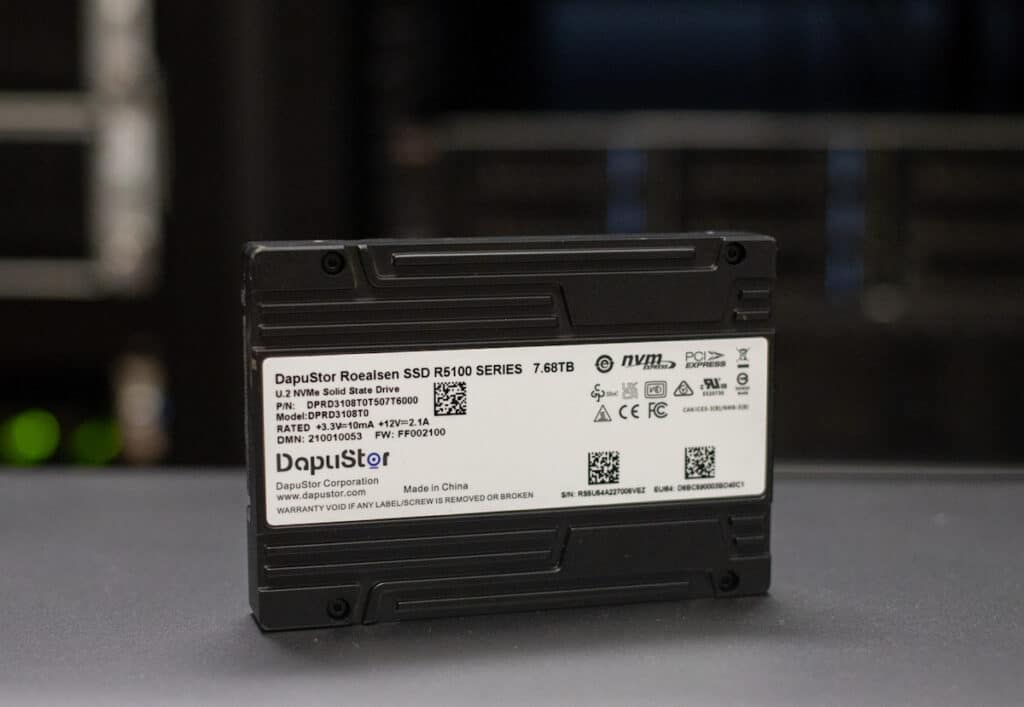
The DapuStor R5100 is part of the company’s R5 Series line of enterprise-grade PCIe Gen4 SSDs, which are purpose-built for core data storage scenarios in fields like enterprise IT, logistics, Internet, finance, intelligent manufacturing, and AI. Powered by the DapuStor DPU600 controller firmware and KIOXIA’s latest 3D enterprise 112L TLC NAND, the DapuStor SSD features great reliability, low latency, and power efficiency, making it ideal for organizations looking to lower their TCO.
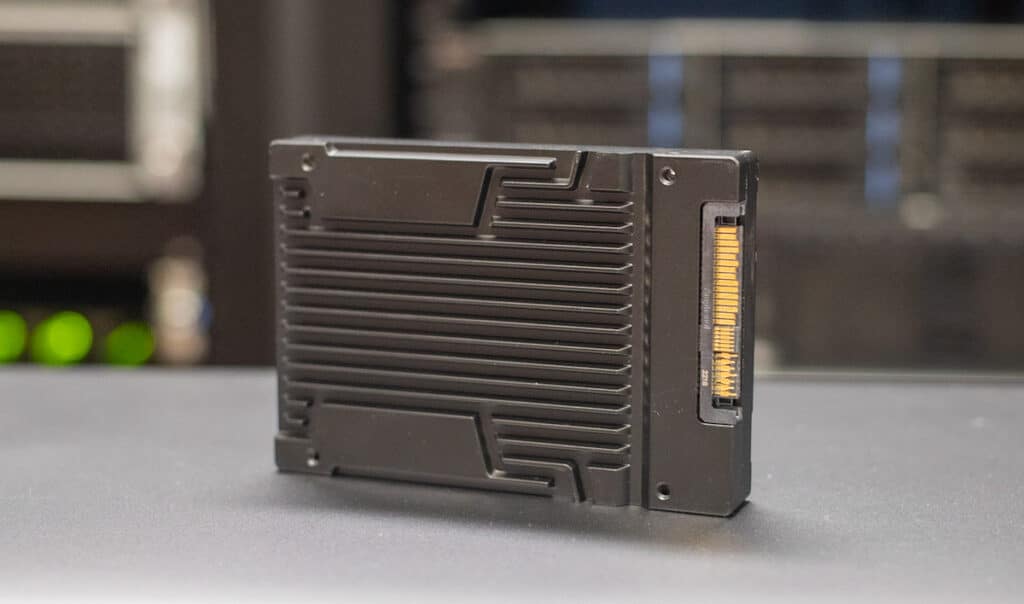
The New R5 Series comes in four different models (all of which use the U.2 15mm form factor): the R5101, R5301, R5100 and R5300. We will be looking at the R5100 for this review, the highest capacity version, which offers 7.68TB and 15.36TB models.
 The last DapuStor U.2 drive we reviewed was the X2900P SCM SSD (which also uses the DPU600 controller), and we found it to be a fantastic, performance-driven release by the company. DapuStor has a great track record of producing impressive storage solutions, so we hope for more of the same with the R5100.
DapuStor R5100 Features
DapuStor indicates a 100% improvement in bandwidth and IOPS performance compared to the previous Haishen3 series. Specifically, the R5100’s 7.86TB model is quoted to deliver up to 7.4GB/s read and 5.7GB/s write in sequential (128K) speeds, and random performance is expected to reach up to 1.75 million IOPS and 280,000 IOPS in reads and writes. While the 15.36TB model is quoted at with the same read performance, it shows slightly higher numbers in writes with 6.5GB/s, as well as 320,000 IOPS in sequential and random 4K performance.
For latency, the R5 series has greatly improved and QoS under mixed read-write scenarios (as you will see in our performance charts below), which is due to the DPU600 controller’s numerous optimizations on the IO path.
Backed by a 5-year warranty, the R5100 is equipped with dual port support and Flash Raid 2.0. For data encryption, the R5100 features data encryption, such as a range of encryption algorithm support, and TCG2.0 enterprise specifications. The DapuStor drive also has advanced power loss protection, which helps to protect user data from unexpected power failures, and features nine levels of adjustable power consumption.
DapuStor R5100 Specifications
| Series | Roealsen5 | |
| Capacity (TB) | 7.68 | 15.36 |
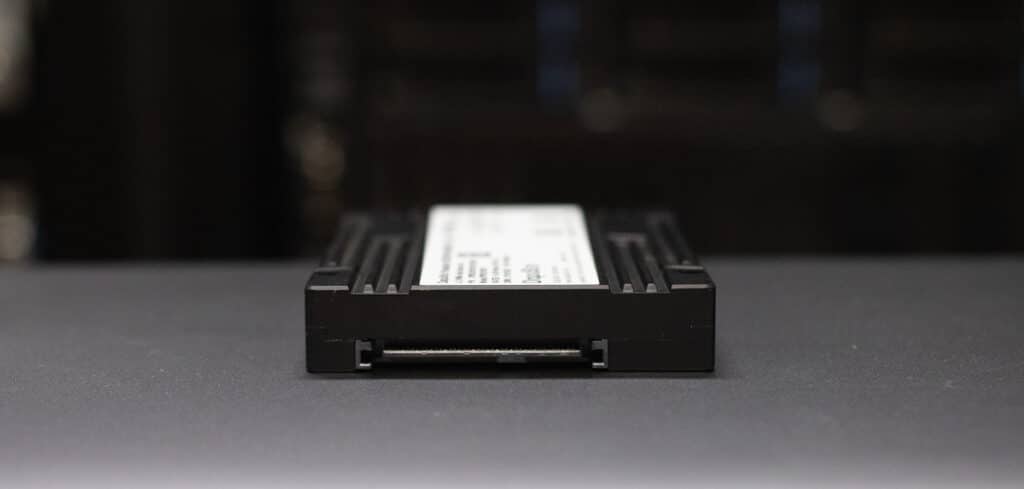
| Form Factor | U.2 15mm | |
| Interface | PCIe 4.0 x4, NVMe 1.4a | |
| Read Bandwidth (128KB) MB/s | 7,400 | 7,400 |
| Write Bandwidth (128KB) MB/s | 5,700 | 7,000 |
| Random Read (4KB) KIOPS | 1,750 | 1,750 |
| Random Write (4KB) KIOPS | 280 | 300 |
| 4K Random Lantency (Typ.) R/W µs | 65/10 | |
| 4K Sequential Latency (Typ.) R/W μs | 8/10 | |
| Power | Active: ≤ 22 W, idle: ≤ 7 W | |
| Flash Type | KIOXIA 3D NAND, 112 layer, 2 plane Enterprise TLC | |
| Endurance | 1 DWPD | |
| UBER | 1 sector per 10^17 bits read | |
| MTBF | 2 million hours | |
| Warranty | 5 years | |
DapuStor R5100 SSD Performance
Testing Background and Comparables
The StorageReview Enterprise Test Lab provides a flexible architecture for conducting benchmarks of enterprise storage devices in an environment comparable to what administrators encounter in real deployments. The Enterprise Test Lab incorporates a variety of servers, networking, power conditioning, and other network infrastructure that allows our staff to establish real-world conditions to accurately gauge performance during our reviews.
We incorporate these details about the lab environment and protocols into reviews so that IT professionals and those responsible for storage acquisition can understand the conditions under which we have achieved the following results. None of our reviews are paid for or overseen by the manufacturer of equipment we are testing. Additional details about the StorageReview Enterprise Test Lab and an overview of its networking capabilities are available on those respective pages.
Comparables:
Testbed
Our PCIe Gen4 Enterprise SSD reviews leverage a Lenovo ThinkSystem SR635 for application tests and synthetic benchmarks. The ThinkSystem SR635 is a well-equipped single-CPU AMD platform, offering CPU power well in excess of what’s needed to stress high-performance local storage. It is also the only platform in our lab (and one of the few on the market currently) with PCIe Gen4 U.2 bays. Synthetic tests don’t require a lot of CPU resources but still leverage the same Lenovo platform. In both cases, the intent is to showcase local storage in the best light possible that aligns with storage vendor maximum drive specs.
PCIe Gen4 Synthetic and Application Platform (Lenovo ThinkSystem SR635)
- 1 x AMD 7742 (2.25GHz x 64 Cores)
- 8 x 64GB DDR4-3200MHz ECC DRAM
- CentOS 7.7 1908
- ESXi 6.7u3
SQL Server Performance
Each SQL Server VM is configured with two vDisks: 100GB volume for boot and a 500GB volume for the database and log files. From a system resource perspective, we configured each VM with 8 vCPUs, 64GB of DRAM and leveraged the LSI Logic SAS SCSI controller. While our Sysbench workloads tested previously saturated the platform in both storage I/O and capacity, the SQL test is looking for latency performance.
This test uses SQL Server 2014 running on Windows Server 2012 R2 guest VMs and is stressed by Quest’s Benchmark Factory for Databases. StorageReview’s Microsoft SQL Server OLTP testing protocol employs the current draft of the Transaction Processing Performance Council’s Benchmark C (TPC-C), an online transaction-processing benchmark that simulates the activities found in complex application environments. The TPC-C benchmark comes closer than synthetic performance benchmarks to gauging the performance strengths and bottlenecks of storage infrastructure in database environments. Each instance of our SQL Server VM for this review uses a 333GB (1,500 scale) SQL Server database and measures the transactional performance and latency under a load of 15,000 virtual users.
SQL Server Testing Configuration (per VM)
- Windows Server 2012 R2
- Storage Footprint: 600GB allocated, 500GB used
- SQL Server 2014
- Database Size: 1,500 scale
- Virtual Client Load: 15,000
- RAM Buffer: 48GB
- Test Length: 3 hours
- 2.5 hours preconditioning
- 30 minutes sample period
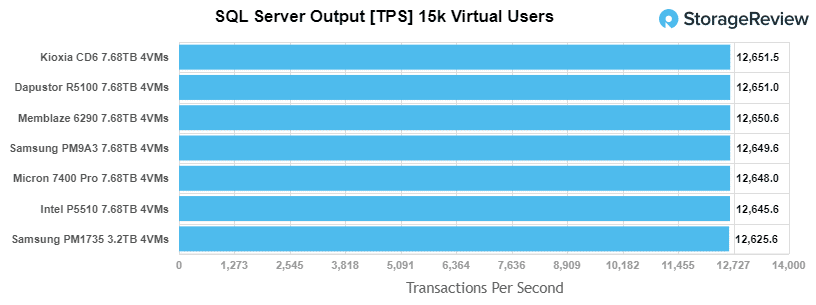
For our SQL Server transactional benchmark, the DapuStor R5100 placed a hair behind the KIOXIA drive for 2nd place with a solid 12,651 TPS.
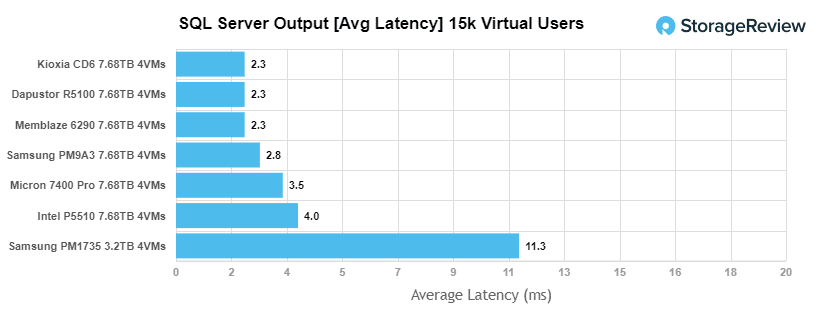
With SQL Server average latency, the R5100 posted an average latency of just 2.3ms—a great score that placed first alongside the KIOXIA and Memblaze drives.
Sysbench Performance
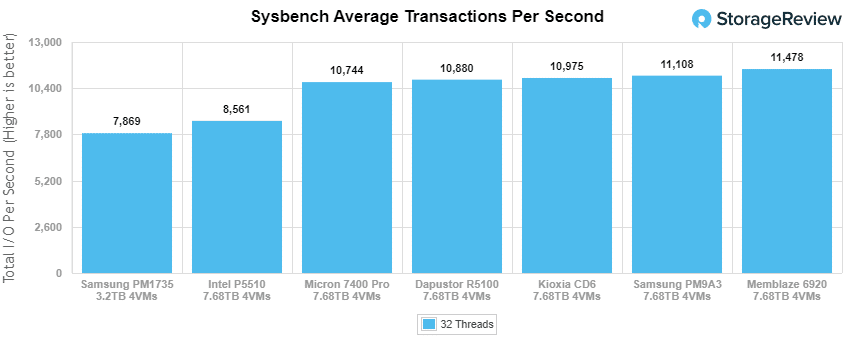
The next application benchmark consists of a Percona MySQL OLTP database measured via SysBench. This test measures average TPS (Transactions Per Second), average latency, and average 99th percentile latency as well.
Each Sysbench VM is configured with three vDisks: one for boot (~92GB), one with the pre-built database (~447GB), and the third for the database under test (270GB). From a system resource perspective, we configured each VM with 8 vCPUs, 60GB of DRAM and leveraged the LSI Logic SAS SCSI controller.
Sysbench Testing Configuration (per VM)
- CentOS 6.3 64-bit
- Percona XtraDB 5.5.30-rel30.1
- Database Tables: 100
- Database Size: 10,000,000
- Database Threads: 32
- RAM Buffer: 24GB
- Test Length: 3 hours
- 2 hours preconditioning 32 threads
- 1 hour 32 threads
Looking at our Sysbench transactional benchmark, the DapuStor R5100 had mid-range results with 10,880 TPS.
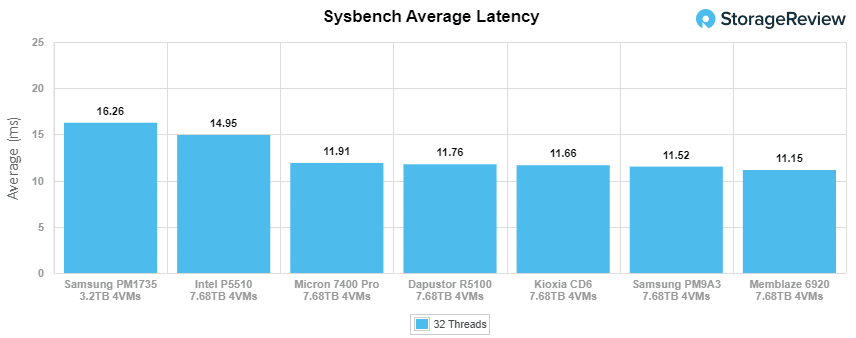
 With Sysbench average latency, the R5100 posted 11.76ms, which was good enough for 4th place among the tested drives.
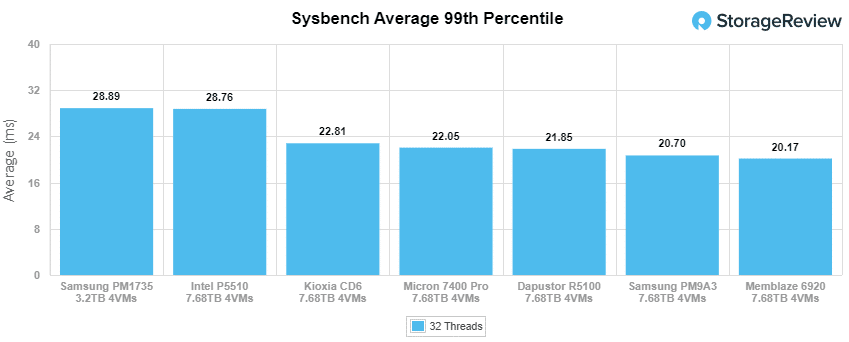
For our worst-case scenario latency (99th percentile) the DapuStor R5100 placed 3rd with 21.85ms.
VDBench Workload Analysis
When it comes to benchmarking storage devices, application testing is best, and synthetic testing comes in second place. While not a perfect representation of actual workloads, synthetic tests do help to baseline storage devices with a repeatability factor that makes it easy to do apples-to-apples comparisons between competing solutions. These workloads offer a range of different testing profiles ranging from “four corners” tests, common database transfer size tests, to trace captures from different VDI environments.
All of these tests leverage the common vdBench workload generator, with a scripting engine to automate and capture results over a large compute testing cluster. This allows us to repeat the same workloads across a wide range of storage devices, including flash arrays and individual storage devices. Our testing process for these benchmarks fills the entire drive surface with data, and then partitions a drive section equal to 25% of the drive capacity to simulate how the drive might respond to application workloads. This is different from full entropy tests which use 100% of the drive and takes them into a steady state. As a result, these figures will reflect higher-sustained write speeds.
Profiles:
- 4K Random Read: 100% Read, 128 threads, 0-120% iorate
- 4K Random Write: 100% Write, 128 threads, 0-120% iorate
- 16K Sequential Read: 100% Read, 32 threads, 0-120% iorate
- 16K Sequential Write: 100% Write, 16 threads, 0-120% iorate
- 64K Sequential Read: 100% Read, 32 threads, 0-120% iorate
- 64K Sequential Write: 100% Write, 16 threads, 0-120% iorate
- 4K, 8K, and 16K 70R/30W Random Mix, 64 threads, 0-120% iorate
- Synthetic Database: SQL and Oracle
- VDI Full Clone and Linked Clone Traces
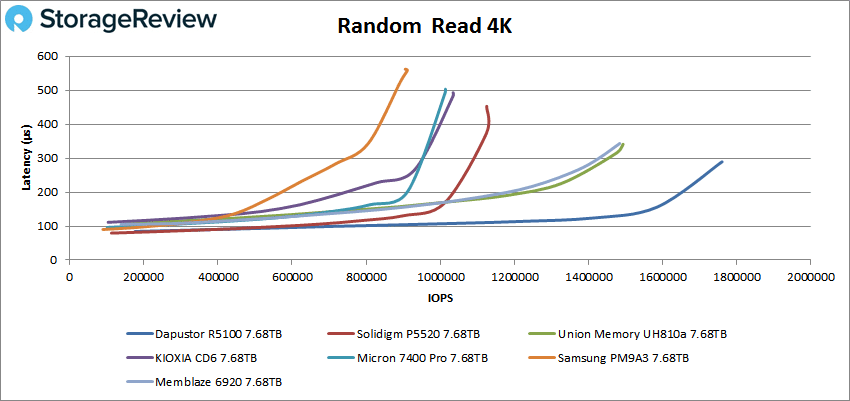
In our first VDBench Workload Analysis, Random 4K Read, the DapuStor R5100 had impressive peak performance of 1.76 million IOPS at a latency of 288.9µs, easily placing first among the tested drives (well past the 2nd and 3rd placed Union Memory and Memblaze drives).
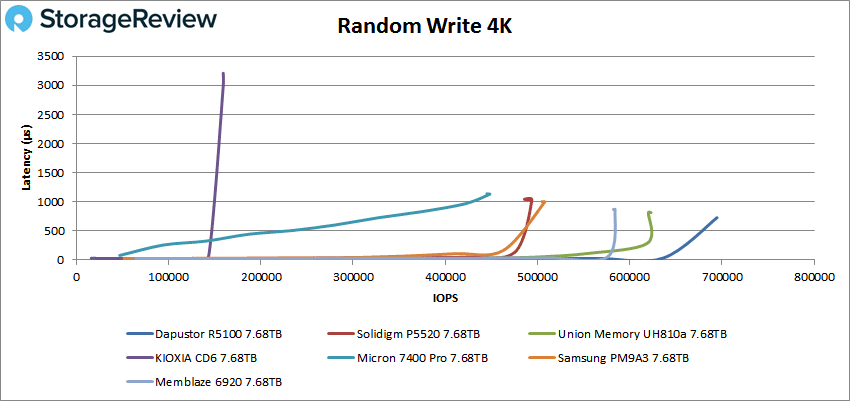
 In 4K random write, the R5100 continued its impressive performance placing first while peaking at 695K IOPS with a latency of 727.4µs.
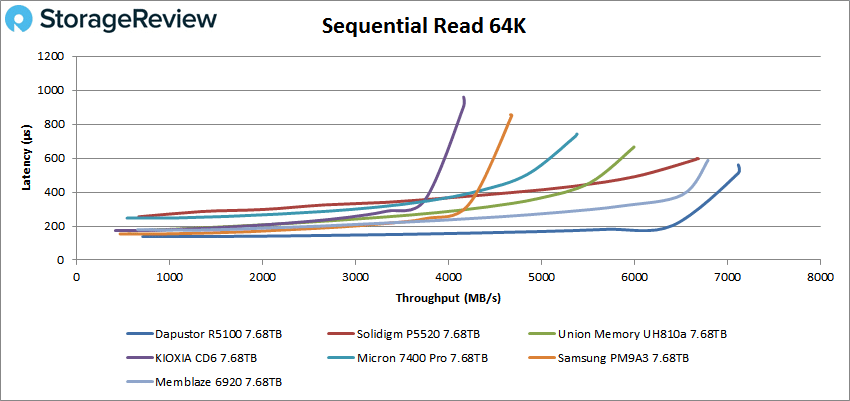
Switching over to 64k sequential workloads, the R5100 had a great showing again with 7.1GB/s read (114K IOPS) at 561µs in latency in reads. This placed it first (a bit better than the 2nd place Memblaze drive).
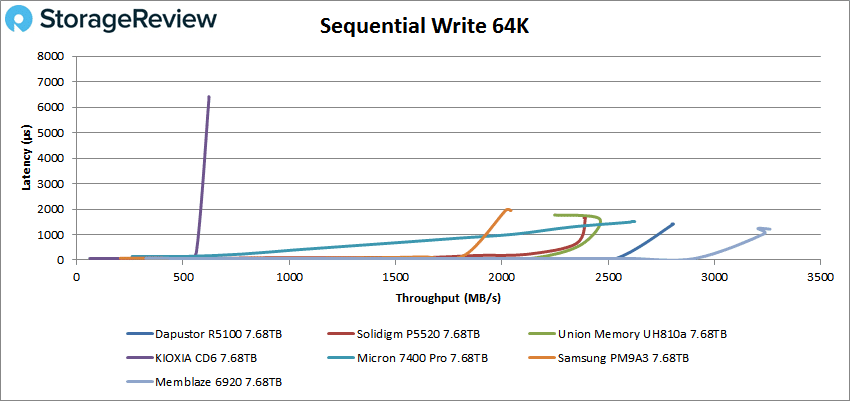
 The R5100 fell behind just a bit (to second place behind the Memblaze drive) in 64K write, peaking at 2.8GB/s (44,900 IOPS) with a latency of 1,413µs, placing third.
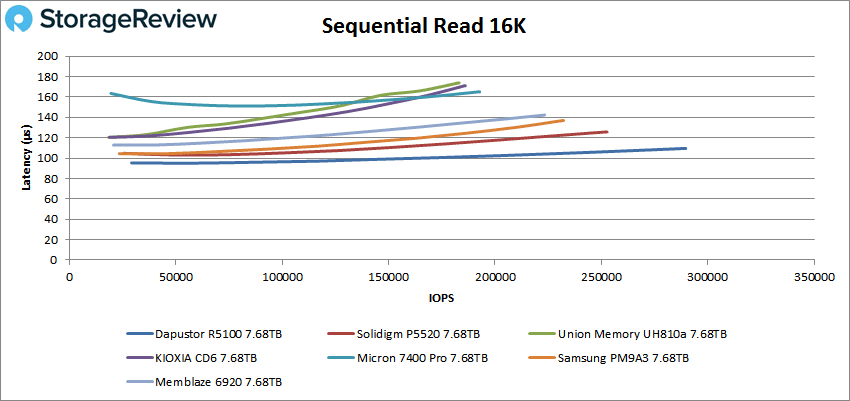
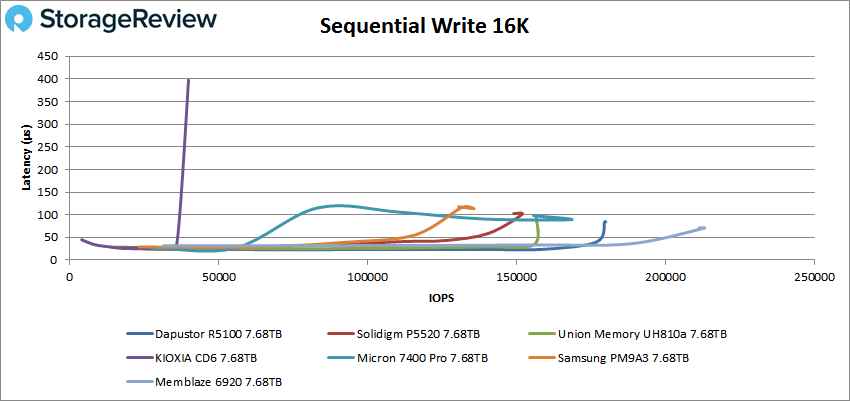
Next up is our 16K sequential performance. In reads, the R5100 posted a leading 4.53GB/s (290K IOPS) 109.5µs in latency.
The DapuStor drive fell back one place in 16K writes, peaking at just 2.81 GB/s (180K IOPS) with 85.4µs in latency.
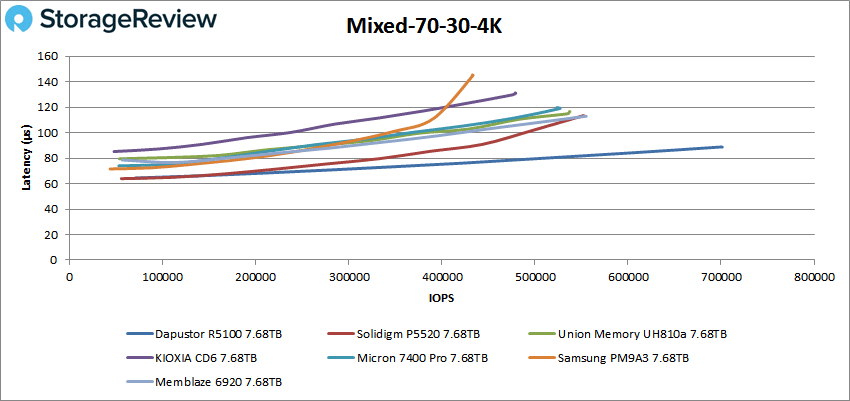
In our mixed 70/30 4k profile (70% read, 30% write), the R5100 had another impressive showing and was far better than its competition. It posted a peak of 701K IOPS at 88.7µs in latency.
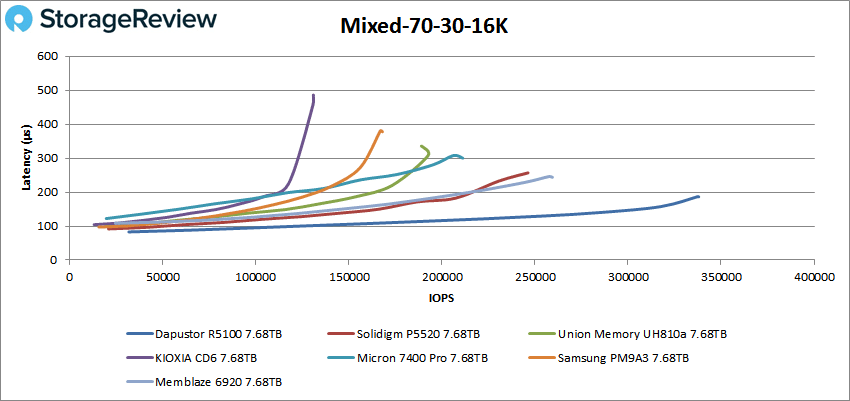
 In our mixed 70/30 16k profile, the R5100 again yielded impressive numbers with a peak of 338K IOPS at 186.3µs in latency. This was far ahead of the next best drive (Memblaze 6920).
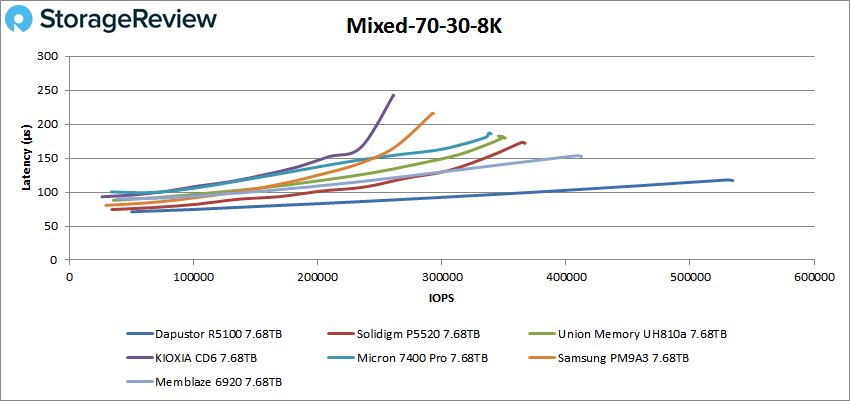
In our last mixed profile (70/30 8k), the R5100 peaked at a solid 534K IOPS with a latency of 117.1µs.
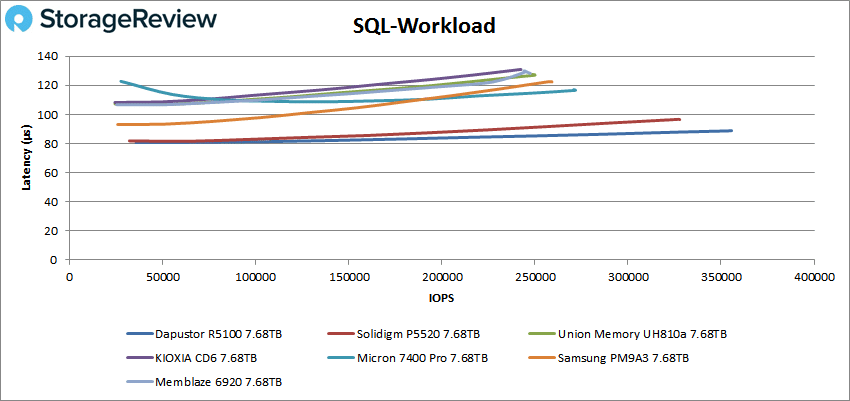
Our next set of tests is our SQL workloads: SQL, SQL 90-10, and SQL 80-20, all of which showed the DapuStor drive at the top of the leaderboard. Starting with SQL, the R5100 posted a peak performance of 355K IOPS with a latency of just 88.1µs.
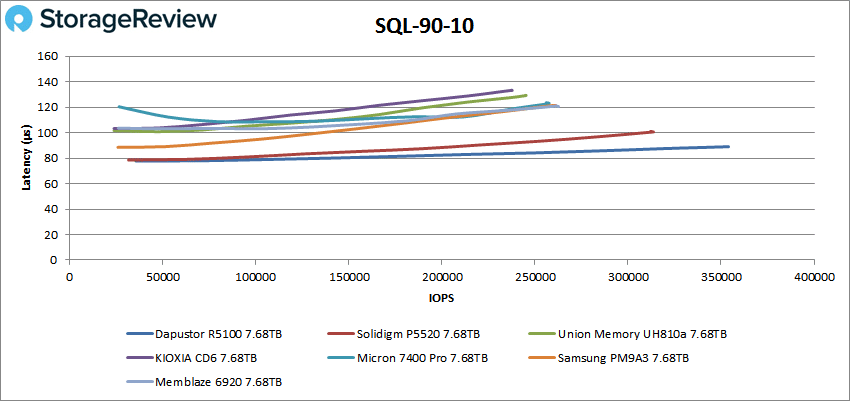
 In SQL 90-10, the R5100 peaked at an impressive 354K IOPS with a latency of 89µs.
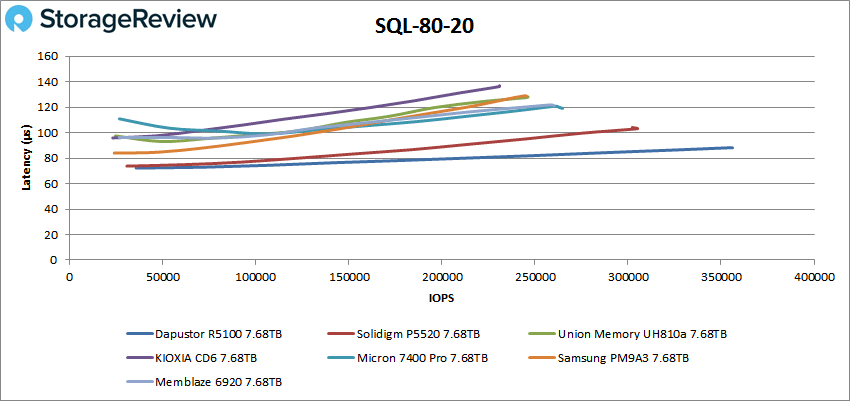
With SQL 80-20, the R5100 peaked at an impressive 356K IOPS with a latency of 88.8µs, again placing first.
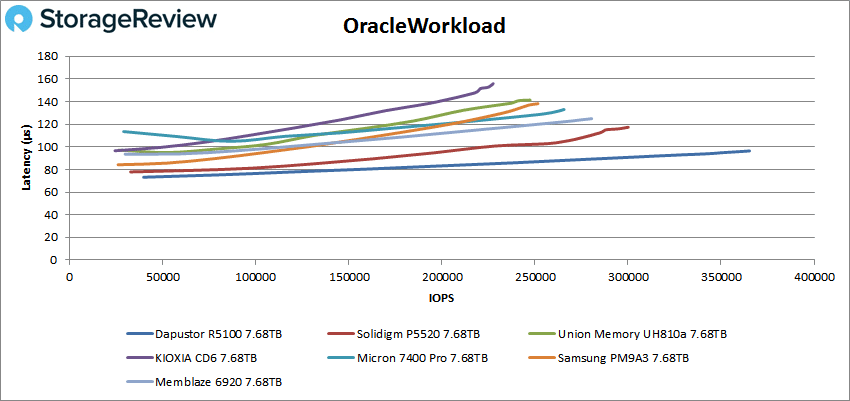
Next up are our Oracle workloads: Oracle, Oracle 90-10, and Oracle 80-20. As with the SQL benchmarks, the R5100 continued to take top spot in each test. Starting with the general Oracle workload, the R5100 had a peak performance of 365K IOPS at 96.4µs.
 Looking at Oracle 90-10, the R5100 posted a peak performance of 260K IOPS at 83.2µs.
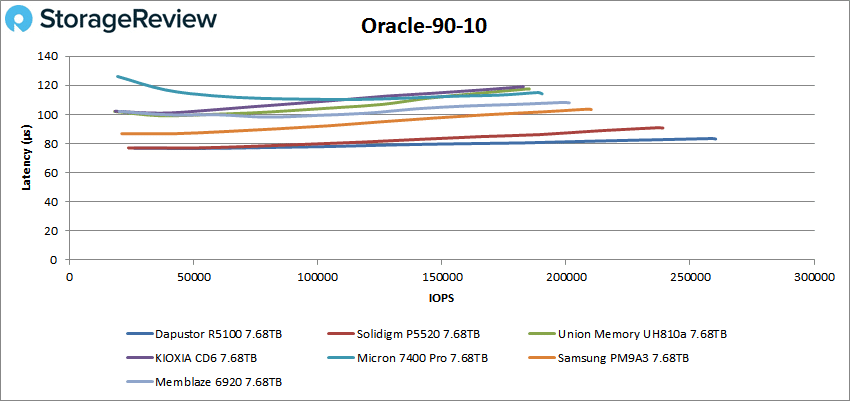
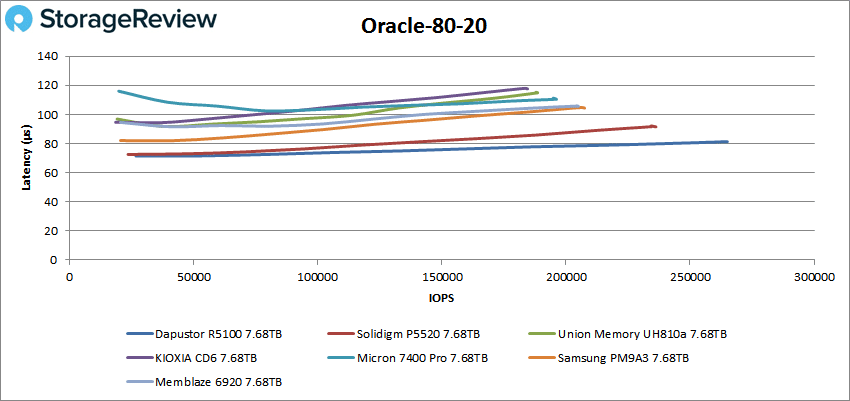
Next up is Oracle 80-20, where the R5100 peaked at 265K IOPS at 81.3µs.
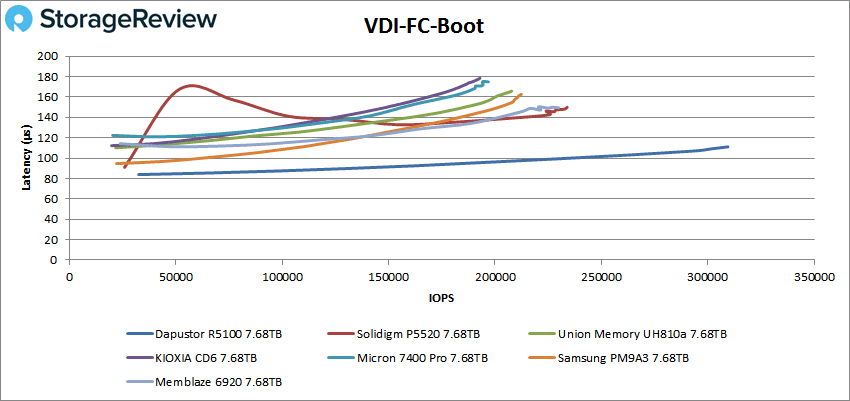
Next, we switched over to our VDI clone test, Full and Linked. For VDI Full Clone (FC) Boot, the R5100 continued its great performance, peaking at 309K IOPS with a latency of 111.2µs.
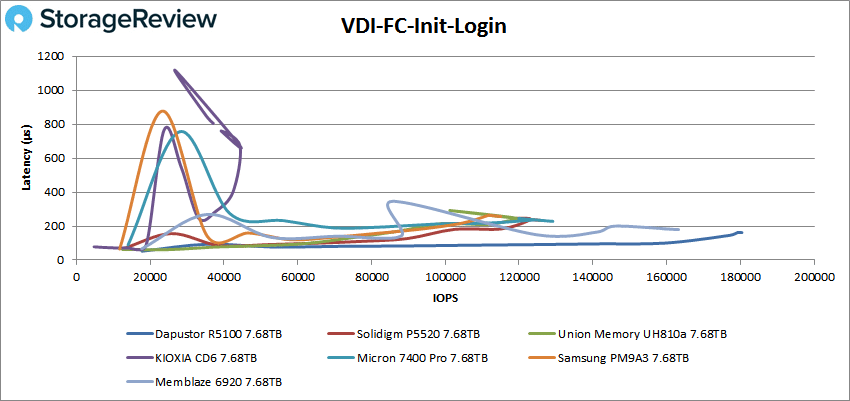
 Though it might be hard to see from the chart below, the R5100 was one of the more stable drives during VDI FC Initial Login, peaking at 180K IOPS with a latency of 162.1µs.
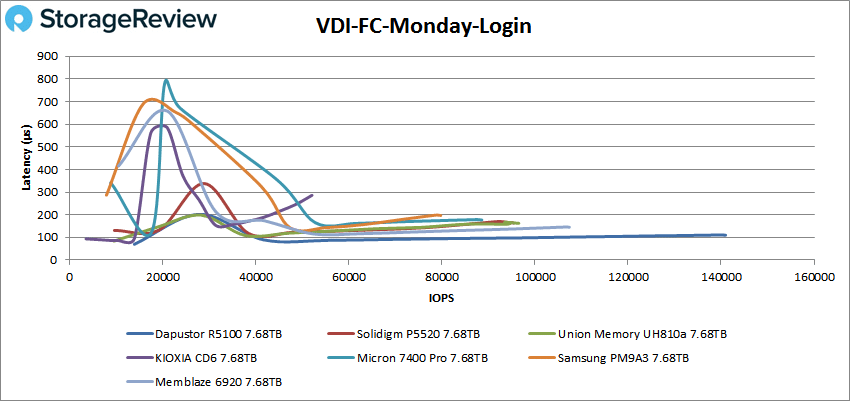
With VDI FC Monday Login, the DapuStor R5100 placed first again by a large margin, posting 141K IOPS at a latency of 110.2µs.
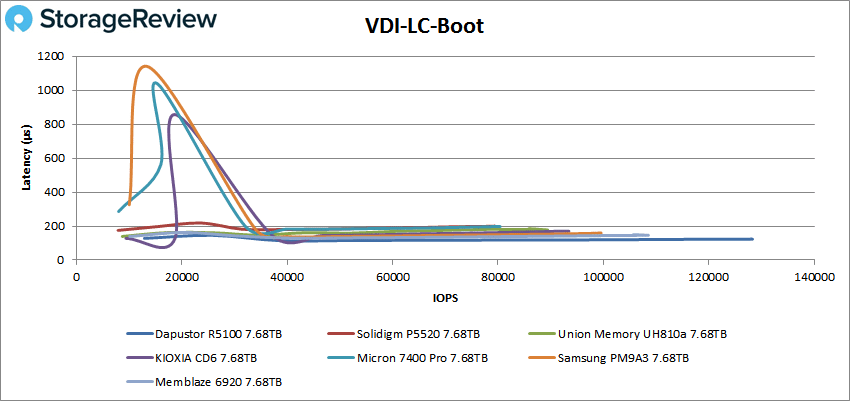
For VDI Linked Clone (LC) Boot, the R5100 continued its excellent, peaking at 128K IOPS with 123.6µs.
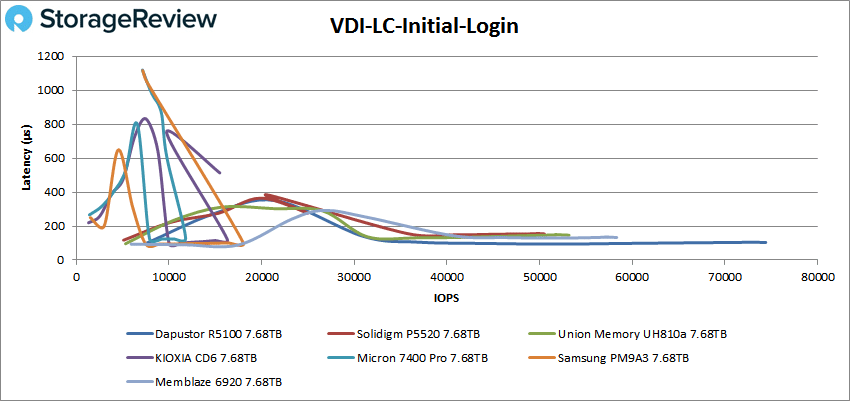
 In VDI LC Initial Login, the R5100’s peaked at 74K IOPS with 103.7µs for first place once again.
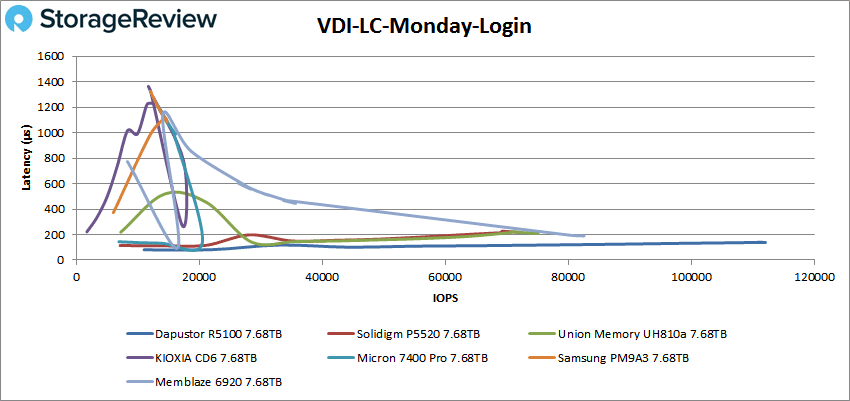
For VDI LC Monday Login, the R5100 peaked at 112K IOPS with a latency of 218.7µs, which was well beyond the next performing drive (Memblaze).
Conclusion
The DapuStor R5100 is a successful release by the company, to say the least. Available in capacities of 7.68TB and 15.36TB, the PCIe 4.0 enterprise SSD comes in the U.2 form factor and combines the DapuStor DPU600 controller firmware and KIOXIA’s latest 3D enterprise TLC NAND. It also features Flash Raid 2.0, advanced power loss protection (to safeguard user data against unexpected power loss), and nine levels of adjustable power consumption to help organizations optimize their TCO.
The R5100’s performance was where the drive really shined, as it was the top performer in virtually all of our benchmarks (and often by a noticeable margin). We tested the R5100 against six other PCIe Gen4 enterprise 7.68TB SSDs with similar specifications and applications: the Samsung PM9A3, Memblaze 6920, Union Memory UH810a, Solidigm P5520, KIOXIA CD6, and Micron 7400 Pro. We looked at both application workload analysis and VDBench workloads during our analysis.
In our first set of tests (SQL Server transactional benchmark), the R5100 posted great results across the board with 12,651 TPS and an average latency of 2.3ms. Looking at Sysbench, the DapuStor drive had aggregate scores of 10,880 TPS, 11.76ms in average latency, and 21.85ms in a worst-case scenario.
When switching over to VDBench, the R5100 showed even more impressive performance. Highlights include 1.76 million IOPS read and 695K IOPS write in our 4k workloads, while hitting 7.1GB/s in 64K read, 2.8GB/s in 64K write, 4.53GB/s read in 16K read, 2.81 GB/s in 16K writes, during our sequential workloads. Our mixed 70/30 profiles recorded 701K IOPS in 4K, 338K IOPS in 8K, and 534K IOPS in 16K.
In our SQL testing, the R5100 saw peaks of 355K IOPS, 354K IOPS in SQL 90-10, and 356K IOPS in SQL 80-20, leading the pack throughout. Oracle workloads told a similar story, recording 365K IOPS, 260K IOPS in Oracle 90-10, and 265K IOPS in Oracle 80-20.
Next up were our VDI Clone tests, Full and Linked. In Full Clone, we saw 309K IOPS in boot, 180K IOPS in Initial Login, and 141K IOPS in Monday Login. In Linked Clone, the DapuStor enterprise SSD recorded a peak of 128K IOPS in boot, 74K in Initial Login and a massive 112K IOPS in Monday Login.
It’s no surprise to us that the R5100 enterprise SSD was pretty much unbeatable during the vast majority of our tests, as DapuStor has a proven track record of releasing incredibly fast and quality drives. The R5100 is a great choice for pretty much any organization with larger data storage use cases that wants the best overall performance we’ve seen out of a PCIe Gen4 port.


 Amazon