

|
 Recently, we requested four of WD’s latest-revision Raptors to provide a reference comparison against which other enterprise-oriented SATA disks may be compared in Testbed4’s expanded multi-drive array coverage. The first order of business was to put a single drive to the test operating off of the machine’s standard SI3124-2 controller. As the results poured in, it became clear that significant performance differences exist between these drives, the “00FLC0” revision, and our former samples, the “00FLA1″s.
Four major versions of the product have made it into the channel: the original 00FLA0 (covered in SR’s initial review), the 00FLA1 (featured in our look at Raptor RAID performance and subsequently reassessed under Testbed4), the 00FLA2 (not tested by SR), and 00FLC0, the revision featured in this writeup.
Readers have filled the SR forums agonizing over the purchase of the venerable Raptor versus one of the new 400+ GB SATA disks that combine performance with monstrous capacity. To assist in solving this dilemma (or to add fuel to the fire), we have decided to take one last look at a drive destined to be a classic.
The following performance tests contrast the Raptor with these drives:
| Hitachi Deskstar 7K500 (500 GB) | Currently the fastest 7200 RPM Drive |
| Fujitsu MAT3300 (300 GB) | High-performance 10,000 RPM SCSI Drive |
| Maxtor Atlas 10K V (300 GB) | High-performance 10,000 RPM SCSI Drive |
| Western Digital Caviar SE16 WD4000KD (400 GB) | WD’s largest drive |
Access Time and Transfer RateFor diagnostic purposes only, StorageReview measures the following low-level parameters: Average Read Access Time– An average of 25,000 random read accesses of a single sector each conducted through IPEAK SPT’s AnalyzeDisk suite. The high sample size permits a much more accurate reading than most typical benchmarks deliver and provides an excellent figure with which one may contrast the claimed access time (claimed seek time + the drive spindle speed’s average rotational latency) provided by manufacturers. Average Write Access Time– An average of 25,000 random write accesses of a single sector each conducted through IPEAK SPT’s AnalyzeDisk suite. The high sample size permits a much more accurate reading than most typical benchmarks deliver. Due to differences in read and write head technology, seeks involving writes generally take more time than read accesses. |
WB99 Disk/Read Transfer Rate – Begin– The sequential transfer rate attained by the outermost zones in the hard disk. The figure typically represents the highest sustained transfer rate a drive delivers.
WB99 Disk/Read Transfer Rate – End– The sequential transfer rate attained by the innermost zones in the hard disk. The figure typically represents the lowest sustained transfer rate a drive delivers.
For more information, please click here.

| Some Perspective
It is important to remember that seek time and transfer rate measurements are mostly diagnostic in nature and not really measurements of “performance” per se. Assessing these two specs is quite similar to running a processor “benchmark” that confirms “yes, this processor really runs at 2.4 GHz and really does feature a 400 MHz FSB.” Many additional factors combine to yield aggregate high-level hard disk performance above and beyond these two easily measured yet largely irrelevant metrics. In the end, drives, like all other PC components, should be evaluated via application-level performance. Over the next few pages, this is exactly what we will do. Read on! |
Single-User PerformanceStorageReview uses the following tests to assess non-server use: StorageReview.com Office DriveMark 2006– A capture of VeriTest’s Business Winstone 2004 suite. Applications include Microsoft’s Office XP (Word, Excel, Access, Outlook, and Project), Internet Explorer 6.0, Symantec Antivirus 2002 and Winzip 9.0 executed in a lightly-multitasked manner. StorageReview.com High-End DriveMark 2006– A capture of VeriTest’s Multimedia Content Creation Winstone 2004 suite. Applications include Adobe Photoshop v7.01, Adobe Premiere v6.5, Macromedia Director MX v9.0, Macromedia Dreamweaver MX v6.1, Microsoft Windows Media Encoder 9.0, Newtek Lightwave 3D 7.5b, and Steinberg Wavelab 4.0f run in a lightly-multitasked manner. For more information, please click here. |


Gaming PerformanceThree decidedly different entertainment titles cover gaming performance in StorageReview’s test suite. FarCry, a first-person shooter, remains infamous for its lengthy map loads when switching levels. The Sims 2, though often referred to as a “people simulator,” is in its heart a strategy game and spends considerable time accessing the disk when loading houses and lots. Finally, World of Warcraft represents the testbed’s role-playing entry; it issues disk accesses when switching continents/dungeons as well as when loading new textures into RAM on the fly. For more information, please click here. |


Multi-User PerformanceUnlike single-user machines (whether a desktop or workstation), servers undergo highly random, non-localized access. StorageReview simulates these multi-user loads using IOMeter. The IOMeter File Server pattern balances a majority of reads and minority of writes spanning requests of varying sizes. IOMeter also facilitates user-configurable load levels by maintaining queue levels (outstanding I/Os) of a specified depth. Our tests start with the File Server pattern with a depth of 1 and double continuously until depth reaches 128 outstanding I/Os. Drives with any sort of command queuing abilities will always be tested with such features enabled. Unlike single-user patterns, multi-user loads always benefit when requests are reordered for more efficient retrieval. For more information click here. |

Despite boasting a faster access time than the older drive (7.7 ms vs. 8.1 ms), the 00FLC0 lags the 00FLA1 by margins of 11-14% under lighter depths. Both versions enjoy a large jump in performance when moving from 8 to 16 outstanding I/Os. From there, however, the 00FLC0 levels off more rapidly and trails the older revision all the way up to a depth of 128.
Noise and Power MeasurementsIdle Noise– The sound pressure emitted from a drive measured at a distance of 3 millimeters. The close-field measurement allows for increased resolution between drive sound pressures and eliminates interactions from outside environmental noise. Note that while the measurement is an A-weighted decibel score that weighs frequencies in proportion to human ear sensitivity, a low score does not necessarily predict whether or not a drive will exhibit a high-pitch whine that some may find intrusive. Conversely, a high score does not necessarily indicate that the drive exhibits an intrusive noise profile. Operating Power Dissipation– The power consumed by a drive, measured both while idle and when performing fully random seeks. In the relatively closed environment of a computer case, power dissipation correlates highly with drive temperature. The greater a drive’s power draw, the more significant its effect on the chassis’ internal temperature. |
Startup (Peak) Power Dissipation– The maximum power dissipated by a drive upon initial spin-up. This figure is relevant when a system features a large number of drives. Though most controllers feature logic that can stagger the spin-up of individual drives, peak power dissipation may nonetheless be of concern in very large arrays or in cases where a staggered start is not feasible. Generally speaking, drives hit peak power draw at different times on the 5V and 12V rails. The 12V peak usually occurs in the midst of initial spin-up. The 5V rail, however, usually hits maximum upon actuator initialization.
For more information, please click here.


ReliabilityThe StorageReview.com Reliability Survey aims to amalgamate individual reader experiences with various hard disks into a comprehensive warehouse of information from which meaningful results may be extracted. A multiple-layer filter sifts through collected data, silently omitting questionable results or results from questionable participants. A proprietary analysis engine then processes the qualified dataset. SR presents results to readers through a percentile ranking system.
According to filtered and analyzed data collected from participating StorageReview.com readers, the |
According to filtered and analyzed data collected from participating StorageReview.com readers, a predecessor of the
Western Digital Raptor WD740GD, the
Western Digital Raptor WD360GD
, is more reliable than
of the other drives in the survey that meet a certain minimum floor of participation.
Note that the percentages in bold above may change as more information continues to be collected and analyzed. For more information, to input your experience with these and/or other drives, and to view comprehensive results, please visit the SR Drive Reliability Survey.
ConclusionIn the end, the 00FLC0 revision of the Raptor WD740GD appears to have sacrificed a small amount of its multi-user prowess to effect some slightly larger single-user performance gains. The most significant advances occur in the Office and High-End DriveMarks, where the newer version’s 12-14% improvement yields a tangible and pleasing “snap” to operations. These gains allow the Raptor to close the gap that was starting to appear between WD’s venerable 10K RPM unit and today’s state-of-the-art 7200 RPM offerings. Smaller advances dot our gaming tests. There, however, the Raptor was already holding its own… the 00FLC0 gives the WD740GD even more breathing room. |
Comparing the Raptor against behemoths such as Hitachi’s Deskstar 7K500 and WD’s own Caviar WD4000KD yields an interesting dichotomy. At the time of this writing, the Raptor can be had for as little as $160 while the biggest 7200 RPM units can run upwards of $400. As a result, it is ironically the 10,000 RPM drive that represents the affordable performance solution while the larger, more expensive 7200 RPM units satisfy those looking for both speed and capacity.
WD estimates that it has shipped about half its Raptors into the enterprise and the other half into channels that funnel the product to end-users. Perhaps these small tweaks represent the firm’s nod towards avid enthusiasts that have contributed to the family’s success.
It is important to note that when one purchases the WD740GD from a retailer, he or she purchases just that- resellers certainly are not deploying different SKUs to differentiate a single product’s varying firmware versions. Our advice? Don’t sweat it. When purchasing the Raptor, just rest assured that no matter what revision you receive, you’re getting a time-tested unit that still delivers some of the best single-user/gaming performance around.


 Amazon
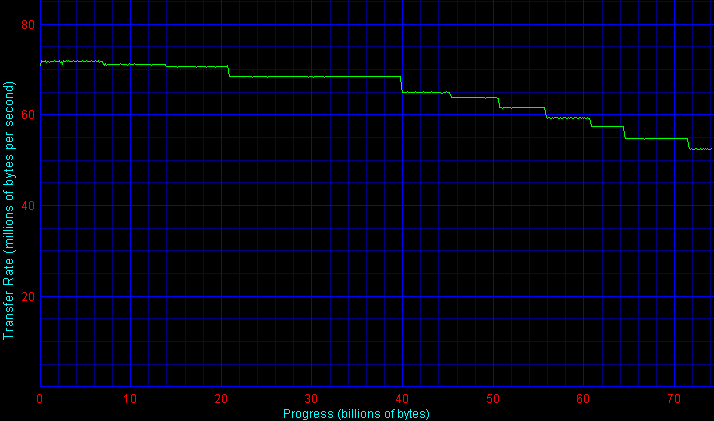