

The ASUS NUC 16 Pro moves the NUC Pro line from a 4×4-inch footprint to 5×4 inches, and ASUS spends the extra inch on a second M.2 slot, a second 2.5GbE port, and a cooling stack of two exhaust fans, a dedicated DIMM fan, and three heat pipes. Our review unit pairs the Intel Core Ultra X7 358H, which ASUS rates at a 65W configurable TDP in this chassis, with 64GB of LPDDR5X-8533, Arc B390 graphics, and a 1TB Samsung PM9E1 Gen5 SSD, all in 0.71 liters.
That 358H is the same Panther Lake part we reviewed in the Lenovo Yoga Mini earlier this month, so this review doubles as a test of what the chip does with a larger box, a bigger power budget, and twice the memory. ASUS sells the system as an edge and business desktop first, with dual LAN for network isolation, fTPM 2.0, a Kensington slot, a VESA bracket in the box, and a three-year warranty, and the Copilot+ badge comes from the 50 TOPS NPU. We ran it through the client suite we use for compact systems.
Specyfikacja ASUS NUC 16 Pro
| Specyfikacja | ASUS NUC 16 Pro (as tested) |
|---|---|
| Omówienie platformy | |
| Procesor | Intel Core Ultra X7 358H (Series 3), cTDP 65W per ASUS 16 rdzeni (4 rdzenie P, 8 rdzeni E, 4 rdzenie LPE), 16 wątków Rdzeń P 1.9 GHz, baza do 4.8 GHz Inteligentna pamięć podręczna Intel 18 MB |
| Grafika | Procesor graficzny Intel Arc B390 (zintegrowany, pamięć współdzielona) 12 Xe cores, 8 ray-tracing units Do 122 TOPS |
| NPU | Intel NPU 5, up to 50 TOPS Drugi pilot+ komputer |
| Pamięć | 64GB LPDDR5X-8533 (onboard, as tested) ASUS also lists 32GB LPDDR5X and DDR5-5600 SO-DIMM configurations, up to 128GB with 2 x 64GB CSO-DIMMs |
| Dyski | 1TB M.2 2280 PCIe Gen5 NVMe SSD (Samsung PM9E1, MZVLC1T0HFLU, as tested) Two M.2 2280 slots (one PCIe 5.0 x4, one PCIe 4.0 x4), 128GB to 8TB each |
| System operacyjny | Windows 11 Pro (komputer Copilot+) |
| Łączność | |
| Porty czołowe | 1x USB-C 10Gbps (USB 3.2 Gen 2×1) 2x USB-A 10Gbps (USB 3.2 Gen 2) Kensington lock slot (side) |
| Tylne porty | 2x Thunderbolt 4 (USB-C) with DisplayPort 2.1 2x USB-A 10Gbps (USB 3.2 Gen 2) 2x HDMI 2.1 (TMDS compatible) 2x 2.5GbE (RJ-45) DC-in |
| Audio | Digital audio over HDMI and Thunderbolt only; no analog jack |
| Wyświetl wsparcie | Up to four 4K displays or two 8K displays (ASUS) |
| Sieci | Dual Intel I226-V 2.5GbE controllers |
| Bezprzewodowy | Intel Wi-Fi 7 BE211 (Gig+) Bluetooth 6.0 |
| Projekt i moc | |
| Wymiary (szer x gł x wys) | 144 x 117 x 42mm (5.67 x 4.61 x 1.65 cali) |
| objętość | 0.71 litrów |
| Waga | 0.75kg (1.65 lb) for the LPDDR5X configuration |
| Chłodzenie | Dual-exhaust CPU fans, dedicated DIMM fan, three heat pipes, fin arrays on both sides (ASUS) |
| Zasilacz laboratoryjny | 150W external adapter (19.5V, 7.7A) as tested; ASUS lists a 120W adapter on lower configurations |
| Ochrona | Oprogramowanie układowe TPM 2.0 Gniazdo blokady Kensington |
| W pudełku | AC adapter and power cord, VESA bracket and screws, cable clip |
| Gwarancja | 3 roku |
| Cena | $2,699 (B&H, RNUC16GDKX76C4NU with 32GB LPDDR5X and a 1TB Gen4 SSD); the 64GB configuration we tested is not listed at US retailers at the time of writing |
Budowa i projektowanie
At 144 x 117 x 42mm, the NUC 16 Pro is a black rectangle with the NUC logo on the lid, 0.75kg in the LPDDR5X configuration, and a hair larger than the 0.65-liter Yoga Mini and the 0.7-liter Ascent QN10. ASUS says the move from 4×4 to 5×4 bought thermal headroom and room for the second SSD and second LAN port, and the same chassis is rated to carry the 65W Core Ultra X9 388H at the top of the range.

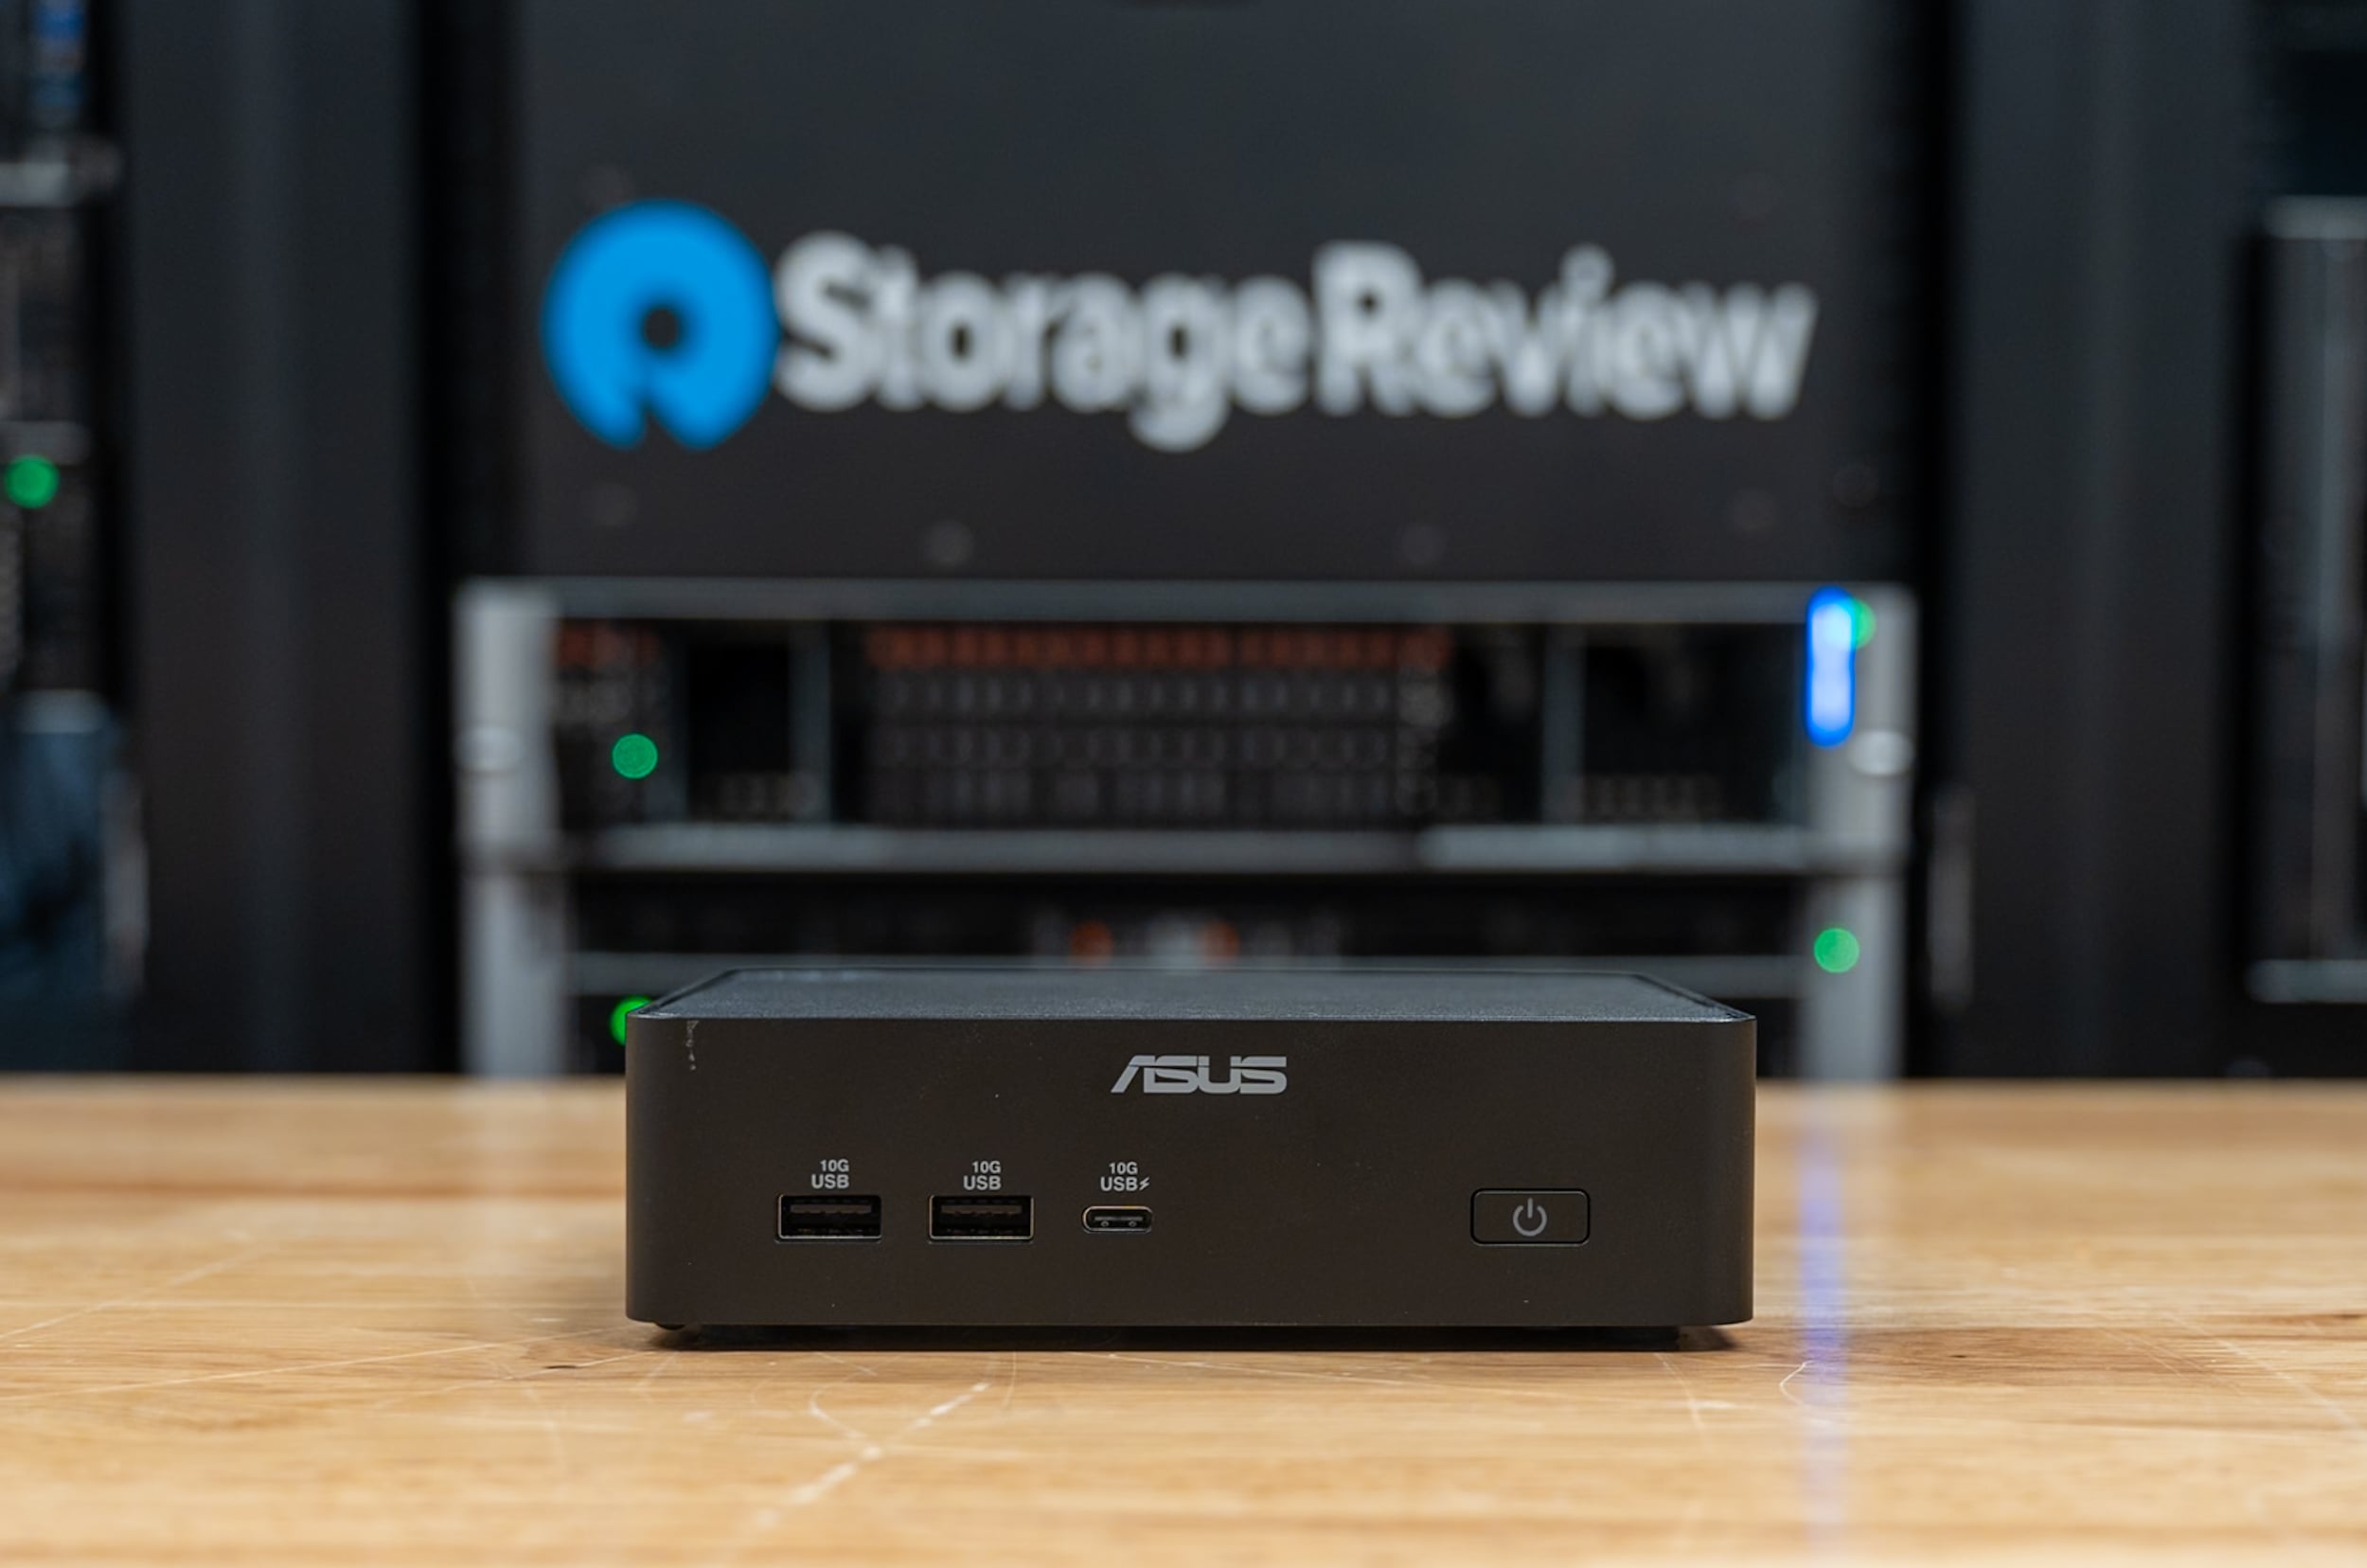
The front carries the ASUS branding with one USB-C port at 10Gbps and two USB-A ports at the same speed, with the Kensington slot on the side. There is no headphone jack on the system; ASUS lists audio as digital only, over HDMI and Thunderbolt, which suits a signage or kiosk deployment and will annoy anyone who wants to plug in a headset without a USB dongle or a dock.


Across the back are two Thunderbolt 4 ports carrying DisplayPort 2.1, two more USB-A 10Gbps ports, two HDMI 2.1 outputs, two 2.5GbE jacks on Intel I226-V controllers, and the DC barrel input. Both HDMI ports and both Thunderbolt ports drive displays. ASUS rates the system for four 4K monitors or two 8K panels. Wireless is Intel’s Wi-Fi 7 BE211 card with Bluetooth 6.0. Power comes from an external brick; our unit is rated for 19.5V at 7.7A and ships with the 150W adapter, and ASUS lists a 120W adapter on lower configurations.
The dual 2.5GbE ports are the feature that separates this box from the consumer mini PCs it will be cross-shopped against. ASUS pitches them for network redundancy and for isolating a point-of-sale or control network from a management network on the same box, and the pairing of two Intel I226-V controllers means both ports behave the same under Windows and Linux. The Yoga Mini and the QN10 each offer a single 2.5GbE port.

ASUS includes a VESA bracket and screws, and the overview materials describe the cooling as two exhaust fans for the CPU, a third fan dedicated to the memory, three heat pipes, and fin arrays on both sides of the chassis. We did not measure acoustics for this review, but the thermal design is the reason the 358H runs at a 65W cTDP here against the lower limits a laptop or a USB-C-powered puck can sustain, and the performance sections below show where that shows up.
Możliwość serwisowania i modernizacji

ASUS calls the chassis design Tool-less 2.0, with a lever that releases the cover for access to storage and memory. Inside are two M.2 2280 slots, one wired to PCIe 5.0 x4 and one to PCIe 4.0 x4, each rated for drives up to 8TB; our unit ships with the 1TB Samsung PM9E1 in the Gen5 slot.

Memory is the one thing a buyer should decide at purchase. Our configuration carries 64GB of LPDDR5X-8533 soldered to the board, which is what gives this system twice the Yoga Mini’s capacity at the same speed, and the board carries no SO-DIMM sockets, so there is no path to more. ASUS sells separate SO-DIMM configurations that take two DDR5 modules up to 128GB for buyers who want to expand later.
Wydajność ASUS NUC 16 Pro
Our ASUS NUC 16 Pro review unit runs the Intel Core Ultra X7 358H with Arc B390 integrated graphics, 64GB of LPDDR5X-8533, a 1TB Samsung PM9E1 PCIe Gen5 SSD, and Windows 11 Pro. All benchmarks were run on the Best Performance power plan.
Najbardziej użytecznym porównaniem jest Lenovo Yoga Mini, which carries the same Core Ultra X7 358H and Arc B390 in a 0.65-liter aluminum puck with 32GB of LPDDR5X-8533 and a Gen4 SSD, and which we ran on the identical suite. Any gap between the two is chassis, power limit, and memory, since the silicon is the same. The ASUS ExpertCenter PN55 is ASUS’s own AMD alternative, a Ryzen AI 7 450 with Radeon 860M graphics, 48GB of DDR5-5600, and a Gen4 SSD, tested in the same week.
ASUS NUC 14 Pro is the Core Ultra 7 165H system from two generations back, before the Arrow Lake NUC 15 Pro, and the ASUS Ascent QN10 is the Snapdragon X2 Elite mini PC at the same volume, and both appear in the tables where we have comparable results. If we did not run a system on a benchmark, it is left out of that table, and a partial run is marked N/A.
PCMark 10
PCMark 10 is UL Solutions’ general-purpose productivity benchmark. It measures app start times, web browsing, and video conferencing in the Essentials group; spreadsheets and document editing in Productivity; and photo editing, rendering and visualization, and video editing in Digital Content Creation, and rolls the three into an overall score.
| PCMark 10 (im wyższy wynik, tym lepiej) | ASUS NUC 16 Pro | Lenovo Yoga Mini | ASUS ExpertCenter PN55 |
|---|---|---|---|
| Ogólna ocena | 9,513 | 10,369 | 8,385 |
| Niezbędniki | 11,318 | 11,965 | 11,036 |
| System | 14,781 | 20,073 | 14,669 |
| Tworzenie treści cyfrowych | 13,963 | 12,597 | 9,882 |
The NUC 16 Pro posts 9,513 overall, 13% ahead of the PN55 at 8,385 and 8% behind the Yoga Mini at 10,369. The split is unusual for two systems on the same chip. The NUC leads Digital Content Creation by 11% at 13,963 against 12,597, where its photo editing subscore of 25,934 does the work, but it trails the Yoga Mini by 26% in Productivity, 14,781 against 20,073, and by 5% in Essentials.
We did not isolate the cause of the Productivity gap. The group runs the Writing and Spreadsheets workloads in LibreOffice, and the NUC’s subscores of 11,745 and 18,604 are in line with the PN55’s 11,619 and 18,520, so the two ASUS systems agree with each other, and the Yoga Mini is the outlier on the high side. Against the PN55, the NUC’s Digital Content Creation lead is 41%, almost all of it from the Arc B390 in the photo editing and rendering tests.
Geekbench 7
Geekbench 7 runs short workloads modeled on real applications, including file compression, HTML5 and PDF rendering, photo filtering, ray tracing, and machine learning inference, and produces single-core and multi-core CPU scores. The GPU compute tests run image processing, particle physics, and machine learning kernels through OpenCL and Vulkan, which makes them a useful look at how much general-purpose compute an integrated GPU can offer outside of games. Geekbench runs natively on Arm and x86, so the Snapdragon-based QN10 compares directly here.
| Geekbench 7 (im wyższy wynik, tym lepiej) | ASUS NUC 16 Pro (Arc B390) | Lenovo Yoga Mini (Arc B390) | ASUS ExpertCenter PN55 (Radeon 860M) | ASUS NUC 14 Pro (Arc) | ASUS Ascent QN10 (Adreno) |
|---|---|---|---|---|---|
| Procesor jednordzeniowy | 2,618 | 2,583 | 2,657 | 2,291 | 3,272 |
| Procesor wielordzeniowy | 18,388 | 16,811 | 15,311 | 13,911 | 24,049 |
| GPU OpenCL | 55,273 | 51,571 | 25,199 | 27,790 | 30,982 |
| GPU Vulkan | 46,894 | 44,450 | 13,022 | 25,088 | 40,042 |
Single-core is a wash across the x86 systems: the NUC 16 Pro at 2,618, the Yoga Mini at 2,583, and the PN55 at 2,657 are within 3% of each other, and all trail the QN10’s 3,272. Multi-core is where the NUC’s power budget shows. Its 18,388 is 9% ahead of the Yoga Mini on the same chip, 20% ahead of the PN55, and 32% ahead of the NUC 14 Pro, though the 18-core QN10 still leads by 31% at 24,049.
The GPU compute results favor the Arc B390 by a wide margin. OpenCL at 55,273 is 7% ahead of the Yoga Mini, 78% ahead of the QN10’s Adreno, and more than double the PN55’s Radeon 860M at 25,199 and the NUC 14 Pro’s older Arc at 27,790. Vulkan at 46,894 is 5% ahead of the Yoga Mini, 17% ahead of the QN10, and 3.6x the PN55’s 13,022, which is the largest gap in the table and the first sign of how far apart the two ASUS integrated GPUs are.
Cinebench 2026
Cinebench 2026 is built on Maxon’s Redshift engine and renders a complex scene on the CPU. The single-thread test isolates per-core throughput, the multi-thread test loads every core for the length of the run and rewards systems that hold clocks across the whole package, and the MP ratio divides one by the other to show how well a system scales. The 358H has no SMT, so single-thread equals single core on the Intel systems; the PN55 also reported a single-core score of 661 with SMT active, which we leave out so the row compares like with like.
| Cinebench 2026 (im wyższy wynik, tym lepiej) | ASUS NUC 16 Pro | Lenovo Yoga Mini | ASUS ExpertCenter PN55 | ASUS NUC 14 Pro | ASUS Ascent QN10 |
|---|---|---|---|---|---|
| Pojedynczy wątek procesora | 508 | 509 | 489 | 444 | 639 |
| Wiele wątków procesora | 4,741 | 4,473 | 3,861 | 3,684 | 6,476 |
| Współczynnik MP | 9.34x | 8.79x | 7.89x | 8.30x | 10.13x |
Single-thread lands at 508, matching the Yoga Mini’s 509 and ahead of the PN55 at 489 and the NUC 14 Pro at 444, with the QN10 well clear at 639. Multi-thread is the result that justifies the chassis: 4,741 is 6% ahead of the Yoga Mini, 23% ahead of the PN55, and 29% ahead of the NUC 14 Pro, and the 9.34x scaling ratio is the best of the x86 systems, against 8.79x for the Yoga Mini and 7.89x for the PN55. The QN10 remains 37% ahead at 6,476 on its 18 Oryon cores.
Profil procesora 3DMark
The 3DMark CPU Profile benchmark runs the same physics and simulation workload at six thread counts, from one thread to the maximum the processor supports. Reading across shows how a processor scales as cores are engaged and where it stops gaining from additional threads, which predicts behavior in applications that fall between purely single-threaded and fully parallel.
| Profil procesora 3DMark (wyższy jest lepszy) | ASUS NUC 16 Pro | Lenovo Yoga Mini | ASUS ExpertCenter PN55 | ASUS NUC 14 Pro | ASUS Ascent QN10 |
|---|---|---|---|---|---|
| Maksymalna liczba wątków | 10,380 | 9,004 | 8,093 | 7,680 | 9,544 |
| Wątki 16 | 10,388 | 8,929 | 8,094 | 6,899 | 9,118 |
| Wątki 8 | 6,642 | 6,185 | 6,842 | 5,617 | 5,327 |
| Wątki 4 | 4,357 | 4,184 | 4,496 | 3,582 | 3,209 |
| Wątki 2 | 2,304 | 2,244 | 2,315 | 1,914 | 1,702 |
| Temat 1 | 1,176 | 1,159 | 1,178 | 1,002 | 857 |
At one, two, and four threads, the three x86 mini PCs are within 3% of each other, with the PN55 slightly ahead at 1,178, 2,315, and 4,496, and the PN55 keeps a 3% edge at eight threads as well. The NUC 16 Pro pulls away once all 16 threads are loaded: 10,388 at 16 threads and 10,380 at max is 15% ahead of the Yoga Mini, 28% ahead of the PN55, 35% ahead of the NUC 14 Pro, and 9% ahead of the QN10, which had led every Intel system in this test until now. The flat line from 16 threads to max threads is expected on a 16-thread part.
Kompresja 7-Zip
The 7-Zip benchmark uses the built-in test in the open-source archiver to measure compression and decompression throughput in GIPS. Compression is sensitive to memory latency and cache behavior, while decompression scales more directly with core count and clock speed, and the test loads cores, cache, and memory together the way real archiving does. The NUC 14 Pro was not run in this test.
| 7-Zip 24.09 (GIPS, im wyższa wartość, tym lepiej) | ASUS NUC 16 Pro | Lenovo Yoga Mini | ASUS ExpertCenter PN55 | ASUS Ascent QN10 |
|---|---|---|---|---|
| Ściskanie | 95.224 | 93.603 | 88.176 | 96.729 |
| Dekompresja | 91.939 | 81.927 | 94.485 | 120.205 |
| Ocena całkowita | 93.581 | 87.765 | 91.331 | 108.467 |
The NUC 16 Pro posts 95.224 GIPS compressing and 91.939 decompressing for a 93.581 total, 7% ahead of the Yoga Mini and 2% ahead of the PN55. The pattern inside the total is different on each: the Yoga Mini trails on decompression by 12%, which is the multi-core side of the test, while the PN55 leads the NUC on decompression at 94.485 and gives it back on compression at 88.176. The QN10’s 120.205 decompression rate carries it to a 108.467 total, 16% ahead of the NUC.
y-cruncher
y-cruncher is a multithreaded program that computes the digits of Pi and other constants. It is a demanding test of CPU throughput and memory bandwidth, since the larger digit counts stream large working sets through the memory subsystem. We run the standard Pi computation at 1 billion, 2.5 billion, and 5 billion digits, along with the BBP digit-extraction formula at 1, 10, and 100 billion, and report elapsed seconds, so lower is better. The 5 billion digit run needs more memory than the 32GB Yoga Mini and the QN10 had available, so only the two 64GB ASUS systems show it.
| y-cruncher (sekundy, im mniej tym lepiej) | ASUS NUC 16 Pro | Lenovo Yoga Mini | ASUS ExpertCenter PN55 | ASUS NUC 14 Pro | ASUS Ascent QN10 |
|---|---|---|---|---|---|
| Pi 1B | 27.823 | 28.755 | 26.037 | 36.561 | 71.531 |
| Pi 2.5B | 77.812 | 80.831 | 73.749 | N / A | 218.332 |
| Pi 5B | 174.318 | N / A | 166.959 | N / A | N / A |
| Pi BBP 1B | 1.665 | 1.799 | 1.849 | 2.306 | 5.844 |
| Pi BBP 10B | 18.173 | 19.580 | 16.350 | 25.144 | 67.701 |
| Pi BBP 100B | 213.223 | 223.731 | 183.800 | 296.970 | 778.722 |
y-cruncher is the PN55’s best test of the suite, because the Ryzen AI 7 450 finishes 1 billion digits in 26.037 seconds against 27.823 for the NUC 16 Pro, 6% faster, and holds a 4% edge at 5 billion digits, 166.959 against 174.318. On the BBP runs the gap grows to 14% at 100 billion, 183.800 against 213.223, which points at the AMD part’s memory path on the long, streaming workload. The NUC still beats the Yoga Mini on every row by 3% to 5%, and it is 31% faster than the NUC 14 Pro at 1 billion digits.
Blender 5.2
Blender’s benchmark renders three standard scenes, Monster, Junkshop, and Classroom, with the Cycles engine. We run it on the CPU and on the GPU and report samples per minute, so higher is better. The Intel systems render on the GPU through oneAPI and the PN55 through AMD’s HIP backend; the QN10 has no Blender GPU path, and the NUC 14 Pro ran on the CPU only.
| Blender 5.2 (próbek/min, im wyższa tym lepiej) | ASUS NUC 16 Pro (Arc B390, oneAPI) | Lenovo Yoga Mini (Arc B390, oneAPI) | ASUS ExpertCenter PN55 (Radeon 860M, HIP) | ASUS NUC 14 Pro | ASUS Ascent QN10 |
|---|---|---|---|---|---|
| GPU | |||||
| Potwór | 559.84 | 544.64 | 96.50 | N / A | N / A |
| Sklep ze złomem | 468.21 | 372.30 | 85.91 | N / A | N / A |
| Sala szkoleniowa | 418.02 | 393.19 | 68.76 | N / A | N / A |
| CPU | |||||
| Potwór | 131.83 | 122.87 | 110.15 | 109.16 | 188.04 |
| Sklep ze złomem | 97.69 | 89.19 | 84.30 | 81.08 | 133.21 |
| Sala szkoleniowa | 68.94 | 63.34 | 61.65 | 57.41 | 93.93 |
On the GPU, the NUC 16 Pro’s 559.84 samples per minute on Monster is 3% ahead of the Yoga Mini, and the gap opens to 26% on the memory-hungry Junkshop scene, 468.21 against 372.30, where the Yoga Mini also fell behind the Dell laptop with the same GPU in its own review. The PN55’s HIP path is a different class of result: 96.50, 85.91, and 68.76 samples per minute put the Arc B390 at 5.5x to 6.1x the Radeon 860M, and the PN55’s GPU renders Monster slower than its own CPU does.
On the CPU, the NUC leads the Yoga Mini by 7% to 10% across the three scenes and the PN55 and NUC 14 Pro by about 20% on Monster. The QN10 is the CPU rendering leader at 188.04, 133.21, and 93.93 samples per minute, 43% ahead of the NUC on Monster, down from the roughly 50% the Snapdragon part held over the Yoga Mini.
LuxMark
LuxMark is an OpenCL benchmark built on the LuxCoreRender physically based engine. It renders the Food and Hall scenes on the GPU and reports a score based on samples per second, and because it uses OpenCL and no vendor-specific API, it is a fair measure of how an integrated GPU handles compute-heavy rendering outside a game engine.
| LuxMark v4 (im wyższy tym lepszy) | ASUS NUC 16 Pro | Lenovo Yoga Mini | ASUS ExpertCenter PN55 |
|---|---|---|---|
| Hall | 3,518 | 3,430 | 1,917 |
| Jedzenie | 1,704 | 1,663 | 869 |
The NUC 16 Pro scores 3,518 on Hall and 1,704 on Food, 2% to 3% ahead of the Yoga Mini’s 3,430 and 1,663, which is the margin two systems with the same GPU should show when the heavier box has a little more thermal room. The PN55 lands at 1,917 and 869, so the Arc B390 holds a 1.8x to 2x lead over the Radeon 860M in OpenCL rendering, consistent with the Geekbench OpenCL result.
V-Ray
The V-Ray benchmark from Chaos measures rendering throughput in the V-Ray engine; the CPU test reports vsamples. It is a short, intense render that favors sustained clocks. We ran the CPU test on all three systems; the GPU test was not run on the two ASUS units.
| V-Ray (im wyżej tym lepiej) | ASUS NUC 16 Pro | Lenovo Yoga Mini | ASUS ExpertCenter PN55 |
|---|---|---|---|
| Procesor (vsamples) | 21,073 | 19,450 | 18,550 |
At 21,073 vsamples, the NUC 16 Pro is 8% ahead of the Yoga Mini’s 19,450 and 14% ahead of the PN55’s 18,550, in line with the Cinebench multi-thread spread between the same three systems.
Test prędkości Blackmagic RAW
The Blackmagic RAW Speed Test decodes 8K Blackmagic RAW footage at a 12:1 compression ratio and reports frames per second on the CPU and on the GPU. It is a direct look at how a system handles the camera footage video editors work with, and one of the tests where integrated graphics can take real work off the CPU.
| Test prędkości Blackmagic RAW (fps, im więcej tym lepiej) | ASUS NUC 16 Pro | Lenovo Yoga Mini | ASUS ExpertCenter PN55 |
|---|---|---|---|
| Procesor 8K 12:1 | 76 | 67 | 65 |
| Procesor graficzny 8K 12:1 | 83 | 81 | 43 |
The NUC 16 Pro decodes at 76 frames per second on the CPU and 83 on the GPU, 13% and 2% ahead of the Yoga Mini. The PN55 matches on the CPU side at 65 frames per second but drops to 43 on the GPU, so the AMD system is the only one of the three where the OpenCL path is slower than the CPU path.
Sztuczna inteligencja wideo Topaz
Topaz Video AI is a widely used application for AI-based video upscaling, denoising, and frame interpolation. We run its built-in benchmark at 1080p input, which times each Topaz model at 1X, 2X, and 4X scaling along with the Apollo and Aion slow-motion models, and reports frames per second. The models rely on the GPU and, where supported, the NPU, and the test reflects a commercial application people pay for. The 16X Aion model did not finish on either Intel system.
| Topaz Video AI (fps, im więcej tym lepiej) | ASUS NUC 16 Pro | Lenovo Yoga Mini | ASUS ExpertCenter PN55 |
|---|---|---|---|
| Artemida 1X / 2X / 4X | 6.15 / 5.13 / 1.87 | 5.89 / 5.19 / 1.87 | 2.64 / 1.72 / 0.58 |
| Irys 1X / 2X / 4X | 5.14 / 3.11 / 0.95 | 4.84 / 2.97 / 0.90 | 3.32 / 1.92 / 0.60 |
| Proteus 1X / 2X / 4X | 6.46 / 6.09 / 2.48 | 6.04 / 5.94 / 2.42 | 2.87 / 2.01 / 0.78 |
| Gaia 1X / 2X / 4X | 3.34 / 2.26 / 1.49 | 3.18 / 2.15 / 1.45 | 1.09 / 0.72 / 0.53 |
| Nyx 1X / 2X | 1.58 / 1.53 | 1.50 / 1.46 | 1.28 / 1.08 |
| Hyperion HDR 1X | 3.16 | 3.06 | 10.35 |
| 4X Slowmo Apollo / APFast | 8.82 / 25.48 | 8.08 / 22.91 | 3.77 / 13.46 |
| 16X zwolnione tempo Aion | DNF | DNF | 8.80 |
The NUC 16 Pro runs 4% to 7% ahead of the Yoga Mini on the 1X passes: 6.15 against 5.89 frames per second on Artemis and 6.46 against 6.04 on Proteus, and 11% ahead on the APFast slow-motion model, which again reads as the same GPU with a little more headroom. The 4X passes stay below 2.5 frames per second on both Intel systems, so this remains a 1X and 2X box for Topaz work.
The PN55 runs at less than half the NUC’s rate on the upscaling models: 2.64 frames per second on Artemis 1X and 2.87 on Proteus 1X, and about 40% of its rate on Apollo. Two rows go the other way: the PN55 completed the Aion 16X model at 8.80 frames per second where both Intel systems failed, and it posted 10.35 frames per second on Hyperion HDR against 3.16 on the NUC, the one model where the AMD execution path is the faster one, and a result that held on a second run.
Generowanie obrazu Procyon AI
The Procyon AI Image Generation benchmark from UL Solutions runs Stable Diffusion 1.5 and Stable Diffusion XL inference through the inference engine best suited to the hardware and reports a score based on how quickly images are generated. The FP16 tests run at full precision, and the INT8 test profile uses a quantized model where the platform offers one. Scores are comparable only when the same engine, device, and precision are used, so each result carries its engine and device.
The two Intel systems and the NUC 14 Pro use OpenVINO on their Arc GPUs, and the QN10 runs the INT8 profile on its Hexagon NPU through QNN. The PN55 runs everything through ONNX Runtime with DirectML on the Radeon 860M, and on the INT8 profile the AMD path substitutes an FP16 model because there is no INT8 Stable Diffusion path on that platform, so its 1,906 in that row is an FP16 result at the INT8 test settings. We did not run the NPU image generation test on the NUC.
| Generowanie obrazu Procyon AI (wyższy poziom oznacza lepszą jakość) | ASUS NUC 16 Pro | Lenovo Yoga Mini | ASUS ExpertCenter PN55 | ASUS NUC 14 Pro | ASUS Ascent QN10 |
|---|---|---|---|---|---|
| SD 1.5 FP16 | 634 (OpenVINO, GPU) | 613 (OpenVINO, GPU) | 201 (ONNX DirectML, GPU) | N / A | N / A |
| SD 1.5 INT8 profile | 7,725 (OpenVINO, GPU) | 7,119 (OpenVINO, GPU) | 1,906 (ONNX DirectML, GPU, FP16 model) | 1,004 (OpenVINO, GPU) | 5,457 (QNN, NPU) |
| SD 1.5 INT8 (NPU) | N / A | 2,936 (OpenVINO, NPU) | N / A | N / A | N / A |
| SDXL FP16 | 750 (OpenVINO, GPU) | 727 (OpenVINO, GPU) | 117 (ONNX DirectML, GPU) | N / A | N / A |
On the SD 1.5 FP16 test, the NUC 16 Pro scores 634, 3% ahead of the Yoga Mini at 613, and on the INT8 profile it reaches 7,725 against 7,119, a 9% lead that is 7.7x the NUC 14 Pro’s 1,004 on the same engine and 42% ahead of the QN10’s NPU result. On SDXL FP16, the NUC’s 750 is 3% ahead of the Yoga Mini’s 727, and the long run, at 50 seconds per image over 16 images, is where the extra cooling would show if the Yoga Mini were throttling, so the small margin says it was not.
The PN55 trails on every row of the image generation table, and its 201 on SD 1.5 FP16 is less than a third of the NUC’s score, its 1,906 on the INT8 profile is a quarter, and SDXL at 117 took 318 seconds per image against 50 on the NUC. Some of that is the DirectML path, and some is the Radeon 860M, and the Procyon results do not separate the two, but a buyer who wants local Stable Diffusion on a mini PC gets 3x to 6x the throughput from the Arc B390.
Procyon AI Computer Vision
The Procyon AI Computer Vision benchmark runs MobileNet V3, ResNet 50, Inception V4, DeepLab V3, YOLO V3, and Real-ESRGAN and reports a score that reflects inference throughput across all six. It can target the CPU, GPU, or NPU through several engines, and results are comparable across systems only when the same engine, device, and precision are used.
We ran the NUC 16 Pro through Windows ML, which gives a like-for-like comparison with the Yoga Mini, the PN55, and the NUC 14 Pro, and through OpenVINO, which is the path that exposes the Intel NPU. The PN55’s NPU runs through AMD’s Ryzen AI engine at integer precision, so its 2,031 sits in its own row and does not compare with the Intel NPU’s float16 result. The QN10’s SNPE results are not comparable with any of these and are omitted.
| Procyon AI Computer Vision (im wyższy tym lepszy) | ASUS NUC 16 Pro | Lenovo Yoga Mini | ASUS ExpertCenter PN55 | ASUS NUC 14 Pro |
|---|---|---|---|---|
| WinML (float32) | ||||
| CPU | 156 | 139 | 113 | 107 |
| GPU | 413 | 373 | 184 | 135 |
| Otwórz WINO | ||||
| CPU (float32) | 130 | 118 | N / A | N / A |
| GPU (float32) | 591 | 550 | N / A | N / A |
| NPU (float16) | 1,259 | 1,205 | N / A | N / A |
| Inteligentna sztuczna inteligencja AMD Ryzen | ||||
| NPU (integer) | N / A | N / A | 2,031 | N / A |
Through Windows ML, the NUC 16 Pro scores 156 on the CPU and 413 on the GPU, 12% and 11% ahead of the Yoga Mini, 2.2x the PN55’s GPU result of 184, and 3.1x the NUC 14 Pro’s 135. Switching to OpenVINO lifts the GPU to 591 and exposes the NPU at 1,259, 2.1x the best GPU result and 4% ahead of the Yoga Mini’s 1,205, so the NPU gain is the same on both 358H systems, and the ASUS box adds its usual few percent on top.
The PN55’s Ryzen AI NPU result of 2,031 is 61% higher than the Intel NPU’s 1,259, but it was produced at integer precision against float16 on the Intel side, so the right reading is that both NPUs are the fastest device in their own box for this class of model by a wide margin, and the AMD path reaches a higher score when the workload is quantized for it.
Generowanie tekstu Procyon AI
The Procyon AI Text Generation benchmark runs four local language models, Phi, Mistral, Llama 3, and Llama 2, through the inference engine suited to the hardware and reports an overall score for each along with time to first token and output tokens per second. UL’s score reflects both, so a device that starts answering quickly and streams at a steady rate scores well even if its raw token rate is modest.
We ran the NUC 16 Pro on the GPU and on the NPU through OpenVINO, and the PN55 on the GPU through ONNX Runtime with DirectML, which is the only engine that completes all four models on that platform. The Yoga Mini was not run in this test.
| Generowanie tekstu Procyon AI | ASUS NUC 16 Pro GPU (OpenVINO) | ASUS NUC 16 Pro NPU (OpenVINO) | ASUS ExpertCenter PN55 GPU (ONNX DirectML) |
|---|---|---|---|
| Phi | |||
| Wynik | 1,970 | 852 | 332 |
| Time to first token (s) | 0.305 | 1.097 | 6.152 |
| Output tokens/s | 46.24 | 31.04 | 26.54 |
| Mistral | |||
| Wynik | 1,884 | 590 | 289 |
| Time to first token (s) | 0.350 | 2.627 | 8.930 |
| Output tokens/s | 27.27 | 20.05 | 16.32 |
| Lama 3 | |||
| Wynik | 1,819 | 622 | 259 |
| Time to first token (s) | 0.322 | 1.889 | 8.384 |
| Output tokens/s | 26.18 | 17.99 | 13.87 |
| Lama 2 | |||
| Wynik | 1,821 | 541 | 296 |
| Time to first token (s) | 0.618 | 4.532 | 13.670 |
| Output tokens/s | 15.14 | 9.82 | 8.88 |
On the Arc B390, the NUC 16 Pro scores 1,970 on Phi with a 0.305-second first token and 46.24 tokens per second, and the three larger models land between 1,819 and 1,884 with first tokens under 0.62 seconds and output from 27.27 tokens per second on Mistral down to 15.14 on Llama 2.
The NPU path completes every model but scores less than half the GPU on each: 852 on Phi, with first tokens of 1.1 to 4.5 seconds and two-thirds to three-quarters of the GPU’s token rate; on this chip, the NPU is the quiet, low-power option for local LLMs, and the GPU is the fast one.
The PN55’s output rates are closer than its scores suggest: 26.54 tokens per second on Phi is 57% of the NUC’s GPU rate, and 8.88 on Llama 2 is 59%, which tracks the memory bandwidth gap between LPDDR5X-8533 and DDR5-5600. The scores collapse because of time to first token, 6.2 seconds on Phi and 13.7 seconds on Llama 2, 20x to 25x the NUC’s figures, which is a prompt-processing cost of the DirectML path on this GPU.
The HP EliteDesk 8 Mini G1a with the same Radeon 860M posted 7.7 seconds to first token on Phi in our review last December, so the behavior is consistent across two AMD systems on this path. For an interactive assistant, that first-token wait is the number a user feels, and it is the clearest reason to pick the Intel box for local LLM work.
Testy porównawcze gier 3DMark
3DMark’s gaming tests put the Arc B390 through rendering workloads at different resolutions and feature levels. Night Raid and Wild Life are built for integrated and mobile-class GPUs; Fire Strike is a DirectX 11 test at 1080p; Time Spy moves to DirectX 12 at 1440p; Solar Bay adds ray tracing on a lighter workload; and Steel Nomad, Port Royal, and Speed Way are the heavy DirectX 12 and ray-tracing tests built for discrete cards.
For an integrated GPU, the heavy tests mostly show the distance to discrete hardware, while the lighter tests show what runs at playable rates. The PN55 was not run on Night Raid, and the NUC 14 Pro skipped Night Raid and Wild Life.
| 3DMark (im wyższy tym lepszy) | ASUS NUC 16 Pro | Lenovo Yoga Mini | ASUS ExpertCenter PN55 | ASUS NUC 14 Pro | ASUS Ascent QN10 |
|---|---|---|---|---|---|
| Night Raid | 49,434 | 45,900 | N / A | N / A | N / A |
| Dzikiej przyrody | 44,129 | 42,152 | 17,671 | N / A | 19,996 |
| Fire Strike | 14,980 | 14,076 | 6,714 | 6,591 | 9,949 |
| Grafika / Fizyka Fire Strike | 17,715 / 30,934 | 16,841 / 26,944 | 7,398 / 29,522 | 7,137 / 28,289 | 10,615 / 25,253 |
| Szpieg czasu | 7,697 | 7,308 | 3,135 | 3,643 | 4,014 |
| Time Spy Grafika / CPU | 7,085 / 15,082 | 6,774 / 13,225 | 2,784 / 11,046 | 3,269 / 10,403 | 3,590 / 12,141 |
| Zatoka Słoneczna | 26,979 | 27,236 | 12,456 | 11,630 | 21,561 |
| Stalowy Nomad | 1,628 | 1,595 | 573 | 611 | 1,042 |
| Port Royal | 4,213 | 4,091 | 1,409 | 1,429 | 1,520 |
| Żużel | 925 | 975 | 419 | 335 | 324 |
The NUC 16 Pro and the Yoga Mini trade places by a few percent on every graphics test, which is what the same GPU should do. The NUC leads Time Spy graphics by 5% at 7,085 against 6,774, Fire Strike graphics by 5% at 17,715, and Wild Life and Port Royal by 3% to 5%, while the Yoga Mini edges ahead on Solar Bay by 1% and Speed Way by 5%. Against the PN55, the Arc B390 posts 2.5x the Time Spy graphics score of the Radeon 860M, 2.4x on Fire Strike graphics, 2.5x on Wild Life, 2.2x on Solar Bay, and 3x on Port Royal.
The QN10’s Adreno lands between the two ASUS systems: the NUC leads it by 67% on Fire Strike graphics, 97% on Time Spy graphics, and 2.8x on Port Royal, and the NUC 14 Pro’s older Arc sits at roughly the PN55’s level. The CPU subscores favor the NUC as well. Fire Strike Physics at 30,934 is 15% ahead of the Yoga Mini and the highest in the group, and the Time Spy CPU score of 15,082 is 14% ahead of the Yoga Mini and 37% ahead of the PN55.
Steel Nomad at 1,628 and Speed Way at 925 are still far from a discrete card, so this is a 1080p system for current titles with settings turned down. Night Raid at 49,434 and Wild Life at 44,129 show older and lighter games run comfortably.
SPECviewperf 15
SPECviewperf 15 is the industry standard for measuring professional graphics performance. It replays workloads captured from 3ds Max, Blender, CATIA, Creo, Maya, Siemens NX, SolidWorks, Unreal Engine, and Enscape, along with energy and medical visualization viewsets, and reports frames per second for each. Results compare only against runs at the same resolution.
We ran both ASUS systems at 4K, which is a heavier load than the 1080p we used for the Yoga Mini, so the Yoga Mini is not in this table, and these numbers should not be set against that review.
| SPECviewperf 15 (4K, higher is better) | ASUS NUC 16 Pro | ASUS ExpertCenter PN55 |
|---|---|---|
| 3dsmax-08 | 11.87 | 10.25 |
| blender-01 | 12.33 | 6.91 |
| catia-07 | 8.25 | 9.07 |
| creo-04 | 24.55 | 25.68 |
| energia-04 | 6.30 | 9.06 |
| enscape-01 | 4.03 | DNF |
| Maja-07 | 33.90 | 18.29 |
| medyczny-04 | 9.72 | 16.40 |
| snx-05 | 42.68 | 36.84 |
| solidworks-08 | 19.69 | 15.95 |
| unreal_engine-01 | 30.62 | 15.95 |
At 4K, the Arc B390 leads the Radeon 860M on the DCC and game-engine viewsets by the widest margins: maya-07 at 33.90 frames per second against 18.29, unreal_engine-01 at 30.62 against 15.95, and blender-01 at 12.33 against 6.91, all 78% to 92% ahead. The CAD viewsets are closer, with the NUC 23% ahead on solidworks-08 and 16% on snx-05, and the PN55 slightly ahead on creo-04 and catia-07.
The PN55 takes the two volumetric viewsets by a lot, medical-04 at 16.40 against 9.72 and energy-04 at 9.06 against 6.30, which are the memory-bandwidth-heavy workloads where the AMD part also led in y-cruncher. The enscape-01 viewset did not produce a score on the PN55. At 4K, none of these numbers describe a comfortable CAD workstation; at 1080p, where the Yoga Mini posted 80.28 on maya-07, the same GPU is a usable light viewport system.
Stacja robocza SPEC 4
SPECworkstation 4 is the broadest test in our suite. It runs more than 50 workloads drawn from professional applications and organizes them into hardware subsystem scores for CPU, graphics, accelerator, and storage, and industry vertical scores for AI and machine learning, energy, financial services, life sciences, media and entertainment, product design, and productivity and development. Each score is a ratio against a reference workstation. The NUC 16 Pro and the PN55 completed all 23 workloads; on the Yoga Mini, the Octave workload failed, which left its CPU subsystem and Productivity and Development scores uncomputed.
| SPECworkstation 4 (współczynnik SPEC, im wyższy tym lepiej) | ASUS NUC 16 Pro | Lenovo Yoga Mini | ASUS ExpertCenter PN55 |
|---|---|---|---|
| Podsystemy sprzętowe | |||
| CPU | 1.42 | DNF | 1.08 |
| Grafika | 1.80 | 1.60 | 2.04 |
| Akcelerator | 2.37 | 2.25 | 1.96 |
| Dyski | 1.97 | 1.11 | 1.06 |
| Branże branżowe | |||
| AI i uczenie maszynowe | 1.52 | 1.44 | 1.29 |
| Wartość energetyczna | 1.52 | 1.34 | 1.17 |
| Usługi finansowe | 1.12 | 1.01 | 1.03 |
| Life Sciences | 1.71 | 1.42 | 1.29 |
| Media i rozrywka | 1.67 | 1.40 | 1.30 |
| Product Design | 1.81 | 1.52 | 1.32 |
| Produktywność i rozwój | 1.25 | DNF | 1.00 |
The NUC 16 Pro leads the Yoga Mini on every score the two share: Graphics at 1.80 against 1.60, Accelerator at 2.37 against 2.25, and Storage at 1.97 against 1.11, where the Gen5 drive is the whole difference. In the verticals, the margins run from 6% in AI and Machine Learning to 19% to 20% in Life Sciences, Media and Entertainment, and Product Design, which are the sustained multi-core workloads, and the CPU subsystem score of 1.42 is 31% ahead of the PN55’s 1.08.
The PN55 takes one line, Graphics at 2.04 against the NUC’s 1.80, on the strength of the Viewport Graphics workload, and lands within a few points of the Yoga Mini in Financial Services. Everywhere else, the NUC is 10% to 35% ahead of the AMD system. The OpenFOAM workload returned a 7.93 ratio on the NUC and 4.93 on the PN55, far above every other workload on both systems; we read that as a characteristic of the workload against the SPEC reference system, and we would not weight it.
Wydajność pamięci masowej
We measure storage two ways, starting with the 3DMark Storage benchmark, which replays traces of game loading, installing, saving, and recording and produces a single score for the mixed, bursty access of everyday use. The Blackmagic Disk Speed Test is a simple sequential test that reports peak read and write throughput in megabytes per second. The NUC 16 Pro ships with a 1TB Samsung PM9E1 in its PCIe 5.0 slot, a Gen5 part in a class where Gen4 drives are the norm.
| Dyski | ASUS NUC 16 Pro | Lenovo Yoga Mini | ASUS ExpertCenter PN55 | ASUS NUC 14 Pro | ASUS Ascent QN10 |
|---|---|---|---|---|---|
| Pamięć masowa 3DMark | 3,391 | 2,540 | 2,471 | 1,887 | 2,393 |
| Zapis Blackmagic (MB/s) | 9,863.2 | 5,151.1 | 4,518.4 | N / A | N / A |
| Odczyt Blackmagic (MB/s) | 9,505.2 | 5,276.6 | 4,903.6 | N / A | N / A |
The PM9E1 scores 3,391 in 3DMark Storage, 34% ahead of the Yoga Mini’s KIOXIA Gen4 drive, 37% ahead of the PN55’s Micron 2500, and 80% ahead of the NUC 14 Pro. The sequential numbers make the generation gap plain: 9,863MB/s write and 9,505MB/s read against 5,151 and 5,277 on the Yoga Mini and 4,518 and 4,904 on the PN55, so the NUC’s drive moves large files at roughly twice the rate of either Gen4 system. The 3DMark trace average of 570MB/s at 52 microseconds also beats the PN55’s 425MB/s at 73 microseconds.
Wniosek
The ASUS NUC 16 Pro answers the question the Yoga Mini raised: with the same Core Ultra X7 358H and Arc B390, a 65W cTDP, a 150W brick, and a fan stack sized for a 5×4 chassis, buy a consistent 5% to 15% over the puck on the multi-core and sustained tests, and twice the memory and a Gen5 drive do the rest. Geekbench multi-core is 9% ahead at 18,388, Cinebench multi-thread 6% at 4,741 with a 9.34x scaling ratio, 3DMark CPU Profile 15% at max threads, and Blender’s Junkshop scene 26% on the GPU, while every graphics test lands within 5% either way.

Against ASUS’s own PN55, the split is surprisingly good for the NUC. The Ryzen AI 7 450 wins y-cruncher on every row and holds its own on 7-Zip, and the lightly threaded CPU Profile runs, and its NPU scores higher in Procyon computer vision at integer precision. Everything that touches the GPU goes to the NUC by 2x or more: Time Spy graphics at 2.5x, LuxMark at 1.8x to 2x, Blender GPU at 5.5x to 6x, Stable Diffusion 1.5 at 3x to 4x, and a first token in local LLMs that arrives in a third of a second, where the PN55 takes six to fourteen.
The compromises are the missing headphone jack, soldered memory on the LPDDR5X configuration, and a price that, at $2,699 for the 32GB and 1TB Gen4 system listed at B&H, buys a lot of desktop for the money; the 64GB configuration we tested has no US listing yet. The Snapdragon-based Ascent QN10 remains the CPU throughput pick at this size, 31% ahead in Geekbench multi-core and 43% in Blender CPU, for work that runs on Arm.
For a business or edge desk that wants dual 2.5GbE, two M.2 slots, a Gen5 SSD, and the strongest integrated GPU in the mini PC class, with a three-year warranty and a VESA bracket in the box, the NUC 16 Pro is the most complete 358H system we have tested, and the one that gets the most out of the chip.



 Amazon