

The Corsair MP600 Core is an M.2 SSD that leverages both PCIe Gen4 and QLC NAND. As with all things PCIe Gen4, the MP600 Core promises higher performance with top quoted speeds of 4.7GB/s and up to 480K IOPS. The QLC NAND allows for more data in the same space. This drive is aimed at the consumer market where one needs up to 4TB of capacity and a bit more speed than a Gen3 QLC drive.
As stated, the Corsair MP600 Core leverages the PCIe Gen4 x4 interface. This gives the drive top speeds of 4.7GB/s read and 1.95GB/s write and throughput of 480K IOPS write and 200K IOPS read. Aside from the interface the drive also leverages a Phison PS5016-E16 controller and dynamic SLC cache. The drive comes in capacities ranging from 1TB to 4TB and has an MTBF of 1.8 million hours. To help optimize performance, the MP600 Core has a built-in aluminum heat spreader.
For those that want to skip the performance hit of QLC, the company offers a PRO version that leverages TLC. Both drives can be managed through the CORSAIR SSD Toolbox software. The drive comes with the usual suspects of Trim support, S.M.A.R.T. support, and garbage collection.
For our review, we will be looking at the 2TB model which can be picked up for $310.
Corsair MP600 Core Specifications
| Form Factor | M.2 2280 |
| Capacity | 1TB, 2TB, 4TB |
| Memory Components | 3D QLC |
| Interface | PCIe Gen 4.0 x4, NVMe 1.3 |
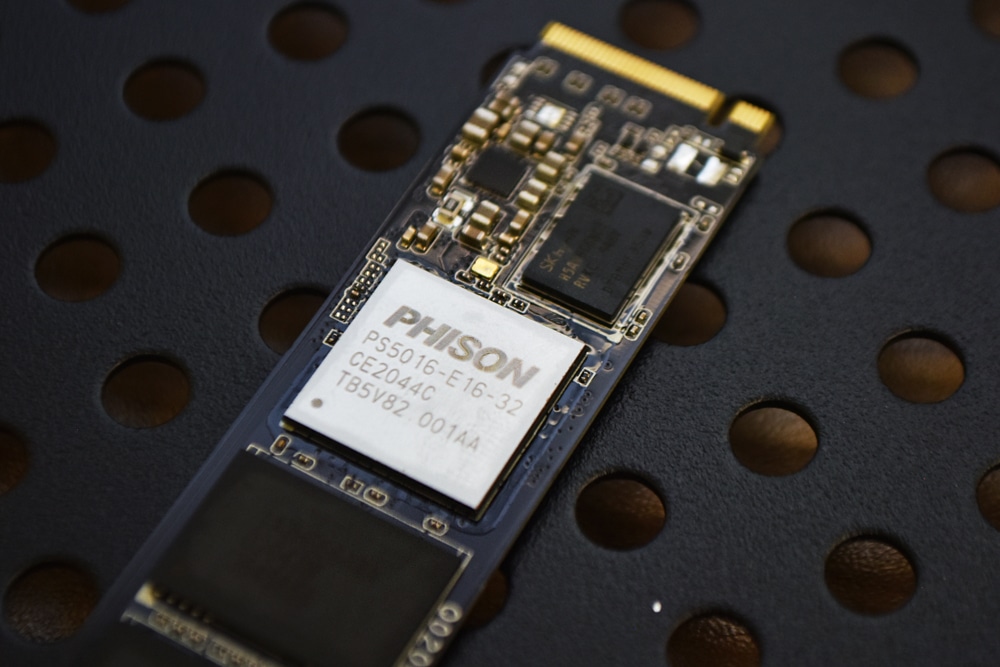
| Controller | Phison PS5016-E16 |
| Performance | |
| Max Sequential Read | Up to 4700 MBps |
| Max Sequential Write | Up to 1950 MBps |
| 4KB Random Read | Up to 200,000 IOPS |
| 4KB Random Write | Up to 480,000 IOPS |
| MTBF | 1,800,000 hours |
| TBW | Up to 900 |
| HeatSink | Yes |
| Power Consumption (Idle) | <5 mW |
| Power Consumption (Active) | Active Read: 6.0W Active Write: 7.4W |
| Operating Temperature | 0°C ~ +70°C |
| Storage Temperature | -40°C ~ +85°C |
| Operating Humidity | 40°C 90% RH |
| Max Shock Resistance | 1500G |
| Max Vibration Resistance | 20~80 Hz / 1.52mm |
| Height | 15.00mm |
| Width | 23.00mm |
| Depth | 80.00mm |
| Weight | 34.00g |
Corsair MP600 Core Design and Build
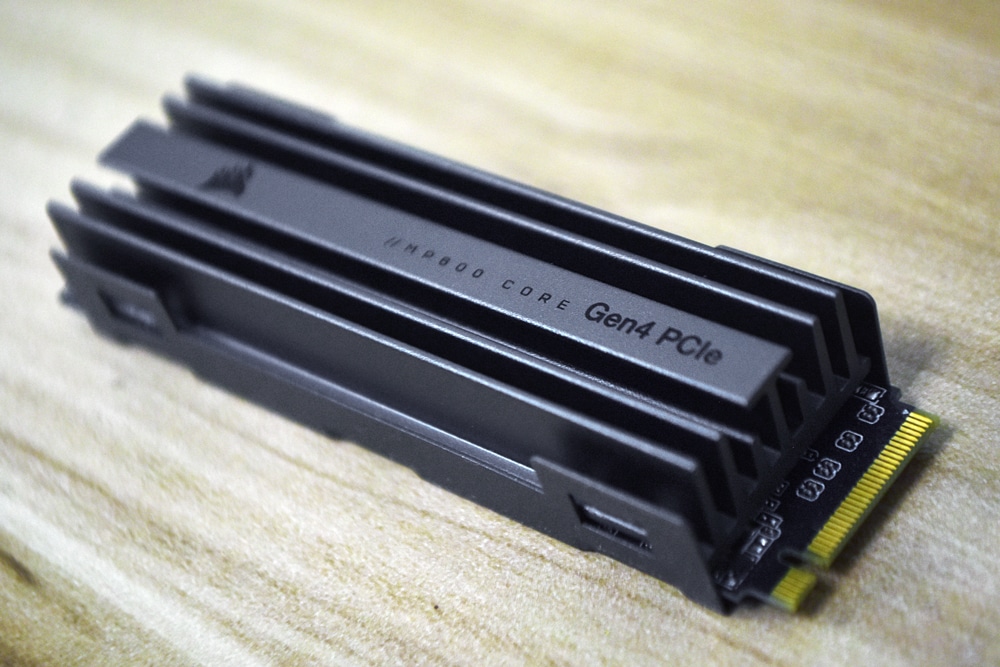
As stated, the Corsair MP600 Core is an M.2 and the more common 2280 size. Where the drive looks a bit different is with its built-in heat spreader. The heat spreader covers one side and has the company branding on it.
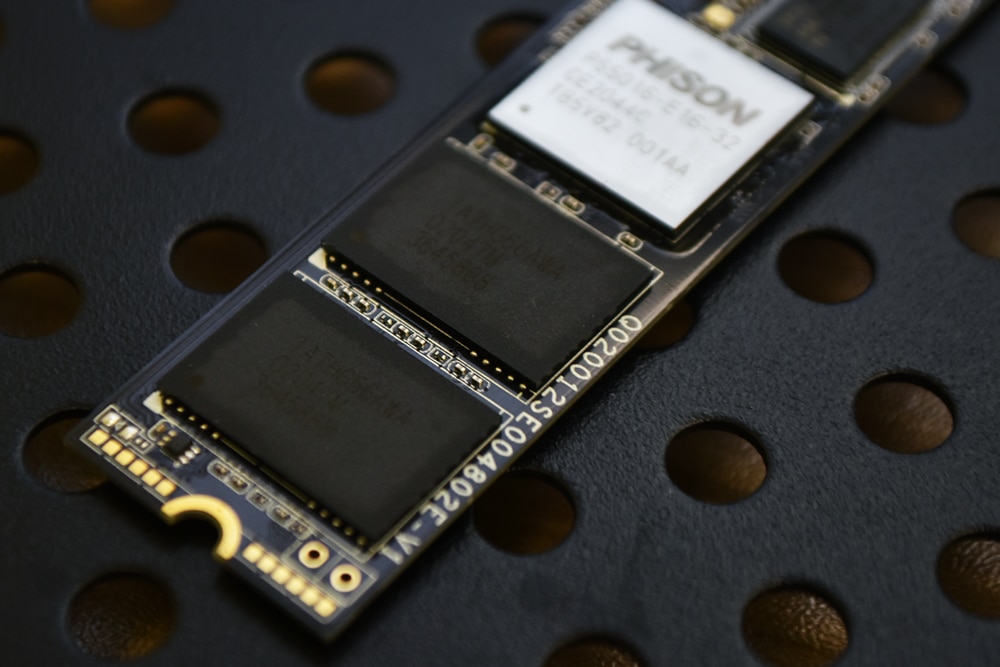
Beneath the heat spreader are the NAND packs and Phison E16 controller.
Corsair MP600 Core Performance
Testbed
As we migrate into testing newer NVME Gen4 SSDs, it required a platform shift in our lab to support the newer interface. Lenovo has been out in the front of the pack with PCIe Gen4 support, including up to the front-mount U.2 bays, while others still only offer edge-card support. In our Gen4 reviews, we leverage the Lenovo ThinkSystem SR635 server, equipped with an AMD 7742 CPU and 512GB of 3200Mhz DDR4 memory.
NVMe is tested natively through an M.2 to PCIe adapter card in the edge-card slot, while U.2 drives are loaded in the front. The methodology used better reflects end-user workflow with the consistency, scalability, and flexibility testing within virtualized server offers. A large focus is put on drive latency across the entire load range of the drive, not just at the smallest QD1 (Queue-Depth 1) levels. We do this because many of the common consumer benchmarks don’t adequately capture end-user workload profiles.
SQL Server Performance
Each SQL Server VM is configured with two vDisks: 100GB volume for boot and a 500GB volume for the database and log files. From a system resource perspective, we configured each VM with 16 vCPUs, 64GB of DRAM and leveraged the LSI Logic SAS SCSI controller. While our Sysbench workloads tested previously saturated the platform in both storage I/O and capacity, the SQL test is looking for latency performance.
This test uses SQL Server 2014 running on Windows Server 2012 R2 guest VMs and is stressed by Quest’s Benchmark Factory for Databases. StorageReview’s Microsoft SQL Server OLTP testing protocol employs the current draft of the Transaction Processing Performance Council’s Benchmark C (TPC-C), an online transaction-processing benchmark that simulates the activities found in complex application environments.
The TPC-C benchmark comes closer than synthetic performance benchmarks to gauging the performance strengths and bottlenecks of storage infrastructure in database environments. Each instance of our SQL Server VM for this review uses a 333GB (1,500 scale) SQL Server database and measures the transactional performance and latency under a load of 15,000 virtual users.
SQL Server Testing Configuration (per VM)
- Windows Server 2012 R2
- Storage Footprint: 600GB allocated, 500GB used
- SQL Server 2014
- Database Size: 1,500 scale
-
- Virtual Client Load: 15,000
- RAM Buffer: 48GB
- Test Length: 3 hours
-
- 2.5 hours preconditioning
- 30 minutes sample period
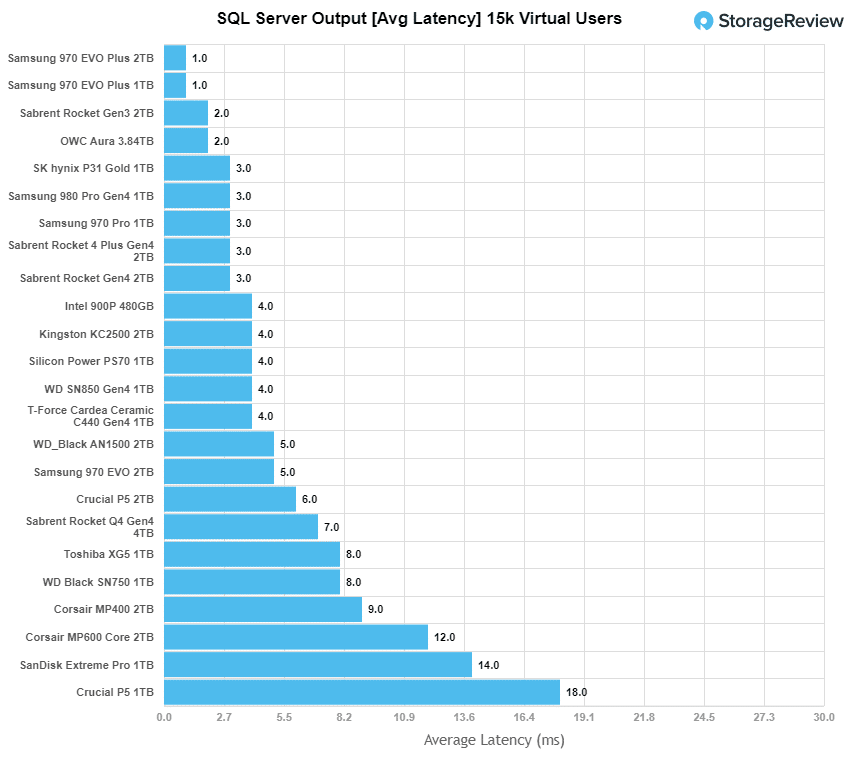
Looking at SQL Server average latency, the Corsair MP600 Core had 12ms latency putting it near the bottom of the pack.
VDBench Workload Analysis
When it comes to benchmarking storage devices, application testing is best, and synthetic testing comes in second place. While not a perfect representation of actual workloads, synthetic tests do help to baseline storage devices with a repeatability factor that makes it easy to do apples-to-apples comparison between competing solutions. These workloads offer a range of different testing profiles ranging from “four corners” tests, common database transfer size tests, to trace captures from different VDI environments.
All of these tests leverage the common vdBench workload generator, with a scripting engine to automate and capture results over a large compute testing cluster. This allows us to repeat the same workloads across a wide range of storage devices, including flash arrays and individual storage devices. Our testing process for QLC SSDs starts with a secure erase, then we partition the drive to 1% of the drive capacity to simulate how the drive might respond to smaller application workloads. This is different from full entropy tests which use 100% of the drive and take them into steady state. As a result, these figures will reflect higher-sustained write speeds.
Profiles:
- 4K Random Read: 100% Read, 128 threads, 0-120% iorate
- 4K Random Write: 100% Write, 64 threads, 0-120% iorate
- 64K Sequential Read: 100% Read, 16 threads, 0-120% iorate
- 64K Sequential Write: 100% Write, 8 threads, 0-120% iorate
Comparables for this review:
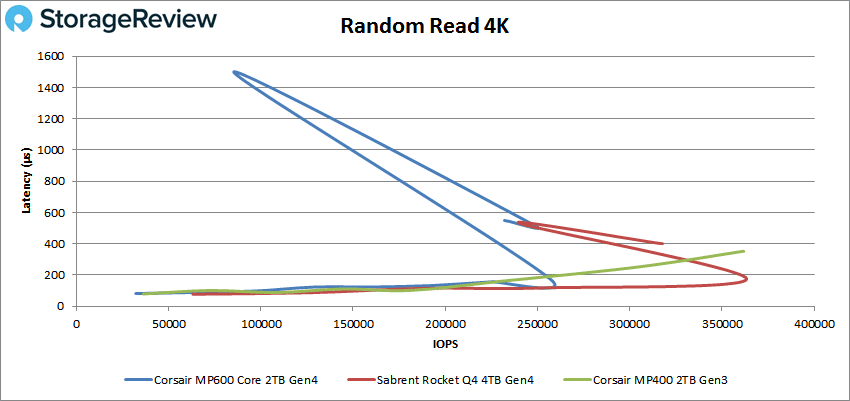
In 4K random read, the Corsair MP600 Core placed third. It started off ok at 32K IOPS and 82µs but saw a big dip in performance and spike in latency before finishing. Peak before the drop was about 257K IOPS and a latency of 173µs.
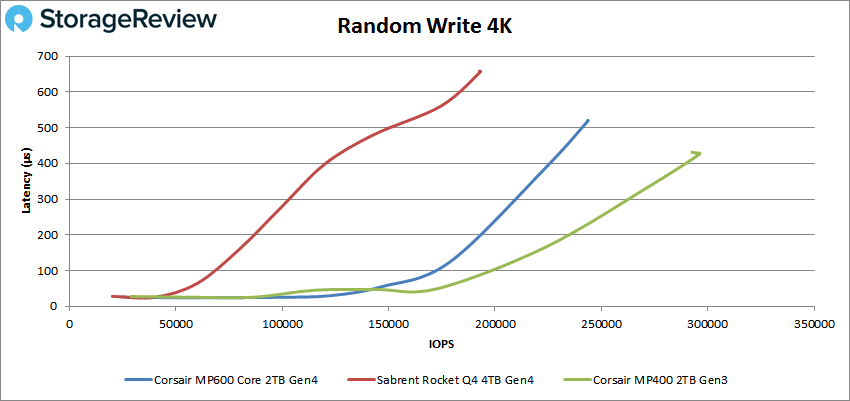
Random 4K write saw the MP600 Core place better at second place with a peak performance of 243,721 IOPS and a latency of 519µs.
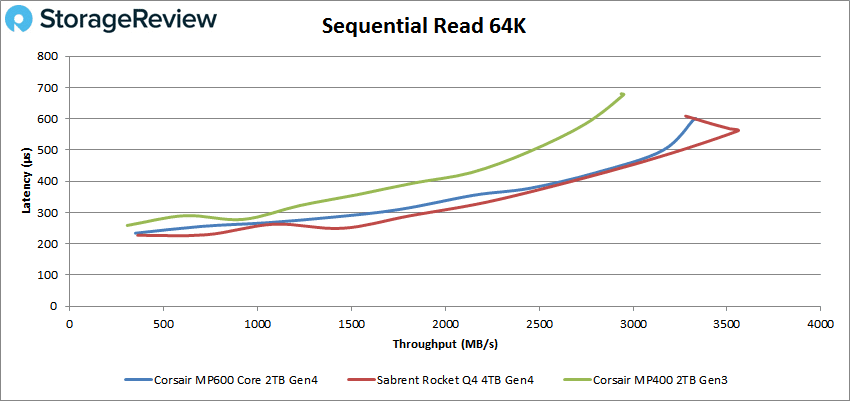
Switching over to sequential workloads in 64K, for reads the MP600 Core again took second with a peak of 53,455 IOPS or 3.34GB/s at a latency of 598µs.
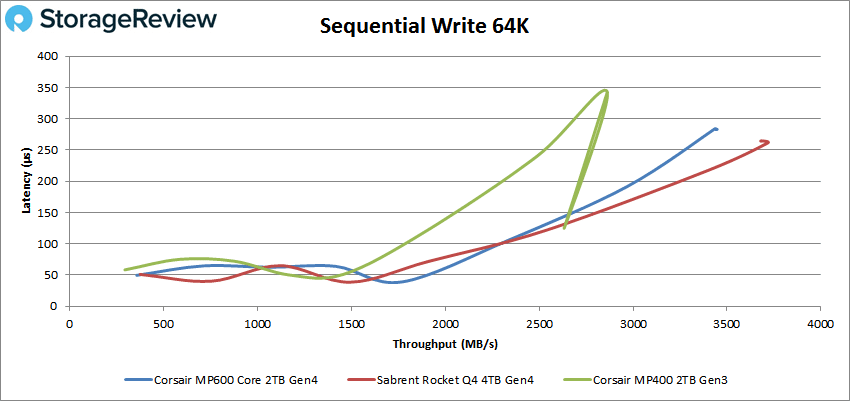
In 64K write we saw second once more with a peak of 55,136 IOPS or 3.45GB/s at a latency of 283µs.
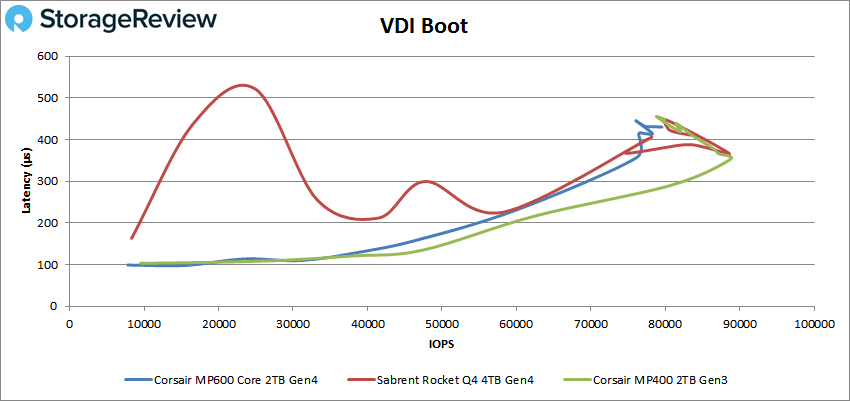
Next, we looked at our VDI benchmarks, which are designed to tax the drives even further. These tests include Boot, Initial Login, and Monday Login. Looking at the Boot test, the Corsair MP600 Core finished third but had a bit more stable performance than the other two. It peaked at 79,544 IOPS at a latency of 430µs.
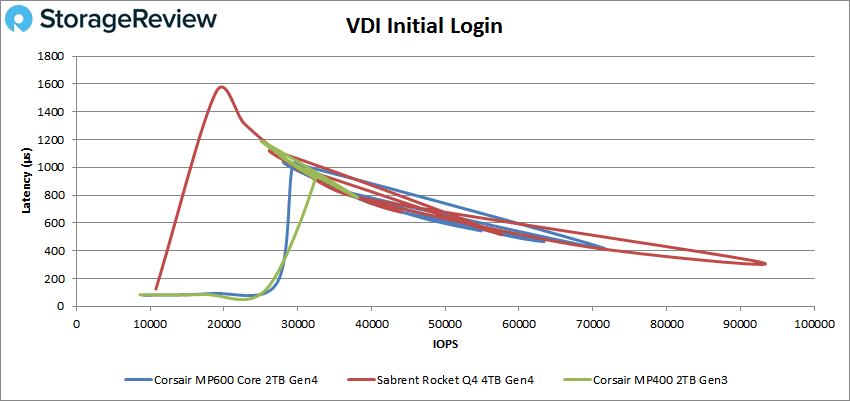
For VDI Initial Login, the MP600 Core peaked at second though all the drives jumped all over. The core hit 71,676 IOPS at 414µs before dropping off quite a bit.
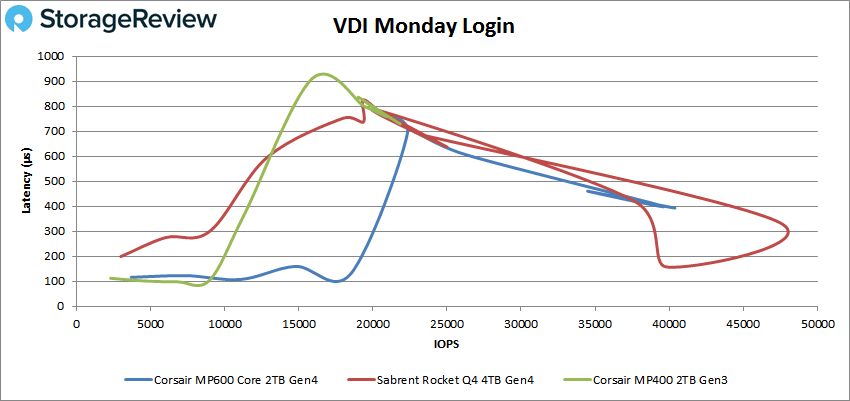
VDI Monday Login saw the MP600 Core hit second overall with a peak of 40,376 IOPS and a latency of 394µs.
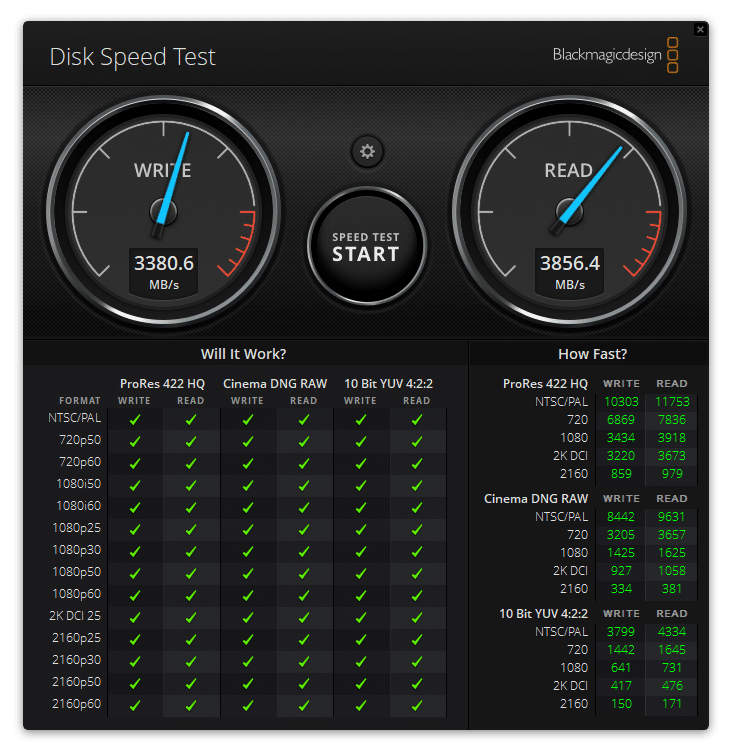
BlackMagic
To further test the Corsair MP600 Core, we ran the Blackmagic Disk Speed Test on the Lenovo ThinkStation P620.
Here we saw the MP600 Core hit 3.86GB/s read and 3.38GB/s write. Not quite hitting its quoted read speed but far surpassing its quoted write speed.
Conclusion
The Corsair MP600 Core is the latest consumer PCIe Gen4, QLC SSD. This particular drive comes in an M.2 (2280) form factor and up to 4TB in capacity. Corsair was a bit stingy with the details overall, but it does come with performance quotes of up to 4.7GB/s sequential and up to 480K IOPS in random. The drive comes with a built-in aluminum heat spreader to help optimize performance.
For performance, we checked the MP600 Core against a high-performant PCIe Gen4, QLC SSD (Sabrent Q4) as well as a Gen3, QLC SSD (MP400). For the most part, the MP600 Core performed like one would expect, behind the Sabrent but ahead of the Gen3. The Gen4 Corsair was able to hit peaks of 257K IOPS in 4K read, 244K IOPS in 4K write, 3.34GB/s in 64K read, and 3.45GB/s in 64K write. For our VDI benchmarks, the drive hit a peak of 80K IOPS for boot, 72K IOPS for Initial Login, and 40K IOPS for Monday Login. For SQL Server we saw an aggregate latency of 12ms. Blackmagic gave us a fairly impressive 3.86GB/s read and 3.38GB/s write.
PCIe Gen4 brings higher levels of performance while QLC tends to bring it down. The Corsair MP600 Core tries to bring benefits of both technologies under one roof and does a fairly good job.


 Amazon