

The KIOXIA CD6 is the company’s flagship drive designed to bring consistent performance in demanding 24×7 environments, including hyperscale, IoT and big data analytics, virtualization, media streaming and content delivery networks. The CD6 is available in a range of capacities (960GB to 15.36TB) and in several different security and endurance options.
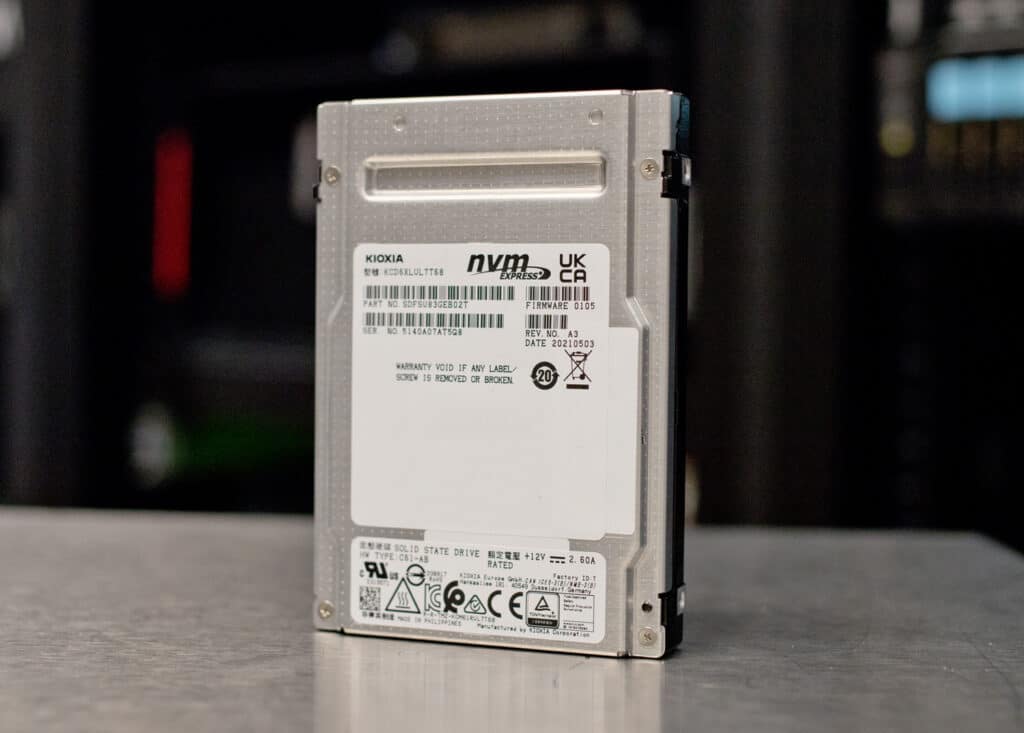
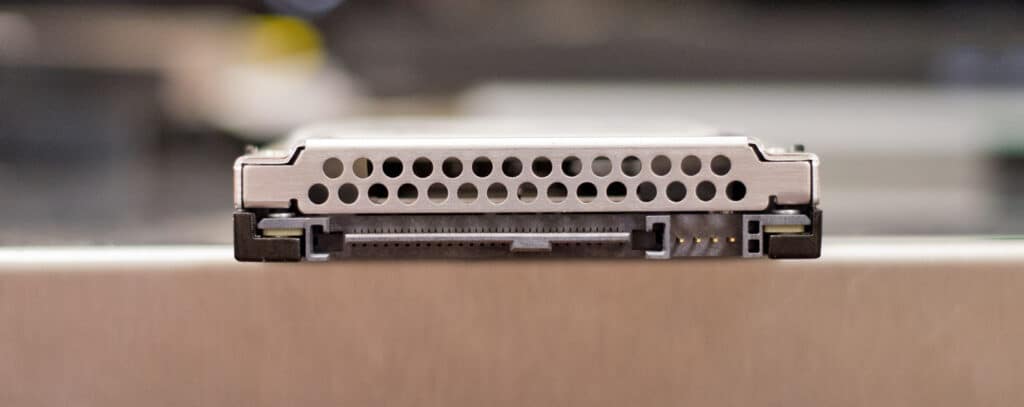
The KIOXIA series comes in 2.5-inch, 15mm Z-height form factors and features the company’s proprietary controller and BiCS FLASH 96-layer 3D TLC memory. It also leverages a single-port design, meaning that there is only one data path from the host to the SSD).
We previously reviewed the pre-production iteration of the CD6 in the summer of 2020, and at the time it was one of the first PCIe 4.0 drives available on the enterprise market. With the drive now out in the wild and a more mature firmware version on production samples, we decided to review an SSD acquired through
For performance, the current CD6 is quoted to deliver up to 6.2GB/s read (7.68GB and 3.84GB models) and 4GB/s (15.36GB and 7.68GB models) write in sequential speeds. Random performance is slated to hit upwards of 1 million IOPS read but just 85,000 IOPS in write.
The KIOXIA CD6 also features 6th generation, two-die failure recovery and double parity protection, power loss protection (PLP), and end-to-end data correction. Data security options include SIE, SED, FIPS 140-2. Power consumption ranges from with active power consumption of 13-19 W, with six power mode settings available.
KIOXIA CD6 FW Specifications
| Capacity | 15,360GB | 7,680 GB | 3,840GB | 1,920GB | 960GB |
| Basic Specifications | |||||
| lnterface | PCIe 4.0, NVMe 1.4 | ||||
| lnterface speed | 64 GT/s (Gen4 x4) | ||||
| Flash Memory Type | BiCS FLASH TLC | ||||
| Performance in single port (1×4) mode (Up to) | |||||
| Sustained 128 KiB Sequential Read | 5,500MB/s | 6,200MB/s | 5,800MB/s | ||
| Sustained 128 KiB Sequential Write | 4,000MB/s | 2,350MB/s | 1,150MB/s | 1,300MB/s | |
| Sustained 4 KiB Random Read | 750K IOPS | 1,000K IOPS | 700K IOPS | ||
| Sustained 4 KiB Random Write | 30K IOPS | 85K IOPS | 60K IOPS | 30K IOPS | |
| Power Requirements | |||||
| Supply Voltage | 12V ± 10 %, 3.3 Vaux ± 15 % | ||||
| Power Consumption (Active) | 19W Typ. | 15W Typ. | 13W Typ. | ||
| Power Consumption (Ready) | 5W Typ. | ||||
| Reliability | |||||
| MTTF | 2,500,000 hours | ||||
| Warranty | 5 years | ||||
| DWPD | 1 | ||||
| Dimensions | |||||
| Height | 15.0 mm + 0, – 0.5 mm | ||||
| Width | 69.85 ± 0.25 mm | ||||
| length | 100.45 mm Max. | ||||
| Weight | 130 g Max. | ||||
| Environmental | |||||
| Temperature (Operating) | 0 °C to 70 °C | ||||
| Humidity (Operating) | 5 % to 95 % R.H. | ||||
| Vibration (Operating) | 21.27 m/s2{ 2.17 Grms } ( 5 to 800 Hz ) | ||||
| Shock (Operating) | 9,800 m/s2{ 1,000 G } ( 0.5 ms duration ) | ||||
KIOXIA CD6 Performance
Testing Background and Comparables
The StorageReview Enterprise Test Lab provides a flexible architecture for conducting benchmarks of enterprise storage devices in an environment comparable to what administrators encounter in real deployments. The Enterprise Test Lab incorporates a variety of servers, networking, power conditioning, and other network infrastructure that allows our staff to establish real-world conditions to accurately gauge performance during our reviews.
We incorporate these details about the lab environment and protocols into reviews so that IT professionals and those responsible for storage acquisition can understand the conditions under which we have achieved the following results. None of our reviews are paid for or overseen by the manufacturer of equipment we are testing. Additional details about the StorageReview Enterprise Test Lab and an overview of its networking capabilities are available on those respective pages.
Comparables:
Testbed
Our PCIe Gen4 Enterprise SSD reviews leverage a Lenovo ThinkSystem SR635 for application tests and synthetic benchmarks. The ThinkSystem SR635 is a well-equipped single-CPU AMD platform, offering CPU power well in excess of what’s needed to stress high-performance local storage. It is also the only platform in our lab (and one of the few on the market currently) with PCIe Gen4 U.2 bays. Synthetic tests don’t require a lot of CPU resources but still leverage the same Lenovo platform. In both cases, the intent is to showcase local storage in the best light possible that aligns with storage vendor maximum drive specs.
PCIe Gen4 Synthetic and Application Platform (Lenovo ThinkSystem SR635)
- 1 x AMD 7742 (2.25GHz x 64 Cores)
- 8 x 64GB DDR4-3200MHz ECC DRAM
- CentOS 7.7 1908
- ESXi 6.7u3
SQL Server Performance
Each SQL Server VM is configured with two vDisks: 100GB volume for boot and a 500GB volume for the database and log files. From a system resource perspective, we configured each VM with 8 vCPUs, 64GB of DRAM and leveraged the LSI Logic SAS SCSI controller. While our Sysbench workloads tested previously saturated the platform in both storage I/O and capacity, the SQL test is looking for latency performance.
This test uses SQL Server 2014 running on Windows Server 2012 R2 guest VMs and is stressed by Quest’s Benchmark Factory for Databases. StorageReview’s Microsoft SQL Server OLTP testing protocol employs the current draft of the Transaction Processing Performance Council’s Benchmark C (TPC-C), an online transaction-processing benchmark that simulates the activities found in complex application environments. The TPC-C benchmark comes closer than synthetic performance benchmarks to gauging the performance strengths and bottlenecks of storage infrastructure in database environments. Each instance of our SQL Server VM for this review uses a 333GB (1,500 scale) SQL Server database and measures the transactional performance and latency under a load of 15,000 virtual users.
SQL Server Testing Configuration (per VM)
- Windows Server 2012 R2
- Storage Footprint: 600GB allocated, 500GB used
- SQL Server 2014
- Database Size: 1,500 scale
- Virtual Client Load: 15,000
- RAM Buffer: 48GB
- Test Length: 3 hours
- 2.5 hours preconditioning
- 30 minutes sample period
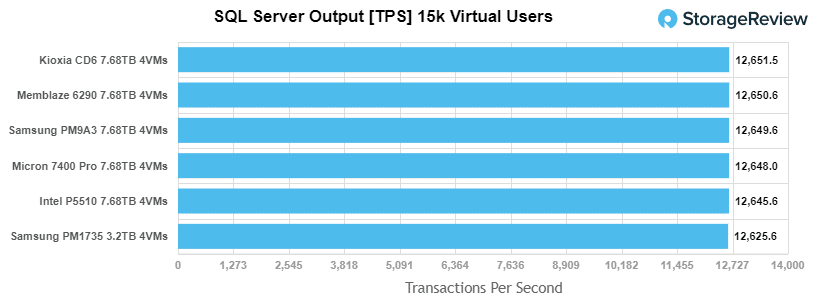
For our SQL Server transactional benchmark, the KIOXIA CD6 was placed first with 12,651.5 TPS.
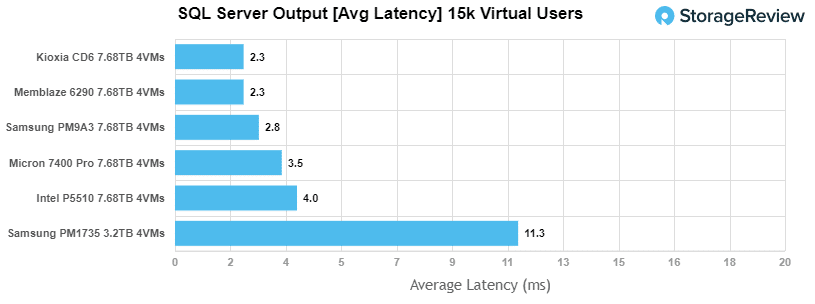
 With SQL Server average latency, the CD6 posted great results with an average latency of just 2.3ms.
Sysbench Performance
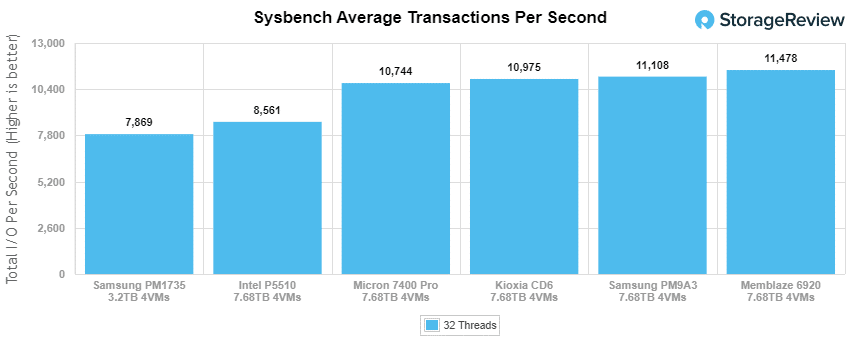
The next application benchmark consists of a Percona MySQL OLTP database measured via SysBench. This test measures average TPS (Transactions Per Second), average latency, and average 99th percentile latency as well.
Each Sysbench VM is configured with three vDisks: one for boot (~92GB), one with the pre-built database (~447GB), and the third for the database under test (270GB). From a system resource perspective, we configured each VM with 8 vCPUs, 60GB of DRAM and leveraged the LSI Logic SAS SCSI controller.
Sysbench Testing Configuration (per VM)
- CentOS 6.3 64-bit
- Percona XtraDB 5.5.30-rel30.1
- Database Tables: 100
- Database Size: 10,000,000
- Database Threads: 32
- RAM Buffer: 24GB
- Test Length: 3 hours
- 2 hours preconditioning 32 threads
- 1 hour 32 threads
Looking at our Sysbench transactional benchmark, the KIOXIA CD6 had upper mid-range results (3rd) with 10,975 TPS.
 With Sysbench average latency, the CD6 posted 11.66ms, which was good enough for 3rd and slightly behind the Samsung PM9A3 and Memblaze drives.
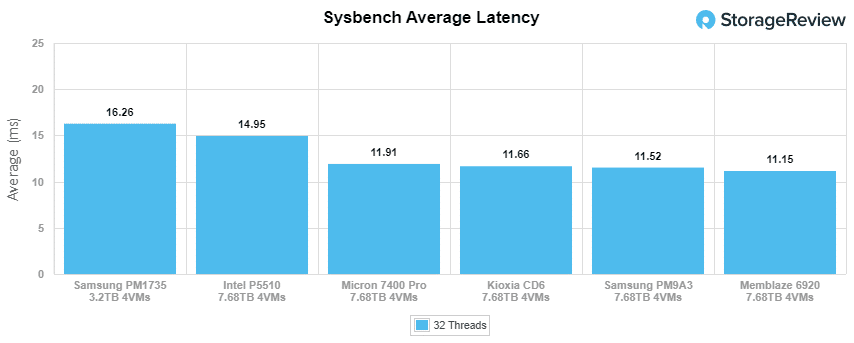
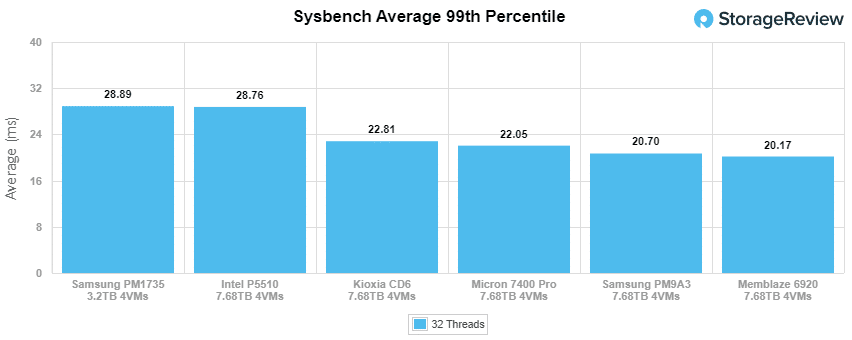
For our worst-case scenario latency (99th percentile) the KIOXIA CD6 placed fourth with 22.81ms.
VDBench Workload Analysis
When it comes to benchmarking storage devices, application testing is best, and synthetic testing comes in second place. While not a perfect representation of actual workloads, synthetic tests do help to baseline storage devices with a repeatability factor that makes it easy to do apples-to-apples comparisons between competing solutions. These workloads offer a range of different testing profiles ranging from “four corners” tests, common database transfer size tests, to trace captures from different VDI environments.
All of these tests leverage the common vdBench workload generator, with a scripting engine to automate and capture results over a large compute testing cluster. This allows us to repeat the same workloads across a wide range of storage devices, including flash arrays and individual storage devices. Our testing process for these benchmarks fills the entire drive surface with data, then partitions a drive section equal to 25% of the drive capacity to simulate how the drive might respond to application workloads. This is different than full entropy tests which use 100% of the drive and takes them into a steady state. As a result, these figures will reflect higher-sustained write speeds.
Profiles:
- 4K Random Read: 100% Read, 128 threads, 0-120% iorate
- 4K Random Write: 100% Write, 128 threads, 0-120% iorate
- 16K Sequential Read: 100% Read, 32 threads, 0-120% iorate
- 16K Sequential Write: 100% Write, 16 threads, 0-120% iorate
- 64K Sequential Read: 100% Read, 32 threads, 0-120% iorate
- 64K Sequential Write: 100% Write, 16 threads, 0-120% iorate
- 4K, 8K, and 16K 70R/30W Random Mix, 64 threads, 0-120% iorate
- Synthetic Database: SQL and Oracle
- VDI Full Clone and Linked Clone Traces
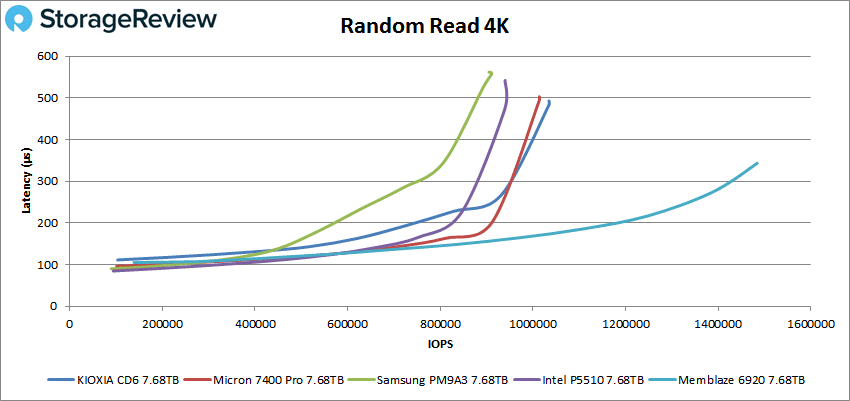
In our first VDBench Workload Analysis, Random 4K Read, the KIOXIA CD6 had a peak performance of 1.03 million IOPS at a latency of 492.6µs, placing 2nd among the tested drives.
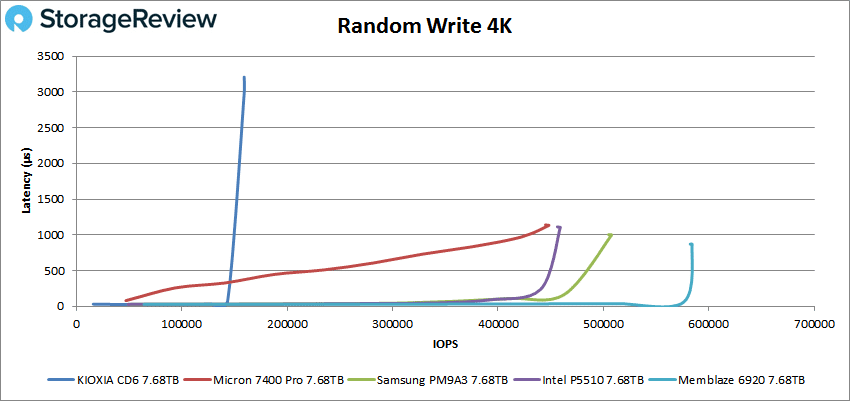
 In 4K random write, the CD6 fell to last place by a large margin, peaking at 159K IOPS with a latency of 3,207µs.
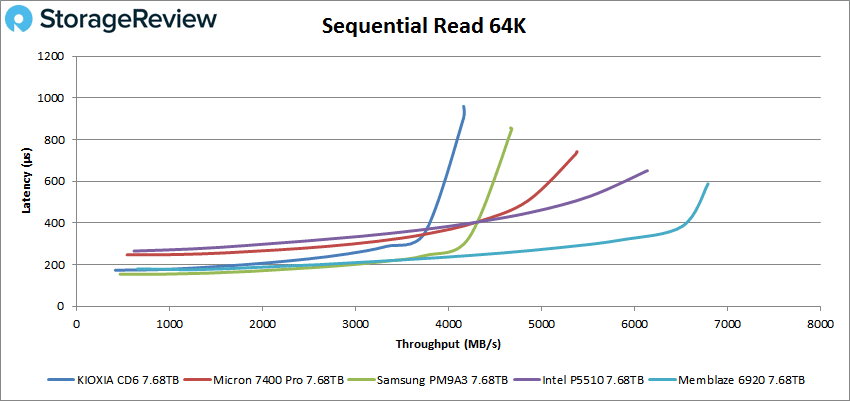
Switching over to 64k sequential workloads, the CD6 was last again, posting 4.16GB/s read (66,563 IOPS) at 960µs in latency in reads.
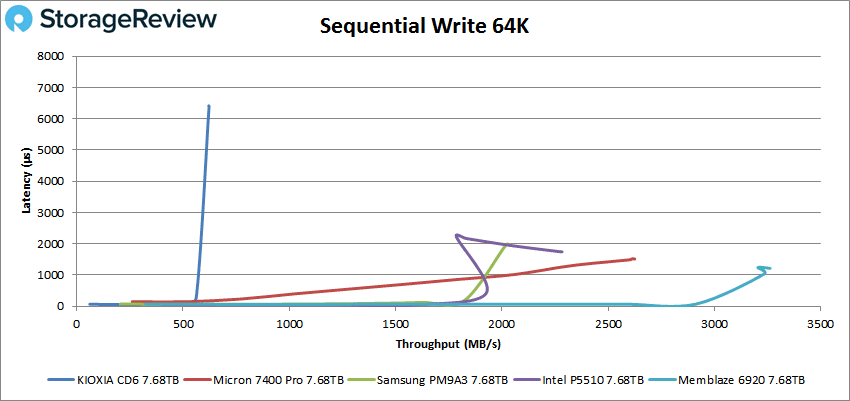
In 64K write, the CD6 performed peaked at 623MB/s (9,970 IOPS) with a latency of 6,382µs.
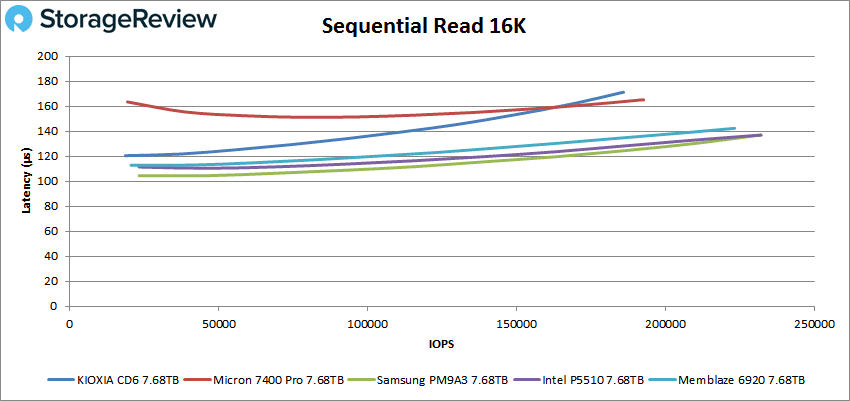
Next up is our 16K sequential performance. In reads, the CD6 posted a peak of 2.9GB/s (185,854 IOPS) 171.1µs in latency.
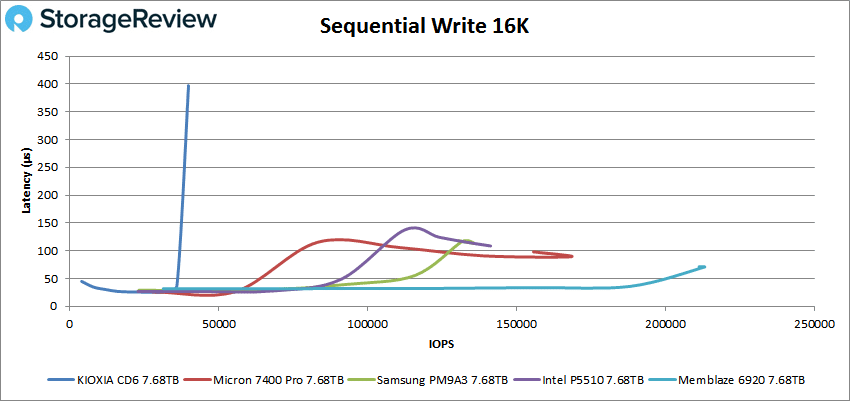
The KIOXIA drive continued its weak write performance in 16K sequential, peaking at just 40K IOPS (623MB/s) with a latency of 396µs.
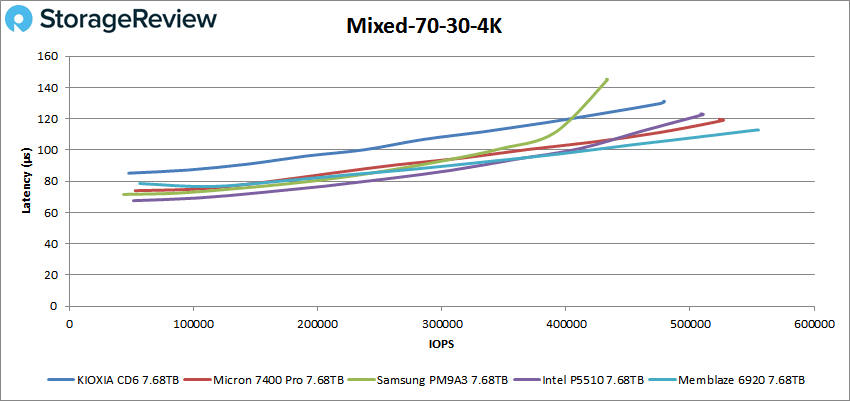
In our mixed 70/30 4k profile (70% read, 30% write), the CD6 placed second last with a peak of 479,356 IOPS at 131µs in latency.
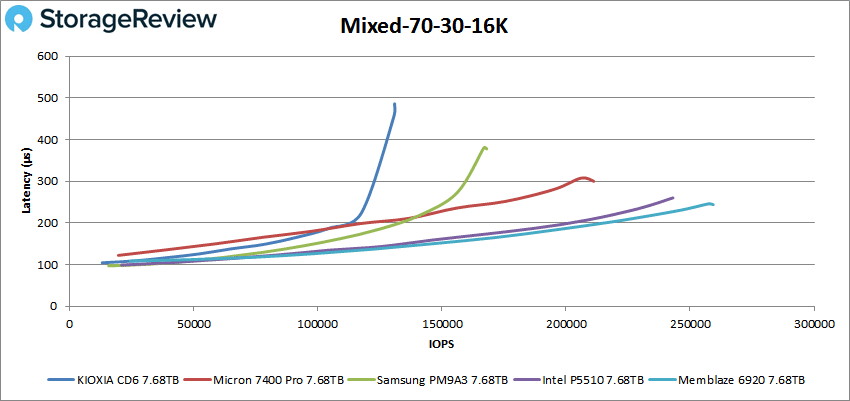
In our mixed 70/30 16k profile, the CD6 hit 130,996 IOPS at 485.8µs in latency placing last.
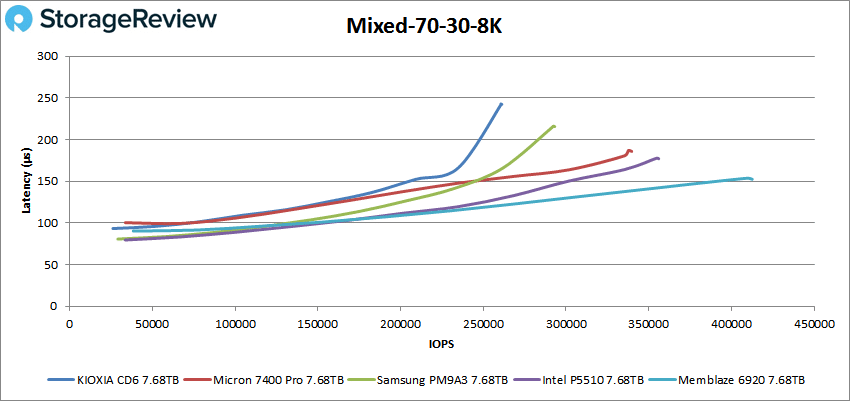
In our last mixed profile (70/30 8k), the CD6 peaked at 260,802 IOPS with a latency of 242.3µs.
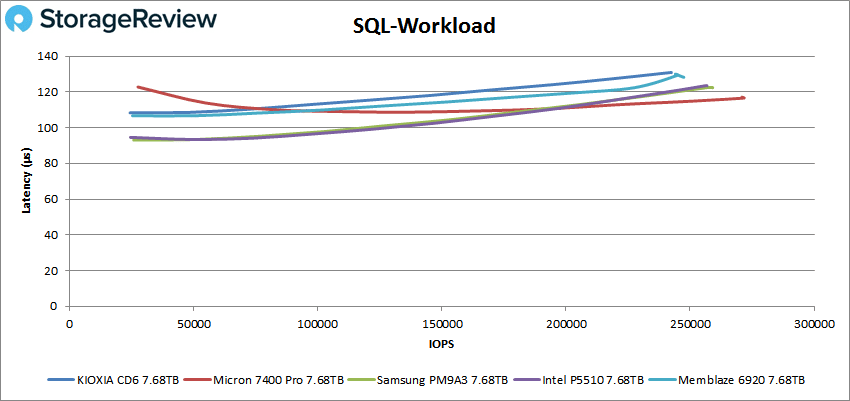
Our next set of tests is our SQL workloads: SQL, SQL 90-10, and SQL 80-20, all of which showed similar results. Starting with SQL, the KIOXIA drive placed a little behind the pack with a peak performance of 244K IOPS at a latency of 130µs.
SQL 90-10 saw similar performance between the top 4 drives; however, the CD6 trailed the pack slightly again, peaking at 237K IOPS at a latency of 133.2µs.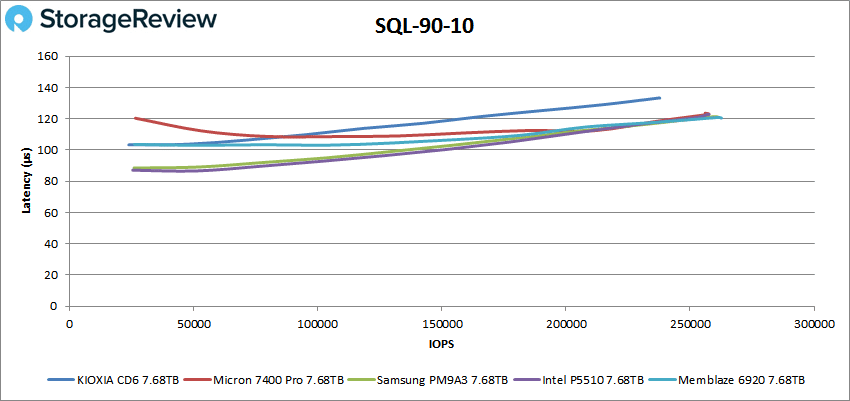
With SQL 80-20, the CD6 trailed once again, peaking at 231K IOPS at a latency of 136.2µs.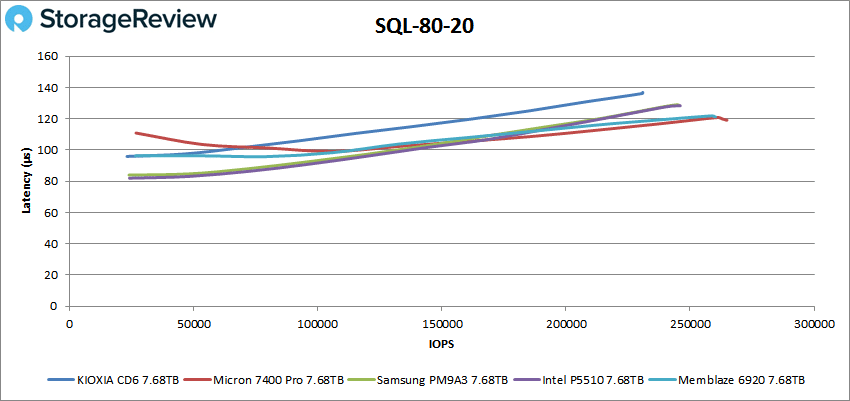
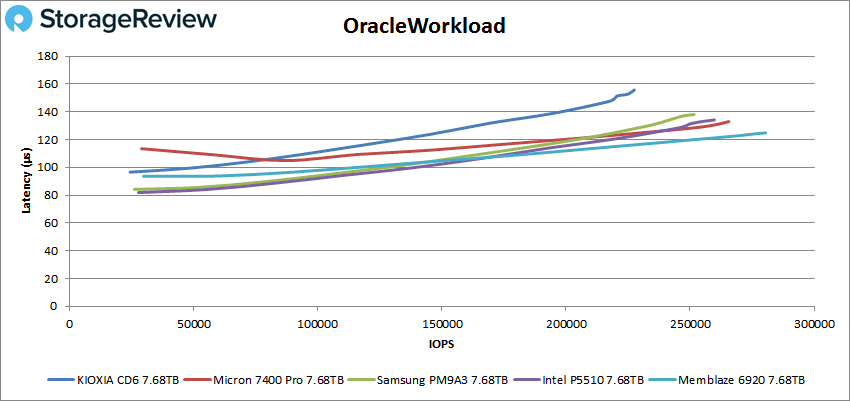
Next up are our Oracle workloads: Oracle, Oracle 90-10, and Oracle 80-20. Like with the SQL benchmarks, the CD6 continued to finish slightly back from the rest of the tested drives. Starting with Oracle, the CD6 had a peak performance of 228K IOPS at 155.8µs.
For Oracle 90-10, the CD6 peaked at 183K IOPS with 119µs in latency.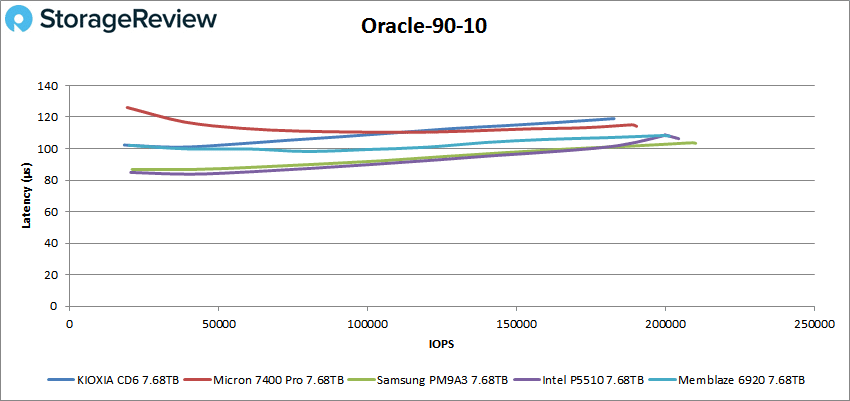
Looking at Oracle 80-20, the CD6 took posted a peak performance of 185K IOPS at 117.8µs.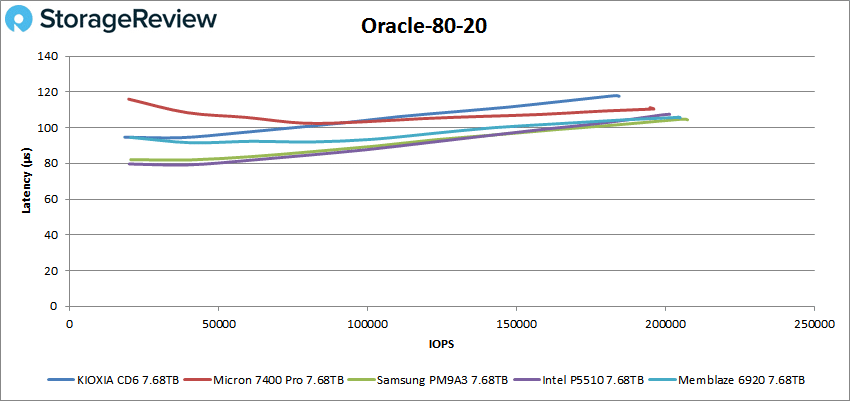
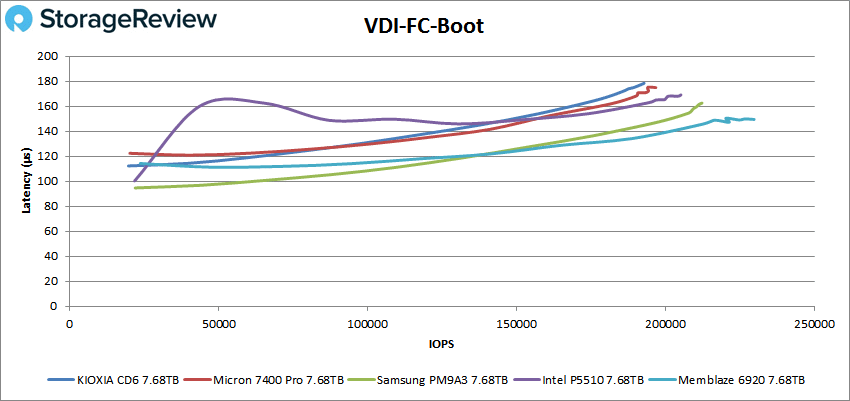
Next, we switched over to our VDI clone test, Full and Linked. For VDI Full Clone (FC) Boot, the CD6 started off well but ended trailing the pack once again, peaking at 192K IOPS with a latency of 175.2µs.
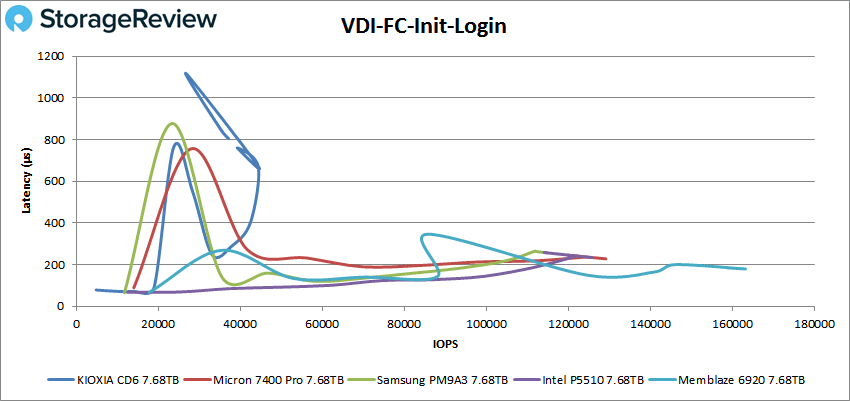
VDI FC Initial Login, the CD6 fell behind with fairly big spikes and fell off the leaderboard when approaching the 40K IOPS mark. It managed to peak at 44K IOPS (671µs) before taking hits in performance at the end.
With VDI FC Monday Login, the KIOXIA CD6 placed well back from the rest of the tested drives with 52K IOPS at a latency of 286.3µs.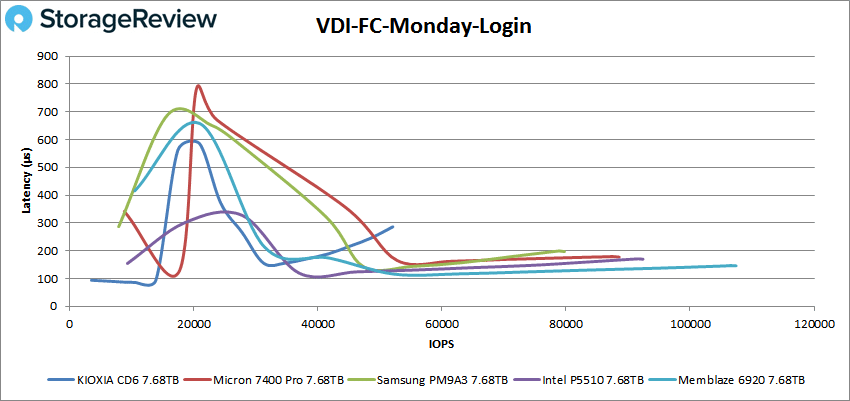
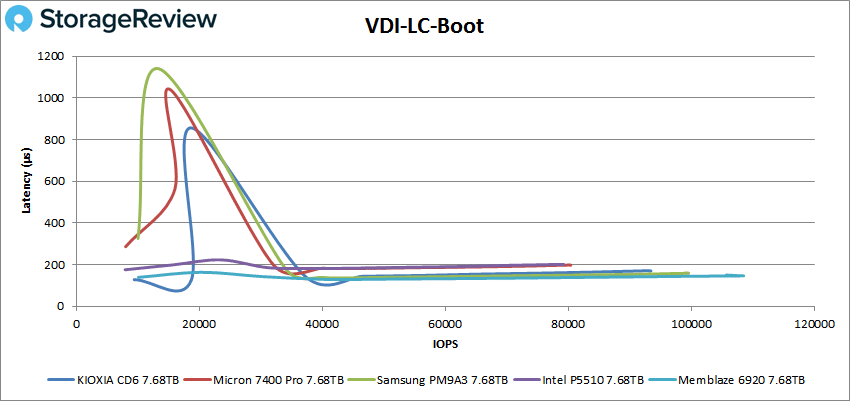
For VDI Linked Clone (LC) Boot, the CD6 performance took a big spike in latency (similar to the Micron Pro drive), though it leveled out around 40K IOPS. It eventually peaked at a solid 93K IOPS with 170.3µs.
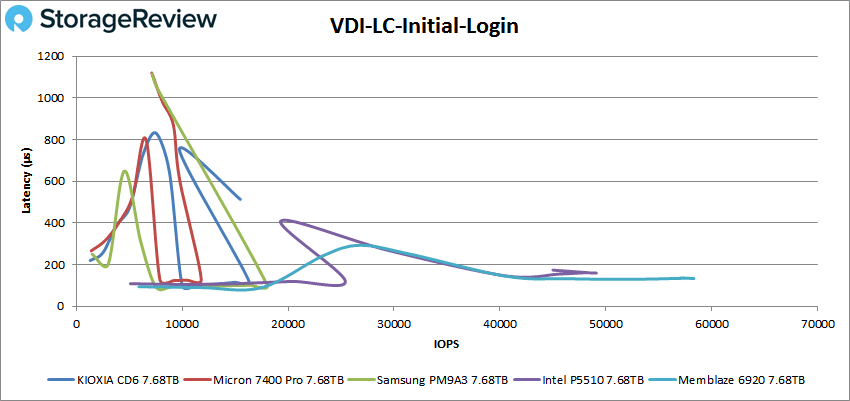
In VDI LC Initial Login, the CD6’s performance struggled right off the start, just like the Samsung, and Micron drives. It eventually peaked at just 16K IOPS with 513.2µs, which was good enough for 3rd place but still well back from the Memblaze and Intel drives.
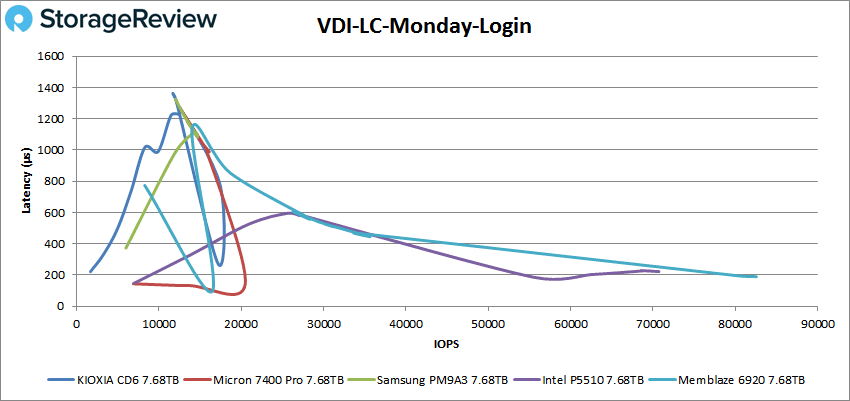
For VDI LC Monday Login, the CD6 continued its struggles (like the Samsung and Micron drives, again), peaking around 18K IOPS but eventually ending at 12K IOPS with a latency of 1,363 µs.
Conclusion
The KIOXIA CD6 is a single drive write per day NVMe TLC SSD, and was one of the first enterprise drives to leverage the PCIe 4.0 interface. It comes in the 2.5-inch 15mm Z-height form factor, features KIOXIA BiCS FLASH 96-layer 3D TLC NAND, and is available in a wide range of capacities from 960GB to 15.36TB. It also comes with a range of security options.
For performance, the KIOXIA CD6 had strong application performance in our tests, although was weaker in write-focused benchmarks. We tested the KIOXIA drive against four other PCIe Gen4 enterprise 7.68TB SSDs with similar specifications and applications: the Samsung PM9A3, Memblaze 6920, and Intel P5510, and the most recent of the bunch, Micron 7400 Pro. We looked at both application workload analysis and VDBench workloads during our analysis.
In our Sysbench tests, we saw the KIOXIA CD6 performed very well with aggregate scores of 10,975 TPS, 11.66ms in average latency, and 22.81ms in a worst-case scenario. Results were fantastic during our SQL Server transactional benchmark, posting 12,651.5TPS and an average latency of 2.3ms.
Switching over to VDBench, the KIOXIA CD6 showed uneven performance, especially struggling in writes. Highlights include 1.03 million IOPS read and 159K IOPS write in our 4k workloads, while hitting 4.16GB/s in 64K read, 623MB/s in 64K write, 2.9GB/s read in 16K read, 2.6GB/s in 623MB/s again in writes, during our sequential workloads. Our mixed 70/30 profiles recorded 479K IOPS in 4K, 261K IOPS in 8K, and 131K IOPS in 16K.
In our SQL testing, the CD6 saw peaks of 244K IOPS, 237K IOPS in SQL 90-10, and 231K IOPS in SQL 80-20, falling behind the pack throughout. Oracle workloads told a similar story, recording 228K IOPS, 183K IOPS in Oracle 90-10, and 185K IOPS in Oracle 80-20.
Next up were our VDI Clone tests, Full and Linked. In Full Clone, we saw 192K IOPS in boot, 44K IOPS in Initial Login (though with performance huge spikes afterward), and 52K IOPS in Monday Login. In Linked Clone, the KIOXIA drive struggled again, showing a peak of 93K IOPS in boot and just 12K IOPS in Monday Login. Initial Login peaked at 16K IOPS (3rd place), though it was still well behind the Intel and Memblaze drives.
Overall we were happy to revisit the CD6 as found in the channel, with a more mature firmware build. But in the end the write performance doesn’t hang that well against its competitors.


 Amazon