

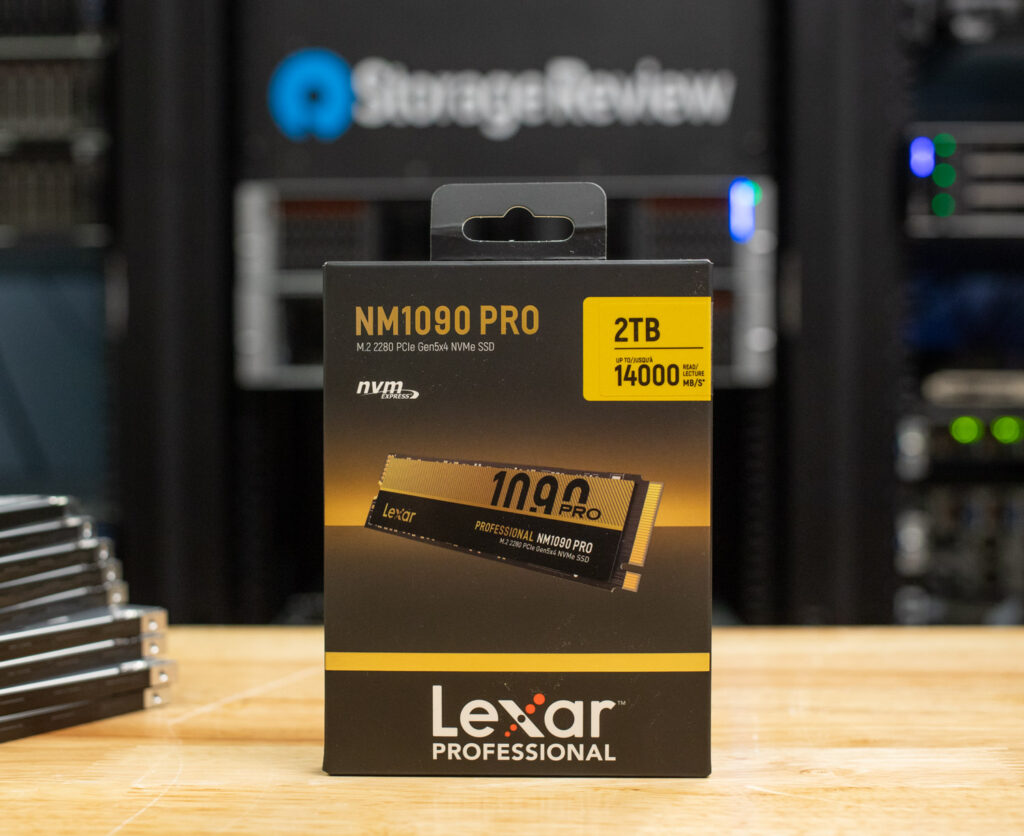
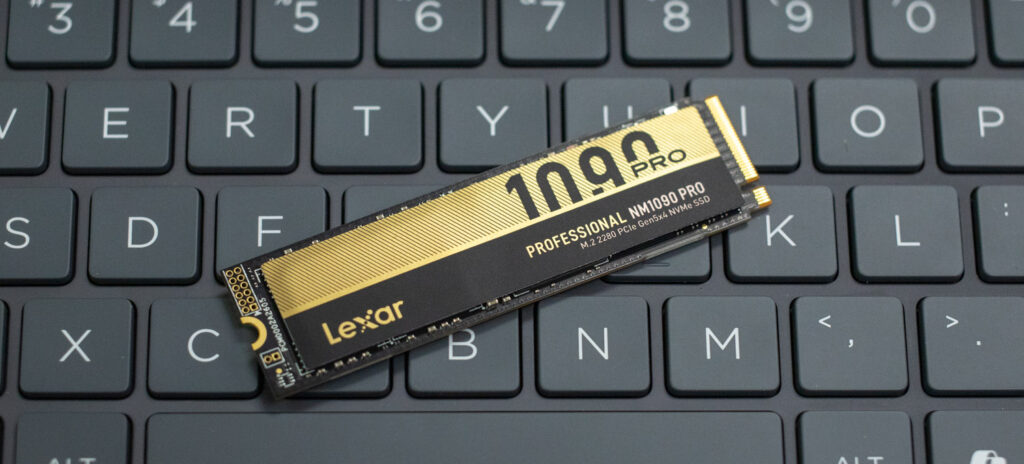
The Lexar Professional NM1090 PRO marks the company’s entry into the fast-evolving PCIe Gen5 NVMe SSD market, as adoption of the interface is finally gaining momentum in the consumer and prosumer markets. Aimed at users with high-performance demands, it is offered in 1TB and 2TB capacities (with a 4TB model to be introduced at a later date), and joins a growing field of Gen5 drives that we’ve recently tested. While Lexar markets the NM1090 PRO for use cases such as AI workloads, real-time rendering, and gaming with DirectStorage, we will examine its performance under practical, measured workloads.
At this point, however, it’s becoming increasingly complex to distinguish many of these Gen5 drives from one another. Most of them offer similar specs and features, including DirectStorage support, and performance levels that, outside of specific edge cases, aren’t all that distinguishable in day-to-day use. What that means is the decision often comes down to price and whether you’re willing to pay a premium for a few percentage points of extra speed. That’s where drives like the NM1090 PRO might manage to set themselves apart, if only by a small margin.
Lexar Professional NM1090 PRO Features
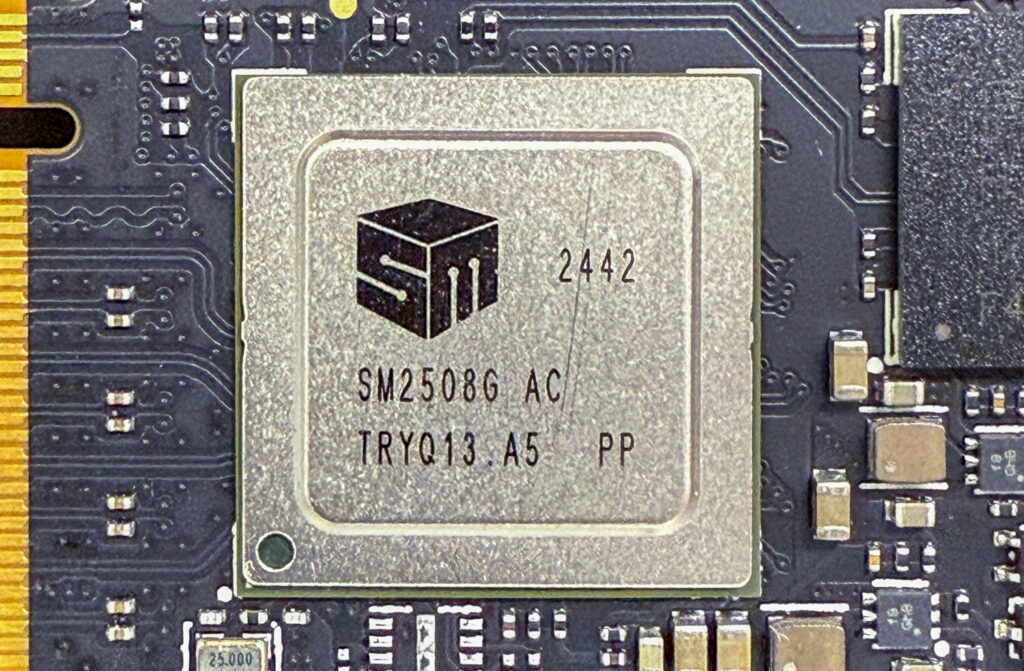
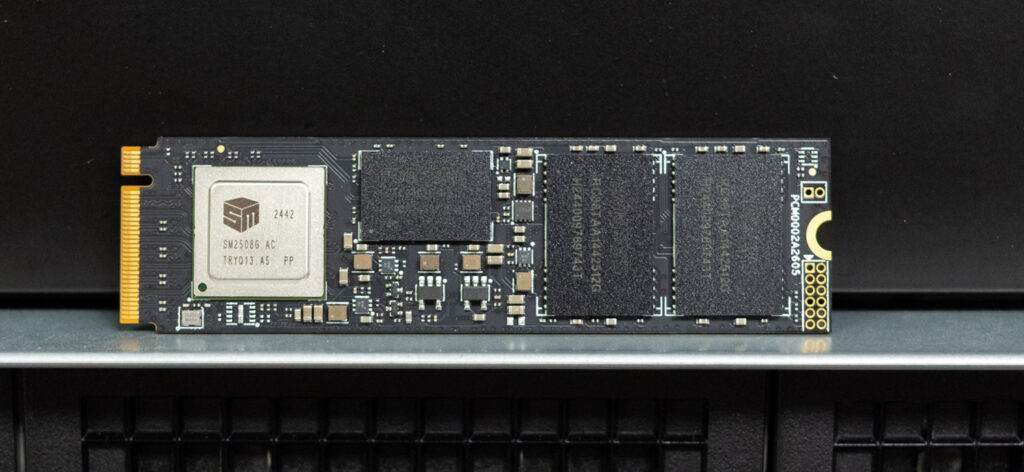
Lexar is utilizing a 6nm Silicon Motion SM2508 controller for its new Gen5 drive, which offers improved thermal efficiency compared to its older 12nm counterparts. According to Lexar, this results in 36% lower peak temperatures under heavy loads; however, this isn’t a guarantee. Underneath the heatsink, the drive features 3D TLC NAND. This is backed by a DRAM cache and SLC caching layer, which are essential for sustaining performance during high-throughput or mixed workload scenarios.
In terms of potential performance numbers, the 1TB model is slightly limited compared to the higher capacities, offering a maximum write speed of 10,000MB/s and lower IOPS (1650K read /1800K write). The 2TB and 4TB models unlock the full 13,000MB/s sequential write ceiling and achieve up to 2,100K read IOPS. The 4TB model experiences a slight drop in write IOPS (1,700K). Overall, these specs suggest that the 2TB version may offer the best balance of cost, peak performance, and endurance.
Like other Gen5 drives we’ve tested, the NM1090 PRO includes support for Microsoft DirectStorage, a welcome addition for gamers on modern Windows systems. When used in games that support it, DirectStorage can help reduce asset load times and CPU overhead, especially when combined with GPU decompression. The upcoming performance charts will provide more details.
For durability, Lexar lists respectable endurance ratings across capacities: 700 TBW for the 1TB model, 1400 TBW for the 2TB model, and 2800 TBW for the 4TB model. These are competitive figures that place the NM1090 PRO in line with other Gen5 consumer SSDs. It is also rated for an MTBF of 1.5 million.
Backed by a 5-year warranty, the Lexar NM1090 PRO is currently available in capacities of 1TB ($139) and 2TB ($225) at the time of this review. This review focuses on the 2TB model.
Lexar Professional NM1090 PRO Specifications
| Feature | Detail |
| Form Factor | M.2 2280 |
| Interface | PCIe Gen5x4 |
| Performance (Sequential Read) | Up to 14,000MB/s (2TB/4TB) Up to 11,700MB/s (1TB) |
| Performance (Sequential Write) | Up to 13,000MB/s (2TB) Up to 12,000MB/s (4TB) Up to 10,000MB/s (1TB) |
| Random Read (IOPS) | Up to 2,100K IOPS (2TB) Up to 1,650K IOPS (1TB) |
| Random Write (IOPS) | Up to 2,000K IOPS (2TB) Up to 1,800K IOPS (1TB) Up to 1,700K IOPS (4TB) |
| Capacity | 1TB, 2TB, 4TB |
| NAND Type | 3D TLC |
| Controller | Silicon Motion SM2508 (6nm) |
| Endurance (TBW) | 700 TBW (1TB) 1400 TBW (2TB)2800 TBWW (4TB) |
| MTBF | 1.5 million hours |
| Operating Temperature | 0°C to 70°C |
| Shock Resistance | 1500G, duration 0.5ms, Half Sine Wave |
| Software Support | Lexar DiskMaster SSD Tool |
| Warranty | 5-Year Limited Warranty |
Lexar DiskMaster SSD Management Tool Overview
Lexar’s DiskMaster is an easy-to-use SSD utility that gives users the tools they need to monitor and manage their Lexar NVMe drives. It’s not overloaded with extras, but it focuses on doing the basics well, allowing users to view drive health, securely erase data, and run simple performance tests. Lexar also utilizes this tool as its primary channel for distributing firmware updates.
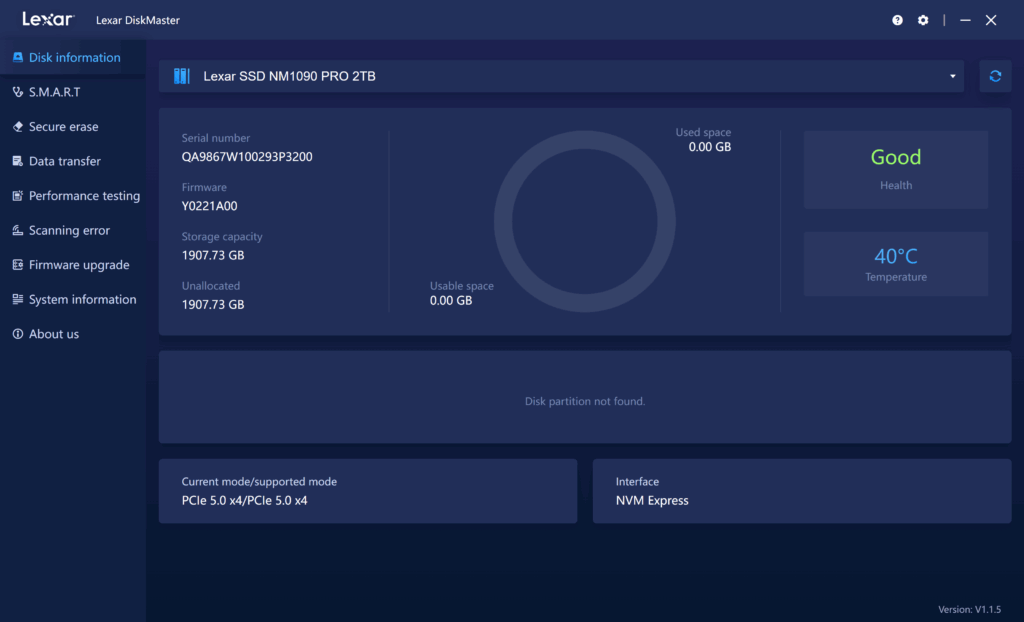
The interface is clean and modern, with a dark theme that’s easy on the eyes and well-organized. The main dashboard displays all information at a glance, including serial number, firmware version, capacity, and current temperature (in this case, a cool 40°C). It also confirms that the drive is running at PCIe 5.0 x4 speeds with NVMe, which is helpful for users who want to verify they’re achieving full Gen5 performance. The health status is easily visible on the right, providing immediate peace of mind, especially when installing or migrating a new drive.
The left-hand sidebar organizes features into intuitive categories:
- S.M.A.R.T.: Displays key health indicators and usage metrics.
- Secure Erase: Enables complete data wiping for enhanced privacy or reuse.
- Data Transfer: Intended for cloning or migrating OS/data between drives.
- Performance Testing: Basic read/write benchmarking, useful for verifying drive health or speed post-installation.
- Scanning Error: Scans for errors or bad blocks.
- Firmware Upgrade: Allows users to update to the latest firmware version directly.
- System Information: Displays your system details.
While it may not offer extensive customization options, features like Samsung Magician and Lexar DiskMaster cover the essentials well, and its intuitive layout makes it accessible to even less experienced users.
Lexar Professional NM1090 PRO Performance
Comparables
Before diving into the benchmarks, here’s a list of comparable drives tested alongside the Lexar Professional NM1090 PRO and their respective PCIe generation:
- SK hynix Platinum P51 (PCIe Gen5)
- Kingston FURY Renegade G5 (PCIe Gen5)
- SanDisk WD_BLACK SN8100 (PCIe Gen5)
- Crucial T705 (PCIe Gen5)
- Crucial P510 (PCIe Gen5)
- Samsung 9100 Pro 4TB (PCIe Gen5)
- Samsung 990 Pro (PCIe Gen4)
- WD SN850X (PCIe Gen4)
For this review, we’ll focus on the 2TB model of the Lexar Professional NM1090 PRO.
We subjected these drives to various tests to evaluate their real-world and synthetic performance. This includes LLM load times to measure how quickly they handle large AI models, DirectStorage tests to assess how fast they load game assets and process in-game data, and Blackmagic Design tests to evaluate read and write speeds for high-resolution video editing. We’ll also run PCMark10 to gauge overall system responsiveness, 3DMark Storage to test gaming performance, and FIO tests to measure peak sequential and random read/write speeds under heavy workloads.
Here’s the high-performance test rig we used for benchmarking:
- CPU: AMD Ryzen 7 9800X3D
- Motherboard: Asus ROG Crosshair X870E Hero
- RAM: G.SKILL Trident Z5 Royal Series DDR5-6000 (2x16GB)
- GPU: NVIDIA GeForce RTX 4090
- OS: Windows 11 Pro, Ubuntu 24.10 Desktop
Peak Synthetic Performance
The FIO test is a flexible and powerful benchmarking tool used to measure the performance of storage devices, including SSDs and HDDs. It evaluates metrics such as bandwidth, IOPS (Input/Output Operations Per Second), and latency under different workloads, like sequential and random read/write operations. This test helps to assess the peak performance of storage systems, making it useful for comparing different devices or configurations. We measured the peak burst performance for this test, limiting the workload to a 10GB footprint on both SSDs.
Here, the Lexar Professional NM1090 PRO delivered strong overall results, though it doesn’t quite top the charts in any single category. Starting with sequential 128K reads, Lexar reached 13,800MB/s with an average latency of 0.61ms. This places it just below most of the other Gen5 contenders, like the SanDisk SN8100, which leads the chart at 15,000MB/s, and the Kingston FURY Renegade and Samsung 9100 Pro, both at 14,600MB/s. On the write side, Lexar posted 13,600MB/s, which is notably higher than the Crucial T705 (12,300MB/s) and slightly behind the SN8100’s 14,100MB/s (again, a strong result, but a few hundred MB/s shy of the front-runners).
Where Lexar differentiates itself more is in the 4K random workloads. It scored 2.073 million IOPS for 4K reads and 2.215 million IOPS for 4K writes. These are respectable mid-pack numbers for Gen5 drives. Lexar edges out the Kingston Renegade on both fronts and performs closely to the SK hynix Platinum P51 in reads. Still, it trails behind the Samsung 9100 Pro (which tops the list at 2.734M in both read and write) and even the Crucial T705, which posted a slightly lower read IOPS but one of the highest write results at 2.703M IOPS. Latency on the Lexar was also somewhat higher than ideal: 0.32ms for reads and 0.23ms for writes, with its read latency being the highest among the Gen5 competitors here.
| FIO Test (higher MB/s/IOPS is better) | Sequential 128K Read (1T/64Q) | Sequential 128K Write (1T/64Q) | Random 4K Read (16T/32Q) | Random 4K Write (16T/32Q) |
| SanDisk SN8100 | 15,000 MB/s (0.56ms avg latency) | 14,100 MB/s (0.59ms avg latency) | 2.312M IOPS (0.22ms avg latency) | 2.144M IOPS (0.24ms avg latency) |
| Kingston FURY Renegade G5 | 14,600 MB/s (0.57ms avg latency) | 14,100 MB/s (0.59ms avg latency) | 2.028M IOPS (0.25ms avg latency) | 2.028M IOPS (0.25ms avg latency) |
| Samsung 9100 Pro 4TB | 14,600 MB/s (0.57ms avg latency) | 13,300 MB/s (0.63ms avg latency) | 2.734M IOPS (0.18ms avg latency) | 2.734M IOPS (0.19ms avg latency) |
| SK hynix Platinum P51 | 14,500 MB/s (0.58ms avg latency) | 13,500 MB/s (0.62ms avg latency) | 2.369M IOPS (0.22ms avg latency) | 2.669M IOPS (0.19ms avg latency) |
| Crucial T705 2TB | 14,400 MB/s (0.58ms avg latency) | 12,300 MB/s (0.68ms avg latency) | 1.585M IOPS (0.32ms avg latency) | 2.703M IOPS (0.19ms avg latency) |
| Lexar Professional NM1090 PRO | 13,800GB/s (0.61ms avg latency) | 13,600 MB/s (0.62ms avg latency) | 2.073M IOPS (0.32ms avg latency) | 2.215M IOPS (0.23ms avg latency) |
| Crucial P510 1TB | 8,835 MiB/s (0.90 ms avg latency) | 9,961 MiB/s (0.80 ms avg latency) | 1.163M IOPS (0.44ms avg latency) | 1.196M IOPS (0.51ms avg latency) |
| Samsung 990 Pro 2TB | 7,483 MB/s (1.12ms avg latency) | 7,197 MB/s (1.16ms avg latency) | 1.400M IOPS (0.36ms avg latency) | 1.403M IOPS (0.36ms avg latency) |
| WD SN850X 2TB | 6,632 MB/s (0.76ms avg latency) | 7,235 MB/s (0.92ms avg latency) | 1.2M IOPS (0.43ms avg latency) | 825K IOPS (0.62ms avg latency) |
Average LLM Load Time
The Average LLM Load Time test evaluated the load times of three different LLMs: DeepSeek R1 7B, Meta Llama 3.2 11B, and DeepSeek R1 32B. Each model was tested 10 times, and the average load time was calculated. This test measures the drive’s ability to load large language models (LLMs) into memory quickly. LLM load times are critical for AI-related tasks, especially for real-time inference and extensive dataset processing. Faster loading enables the model to process data rapidly, thereby improving AI responsiveness and reducing waiting time.
The Lexar Professional NM1090 PRO posted noticeably slower results than its Gen5 comparables, particularly when loading the larger DeepSeek R1 32B model, where it recorded an average time of 7.21 seconds (the highest in the group by a significant margin). It also trailed behind in the 11B and 7B model loads, with 4.95s and 3.21s, respectively, placing it at the bottom of this chart across all three models.
In most real-world scenarios, the LLM load time differences measured here may be noticeable depending on your specific use case.
| Average LLM Load Time (lower is better) | DeepSeek R1 7B | Meta Llama 3.2 11B Vision | DeepSeek R1 32B |
| SK hynix Platinum P51 | 2.5481s | 3.5809s | 4.1790s |
| SanDisk SN8100 | 2.5702s | 3.5856s | 4.2870s |
| Samsung 9100 Pro 4TB | 2.6173s | 3.6017s | 4.3735s |
| Crucial T705 2TB | 2.8758s | 3.6312s | 5.1080s |
| Samsung 990 Pro 2TB | 2.8758s | 3.6312s | 5.1080s |
| Crucial P510 1TB | 2.8817s | 3.6631s | 5.0594s |
| WD SN850X 2TB | 3.0082s | 3.6543s | 5.4844s |
| Kingston FURY Renegade G5 | 3.1843s | 4.8009s | 4.6523s |
| Lexar Professional NM1090 PRO | 3.2135s | 4.9504s | 7.2108s |
3DMark Direct Storage
The 3DMark DirectStorage Feature Test evaluates how Microsoft’s DirectStorage optimizes game asset loading on PCIe SSDs. By reducing CPU overhead and improving data transfer speeds, DirectStorage enhances loading times, especially when paired with GDeflate compression and Windows 11’s BypassIO. This test isolates storage performance to highlight the potential bandwidth improvements when DirectStorage is enabled.
Here, Lexar Professional NM1090 PRO delivers decent performance, though it consistently places in the middle to lower tier of Gen5 competitors. Its compressed asset transfer rate to VRAM (24.03GB/s) is slightly behind that of leaders like the SK hynix P51 and SanDisk SN8100.
In uncompressed transfers with DirectStorage enabled, Lexar posts 11.23GB/s (which is roughly the group average) while falling to 7.57GB/s with DirectStorage disabled, a slight dip that’s in line with most drives tested. RAM transfer speeds are decent at 12.18GB/s (DS on), keeping Lexar competitive for gaming workloads that use memory staging. However, its GDeflate decompression bandwidth (63.15GB/s) is the lowest among all comparables.
| 3DMark Direct Storage, (GB/s, higher is better) | Storage to VRAM (GDeflate Compression) | Storage to VRAM (DirectStorage on, Uncompressed) | Storage to VRAM (DirectStorage off, Uncompressed) | Storage to RAM (DirectStorage on, Uncompressed) | Storage to RAM (DirectStorage off, Uncompressed) | GDeflate Decompression Bandwidth |
| SK hynix Platinum P51 | 26.32 | 11.20 | 7.75 | 12.85 | 9.46 | 64.68 |
| SanDisk SN8100 | 26.11 | 12.94 | 7.63 | 12.94 | 9.78 | 64.51 |
| Crucial T705 2TB | 25.75 | 10.71 | 8.79 | 12.03 | 8.83 | 66.36 |
| Lexar Professional NM1090 PRO | 24.03 | 11.23 | 7.57 | 12.18 | 8.72 | 63.15 |
| Samsung 9100 Pro 4TB | 23.77 | 11.26 | 8.92 | 11.62 | 9.48 | 66.61 |
| Kingston FURY Renegade G5 | 23.29 | 10.03 | 7.44 | 11.81 | 9.63 | 65.79 |
| WD SN850X 2TB | 15.28 | 11.11 | 8.93 | 6.78 | 6.27 | 64.96 |
| Samsung 990 Pro 2TB | 14.18 | 11.28 | 8.84 | 6.57 | 6.20 | 65.71 |
| Crucial P510 1TB | 19.63 | 8.33 | 6.92 | 9.06 | 7.49 | 66.22 |
Blackmagic Disk Speed Test
The Blackmagic Disk Speed Test benchmarks a drive’s read and write speeds, estimating its performance, especially for video editing tasks. It helps users ensure their storage is fast enough for high-resolution content, like 4K or 8K video.
The Lexar Professional NM1090 PRO delivers excellent write performance, reaching 10,466.6MB/s (one of the highest results in the lineup and just behind the Kingston FURY Renegade’s class-leading write score). Its read speed comes in at 9,149.2MB/s, which is solid but slightly lower than the top Gen5 performers, such as the SN8100 and 9100 Pro. This makes Lexar well-suited, like all Gen5 drives we’ve tested, for demanding video workloads, including high-bitrate 8K capture, real-time editing of RAW footage, and fast rendering pipelines.
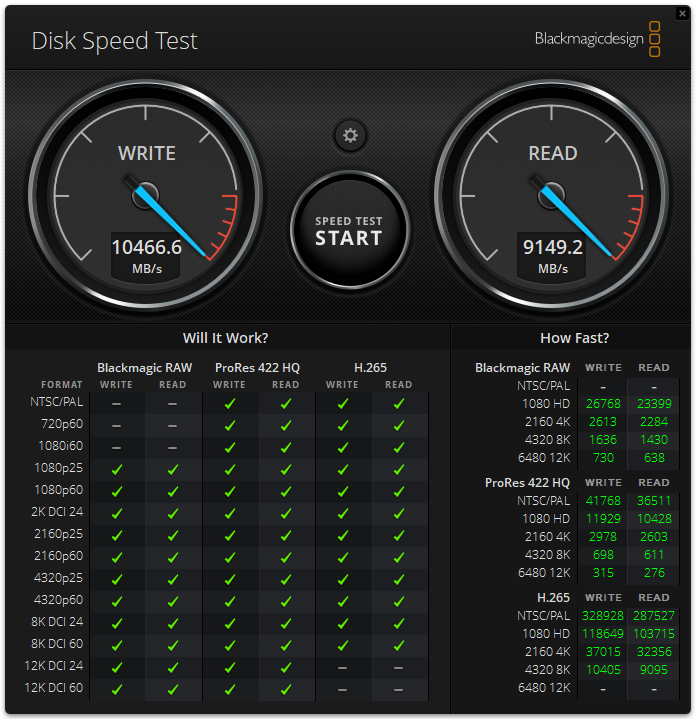
Nonetheless, the NM1090 PRO offers a significant improvement in both read and write speeds compared to Gen4 drives, such as the Samsung 990 Pro and SN850X.
| Blackmagic Disk Speed (MB/s, higher is better) | Read MB/s | Write MB/s |
| SanDisk SN8100 | 10,005.2 | 10,581.0 |
| Kingston FURY Renegade G5 | 9,665.0 | 10,831.0 |
| Samsung 9100 Pro 4TB | 9,542.3 | 9,907.9 |
| SK hynix Platinum P51 | 9,241.0 | 9,109.0 |
| Lexar Professional NM1090 PRO | 9,149.2 | 10,466.6 |
| Crucial T705 2TB | 8,464.2 | 10,256.4 |
| Crucial P510 1TB | 7,853.9 | 7,939.6 |
| WD SN850X 2TB | 5,862.6 | 5,894.8 |
| Samsung 990 Pro 2TB | 5,769.5 | 5,842.9 |
PCMark10 Storage
PCMark10 Storage Benchmarks evaluate real-world storage performance using application-based traces. They test the system and data drives, measuring bandwidth, access times, and consistency under load. These benchmarks offer practical insights beyond synthetic tests, enabling users to compare modern storage solutions effectively.
Results for the Lexar Professional NM1090 PRO showed a solid score of 8,247, placing it near the top of the Gen5 field, just behind leaders like the Crucial T705 (8,783) or SK hynix P51 (8,665). Although not noted in the table below, it had a high bandwidth figure of 1,167.63MB/s and a low average access latency of just 18μs.
| PCMark10 Data Drive (higher is better) | Overall Score |
| Crucial T705 2TB | 8,783 |
| SK hynix Platinum P51 | 8,665 |
| SanDisk SN8100 | 8,644 |
| Lexar Professional NM1090 PRO | 8,247 |
| Kingston FURY Renegade G5 | 8,062 |
| Samsung 9100 Pro 4TB | 7,552 |
| Samsung 990 Pro 2TB | 7,173 |
| Crucial P310 2TB | 6,436 |
| WD SN850X 2TB | 4,988 |
3DMark Storage
The 3DMark Storage Benchmark tests your SSD’s gaming performance by measuring tasks like loading games, saving progress, installing game files, and recording gameplay. It evaluates how well your storage handles real-world gaming activities and supports the latest storage technologies for accurate performance insights.
Here, the Lexar Professional NM1090 PRO delivered a score of 4,828, positioning it right in the middle of the tested drives. It trails higher-performing models like the SanDisk SN8100 (6,047) and Kingston FURY Renegade G5 (5,670), but it still manages to outperform the Samsung 9100 Pro, Crucial P510, and all tested Gen4 entries.
For typical gamers, this difference won’t noticeably affect load times or responsiveness; however, those seeking the fastest possible experience with technologies like DirectStorage may want to consider the SanDisk model.
| 3DMark Storage benchmark (higher is better) | Overall Score |
| SanDisk SN8100 | 6,047 |
| Kingston FURY Renegade G5 | 5,670 |
| Crucial T705 2TB | 5,100 |
| SK hynix Platinum P51 | 5,082 |
| Lexar Professional NM1090 PRO | 4,828 |
| Samsung 9100 Pro 4TB | 4,779 |
| Crucial P510 1TB | 4,148 |
| Samsung 990 Pro 2TB | 4,128 |
| WD SN850X 2TB | 3,962 |
| Crucial P310 2TB | 3,848 |
GPU Direct Storage
One of the tests we conducted on this testbench was the Magnum IO GPU Direct Storage (GDS) test. GDS is a feature developed by NVIDIA that allows GPUs to bypass the CPU when accessing data stored on NVMe drives or other high-speed storage devices. Instead of routing data through the CPU and system memory, GDS enables direct communication between the GPU and the storage device, significantly reducing latency and improving data throughput.
How GPU Direct Storage Works
Traditionally, when a GPU processes data stored on an NVMe drive, the data must first travel through the CPU and system memory before reaching the GPU. This process introduces bottlenecks, as the CPU becomes a middleman, adding latency and consuming valuable system resources. GPU Direct Storage eliminates this inefficiency by enabling the GPU to access data directly from the storage device via the PCIe bus. This direct path reduces the overhead associated with data movement, allowing faster and more efficient data transfers.
AI workloads, especially those involving deep learning, are highly data-intensive. Training large neural networks requires processing terabytes of data, and any delay in data transfer can lead to underutilized GPUs and longer training times. GPU Direct Storage addresses this challenge by ensuring that data is delivered to the GPU as quickly as possible, minimizing idle time and maximizing computational efficiency.
In addition, GDS is particularly beneficial for workloads that involve streaming large datasets, such as video processing, natural language processing, or real-time inference. By reducing the reliance on the CPU, GDS accelerates data movement and frees up CPU resources for other tasks, further enhancing overall system performance.
Results
The Lexar Professional NM1090 PRO showed solid performance across most block sizes, though with a notable drop in one specific write scenario. For 16K block sizes at high queue depth, it achieves a strong 3.6 GiB/s read (238.7K IOPS) and 2.3 GiB/s write (150.8K IOPS), which was right alongside the top Gen5 performers like the Kingston FURY Renegade.
At the 128K block size, read performance remains solid at 5.9 GiB/s (48.4K IOPS), but write performance drops to 4.2 GiB/s (34.4K IOPS), noticeably behind top competitors, which maintained 5.8 to 5.9 GiB/s.
For large 1M blocks, Lexar hits 6.5 GiB/s in reads and 6.2 GiB/s in writes (essentially on par with the rest of the top-tier drives in this test). Latency figures are also within expected Gen5 ranges. Overall, while the NM1090 PRO performs well in read-heavy GDS workloads and maintains its performance at large transfer sizes, its mid-range write throughput at the 128K level may have a slight impact on performance.
Here’s a full run-down:
| GDSIO Chart (16K,128K,1M Block Size Averages) | (16K Block Size 128 IO Depth) Average Read | (16K Block Size 128 IO Depth) Average Write | (128K Block Size 128 IO Depth) Average Read | (128K Block Size 128 IO Depth) Average Write | (1M Block Size 128 IO Depth) Average Read | (1M Block Size 128 IO Depth) Average Write |
| Kingston FURY Renegade G5 | 3.7 GiB/s (0.526ms) IOPS: 242.1K | 2.4 GiB/s (0.824ms) IOPS: 154.7K | 5.9 GiB/s (2.704ms) IOPS: 48.5K | 5.8 GiB/s (0.564ms) IOPS: 47.3K | 6.5 GiB/s (19.356ms) IOPS: 6.6K | 6.3 GiB/s (19.690ms) IOPS: 6.5K |
| Lexar Professional NM1090 PRO | 3.6 GiB/s (0.533ms) IOPS: 238.7K | 2.3 GiB/s (0.845ms) IOPS: 150.8K | 5.9 GiB/s (2.639ms) IOPS: 48.4K | 4.2 GiB/s (3.714ms) IOPS: 34.4K | 6.5 GiB/s (19.274ms) IOPS: 6.6K | 6.2 GiB/s (20.127ms) IOPS: 6.4K |
| SanDisk SN8100 | 3.4 GiB/s (0.564ms) IOPS: 225.9K | 2.1 GiB/s (0.907ms) IOPS: 140.6K | 5.9 GiB/s (2.626ms) IOPS: 48.7K | 5.8 GiB/s (2.668ms) IOPS: 47.9K | 6.5 GiB/s (19.264ms) IOPS: 6.6K | 5.9 GiB/s (21.063ms) IOPS: 6.1K |
| Samsung 9100 Pro 4TB | 3.4 GiB/s (0.565ms) IOPS: 226.4K | 2.3 GiB/s (0.839ms) IOPS: 161.7K | 5.2 GiB/s (3.001ms) IOPS: 44.9K | 5.9 GiB/s (2.662ms) IOPS: 47.3K | 6.3 GiB/s (19.877ms) IOPS: 6.4K | 6.1 GiB/s (20.579ms) IOPS: 6.2K |
| Crucial T705 2TB | 3.3 GiB/s (0.587ms) IOPS: 217.0K | 2.3 GiB/s (0.836ms) IOPS: 152.6K | 5.5 GiB/s (2.863ms) IOPS: 44.7K | 5.6 GiB/s (2.799ms) IOPS: 45.7K | 6.0 GiB/s (20.738ms) IOPS: 6.2K | 6.0 GiB/s (20.855ms) IOPS: 6.1K |
| SK hynix Platinum P51 | 3.1 GiB/s (0.634ms) IOPS: 200.9K | 1.5 GiB/s (1.314ms) IOPS: 97.2K | 5.6 GiB/s (2.781ms) IOPS: 46.0K | 3.9 GiB/s (4.014ms) IOPS: 31.9K | 6.2 GiB/s (20.126ms) IOPS: 6.4K | 4.2 GiB/s (29.576ms) IOPS: 4.3K |
| Samsung 990 Pro 2TB | 2.7 GiB/s (0.731ms) IOPS: 174.4K | 2.2 GiB/s (0.903ms) IOPS: 141.2K | 4.0 GiB/s (3.944ms) IOPS: 32.4K | 4.1 GiB/s (3.849ms) IOPS: 33.2K | 3.9 GiB/s (32.415ms) IOPS: 3.9K | 4.2 GiB/s (29.520ms) IOPS: 4.3K |
| Crucial P510 1TB | 2.3 GiB/s (0.837ms) IOPS: 152.2K | 2.3 GiB/s (0.842ms) IOPS: 151.5K | 4.5 GiB/s (3.450ms) IOPS: 37.1K | 4.8 GiB/s (3.262ms) IOPS: 39.2K | 4.8 GiB/s (26.2181ms) IOPS: 4.9K | 5.0 GiB/s (25.121ms) IOPS: 5.1K |
| WD SN850X 2TB | 2.3 GiB/s (0.736ms) IOPS: 173.2K | 2.0 GiB/s (0.989ms) IOPS: 129.0K | 4.1 GiB/s (3.878ms) IOPS: 33.3K | 4.0 GiB/s (3.958ms) IOPS: 33.0K | 4.4 GiB/s (30.501ms) IOPS: 4.5K | 4.1 GiB/s (30.782ms) IOPS: 4.2K |
Conclusion
Overall, the Lexar Professional NM1090 PRO is a well-rounded PCIe Gen5 SSD that delivers solid performance with competitive specs and features. It supports all the expected Gen5 capabilities, including strong endurance ratings and Microsoft DirectStorage compatibility. While it may not come from one of the traditional heavyweights in the SSD space, Lexar’s offering holds its own, delivering a reliable platform for gaming, content creation, and AI-focused tasks.
In our testing, the NM1090 PRO consistently showed respectable results across both synthetic and real-world benchmarks. It landed in the upper-mid range of Gen5 drives in most categories, with powerful write performance in Blackmagic and sequential FIO tests. It did stumble slightly in some specialized workloads (such as LLM model load times and GDeflate decompression), where it lagged the top performers. Still, it matched or surpassed other Gen5 competitors in key areas, such as GPU Direct Storage reads and PCMark 10 responsiveness, demonstrating that it’s a capable and balanced drive.
At $139 for 1TB and $225 for 2TB, the NM1090 PRO is also one of the more affordable Gen5 options available today. Compared to the SK hynix P51 ($169/$269), SanDisk SN8100 ($180/$280), and Kingston FURY Renegade G5 ($204/$330), Lexar’s pricing undercuts much of the competition while delivering performance that’s close enough that most users won’t notice the difference in everyday workloads. If you’re chasing benchmark wins or absolute top-of-class responsiveness, you may want to consider spending more. However, for almost all other users, the NM1090 PRO offers excellent value and performance that will more than satisfy modern, intensive workloads.
Lexar Professional NM1090 PRO at Amazon (affiliate link)


 Amazon