

The Memblaze PBlaze6 6920 is the company’s new NVMe SSD series that features a PCIe Gen4 interface and the potential performance gains that could bring. The 6920 is a U.2 drive that leverages 96-Layer NAND. There are two drives in this series, the PBlaze6 D6920 and the PBlaze6 D6926, the former being the lower endurance model with 1 DWPD and the latter being the high endurance with 3 DWPD.
The Memblaze PBlaze6 6920 is the company’s new NVMe SSD series that features a PCIe Gen4 interface and the potential performance gains that could bring. The 6920 is a U.2 drive that leverages 96-Layer NAND. There are two drives in this series, the PBlaze6 D6920 and the PBlaze6 D6926, the former being the lower endurance model with 1 DWPD and the latter being the high endurance with 3 DWPD.
The drive comes in a wide range of capacities with the lower endurance drive coming in 3.84TB, 7.68TB, and 15.36TB capacities. The higher endurance version comes in 3.2TB, 6.4TB, and 12.8TB capacities. Top-end performance is quoted at 7.1GB/s read, 6.8GB/s write, 1.6 million IOPS read, and 500K IOPS write. Memblaze states that the new drive series is ideal for database, searching, indexing, CDN, Cloud and hyper-scale, SDS, deep learning, Big Data Analytics, HPC, ERP, SAP HANA, BOSS, banking, taxing, high-frequency trading, and online payment. All of the usual hot spots.
Memblaze, particularly from StorageReview testing in the past, is known for high performance. So, seeing 7.1GB/s and 1.6 million IOPS is kind of what is expected. However, Memblaze is also known for data reliability and high write endurance. Having a high write endurance is important in long-term use where applications tend to be read/write-intensive and mixed read-write. The PBlaze6 6920 series leverages weighted round-robin. Instead of giving equal priority in each queue, weighted round-robin allows for differentiated I/O services for the scenarios where applications with different performance requirements share storage devices.
Other features include the ability to collect logs via the Telemetry standard interface, reducing complexity and potentially lowering maintenance costs. The new PBlaze6 6920 series supports enhanced secure erase to ensure that once a drive is decommissioned, there is no way for someone to get any information from it. The drives’ firmware can be updated without resetting the drive as well.
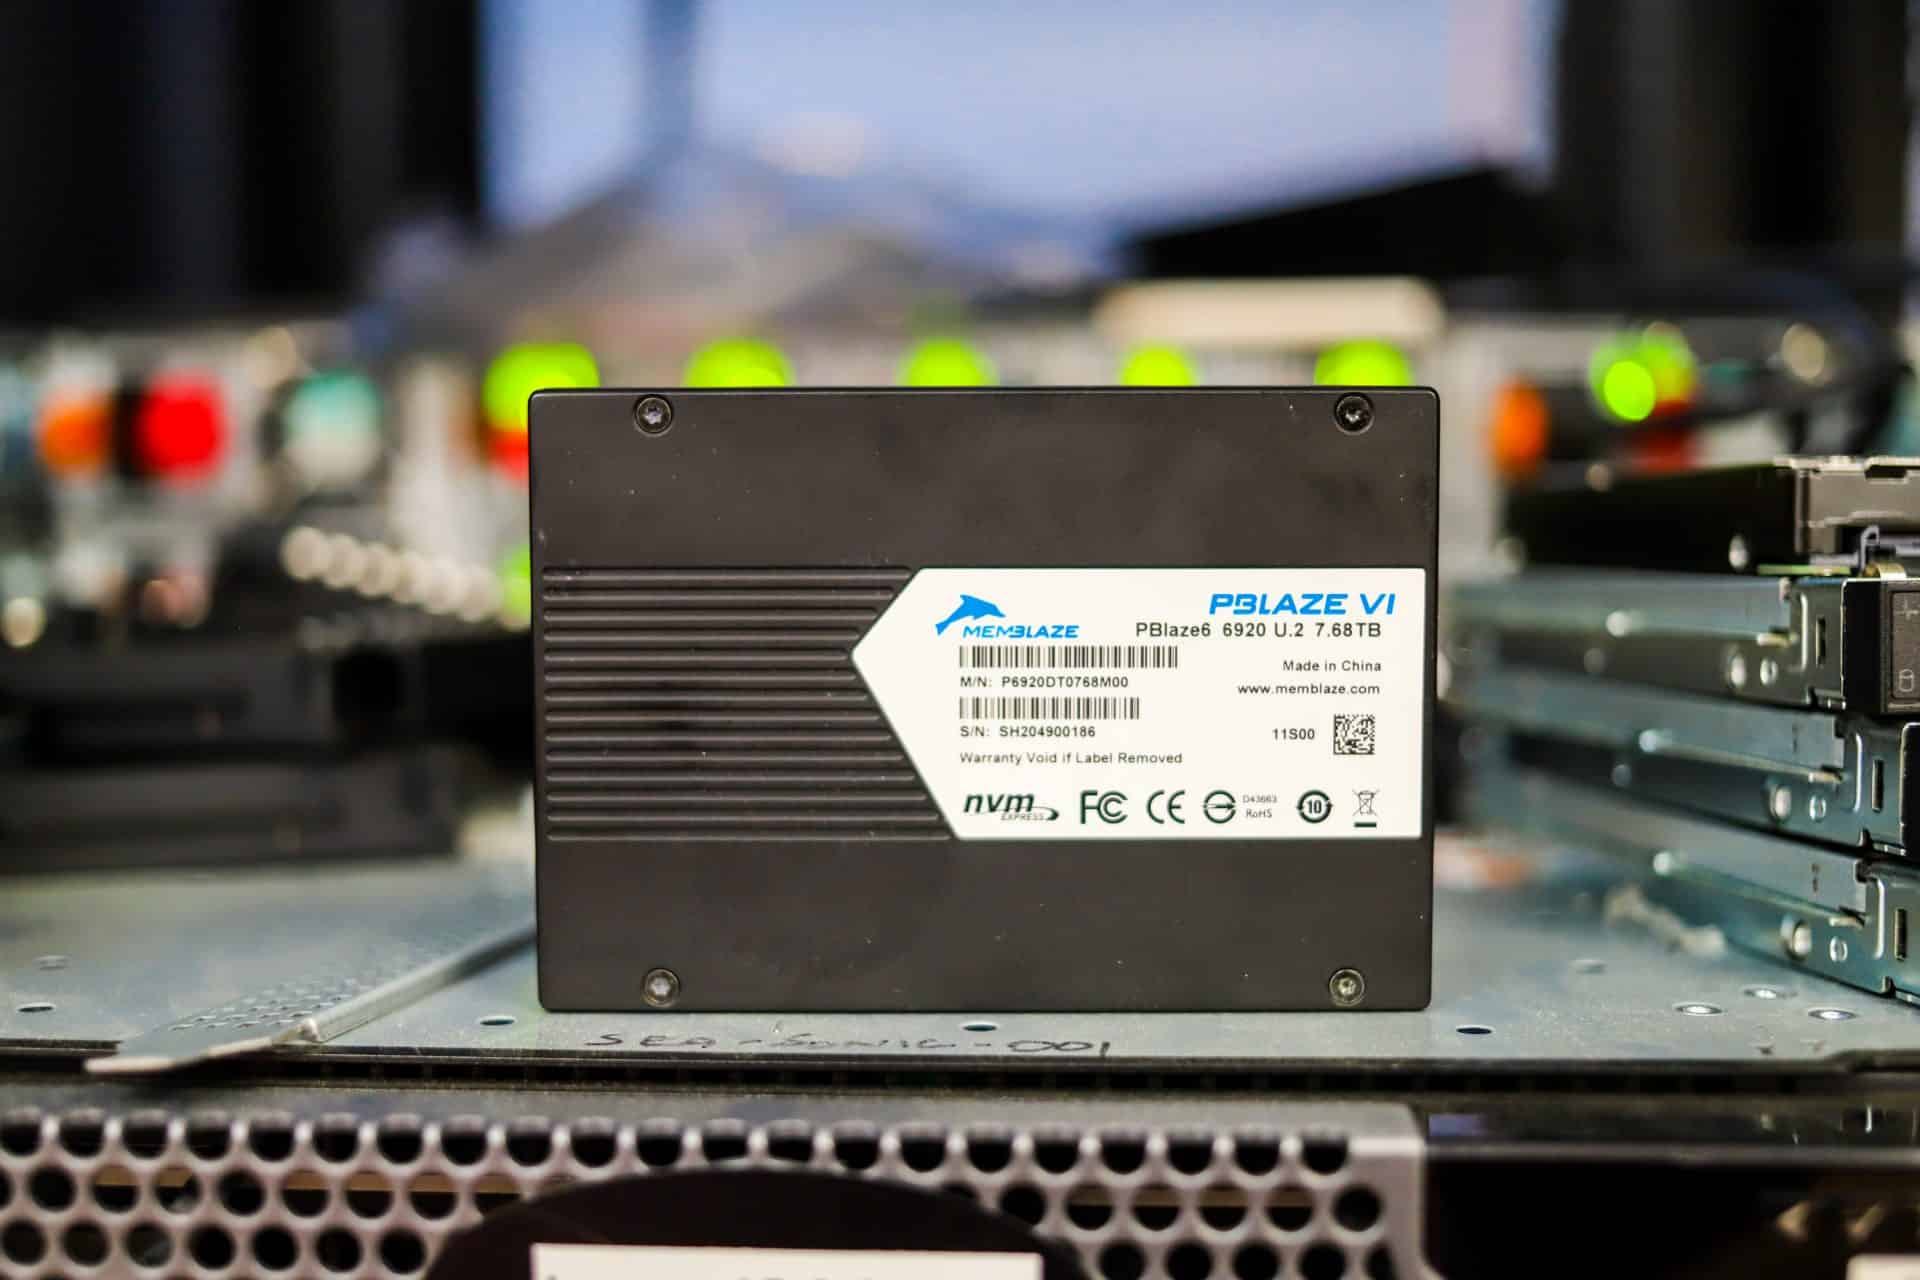
For our review, we will be looking at the D6920 7.68TB model.
Memblaze PBlaze6 6920 NVMe SSD Specifications
| PBlaze6 6920 Series | D6920 | D6926 | ||||
| User Capacity | 3.84TB | 7.68TB | 15.36TB | 3.2TB | 6.4TB | 12.8TB |
| NAND | 96L 3D NAND | |||||
| Form Factor | 2.5-inch U.2 | 2.5-inch U.2 | ||||
| Interface | PCIe 4.0 x 4 | PCIe 4.0 x 4 | ||||
| Protocol | NVMe 1.4 | |||||
| Performance | ||||||
| 128KB Sequential Read (GB/s,25W) | 6.7 | 7.1 | 7.1 | 6.7 | 7.1 | 7.1 |
| 128KB Sequential Read (GB/s,35W) | 6.7 | 7.1 | 7.1 | 6.7 | 7.1 | 7.1 |
| 128KB Sequential Write (GB/s,25W) | 3.9 | 5.6 | 5.2 | 3.9 | 5.7 | 5.3 |
| 128KB Sequential Write (GB/s,35W) | 3.9 | 6.8 | 6.6 | 3.9 | 6.8 | 6.7 |
| Sustained Random Read (4KB) IOPS | 900K | 1600K | 1600K | 900K | 1600K | 1600K |
| Sustained Random Write (4KB) IOPS Steady State | 165K | 260K | 305K | 345K | 480K | 500K |
| Latency Read/Write (μs) | 78 / 11 | 78 / 11 | ||||
| Lifetime Endurance | 1 DWPD | 3 DWPD | ||||
| Uncorrectable Bit Error Rate | <10^-17 | |||||
| MTBF | 2 million hours | |||||
| Operating Temperature | Ambient: 0°C-35°C; Case:0°C-70°C | |||||
| Power Consumption | 25W | |||||
Memblaze PBlaze6 6920 Performance
Testing Background and Comparables
The StorageReview Enterprise Test Lab provides a flexible architecture for conducting benchmarks of enterprise storage devices in an environment comparable to what administrators encounter in real deployments. The Enterprise Test Lab incorporates a variety of servers, networking, power conditioning, and other network infrastructure that allows our staff to establish real-world conditions to accurately gauge performance during our reviews.
We incorporate these details about the lab environment and protocols into reviews so that IT professionals and those responsible for storage acquisition can understand the conditions under which we have achieved the following results. None of our reviews are paid for or overseen by the manufacturer of equipment we are testing. Additional details about the StorageReview Enterprise Test Lab and an overview of its networking capabilities are available on those respective pages.
HPE ProLiant DL365 Gen10 Plus Configuration:
- 2 x 7713 AMD Epyc Gen 3 CPUs (64-Core, 2GHz)
- 16 x 16GB DDR4 3200MHz
- 1 x HPE Samsung PM1735 3.2GB U.3 Gen4 SSD
- ESXi 7.0u1
Application Workload Analysis
In order to understand the performance characteristics of enterprise storage devices, it is essential to model the infrastructure and the application workloads found in live production environments. Our benchmarks for the HPE/Samsung PM1735 include the MySQL OLTP performance via SysBench and Microsoft SQL Server OLTP performance with a simulated TCP-C workload. For our application workloads, each comparable drive will be running 4 identically configured VMs. With the PM1735 being a U.3-ONLY variant, we tested it on the HPE DL365 Gen10 Plus while the other models were on our Lenovo ThinkSystem SR635.
SQL Server Performance
Each SQL Server VM is configured with two vDisks: 100GB volume for boot and a 500GB volume for the database and log files. From a system resource perspective, we configured each VM with 8 vCPUs, 64GB of DRAM and leveraged the LSI Logic SAS SCSI controller. While our Sysbench workloads tested previously saturated the platform in both storage I/O and capacity, the SQL test is looking for latency performance.
This test uses SQL Server 2014 running on Windows Server 2012 R2 guest VMs and is stressed by Quest’s Benchmark Factory for Databases. StorageReview’s Microsoft SQL Server OLTP testing protocol employs the current draft of the Transaction Processing Performance Council’s Benchmark C (TPC-C), an online transaction-processing benchmark that simulates the activities found in complex application environments. The TPC-C benchmark comes closer than synthetic performance benchmarks to gauging the performance strengths and bottlenecks of storage infrastructure in database environments. Each instance of our SQL Server VM for this review uses a 333GB (1,500 scale) SQL Server database and measures the transactional performance and latency under a load of 15,000 virtual users.
SQL Server Testing Configuration (per VM)
- Windows Server 2012 R2
- Storage Footprint: 600GB allocated, 500GB used
- SQL Server 2014
- Database Size: 1,500 scale
- Virtual Client Load: 15,000
- RAM Buffer: 48GB
- Test Length: 3 hours
- 2.5 hours preconditioning
- 30 minutes sample period
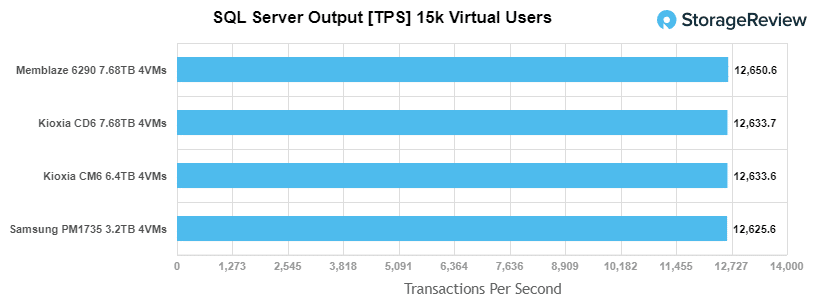
With SQL Server transactional benchmark, we saw the PBlaze6 hit an aggregate of 12,650.6 TPS with individual VMs ranging from 3,162 TPS to 3,163.2 TPS.
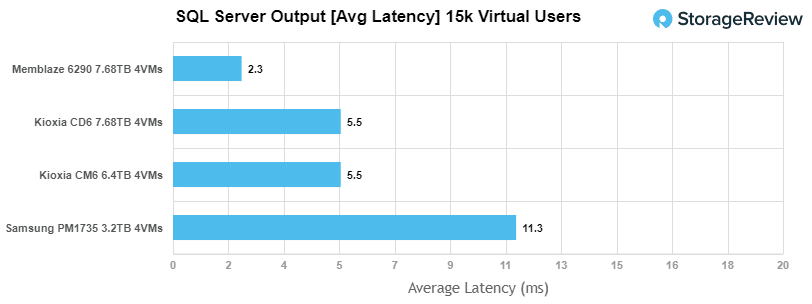
With SQL Server average latency, the PBlaze6 6920 had an aggregate latency of 2.25ms with individual VMs ranging from 1ms to 3ms. This puts it above all other Gen4 drives tested thus far.
Sysbench Performance
The next application benchmark consists of a Percona MySQL OLTP database measured via SysBench. This test measures average TPS (Transactions Per Second), average latency, and average 99th percentile latency as well.
Each Sysbench VM is configured with three vDisks: one for boot (~92GB), one with the pre-built database (~447GB), and the third for the database under test (270GB). From a system resource perspective, we configured each VM with 8 vCPUs, 60GB of DRAM and leveraged the LSI Logic SAS SCSI controller.
Sysbench Testing Configuration (per VM)
- CentOS 6.3 64-bit
- Percona XtraDB 5.5.30-rel30.1
- Database Tables: 100
- Database Size: 10,000,000
- Database Threads: 32
- RAM Buffer: 24GB
- Test Length: 3 hours
- 2 hours preconditioning 32 threads
- 1 hour 32 threads
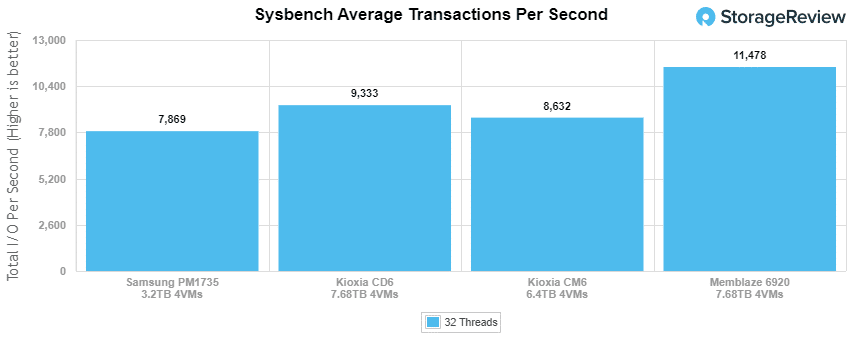
Looking at our Sysbench transactional benchmark, the Memblaze drive had an aggregate score of 11,478 TPS with individual VMs ranging from 2,856 to 2,889 TPS. This puts it well ahead of the other drives.
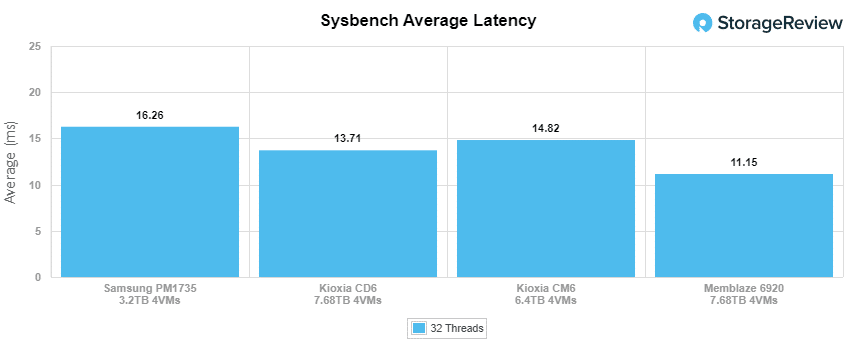
 Sysbench average latency saw the Memblaze put up an aggregate of 11.15ms with individual VMs ranging from 11.07ms to 11.2ms. Again, the drive takes first with the lowest latency yet.
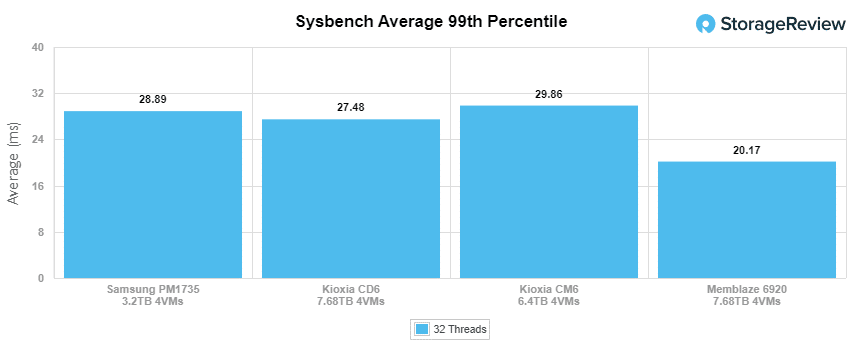
For our worst-case scenario latency (99th percentile), the Memblaze PBlaze6 6920 drive had an aggregate of 20.2ms well under the other drives in comparison.
VDBench Workload Analysis
When it comes to benchmarking storage devices, application testing is best, and synthetic testing comes in second place. While not a perfect representation of actual workloads, synthetic tests do help to baseline storage devices with a repeatability factor that makes it easy to do apples-to-apples comparisons between competing solutions. These workloads offer a range of different testing profiles ranging from “four corners” tests, common database transfer size tests, to trace captures from different VDI environments.
All of these tests leverage the common vdBench workload generator, with a scripting engine to automate and capture results over a large compute testing cluster. This allows us to repeat the same workloads across a wide range of storage devices, including flash arrays and individual storage devices. Our testing process for these benchmarks fills the entire drive surface with data, then partitions a drive section equal to 25% of the drive capacity to simulate how the drive might respond to application workloads. This is different than full entropy tests which use 100% of the drive and takes them into a steady state. As a result, these figures will reflect higher-sustained write speeds.
Profiles:
- 4K Random Read: 100% Read, 128 threads, 0-120% iorate
- 4K Random Write: 100% Write, 128 threads, 0-120% iorate
- 4K Random Read (high load): 100% Read, 512 threads, 0-120% iorate
- 4K Random Write (high load): 100% Write, 512 threads, 0-120% iorate
- 64K Sequential Read: 100% Read, 32 threads, 0-120% iorate
- 64K Sequential Write: 100% Write, 16 threads, 0-120% iorate
- 64K Sequential Read (high load): 100% Read, 64 threads, 0-120% iorate
- 64K Sequential Write (high load): 100% Write, 64 threads, 0-120% iorate
- Synthetic Database: SQL and Oracle
- VDI Full Clone and Linked Clone Traces
Comparables:
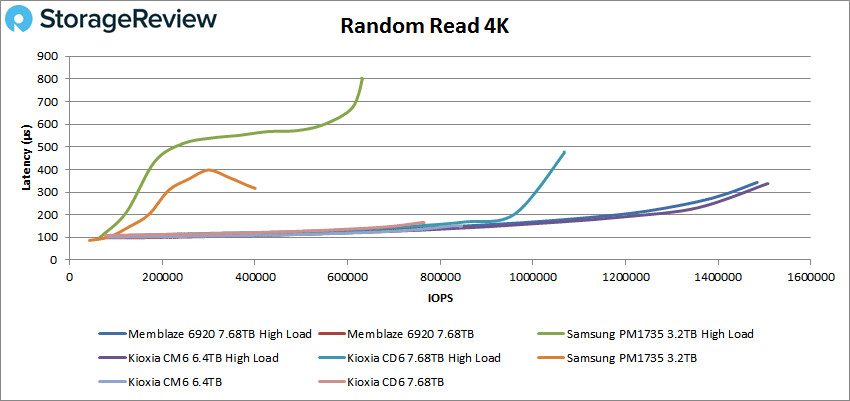
In our first VDBench Workload Analysis, Random 4K Read, Kioxia CM6 (high-load) took the top spot with the Memblaze PBlzae6 6920 in second, again high-load. For the high load on the Memblaze, we saw a peak of 1,484,363 IOPS at a latency of only 343µs. For the regular load, we saw a peak of 862,778 IOPS at a latency of 146µs.
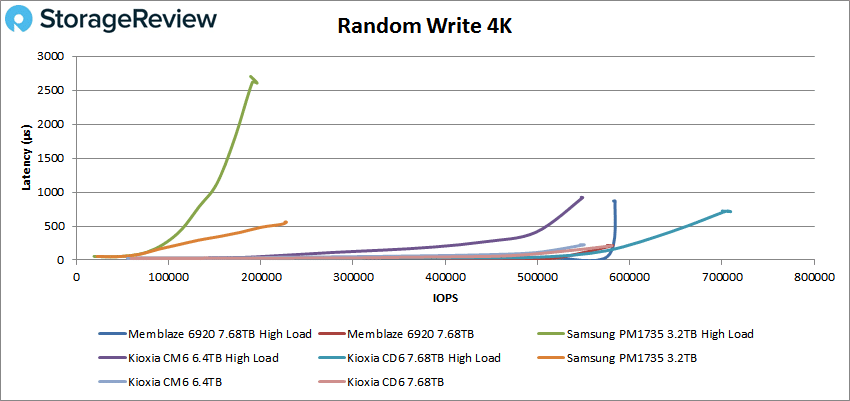
4K write again saw Kioxia in the top spot and Memblaze PBlaze6 6920 take second. For peak high-load, the 6920 hit 584,267 IOPS at a latency of 867µs. Under our normal load, the PBlaze6 hit 580,117 IOPS at a latency of just 215µs.
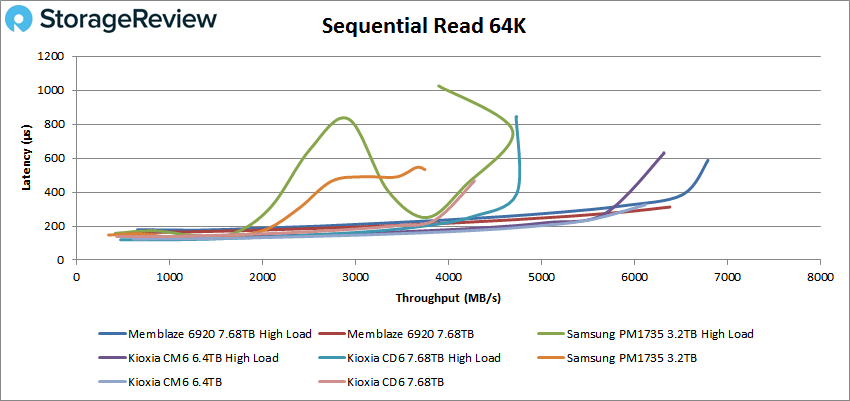
 Switching over to our 64K sequential workloads, we start off with read. Here the Memblaze took the top spot with its high-load peaking at 108,587 IOPS or 6.79GB/s at a latency of 588µs. Under normal load, the drive took second with a peak of 102,035 IOPS or 6.38GB/s at a latency of 313µs.
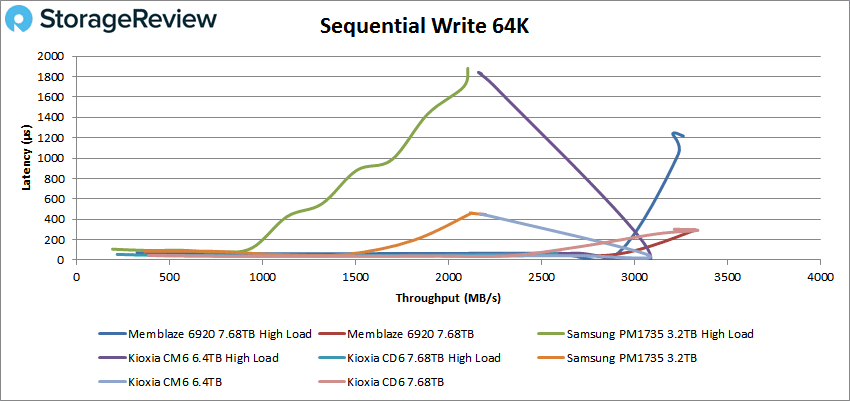
 With 64K write Kioxia CD6 took the top spot but the normal load Memblaze took second with 53,164 IOPS or 3.3GB/s at a latency of 293µs. High-load was right behind with 52,174 IOPS or 3.26GB/s at a latency of 1.2ms.
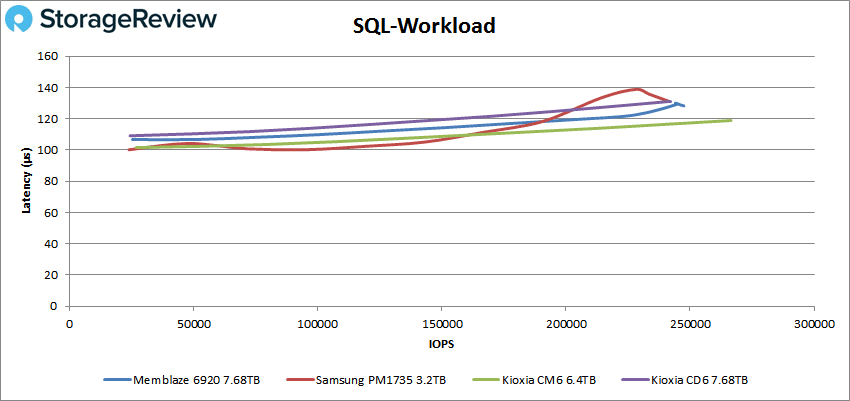
Our next set of tests are our SQL workloads: SQL, SQL 90-10, and SQL 80-20. Starting with SQL, the Memblaze took second with a peak performance of 247,494 IOPS at a latency of 128µs.
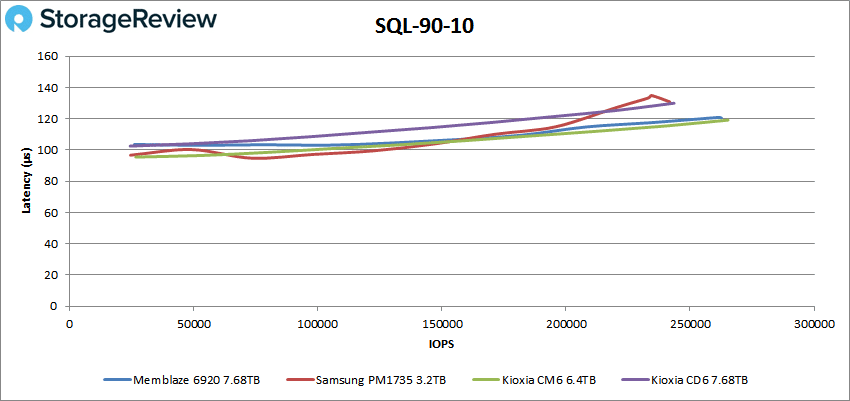
In SQL 90-10 we again see Memblaze land in second with a peak of 262,647 IOPS with a latency of 121µs.
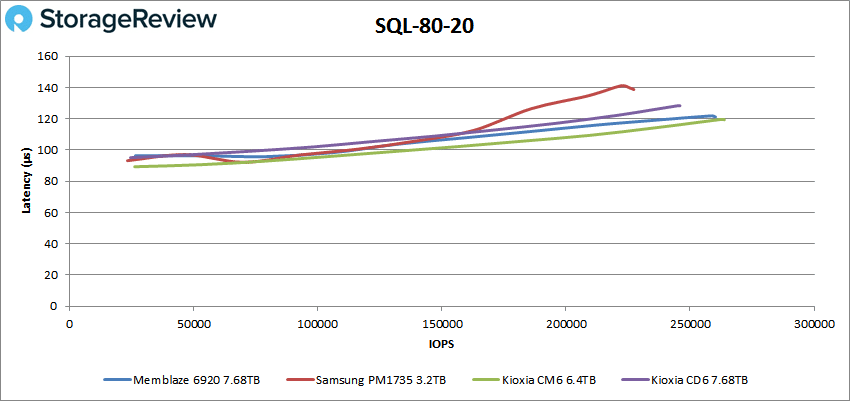
For SQL 80-20 placement was the same with the Memblaze starting below 100µs and peaking at 260,215 IOPS with a latency of 121µs.
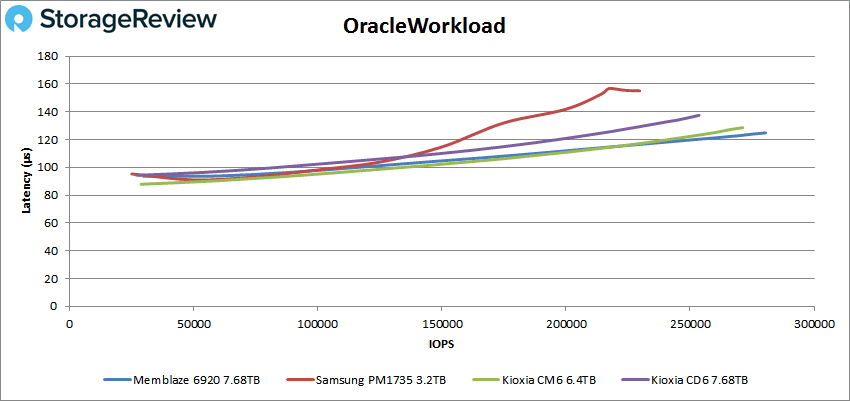
Next up are our Oracle workloads: Oracle, Oracle 90-10, and Oracle 80-20. Starting with Oracle, the Memblaze took the top spot with a peak of 280,460 IOPS with a latency of 125µs.
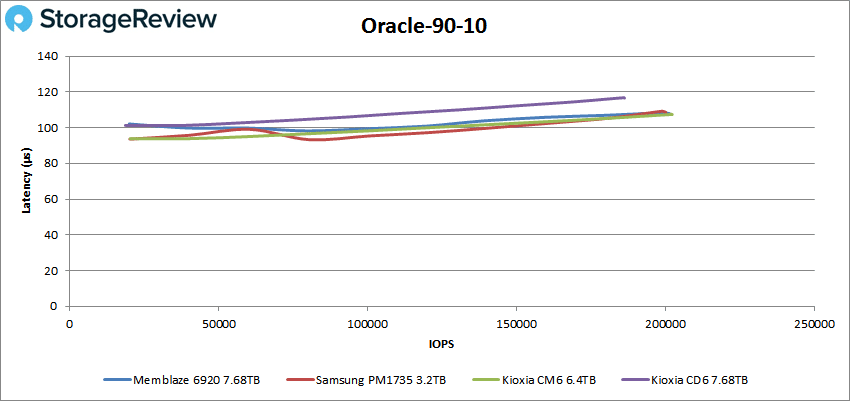
Oracle 90-10 saw the Memblaze drop to second with a peak performance of 201,129 IOPS at a latency of 108µs.
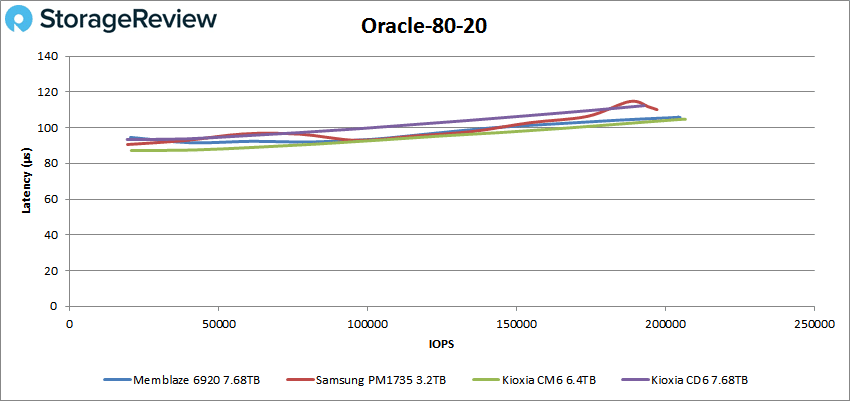
With Oracle 80-20 Memblaze was once again second with a peak of 205,118 IOPS and a latency of 106µs.
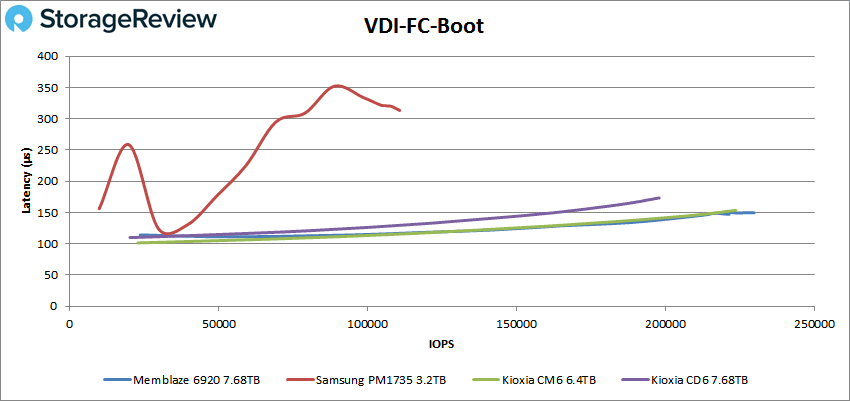
Next, we switched over to our VDI clone test, Full and Linked. For VDI Full Clone, first up is boot. Here the Memblaze took the top spot with 229,874 IOPS and a latency of 150µs.
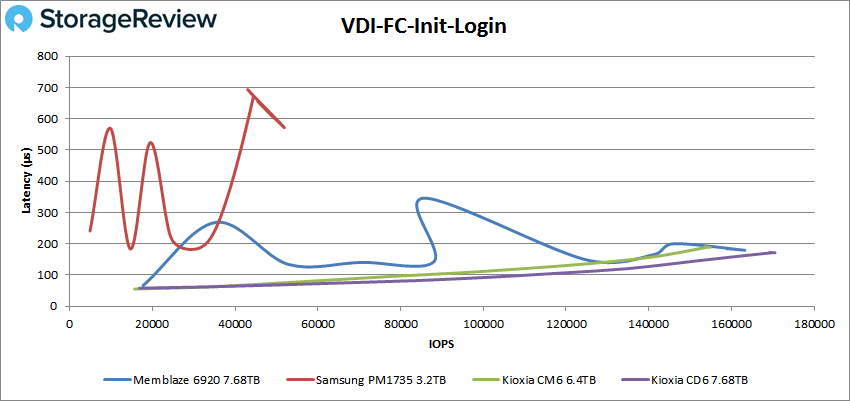
For VDI FC Initial Login, the PBlaze6 fell to second with a peak performance of 163,243 IOPS at a latency of 180µs.
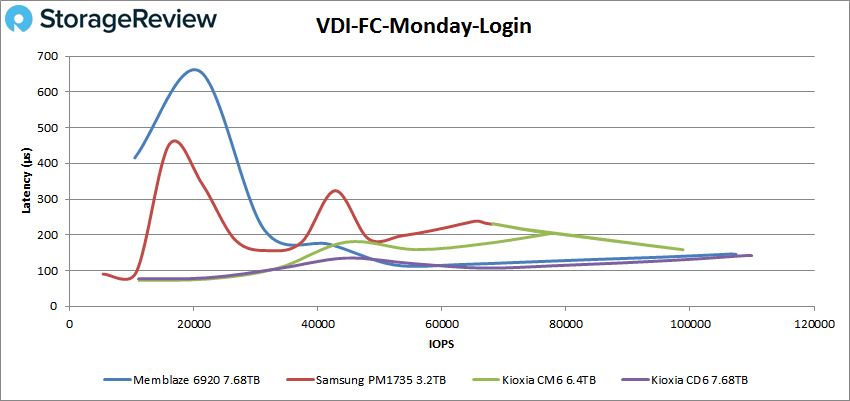
VDI FC Monday Login had Memblaze hold second with a peak of 107,414 IOPS with a latency of 146µs.
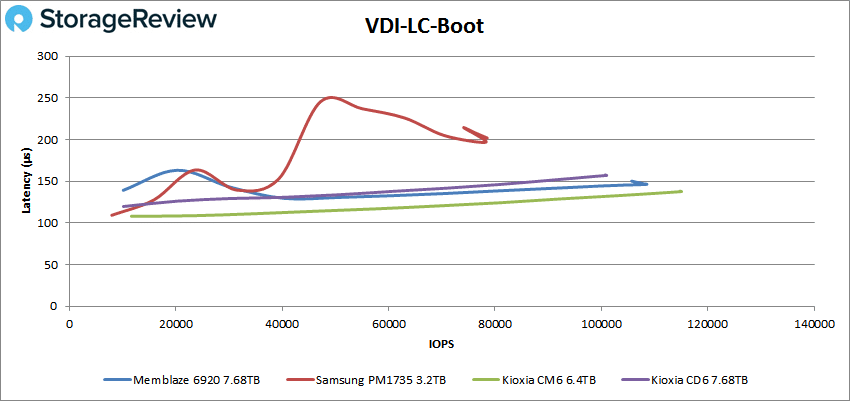
For VDI Linked Clone (LC) Boot, the Memblaze took second behind the CM6, the usual top performer. For a peak, the drive saw 108,491 IOPS and a latency of 146µs.
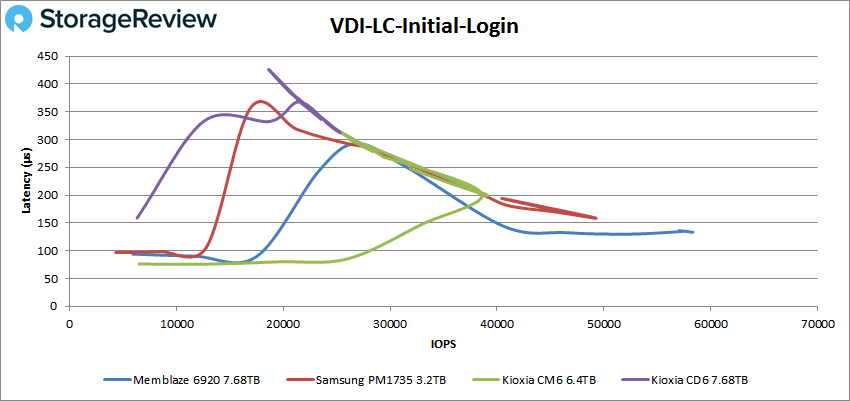
VDI LC Initial Login saw Memblaze take the top spot with a peak of 58,314 IOPS and a latency of 133µs.
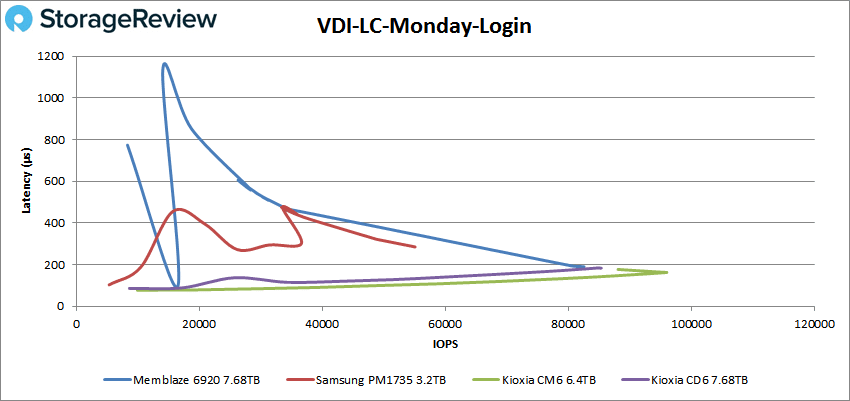
Finally, with VDI LC Monday Login Memblaze dropped down to third with a peak of 82,576 IOPS with a latency of 190µs though it was over 1ms earlier in testing.
Conclusion
The Memblaze PBlaze6 6920 NVMe SSD series is the latest enterprise drive from the company, for the first time leveraging PCIe Gen4. The Series consists of two drives, D6920 (reviewed here) and the D6926. The difference between the drives is endurance and as a result, capacity. Speaking of capacity, the top capacity for the series is 15.36TB in a U.2 footprint. For performance, the maximum quoted numbers are 7.1GB/s and 1.6 million IOPS. Memblaze states the drive is ideal for a plethora of use cases, and it may just be easier to say that it can fit most (or all) enterprise workloads.
For performance, we tested the Memblaze PBlaze6 6920 SSD against over PCIe Gen4 enterprise SSDs we have. We looked at both application workload analysis and VDBench. In our first series of tests, we saw Memblaze take the top spot in SQL Server transactional with an aggregate of 12,650.6 TPS and the top spot in average latency with an aggregate of 2.25ms. The drive kept the top spot in Sysbench with aggregate scores of 11,478 TPS, an average latency of 11.15ms, and a worst-case scenario of 20.2ms.
Switching over to our VDBench the Memblaze took first several times and stayed in second for most of the rest of the tests. Highlights include 1.5 million IOPS in 4K read high-load, 863K IOPS in 4K read, 584K IOPS in 4K write high-load, and 580K IOPS in 4K write. In sequential work we saw 6.79GB/s in 64K read high-load, 6.38GB/s in 64K read, 3.26GB/s in 64K write high-load, and 3.3GB/s in 64K write.
In our SQL testing, we saw peaks of 247K IOPS, 263K IOPS in SQL 90-10, and 260K IOPS in SQL 80-20. With Oracle, we saw 280K IOPS, 201K IOPS in Oracle 90-10, and 205K IOPS in Oracle 80-20. Next up were our VDI Clone tests, Full and Linked. In Full Clone, we saw 230K IOPS in boot, 163K IOPS in Initial Login, and 107K IOPS in Monday Login. In Linked Clone we saw 108K IOPS in boot, 58K IOPS in Initial Login, and 83K IOPS in Monday Login.
The Memblaze PBlaze6 NVMe SSD series is the company’s first PCIe Gen4 drive and yet another top-notch release. The drive we tested, the D6920, was either at or near the top in every test. Not everyone knows the Memblaze name, as much of their US distribution is through Micron-branded SSDs. But if you’re not paying attention to Memblaze, you’re vastly missing out if you care about performance in a common, hot-swappable form factor. Their SSDs have had the best performance profile of any brand that’s hit our lab over the last several years. The D6920 is no different and is a thoroughly impressive drive throughout our entire test plan. As a result, it’s earned our Editor’s Choice award.

Memblaze PBlaze6 6920 Series Product Page
Engage with StorageReview
Newsletter | YouTube | LinkedIn | Instagram | Twitter | Facebook | TikTok | RSS Feed