

The OWC Aura P12 is an NVMe SSD that leverages the PCIe 3.1 x4 interface. OWC indicates that their new drive is ideal for consumers looking to improve their gaming and overall system performance, as well as professionals who want to increase previewing, rendering, and processing in audio and visual effect software. Packed inside the M.2 2280 form factor, the OWC Aura P12 comes in a range of capacities from 240GB to 4TB and uses 3D TLC NAND. The OWC drive also features the Phison E12, a high-performance, 8-channel NVMe controller that was first announced roughly 2 years ago.
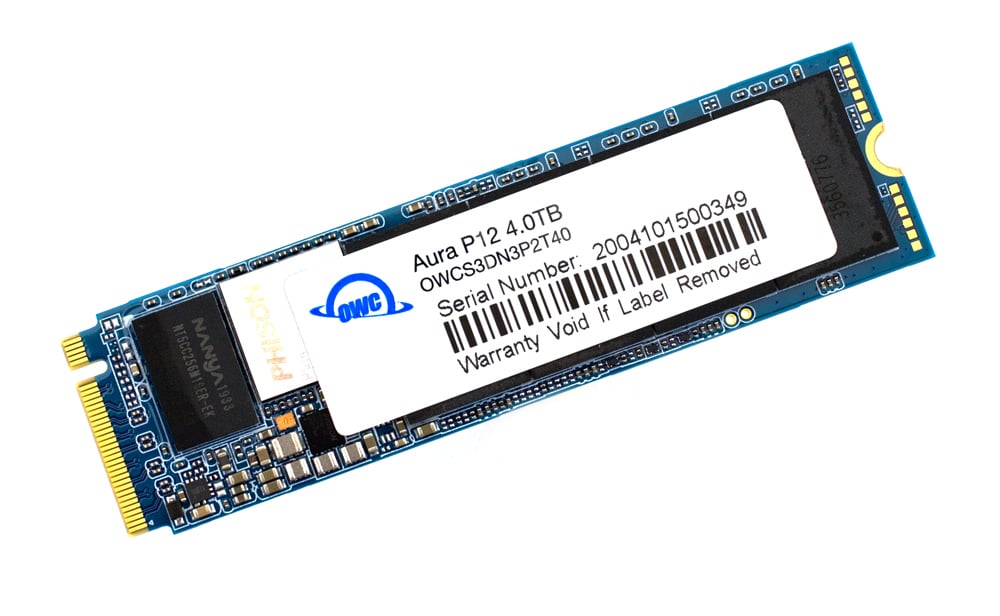
As such, the OWC Aura P12 is quoted to deliver sequential speeds up to 3,400MB/s in reads and 3,000MB/s in writes, while random performance is expected to hit reads and writes up to 600,000 IOPS. It also features built-in SLC caching, which helps to further increase the performance of TLC SSDs and uses 7% over-provisioning (overall capacity as free space) to help promote a more stable and dependable experience for storing data.
Backed by a 5-year warranty, the OWC comes in capacities of 240GB, 480GB, 1TB, 2TB, and 4TB. We will be looking at the 4TB model.
OWC Aura P12 Specifications
| Capacity | 240GB, 480GB, 1TB, 2TB, 4TB |
| Performance |
|
| Controller | Phison E12 |
| Flash | 3D TLC NAND |
| TRIM Support | OS dependent |
| S.M.A.R.T. | Standard |
| Interface | NVMe 1.3 (PCIe 3.1 x4) |
| Form Factor | M.2 2280 “M key” |
| Overprovisioning | 7% over provisioning |
| Acoustics | Designed to operate silently |
| Dimensions |
|
| Weight |
|
| Warranty | 5 Year OWC Limited Warranty |
OWC Aura P12 SSD Performance
Testbed
The test platform leveraged in these tests is a Dell PowerEdge R740xd server. We measure SATA performance through a Dell H730P RAID card inside this server, although we set the card in HBA mode only to disable the impact of RAID card cache. NVMe is tested natively through an M.2 to PCIe adapter card. The methodology used better reflects end-user workflow with the consistency, scalability and flexibility testing within virtualized server offers. A large focus is put on drive latency across the entire load range of the drive, not just at the smallest QD1 (Queue-Depth 1) levels. We do this because many of the common consumer benchmarks don’t adequately capture end-user workload profiles.
Houdini by SideFX
The Houdini test is specifically designed to evaluate storage performance as it relates to CGI rendering. The test bed for this application is a variant of the core Dell PowerEdge R740xd server type we use in the lab with dual Intel 6130 CPUs and 64GB DRAM. In this case, we installed Ubuntu Desktop (ubuntu-16.04.3-desktop-amd64) running bare metal. Output of the benchmark is measured in seconds to complete, with fewer being better.
The Maelstrom demo represents a section of the rendering pipeline that highlights the performance capabilities of storage by demonstrating its ability to effectively use the swap file as a form of extended memory. The test does not write out the result data or process the points in order to isolate the wall-time effect of the latency impact to the underlying storage component. The test itself is composed of five phases, three of which we run as part of the benchmark, which are as follows:
- Loads packed points from disk. This is the time to read from disk. This is single-threaded, which may limit overall throughput.
- Unpacks the points into a single flat array in order to allow them to be processed. If the points do not have dependency on other points, the working set could be adjusted to stay in-core. This step is multi-threaded.
- (Not Run) Processes the points.
- Repacks them into bucketed blocks suitable for storing back to disk. This step is multi-threaded.
- (Not Run) Writes the bucketed blocks back out to disk.
Here, we see the OWC Aura P12 place near the bottom-middle of the pack with a rendering of 2,879.6 seconds, which is just above the Memblaze PBlaze5 C926.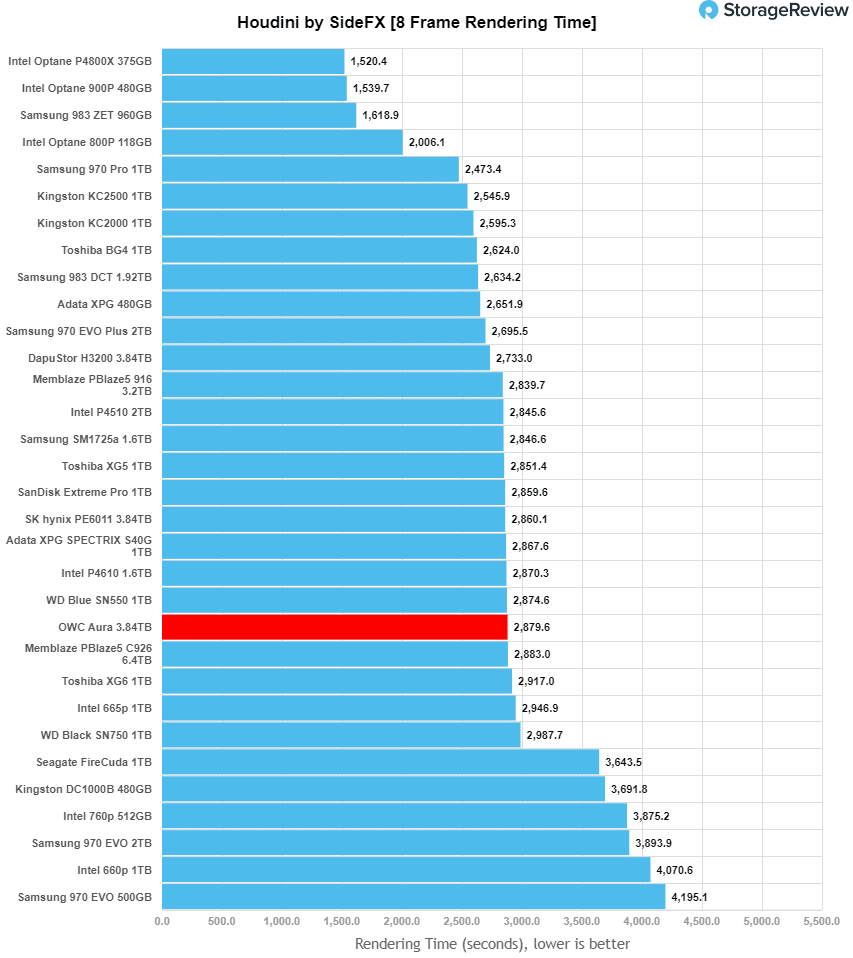 SQL Server Performance
Each SQL Server VM is configured with two vDisks: 100GB volume for boot and a 500GB volume for the database and log files. From a system-resource perspective, we configured each VM with 16 vCPUs, 64GB of DRAM and leveraged the LSI Logic SAS SCSI controller. While our Sysbench workloads tested previously saturated the platform in both storage I/O and capacity, the SQL test is looking for latency performance.
This test uses SQL Server 2014 running on Windows Server 2012 R2 guest VMs, and is stressed by Quest’s Benchmark Factory for Databases. StorageReview’s Microsoft SQL Server OLTP testing protocol employs the current draft of the Transaction Processing Performance Council’s Benchmark C (TPC-C), an online transaction-processing benchmark that simulates the activities found in complex application environments. The TPC-C benchmark comes closer than synthetic performance benchmarks to gauging the performance strengths and bottlenecks of storage infrastructure in database environments. Each instance of our SQL Server VM for this review uses a 333GB (1,500 scale) SQL Server database and measures the transactional performance and latency under a load of 15,000 virtual users.
SQL Server Testing Configuration (per VM)
- Windows Server 2012 R2
- Storage Footprint: 600GB allocated, 500GB used
- SQL Server 2014
-
- Database Size: 1,500 scale
- Virtual Client Load: 15,000
- RAM Buffer: 48GB
- Test Length: 3 hours
-
- 2.5 hours preconditioning
- 30 minutes sample period
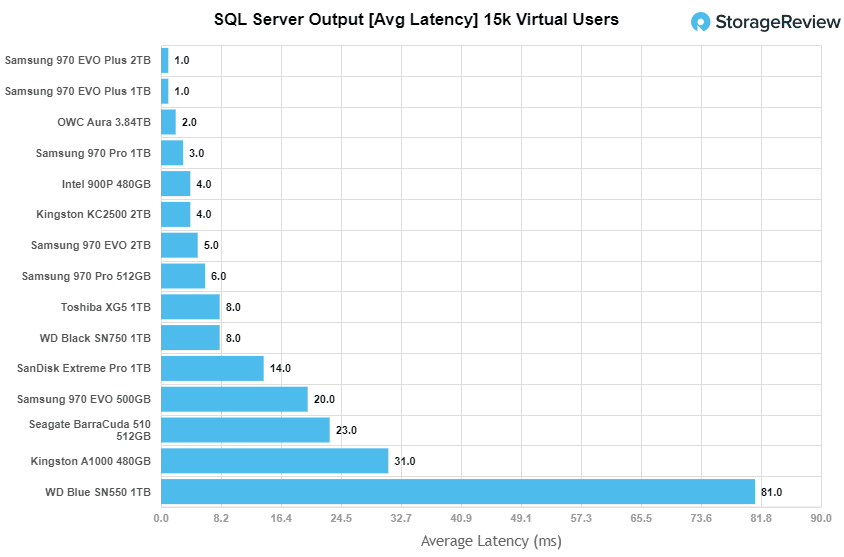
For our SQL Server transactional benchmark, the OWC Aura P12 posted a solid 3,160.9, which was only behind the two Samsung EVO Plus drives.
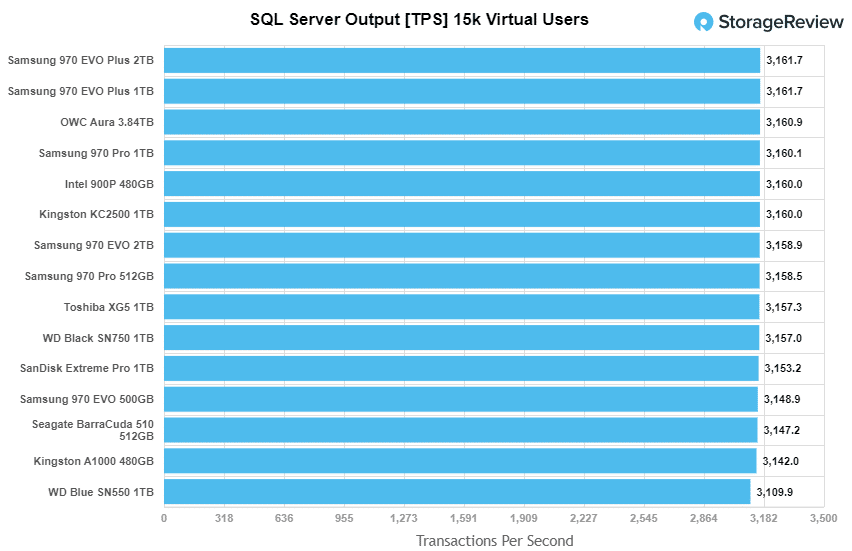
For latency, the OWC drive showed impressive results again with just 2.0ms, which was again the just behind the EVO Plus.
VDBench Workload Analysis
When it comes to benchmarking storage devices, application testing is best, and synthetic testing comes in second place. While not a perfect representation of actual workloads, synthetic tests do help to baseline storage devices with a repeatability factor that makes it easy to do apples-to-apples comparison between competing solutions. These workloads offer a range of different testing profiles ranging from “four corners” tests, common database transfer size tests, to trace captures from different VDI environments. All of these tests leverage the common vdBench workload generator, with a scripting engine to automate and capture results over a large compute testing cluster. This allows us to repeat the same workloads across a wide range of storage devices, including flash arrays and individual storage devices. Our testing process for these benchmarks fills the entire drive surface with data, then partitions a drive section equal to 5% of the drive capacity to simulate how the drive might respond to application workloads. This is different than full entropy tests which use 100% of the drive and take them into steady state. As a result, these figures will reflect higher-sustained write speeds.
Profiles:
- 4K Random Read: 100% Read, 128 threads, 0-120% iorate
- 4K Random Write: 100% Write, 64 threads, 0-120% iorate
- 64K Sequential Read: 100% Read, 16 threads, 0-120% iorate
- 64K Sequential Write: 100% Write, 8 threads, 0-120% iorate
Comparables for this review:
- Samsung Evo Plus 2TB
- Kingston KC2000 1TB
- Kingston KC2500 1TB
- Seagate FireCude 510 1TB
- WD Black 1TB
- WD Blue SN550 1TB
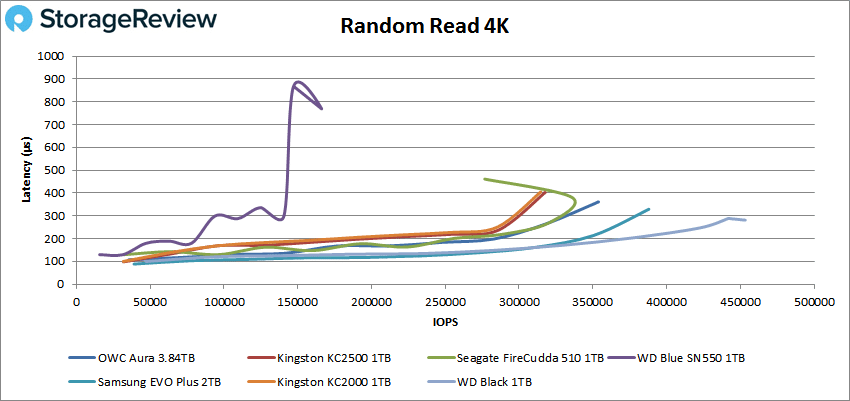
For 4K performance, the OWC Aura P12 remained below 400µs throughout the test and went on to peak at an impressive 353,528 IOPS with 360.6µs.
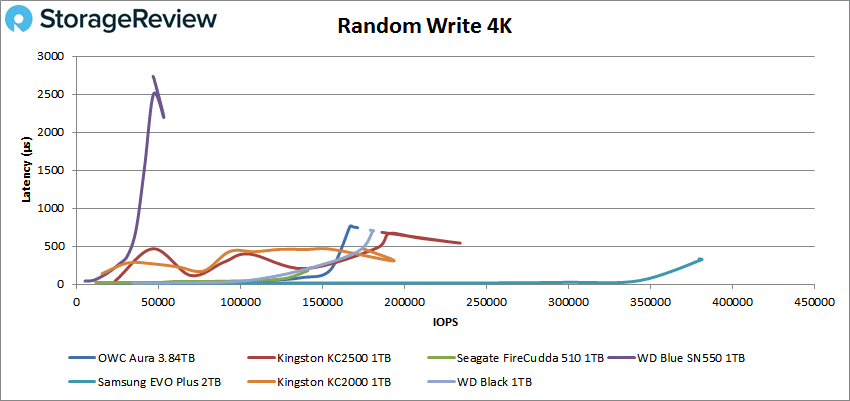
 For 4K random write, the OWC Aura P12 reached a peak of 171,540 IOPS at a latency of 747.3µs.
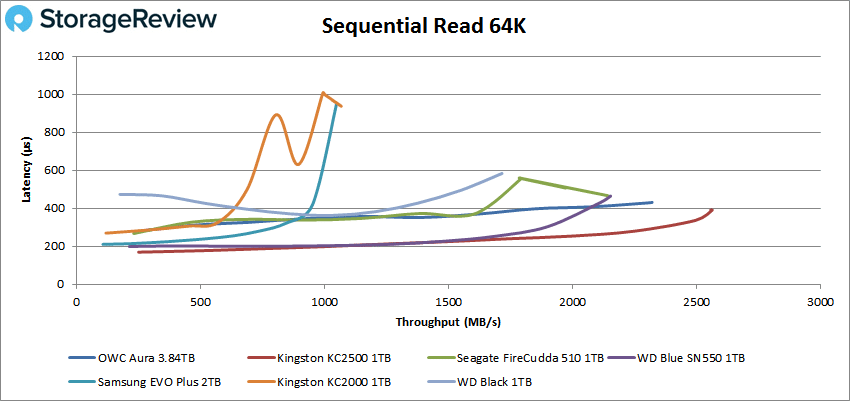
 With 64K sequential performance, the OWC Aura P12 showed latency well below 1 millisecond throughout the test and went on to peak at 37,116 IOPS (or 2.3GB/s) with 431µs, which only trailed the Kingston KC2500 SSD.
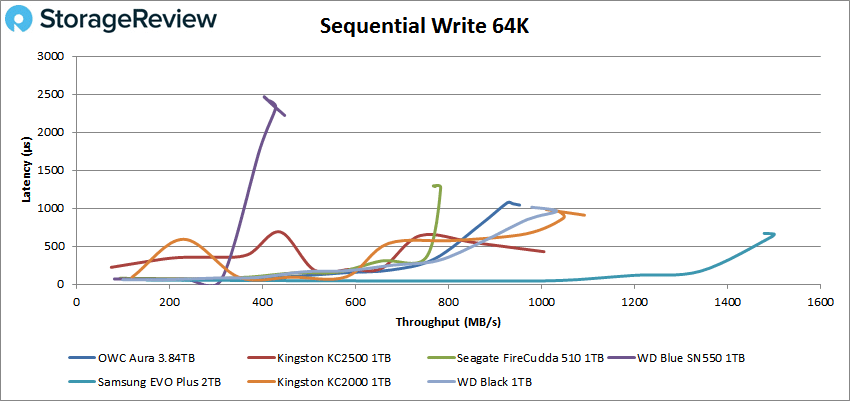
 In 64K write, the OWC Aura P12 showed a peak of 15,240 IOPS or 952MB/s, hitting a just over 1 millisecond for the first time at the end of the test.
 Next, we looked at our VDI benchmarks, which are designed to tax the drives even further. These tests include Boot, Initial Login, and Monday Login. For the Boot test, the OWC Aura P12 showed a solid peak of 92,850 IOPS at a latency of 371.3µs just before it dipped in performance.
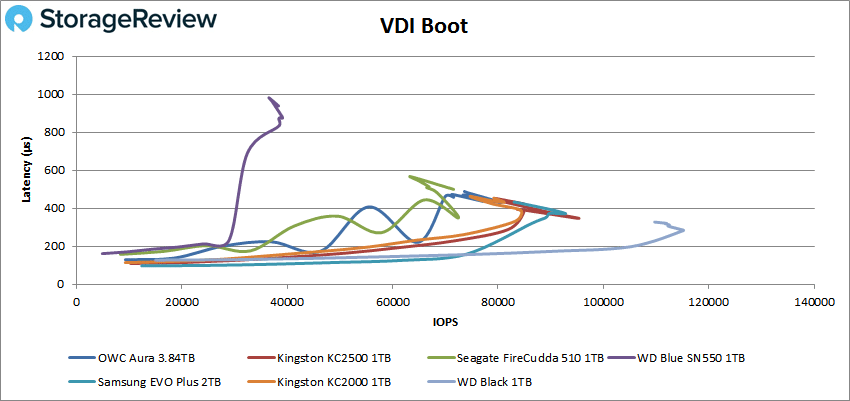 Looking at our VDI Initial Login, the OWC Aura P12 showed a decent peak of 44,601 IOPS at a latency of 668.4µs before dropping off a bit once more.
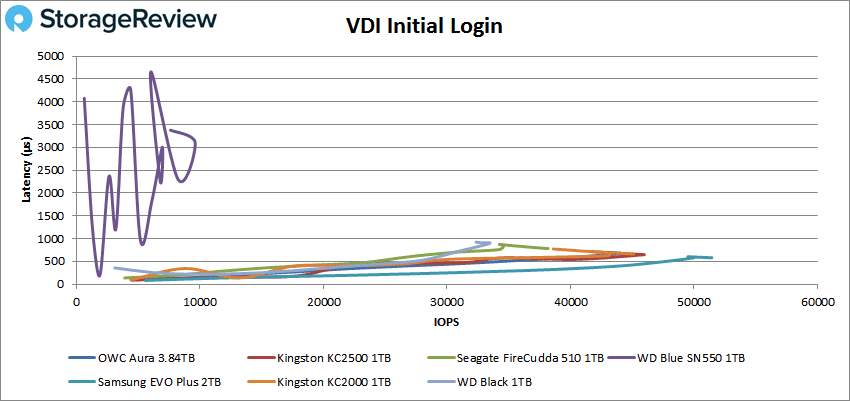
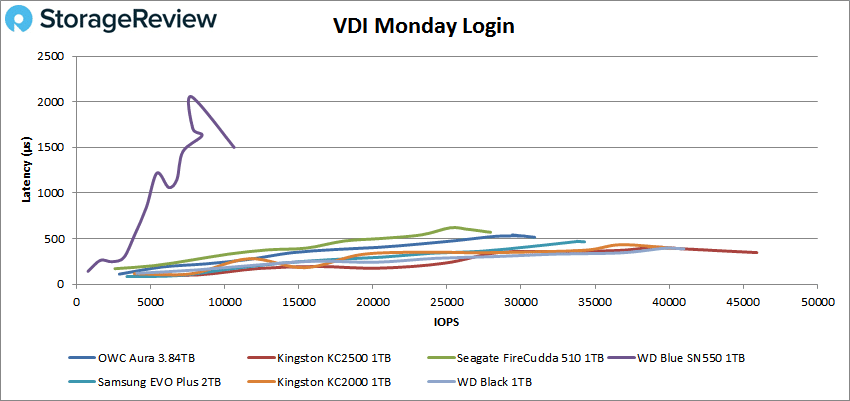
 Finally in our last test, VDI Monday Login, the OWC Aura P12 finished with a peak performance of 30,916 IOPS at a latency of just 515µs (again, slipping in performance slightly at the very end).
 Conclusion
 Conclusion
The OWC Aura P12 is an affordable, high-performance consumer drive ideal for those looking to leverage NVMe storage speeds to significantly improve their media project workflows and gaming system builds (or simply for those who want to improve overall computing experience). It comes equipped with a Phison E12 controller, 3D TLC NAND, and up to 4TB of storage inside the compact M.2 2280 form factor. The OWC Aura P12 also offers 7% over-provisioning, allocated free space that improves SSD lifespan, endurance, and overall performance.
For performance, we saw good results. Beginning with the Application Workload Analysis, the OWC Aura P12 reached an impressive 3,160.9 TPS (only behind the Samsung EVO Plus drives) with an average latency of just 2ms in SQL Server output benchmarks, placing it at the top of the leader boards. In our VDbench test, the Aura P12 showed some pretty good overall results, including 353,528 IOPS in 4K read, 171,540 IOPS in 4K write, 2.3GB/s in 64K read, and 952MB/s in 64K write. In our VDI Clone, we saw 92,850 IOPS in boot, 44,601 IOPS in initial login, and 30,916 IOPS in Monday login.
Overall, the Aura P12 is a very nice release from OWC for several reasons. It combines NVMe performance with affordability (under $200 for the 1TB model), making it a great choice for those looking to upgrade their system to the speedy SSD interface at a reasonable cost. Moreover, the drive offers 4TB capacity in an M.2 form factor, something we don’t see a lot of in the market from reputable brands. With the massive capacity comes a cost premium on a per/TB basis, but those those who have a workload that can benefit from this density, the P12 is a worthy investment.


 Amazon