

The Samsung PM1743 was first introduced at CES 2022 and created a lot of buzz as the company’s inaugural drive to incorporate the latest PCIe Gen5 interface. This advancement in technology could potentially lead to a significant boost in performance for enterprise storage solutions. While our first look at the drive offered a glimpse into its potential, we were eager to explore its full capabilities and assess its value across various enterprise applications. In this review, we put the PM1743 through our comprehensive benchmarking processes.
In terms of performance, the Gen5 PM1743 is quoted to deliver impressive sequential read speeds of up to 13GB/s, while random read speeds are expected to surpass the 2.5 million IOPS mark. These figures represent a 1.9x and 1.7x improvement in speed, respectively, over the previous generation PM1733 PCIe Gen4 drive. Write speeds are just as remarkable, with quoted sequential and random speeds of 6.6GB/s and 250,000 IOPS, respectively.
Combining the company’s advanced sixth-generation V-NAND technology with an in-house controller, the PM1743 features enhanced power efficiency compared to its predecessor. With power efficiency reaching up to 608MB/s per watt, the PM1743 consumes approximately 30% less power than last-generation Gen drives. This has the potential to significantly reduce operating costs for servers and data centers when deploying these drives on a larger scale, making it an attractive choice for enterprises looking to optimize performance and energy consumption.
Samsung’s PM1743 also features different form factors to meet diverse enterprise needs. Available in capacities ranging from 1.92TB to 15.36TB, it supports the traditional 2.5-inch and the emerging 3-inch EDSFF (E3.S) form factor. Moreover, the PM1743 is one of the industry’s first PCIe Gen5 SSD with dual-port support, which helps ensure consistent operation and high availability for servers and storage arrays if one of the ports fails.
Samsung also focuses on security with their new SSD—paramount to many organizations—by adding a range of advanced features. It includes an embedded security processor and Root of Trust (RoT) to safeguard against malicious threats and data forgery. These robust security measures enable features such as Secure Boot in server systems through attestation, providing enhanced data protection for critical enterprise applications.
Samsung PM1743 Specifications
| Interface | PCIe 5.0 (Gen5) |
| NAND Type | V-NAND |
| Controller | Samsung Proprietary |
| Capacities | 2TB, 4TB, 8TB, 16TB |
| Form factors | 2.5-inch / EDSFF (E3.S) |
| Performance |
|
| Power efficiency | 608MB/s per watt |
| Security |
|
Samsung PM1743 Performance
Testbed
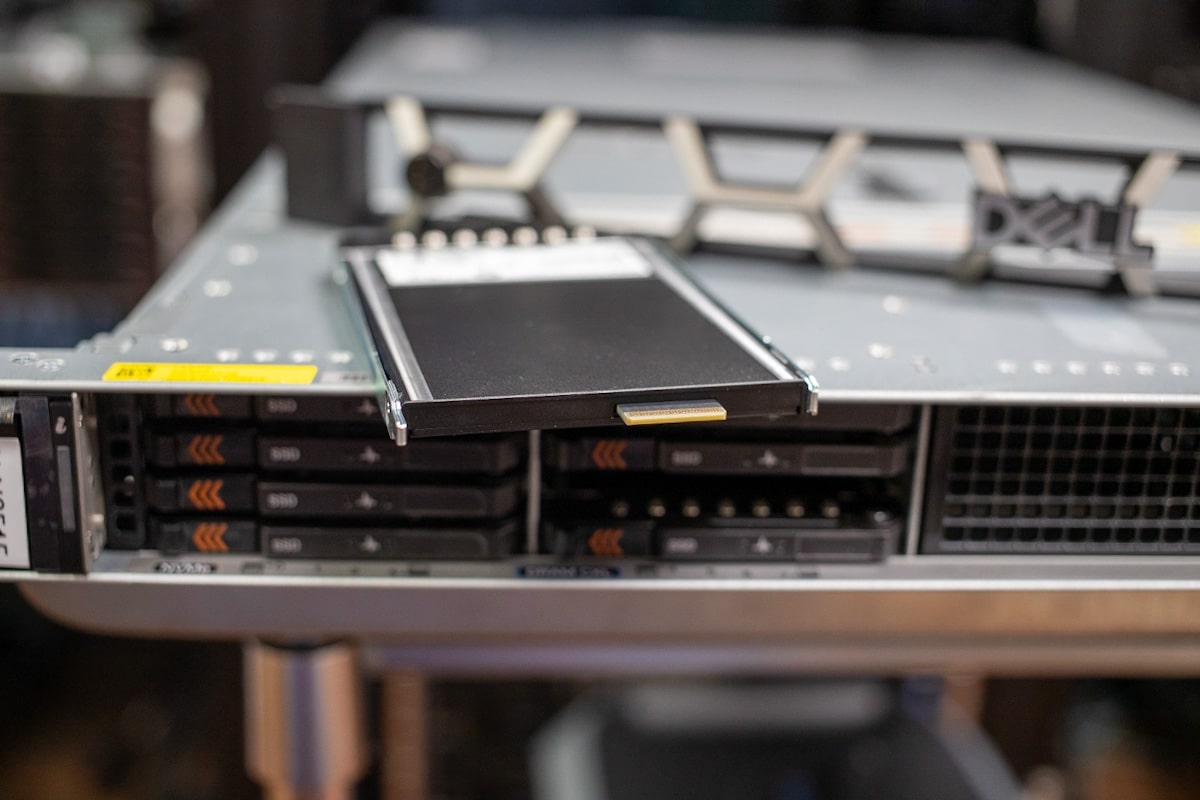
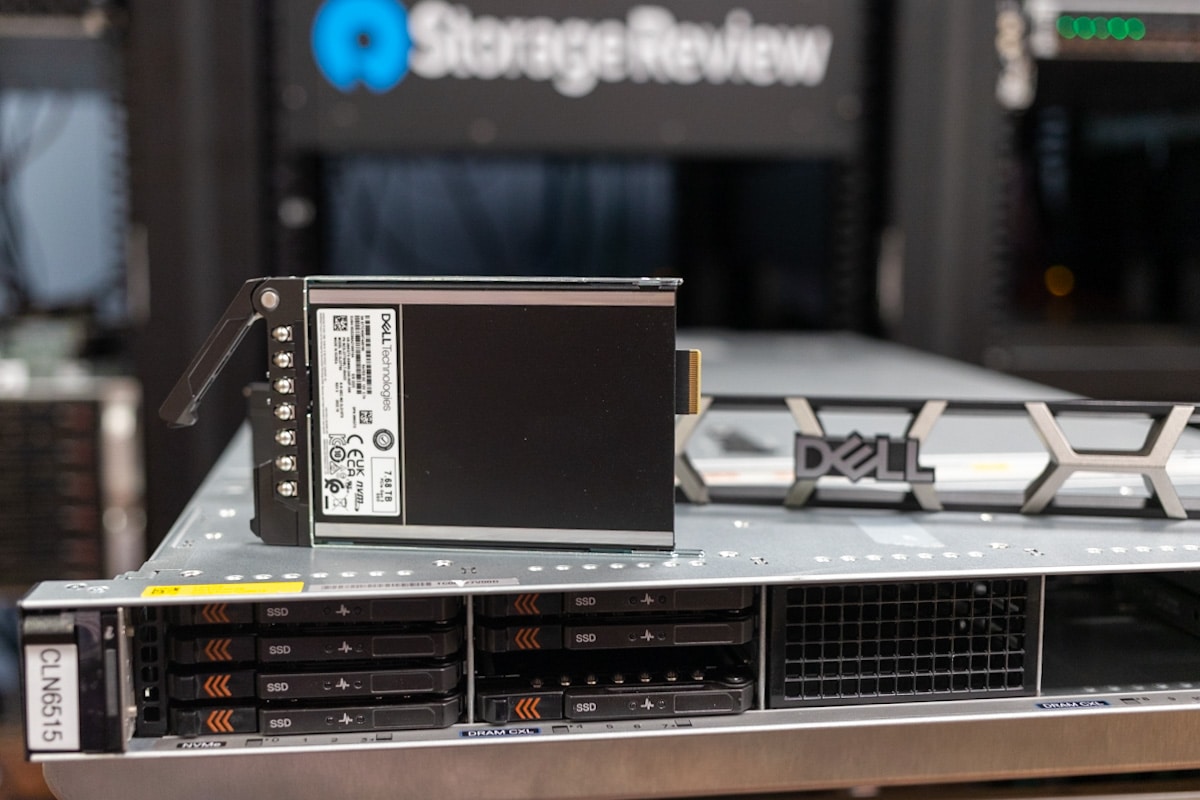
For this review, we leveraged the Dell PowerEdge R660 with the E3.S backplane. This is different from our normal NVMe test platform, which is limited to PCIe GEN4 and the U.2/U.3 SSD form factor. For this reason, we only brought in one comparison device for reference, the 7.68TB Samsung PM9A3.
Dell PowerEdge R660 with E3.S Backplane
Here is our Dell PowerEdge R660 configuration for this review:
- 2 x Intel Platinum Xeon 8460Y CPUs
- 16 x 16GB 4800 DDR5
- 8 x Samsung PM1743 7.68GB E3.S SSDs
Sysbench Performance
The next application benchmark consists of a Percona MySQL OLTP database measured via SysBench. This test measures average TPS (Transactions Per Second), average latency, and average 99th-percentile latency.
Each Sysbench VM is configured with three vDisks: one for boot (~92GB), one with the pre-built database (~447GB), and the third for the database under test (270GB). From a system resource perspective, we configured each VM with 8 vCPUs, and 60GB of DRAM and leveraged the LSI Logic SAS SCSI controller.
Sysbench Testing Configuration (per VM)
- CentOS 6.3 64-bit
- Percona XtraDB 5.5.30-rel30.1
-
- Database Tables: 100
- Database Size: 10,000,000
- Database Threads: 32
- RAM Buffer: 24GB
- Test Length: 3 hours
- 2 hours preconditioning 32 threads
- 1 hour 32 threads
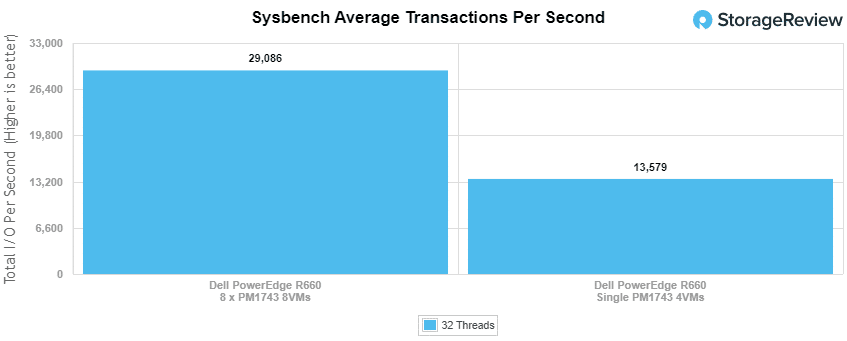
For these benchmarks, we used two configurations:
- 8 x PM1743 at 8 VMs
- 1 x PM1742 at 4 VMs
Starting with average transactions per second (TPS), the Samsung PM1743 posted 29,086 TPS and 13,579 TPS for 8VMs across 8 SSDs and 4VMs on a single SSD, respectively.
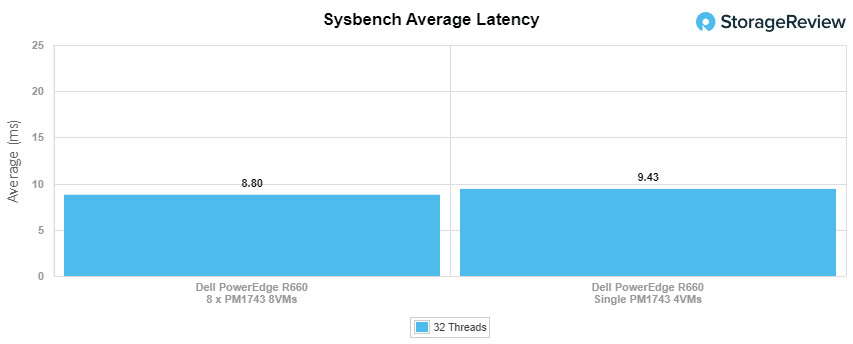
 In Sysbench Average Latency, it hit 8.80ms (8 VMs) and 9.43ms (4VMs).
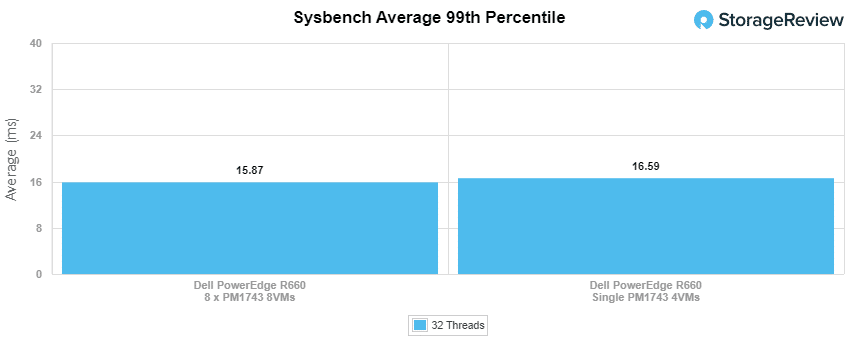
Sysbench 99th percentile, the Samsung PM1743 showed a latency of 15.87 and 16.59 for 8VMs and 4VMs, respectively.
VDBench Workload Analysis
When it comes to benchmarking storage devices, application testing is best, and synthetic testing comes in second place. While not a perfect representation of actual workloads, synthetic tests help baseline storage devices with a repeatability factor that makes it easy to compare apples-to-apples between competing solutions. These workloads offer a range of testing profiles ranging from “four corners” tests and common database transfer size tests to trace captures from different VDI environments.
All of these tests leverage the common vdBench workload generator, with a scripting engine to automate and capture results over a large compute testing cluster. This allows us to repeat the same workloads across a wide range of storage devices, including flash arrays and individual storage devices. Our testing process for these benchmarks fills the entire drive surface with data and then partitions a drive section equal to 25% of the drive capacity to simulate how the drive might respond to application workloads. This differs from full entropy tests, which use 100 percent of the drive and take them into a steady state. As a result, these figures will reflect higher-sustained write speeds.
Profiles:
- 4K Random Read: 100% Read, 128 threads, 0-120% iorate
- 4K Random Write: 100% Write, 128 threads, 0-120% iorate
- 16K Sequential Read: 100% Read, 32 threads, 0-120% iorate
- 16K Sequential Write: 100% Write, 16 threads, 0-120% iorate
- 64K Sequential Read: 100% Read, 32 threads, 0-120% iorate
- 64K Sequential Write: 100% Write, 16 threads, 0-120% iorate
- 4K, 8K, and 16K 70R/30W Random Mix, 64 threads, 0-120% iorate
- Synthetic Database: SQL and Oracle
- VDI Full Clone and Linked Clone Traces
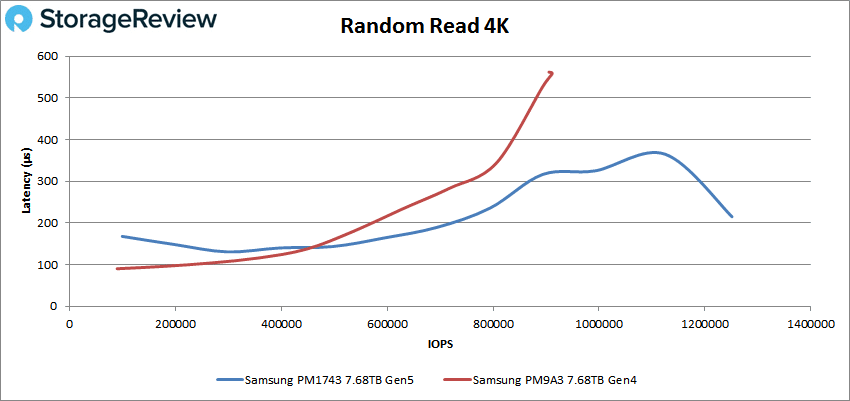
In our first VDBench Workload Analysis, random 4K read, the Samsung PM1743 had a peak performance of 1.25 million IOPS at a latency of 215µs.
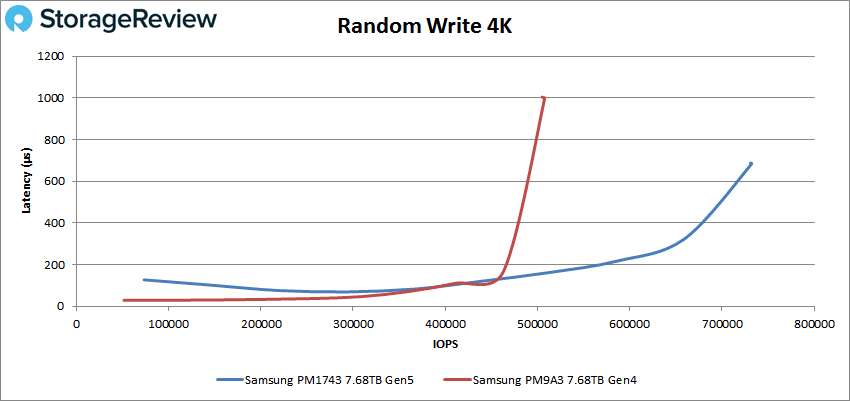
 In 4K random write, the Samsung PM1743 peaked at 732K IOPS with a latency of 684µs.
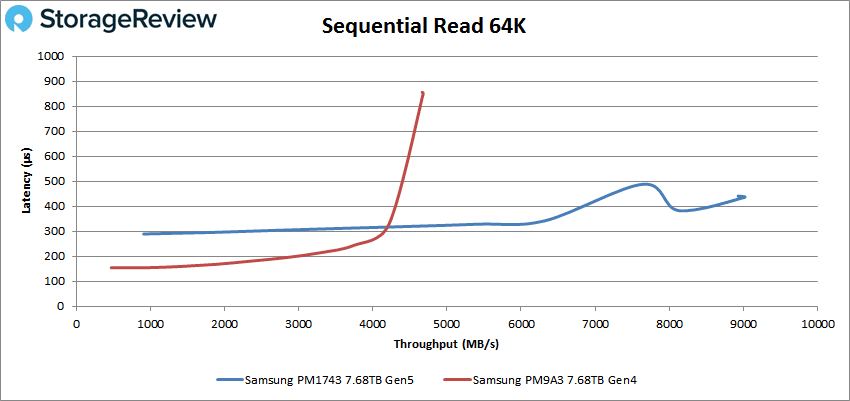
Switching over to 64k sequential workloads, the Samsung PM1743 peaked at 9.01GB/s (144K IOPS) with a latency of 435.9µs.
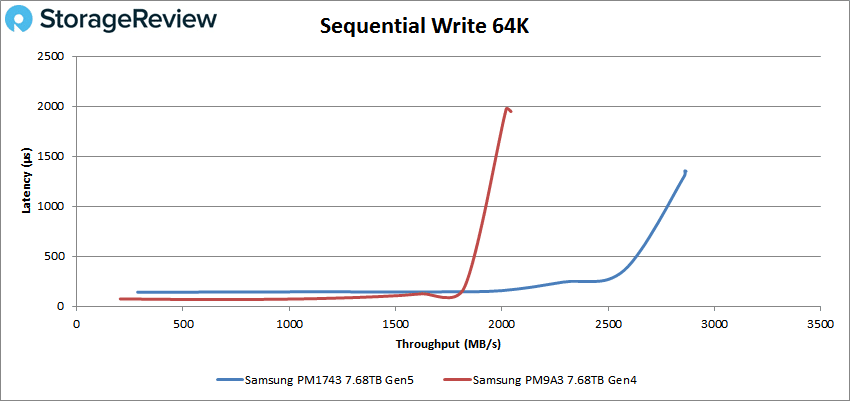
In sequential writes, the Samsung PM1743 posted 2.86GB/s write (46K IOPS) at 1,350µs in latency.
Next up are the 16K tests. The Samsung PM1743 fell back some, finishing at 169K IOPS (2.64GB/s) at 81.5µs.
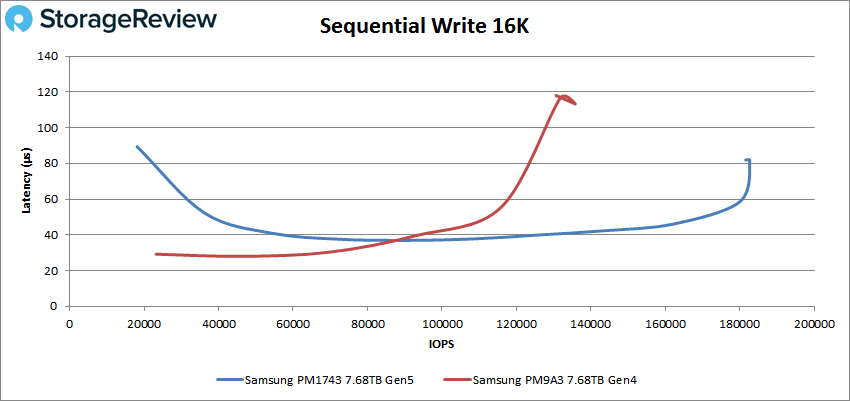
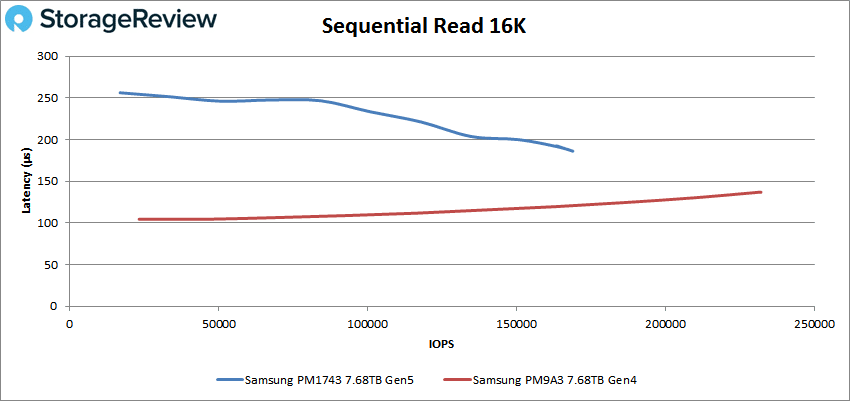 The Samsung PM1743 improved significantly in sequential write 16K, reaching 183K IOPS (2.85GB/s) at just 82.3µs.
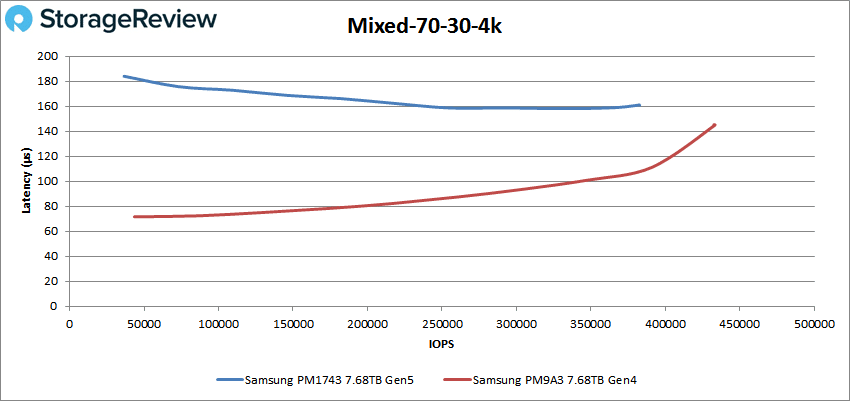
Now for our mixed read/write profiles, starting with 70/30 4K. Here, the new PM1743 Samsung drive hit 183K IOPS at 168µs, trailing the PM9A3 Gen4 drive.
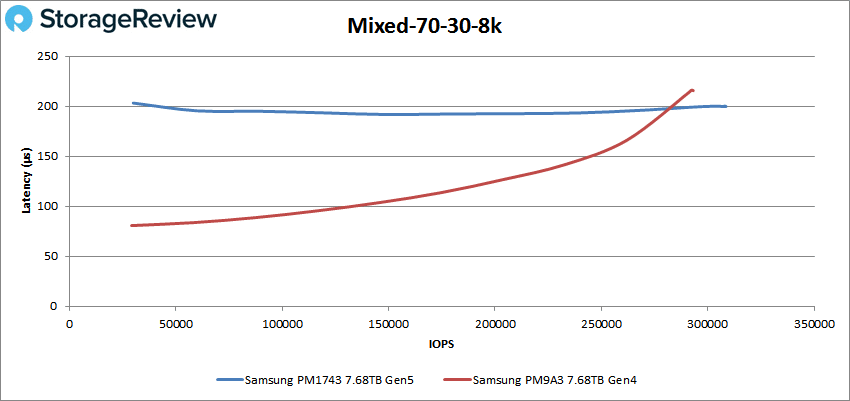
The Samsung PM1743 showed steady latency in the 8k 70/30 test, posting a peak of 308K IOPS at 199.8µs.
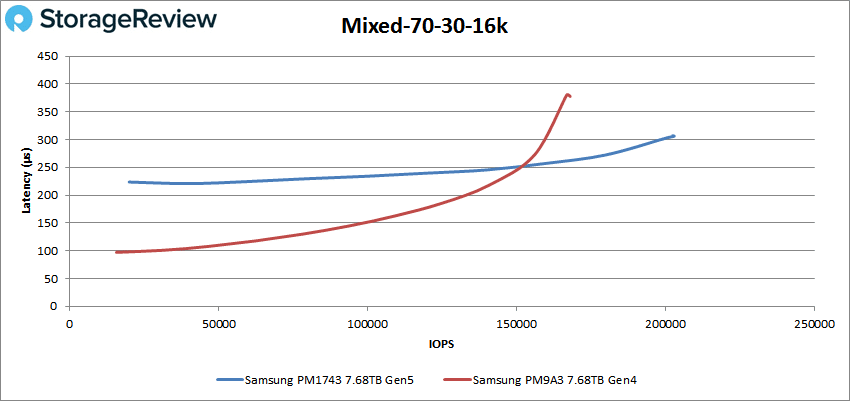
In the 70/30 16K profile, the Samsung PM1743’s completed the test at 203K IOPS at 306.1µs.
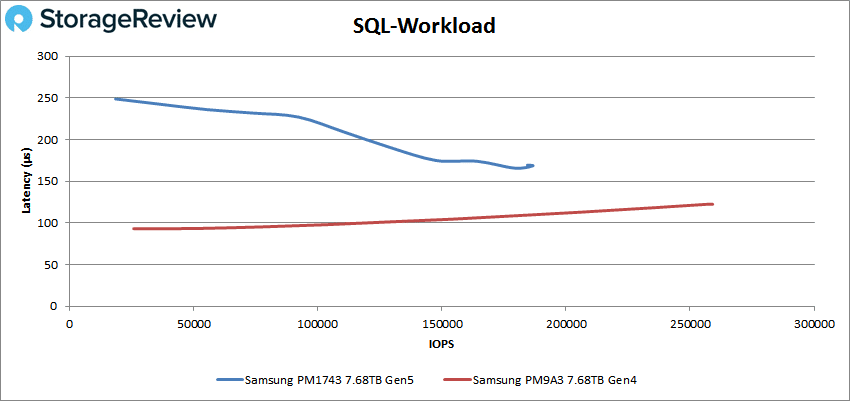
Our next set of tests is our SQL workloads: SQL, SQL 90-10, and SQL 80-20. Here, the PM1743 trailed the Gen4 drive significantly in all these tests. Starting with SQL, the Samsung PM1743 posted a peak performance of 187K IOPS with a latency of 168.5µs.
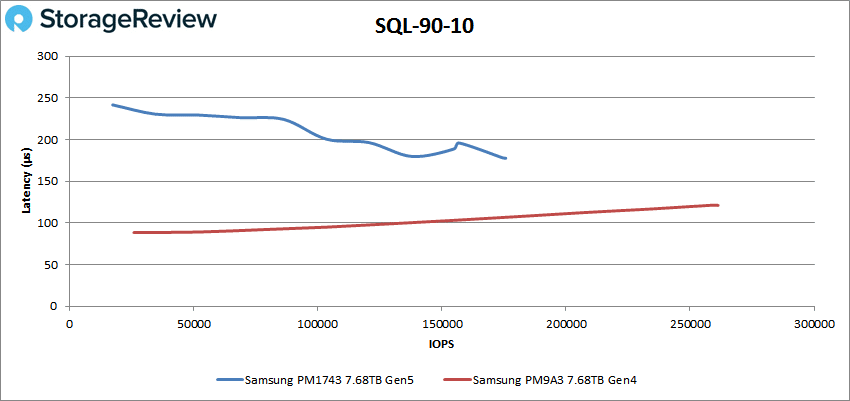
 In SQL 90-10, the new Samsung drive showed a peak performance of 176K with a latency of 177.7µs.
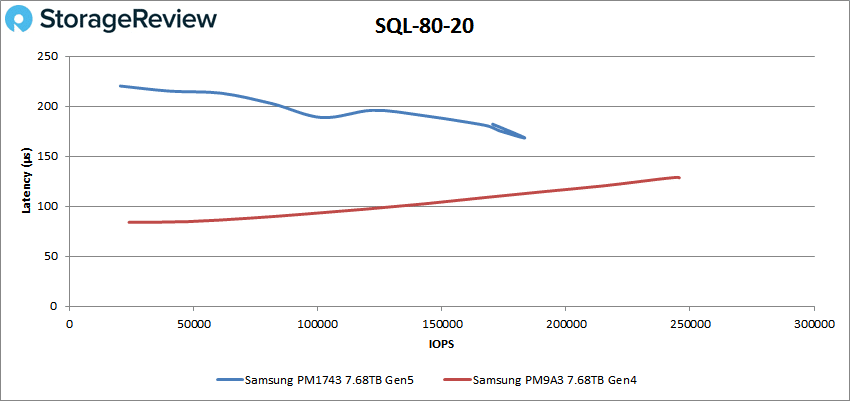
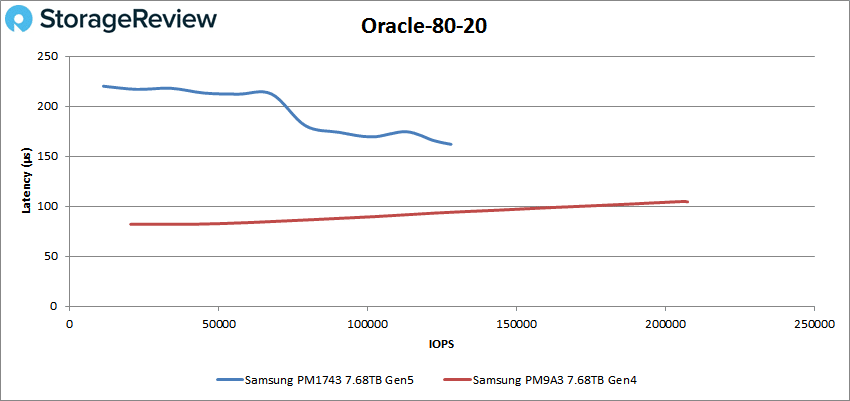
With SQL 80-20, the Samsung PM1743 peaked at 186K IOPS at a latency of 168.4µs (with a performance spike at the end), again trailing just the PM9A3 Gen4 drive.
Next are the Oracle workloads (Oracle, Oracle 90-10, and Oracle 80-20), where the PM1743 trailed the PM9A3 in all tests once again. Starting with the general Oracle workload, the new Samsung drive had a peak performance of 183K IOPS at 193.7µs.
 Looking at Oracle 90-10, the Samsung PM1743 posted a peak performance of 123K IOPS at 169µs.
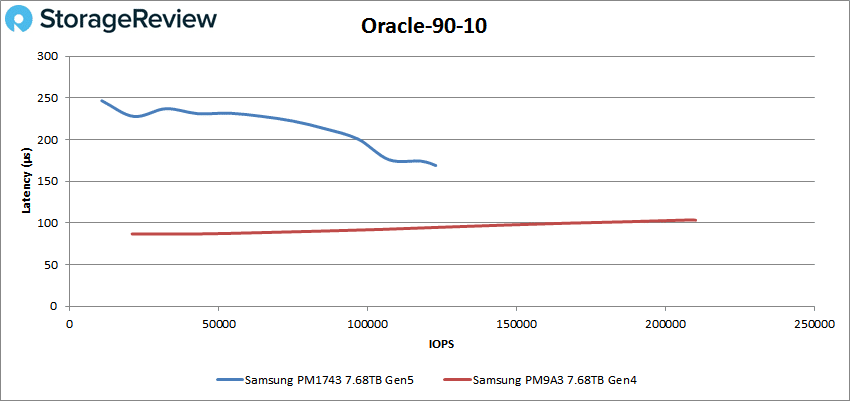
Next up is Oracle 80-20, where the PM1743 peaked at 128K IOPS at 162µs.
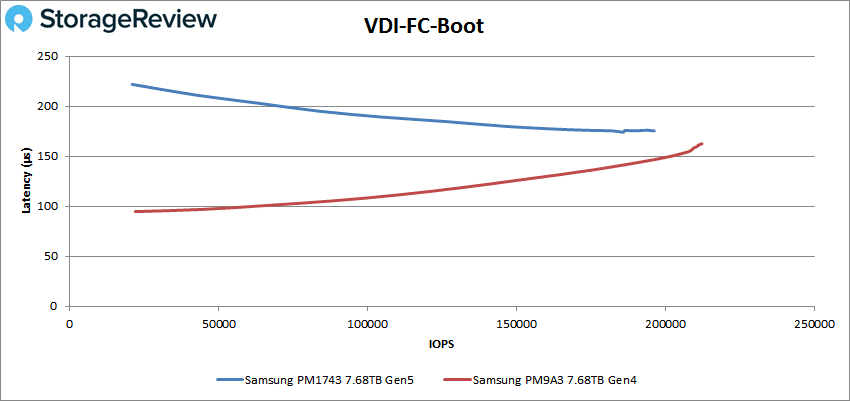
Next, we switched to our VDI clone test, Full and Linked, where the Samsung PM1743 performed well. For VDI Full Clone (FC) Boot, it peaked at 196K IOPS with a latency of 175.4µs.
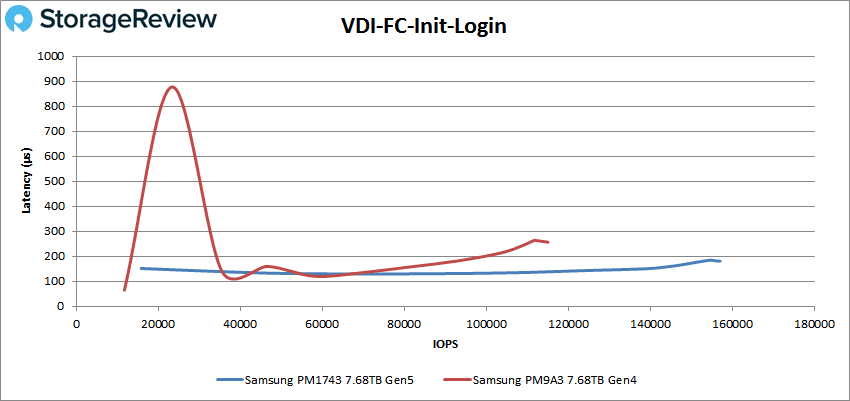 During VDI FC Initial Login, the PM1743 peaked at 157K IOPS with a latency of 180.7µs.
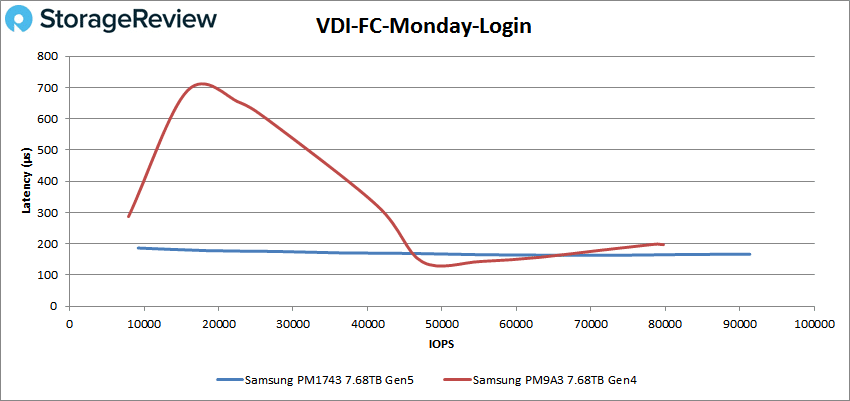
With VDI FC Monday Login, the Samsung PM1743 posted impressive steady performance, peaking at 91K IOPS at a latency of 166.6µs.
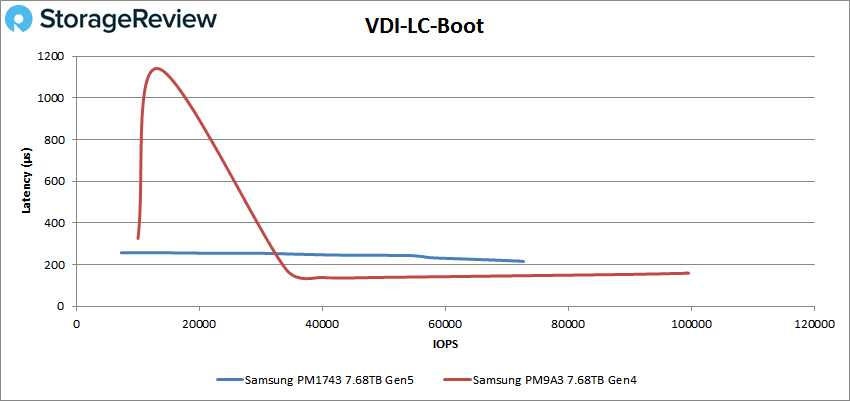
For VDI Linked Clone (LC) Boot, the PM1743 ended the test at a steady 73K IOPS with 215.5µs.
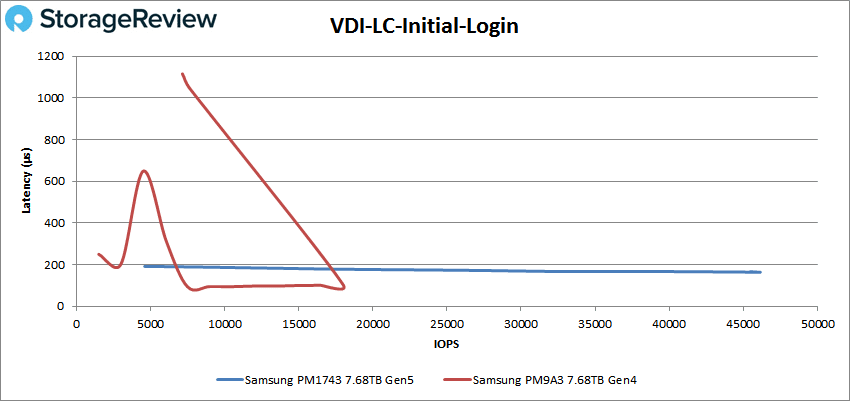
 In VDI LC Initial Login, the Samsung PM1743 continued with its stable and impressive performance, where it peaked at 46K IOPS at 163.7µs (though it took just a slight (hard to see) spike at the end.
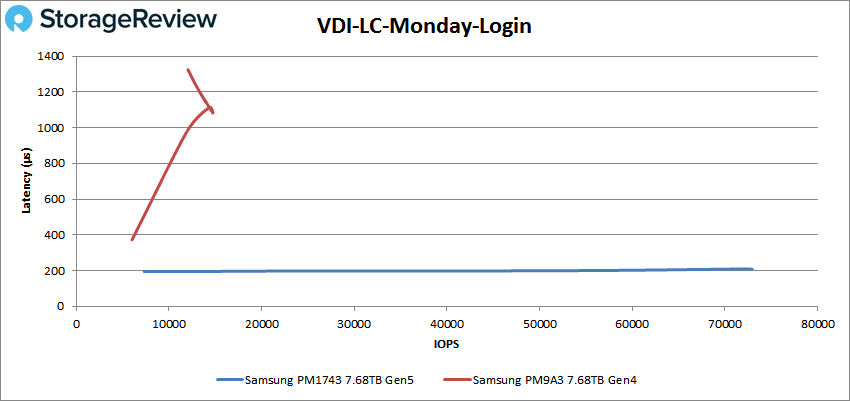
For VDI LC Monday Login, the PM1743 was by far the best drive, peaking at 73K IOPS with a latency of 209.1µs (again, showing a straight line of stable performance).
Conclusion
The Samsung PM1743 SSD stands as a testament to the power and potential of PCIe Gen5 technology. While it doesn’t win in all categories in our benchmarking, its overall performance gains, improved power efficiency, and robust security features more than meets the demanding storage requirements of today’s enterprise servers.
 As for the specifics of its performance, some highlights include 1.25 million IOPS in 4k random reads, 732K IOPS in 4k random writes, 9.01GB/s in sequential reads, and 2.86GB/s in sequential writes. In our mixed read/write benchmarks, the PM1743 hit 183K IOPS in our 70/30 4K profile (which trailed the Gen4 drive).
EDSFF form factor SSDs are starting to gain traction in the enterprise. We’ve seen E3.S specifically in the Dell PowerEdge R660 we tested with here, but they’re also popping up in storage servers like the HPE Alletra 4110 and of course, Supermicro has a few solutions that offer these drive bays. E3.S SSDs will earn most of the new high-performance enterprise drive slots as customers move to high-performance Gen5 SSDs.
As to the PM1743 reviewed here, without more competitors, it’s hard to see exactly where this drive stands. But that’s also a credit to Samsung’s engineering. Gen5 SSDs aren’t easy, we’ve seen many delays in the industry as controller vendors wrestle with the complexity. As Samsung is vertically integrated and has its own controller, maybe the process has a little less friction for them.
In any event, the PM1743 clearly has made great strides in most workloads when we look at it compared to the PM9A3. But there are still a few spots where the older drive wins out, the database workloads specifically. We’re guessing Samsung will iron this out though, we’ve seen this in the past with new technology shifts. We’re glad to see Gen5 show up in the latest server refreshes and welcome the opportunity to test more Gen5 SSDs as they come to market.


 Amazon