

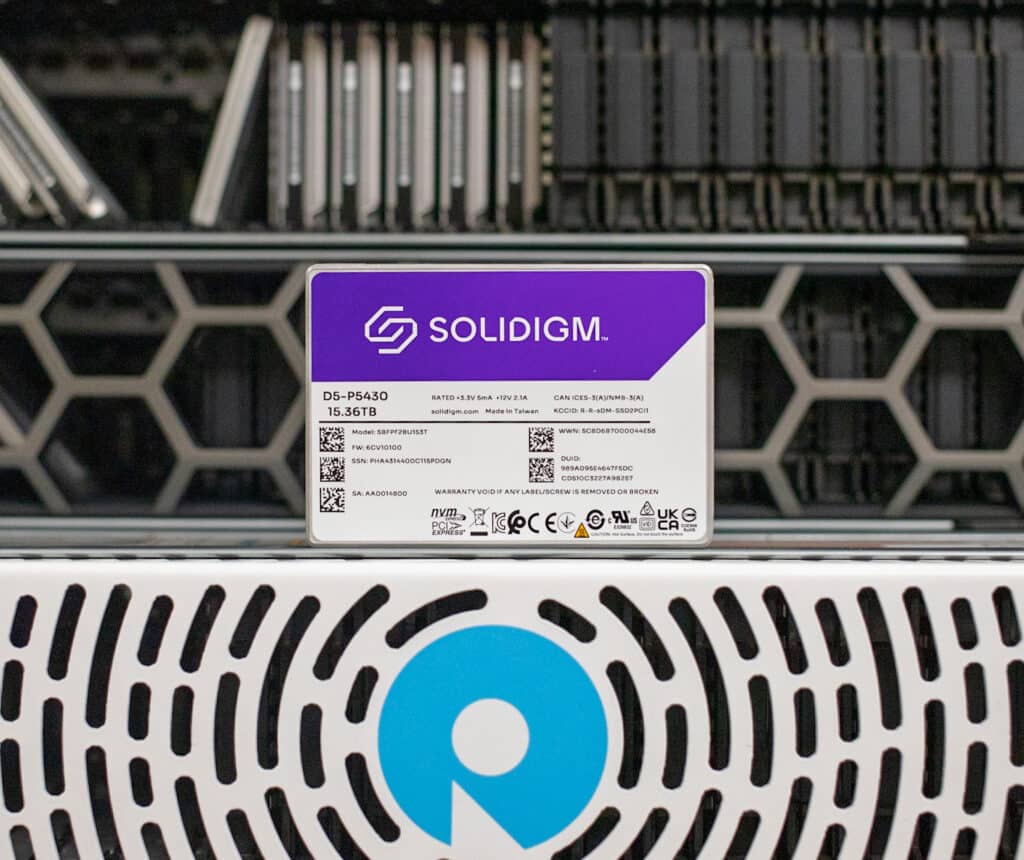
Solidigm has launched the next evolution of its popular enterprise QLC SSD family, the D5-P5430. The Solidigm P5430 is optimized for mainstream and read-intensive applications, targeting the bulk of enterprise work like the P5316 before it. The P5430 will be available in several form factors and capacities. A U.2 15mm will ship in 3.84TB-30.72 capacities, and the E3.S 7.5mm form factor will do the same. Solidigm also has a 9.5mm E1.S drive that will be delivered in 3.84TB-15.36TB capacities.
The P5316 has been a mainstay in our lab, we’ve worked with it extensively in use cases like autonomous driving data logging to housing our 100 trillion digit Pi run. The drives have also seen mainstream use in storage platforms like Dell PowerScale and continue to be qualified in storage, server, and hyperscale uses where cost-optimized flash capacity is in demand. As such, Solidigm is justifiably excited to launch its first new enterprise SSD after SK hynix acquired the SSD assets from Intel.
In terms of hardware, the Solidigm P5430 is vertically integrated, with an in-house controller, NAND, and firmware. On the NAND side, the P5430 gets the latest 192-layer NAND, up from the 144-layer in the P5316. Solidigm has also layered in firmware and other software enhancements like improved telemetry and OCP 2.0 log pages.
One other technical note is the P5430 now uses an indirection unit (IU) of 4KB for all but the largest capacities of each form factor which will use an 8KB IU. The P5316 has a 64KB IU. What this means is that with the larger IU, more work needs to be done to align writes for the drive to ensure that write amplification is controlled. With smaller IUs on the P5430, these drives are a much easier drop-in replacement for hypervisors, etc., that live in the world or smaller block sizes. This change should also net a performance benefit for small block writes, where the P5316 suffered previously.
Looking at key specs, the P5430 delivers up to 971K IOPS 4K random read performance and 120K IOPS random write. With 128K sequential, Solidigm posts up to 7,000MB/s read and 3,000MB/s write. The drives’ endurance is listed at .58 DWPD for random writes and 1.83 DWPD for sequential writes. QLC is often called out for its endurance limitations, but for most workloads, the drives will far exceed warranty life. We wrote a tremendous amount of data to the P5316s in our Pi work; even then, it would take ten years to exhaust their endurance.
As of today, the U.2 3.84TB, 7.68TB, and 15.36TB drives are generally available. The 30.72TB U.2 and the E1.S and E3.S form factors will be available in the second half of this year. For this review, we’re evaluating the 15.36TB U.2 drive.
Solidigm P5430 Specifications
| Capacity and Form Factors | U.2 and E3.S: 3.84 TB, 7.68 TB, 15.36 TB, 30.72 TB;
E1.S: 3.84 TB, 7.68 TB, 15.36 TB |
| Interface | PCIe 4.0 x4, NVMe 1.4c |
| Media | 192-Įayer 3D ǪĮC NAND |
| Performance |
|
| Idle/Active Power | Up to 5W/25W |
| Endurance (100% random write) | Up to 0.58 DWPD and up to 32 PBW |
| FIPS Compliance | Yes |
| Warranty | 5 years |
| CPU Platform Validation | Intel, AMD, AMPERE, NVIDIA |
| OCP 2.0 | Supported |
Solidigm P5430 Performance
Testbed
Our PCIe Gen4 Enterprise SSD reviews leverage a Lenovo ThinkSystem SR635 for application tests and synthetic benchmarks. The ThinkSystem SR635 is a well-equipped single-CPU AMD platform, offering CPU power well over what’s needed to stress high-performance local storage. Synthetic tests don’t require a lot of CPU resources but still leverage the same Lenovo platform. In both cases, the intent is to showcase local storage in the best light possible that aligns with storage vendor maximum drive specs.
PCIe Gen4 Synthetic and Application Platform (Lenovo ThinkSystem SR635)
- 1 x AMD 7742 (2.25GHz x 64 Cores)
- 8 x 64GB DDR4-3200MHz ECC DRAM
- CentOS 7.7 1908
- ESXi 6.7u3
VDBench Workload Analysis
When it comes to benchmarking storage devices, application testing is best, and synthetic testing comes in second place. While not a perfect representation of actual workloads, synthetic tests help baseline storage devices with a repeatability factor that makes it easy to make apples-to-apples comparisons between competing solutions. These workloads offer a range of testing profiles ranging from “four corners” tests and common database transfer size tests to trace captures from different VDI environments.
All of these tests leverage the common vdBench workload generator, with a scripting engine to automate and capture results over a large compute testing cluster. This allows us to repeat the same workloads across a wide range of storage devices, including flash arrays and individual storage devices. Our testing process for these benchmarks fills the entire drive surface with data and then partitions a drive section equal to 25% of the drive capacity to simulate how the drive might respond to application workloads. This differs from full entropy tests, which use 100 percent of the drive and take them into a steady state. As a result, these figures will reflect higher-sustained write speeds.
Profiles:
- 4K Random Read: 100% Read, 128 threads, 0-120% iorate
- 4K Random Write: 100% Write, 128 threads, 0-120% iorate
- 64K Sequential Read: 100% Read, 32 threads, 0-120% iorate
- 64K Sequential Write: 100% Write, 16 threads, 0-120% iorate
- 64K Random Read: 100% Read, 32 threads, 0-120% iorate
- 64K Random Write: 100% Write, 16 threads, 0-120% iorate
- Synthetic Database: SQL and Oracle
- VDI Full Clone and Linked Clone Traces
In this review, we’re comparing it to the P5316, although it’s a 30.72TB capacity. We don’t have exact comps on the 15.36TB version of this drive, but the data we do have is included. We also have the new Micron 6500 ION included for reference. This drive is TLC NAND, but Micron has taken an aggressive pricing stance, so while we normally would not have competitive TLC drives on QLC charts, we’ve decided it’s relevant here due to capacity point and pricing.
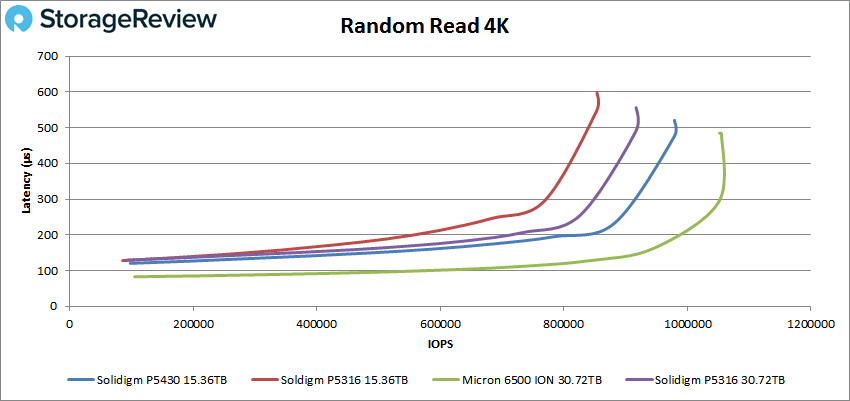
In our first VDBench Workload Analysis, random 4K read, the Solidigm P5430 had a peak performance of just under 1 million IOPS (979 IOPS) at a latency of 520µs. This placed it just behind the Micron 6500 ION.
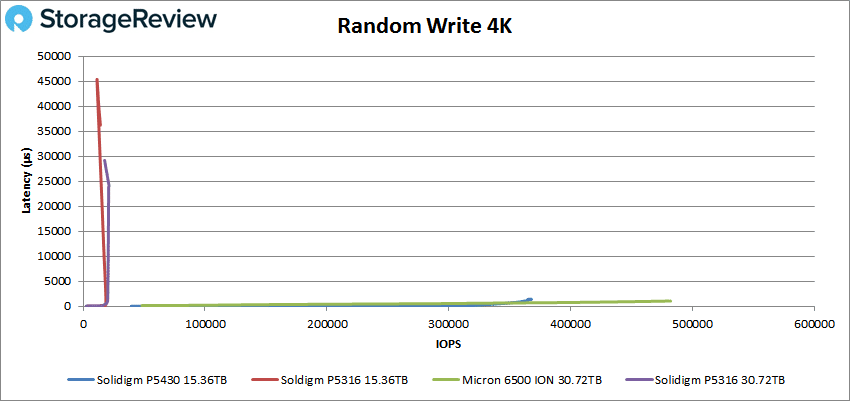
 In 4K random write, the Solidigm P5430 had a peak of 367K IOPS with a latency of 1,384µs. This performed much better than the other two Solidigm drives though it was still well back of the Micron 6500 ION.
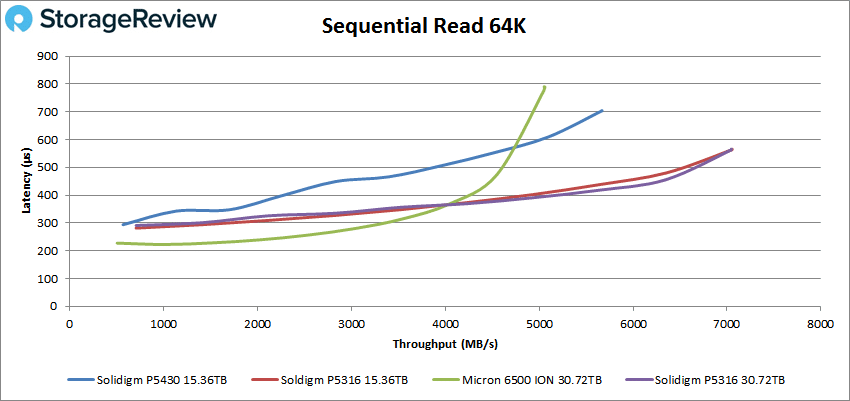
Switching over to 64k sequential workloads, the Solidigm P5430 fell back a bit in 64K read, peaking at 5.7GB/s (91K IOPS) with a latency of 704µs.
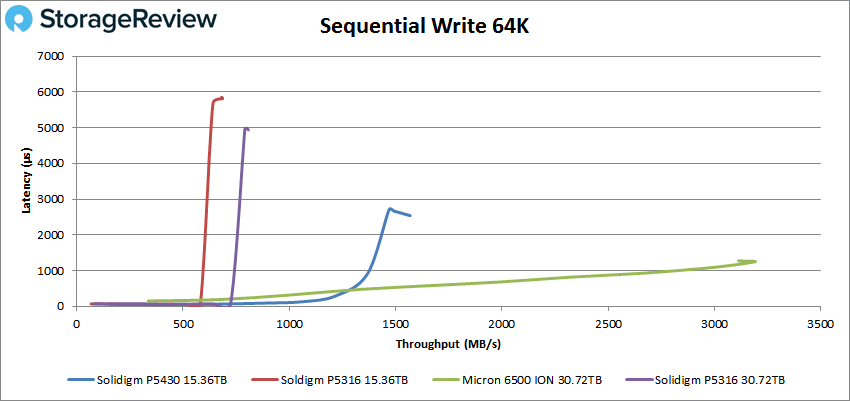
In sequential writes, the Solidigm P5430 posted 1.57GB/s write (24K IOPS) at 2,539µs in latency, placing well back of the 6500 ION but ahead of the other Solidigm drives.
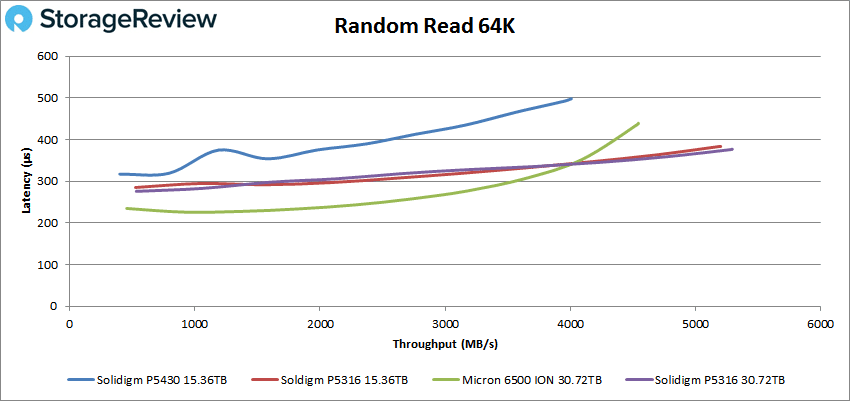
Next up is our 64K random performance, where the new Solidigm drive posted 64K IOPS and 498.1µs in latency in reads. This placed it at the bottom of the leaderboard.
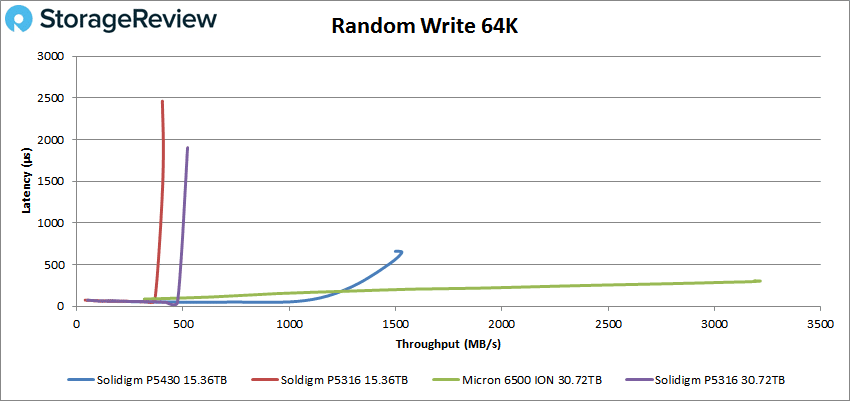
In 54K random writes, the Solidigm P5430 peaked at 24K IOPS with 646.3µs in latency.
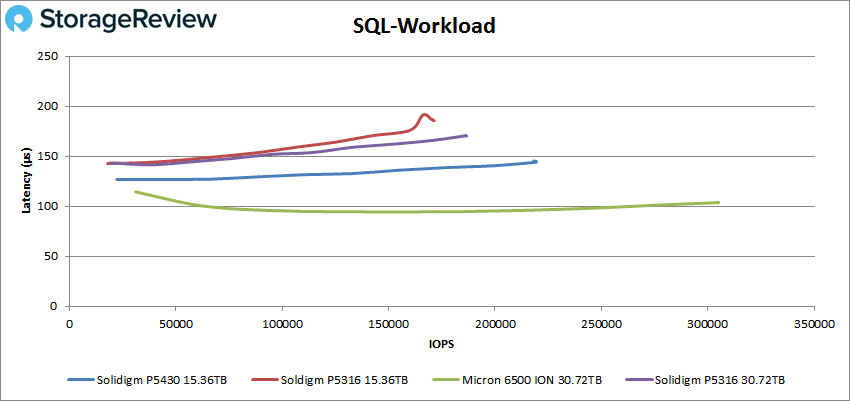
Our next set of tests is our SQL workloads: SQL, SQL 90-10, and SQL 80-20. Starting with SQL, the Solidigm P5430 posted a peak performance of 219K IOPS with a latency of 144.1µs.
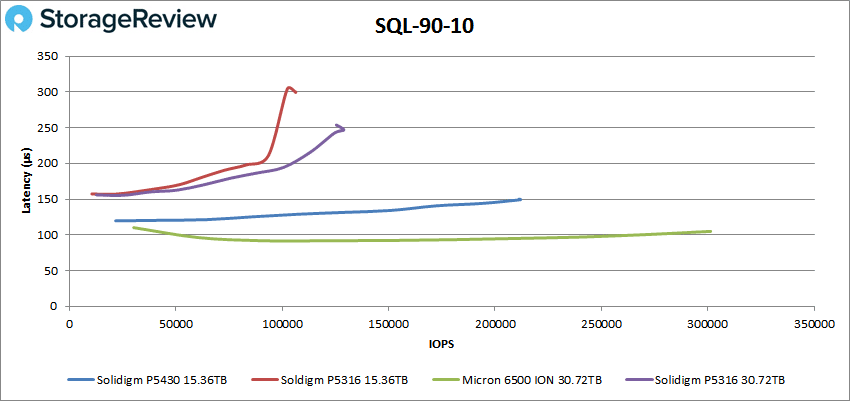
 In SQL 90-10, the new Solidigm drive showed a peak performance of 212K with a latency of 149.3µs.
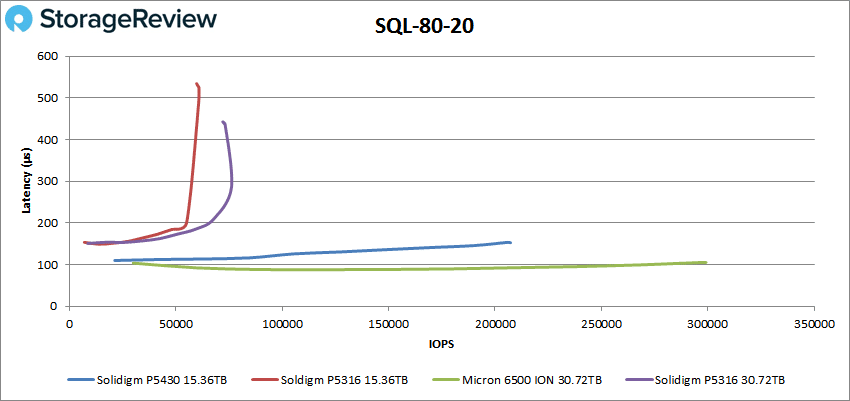
With SQL 80-20, the Solidigm P5430 peaked at 207K IOPS at a latency of 152.7µs, again trailing just the new Micron drive.
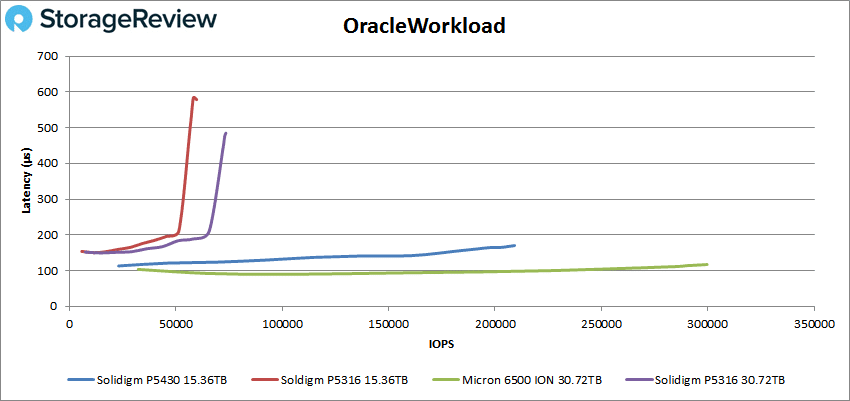
Next up are our Oracle workloads: Oracle, Oracle 90-10, and Oracle 80-20. As with the SQL benchmarks, the Solidigm P5430 continued to take second place with decent numbers. Starting with the general Oracle workload, the Micron drive had a peak performance of 209K IOPS at 170.2µs.
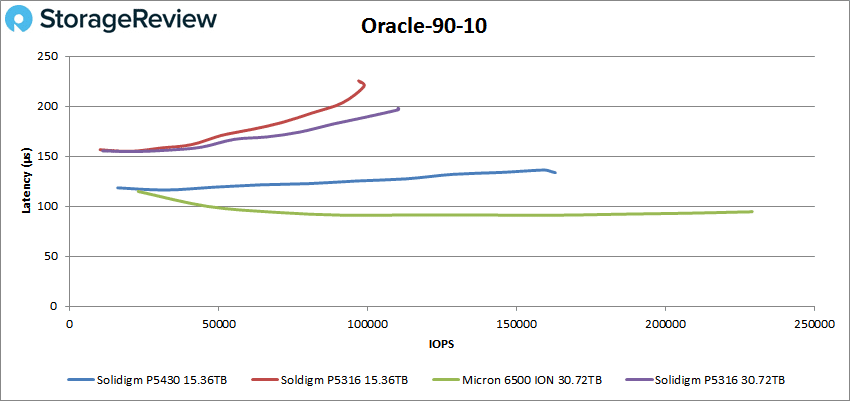
 Looking at Oracle 90-10, the Solidigm P5430 posted a peak performance of 163K IOPS at 133.6µs.
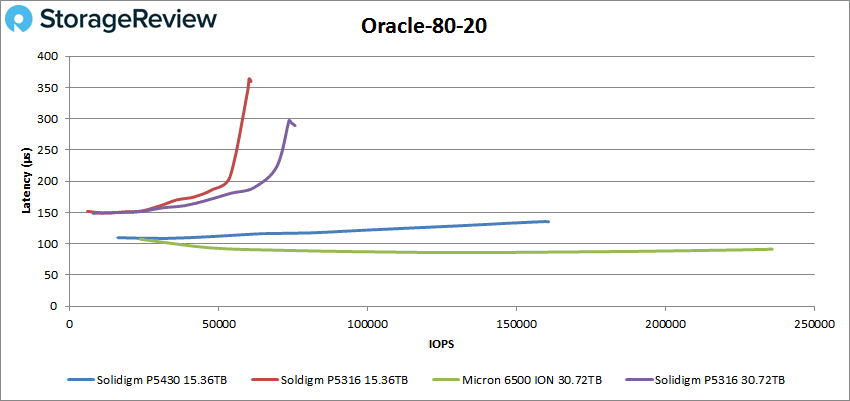
Next up is Oracle 80-20, where the P5430 peaked at 161K IOPS at 135.2µs.
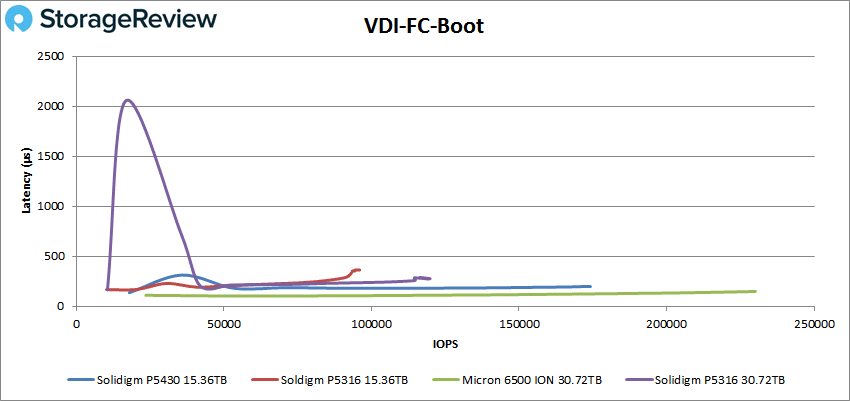
Next, we switched to our VDI clone test, Full and Linked. For VDI Full Clone (FC) Boot, it peaked at 174K IOPS with a latency of 198.1µs.
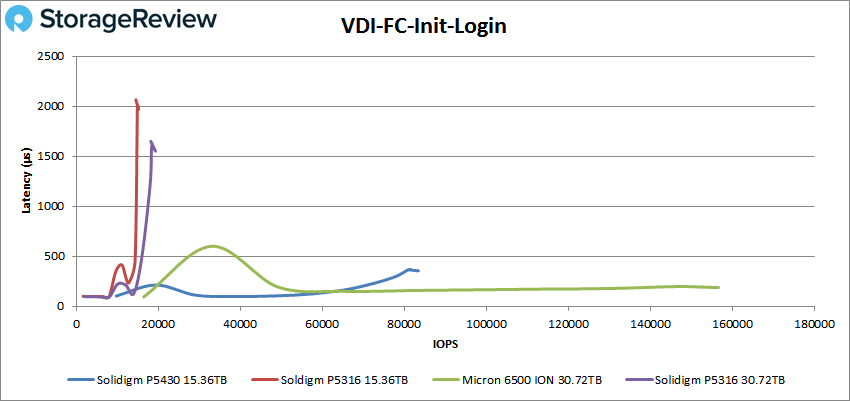
During VDI FC Initial Login, the P5430 peaked at 83K IOPS with a latency of 355.3µs.
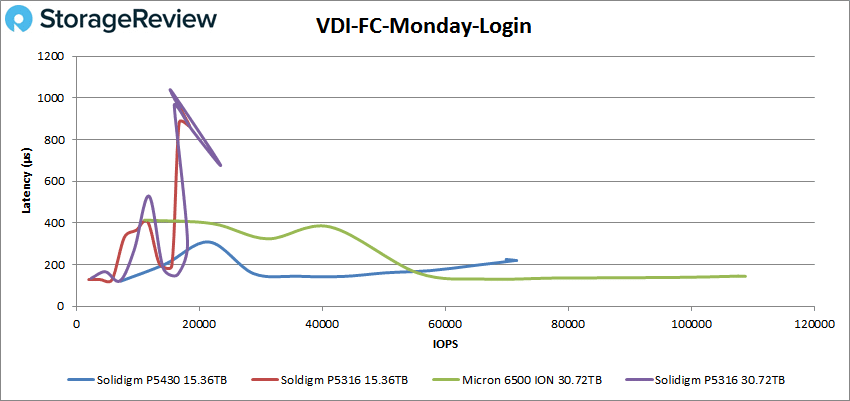
With VDI FC Monday Login, the Solidigm P5430 posted 71K IOPS at a latency of 220µs before taking a small spike at the end of the test.
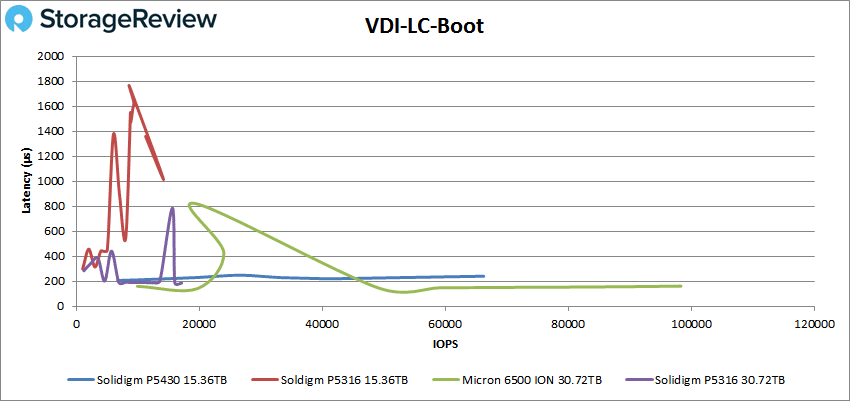
For VDI Linked Clone (LC) Boot, the P5430 showed a peak of 66K IOPS with 240.3µs trailing the Micron drive again.
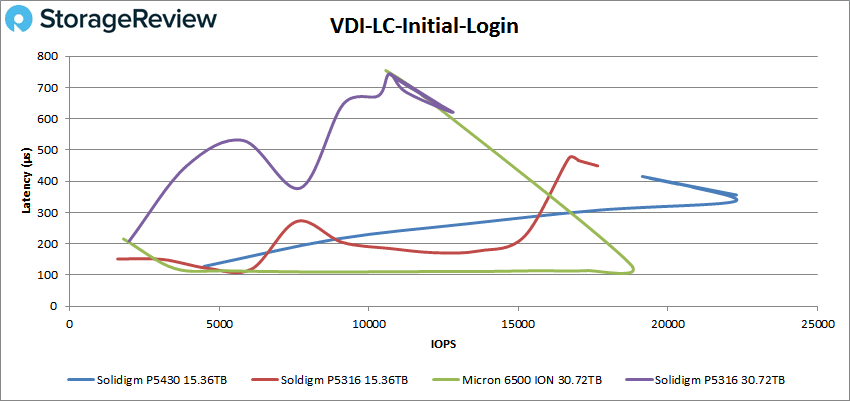
 In VDI LC Initial Login, the Solidigm P5430 showed some instability, where it peaked at 22K IOPS at roughly 356.8µs, taking a decent spike in performance at the end.
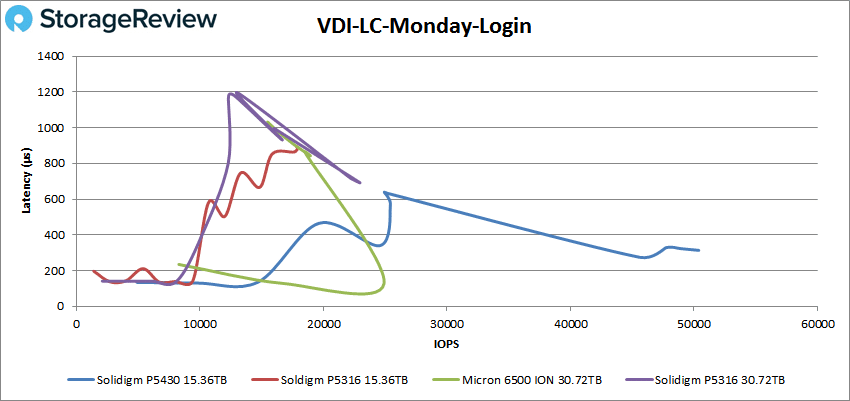
For VDI LC Monday Login, the P5430 was by far the best drive, peaking at 50K IOPS with a latency of 313.8µs.
Final Thoughts
There’s little doubt that storage density is the best way for organizations to make data centers more efficient, both in terms of data rack U footprint and watts consumed per TB. While the capacities ranging up to 30.72TB in the P5430 aren’t new — the P5316 already did that — Solidigm will have 30.72TB in a single-board E3.S form factor (7.5mm). This opens up a tremendous density gain in servers that opt to squish as many as twice the SSDs in their server designs, compared to 15mm U.2/U.3. QLC drives will also continue to leap ahead of TLC in terms of system-wide density as a result.
In terms of performance, the P5430 dramatically out-paces the P5316 in aggregate. The performance gains are most noticeable in write improvement, where the P5430 looks like an entirely different drive compared to its predecessor. Nowhere is this more evident than 4K writes, which was always the Achilles heel of the P5316, and probably one of the reasons VMware is yet to qualify that drive. With the native 4KB IU in the P5430, Solidigm obviously listened to the market feedback and put together a drive that’s an easy drop-in for virtualized workloads, where most enterprise apps play.
The other performance note worth highlighting is the P5430 hangs really well with the new Micron 6500 ION, which offers 30.72TB with TLC NAND. Our review comp here is the 15.36TB capacity from Solidigm, so we’ll still need to see how the 30.72TB P5430 does when it’s released later this year. But when we look at the database testing specifically, the performance delta is minimal for the intended deployment scenarios, to the point where application owners would unlikely notice any difference in delivery.
The P5430 is Solidigm’s first enterprise SSD launch as an independent company. It’s great to see the purple logo in the lab and even better to see the drive’s performance profile. The P5430 improves almost everywhere over the P5316, and in the spots where Solidigm targeted like 4K writes, it’s night and day. Couple that with the fact that later this year they’ll have 30.72TB in a 7.5mm E3.S form factor, and the density and energy consumption per TB stories for storage servers get extremely compelling.


 Amazon