

The Supermicro 1124US-TNRP is a 1U server that leverages the new AMD EPYC 7003 processors. The server is part of Supermicro’s A+ Ultra family. If the name and the picture below are causing déjà vu, it is because we already review the near-identical Supermicro 1024US-TRT Server. The previous review was also looking at a newer version of a Supermicro AMD EPYC server in the 1023-TR4. Let’s go further into Supermicro inception with the Supermicro 1124US-TNRP.
Supermicro 1124US vs. 1024UT
First off there are a lot of similarities here. Both servers use the third generation AMD EYPC processors, both have 32 DIMM slots for up to 8TB of ECC DDR4 3200MHz of SDRAM, and both feature three PCIe Gen4 expansion slots. One of the main gripes we had with the previous server was the lack of dense NVMe storage.
On the one hand, the 1024UT had four 3.5″ bays for up to 64TB of HDD capacity. These bays supported SATA, SAS, and NVMe but if you wanted to leverage the latter, the fastest, you were limited to just the four bays. In the 1124US, you only have 2.5″ bays but that is ok as you have 12 of them, which means a lot more NVMe storage is possible.
The 1124US is 1U but supports 280W TDP. Meaning you can leverage two 64-core AMD EPYC CPUs if you so choose to do so. The rear I/O of the Supermicro 1124US is similar to the 1024UT as well dual 10GBase-T and two 10G SFP+ and support for three x16 PCIe expansion slots.
Our view model includes two AMD EPYC 7713 CPUs, 512GB of memory, and 12 Intel P5510 3.84TB SSDs.
Supermicro 1124US-TNRP Specifications
| Form Factor | 1U |
| CPU |
|
| Cores | Up to 64 Cores |
| Memory Capacity |
|
| Memory Type | DDR4 3200 MHz Registered ECC, 288-pin gold-plated DIMMs |
| DIMM Sizes | 4GB, 8GB, 16GB, 32GB, 64GB, 128GB, 256GB |
| Memory Voltage | 1.2V |
| Error Detection |
|
| Chipset | System on Chip (SoC) |
| SATA | SATA3 (6Gbps) |
| Network Connectivity | Dual 10GBase-T + 10G SFP+ via Intel X710-TM4 |
| IPMI |
|
| Graphics | ASPEED AST2500 BMC |
| NVMe | 12 NVMe ports (default) |
| LAN |
|
| USB | 4 USB 3.0 ports
(2 rear + 1 Type A + 1 front) |
| VGA | 1 VGA port |
| SAS | 12 SAS3 ports support via optional SAS kit |
| SATA | 12 SATA3 ports support via optional kits |
| Others |
|
| BIOS Type | AMI 128Mb SPI Flash EEPROM |
| Expansion Slots |
|
| Power Supply | 1200W Redundant Power Supplies with PMBus |
| Input |
|
| +12V |
|
| +12Vsb | Max: 2.1A / Min: 0A |
| Height | 1.7″ (43mm) |
| Width | 17.2″ (437mm) |
| Depth | 29.1″ (739mm) |
| Gross Weight | 48 lbs (21.8 kg) |
Design and Build
The Supermicro 1124US-TNRP is a 1U server that has the normal look of a Supermicro unit. Across the front of the server is the twelve 2.5″ drive bays. The bays are tool-less and hot-swappable, which is always nice. On the upper left is a USB 3.0 port. The upper right has the control panel featuring the power button/LED, HDD indicator, NIC indicator, information LED, and UID button.

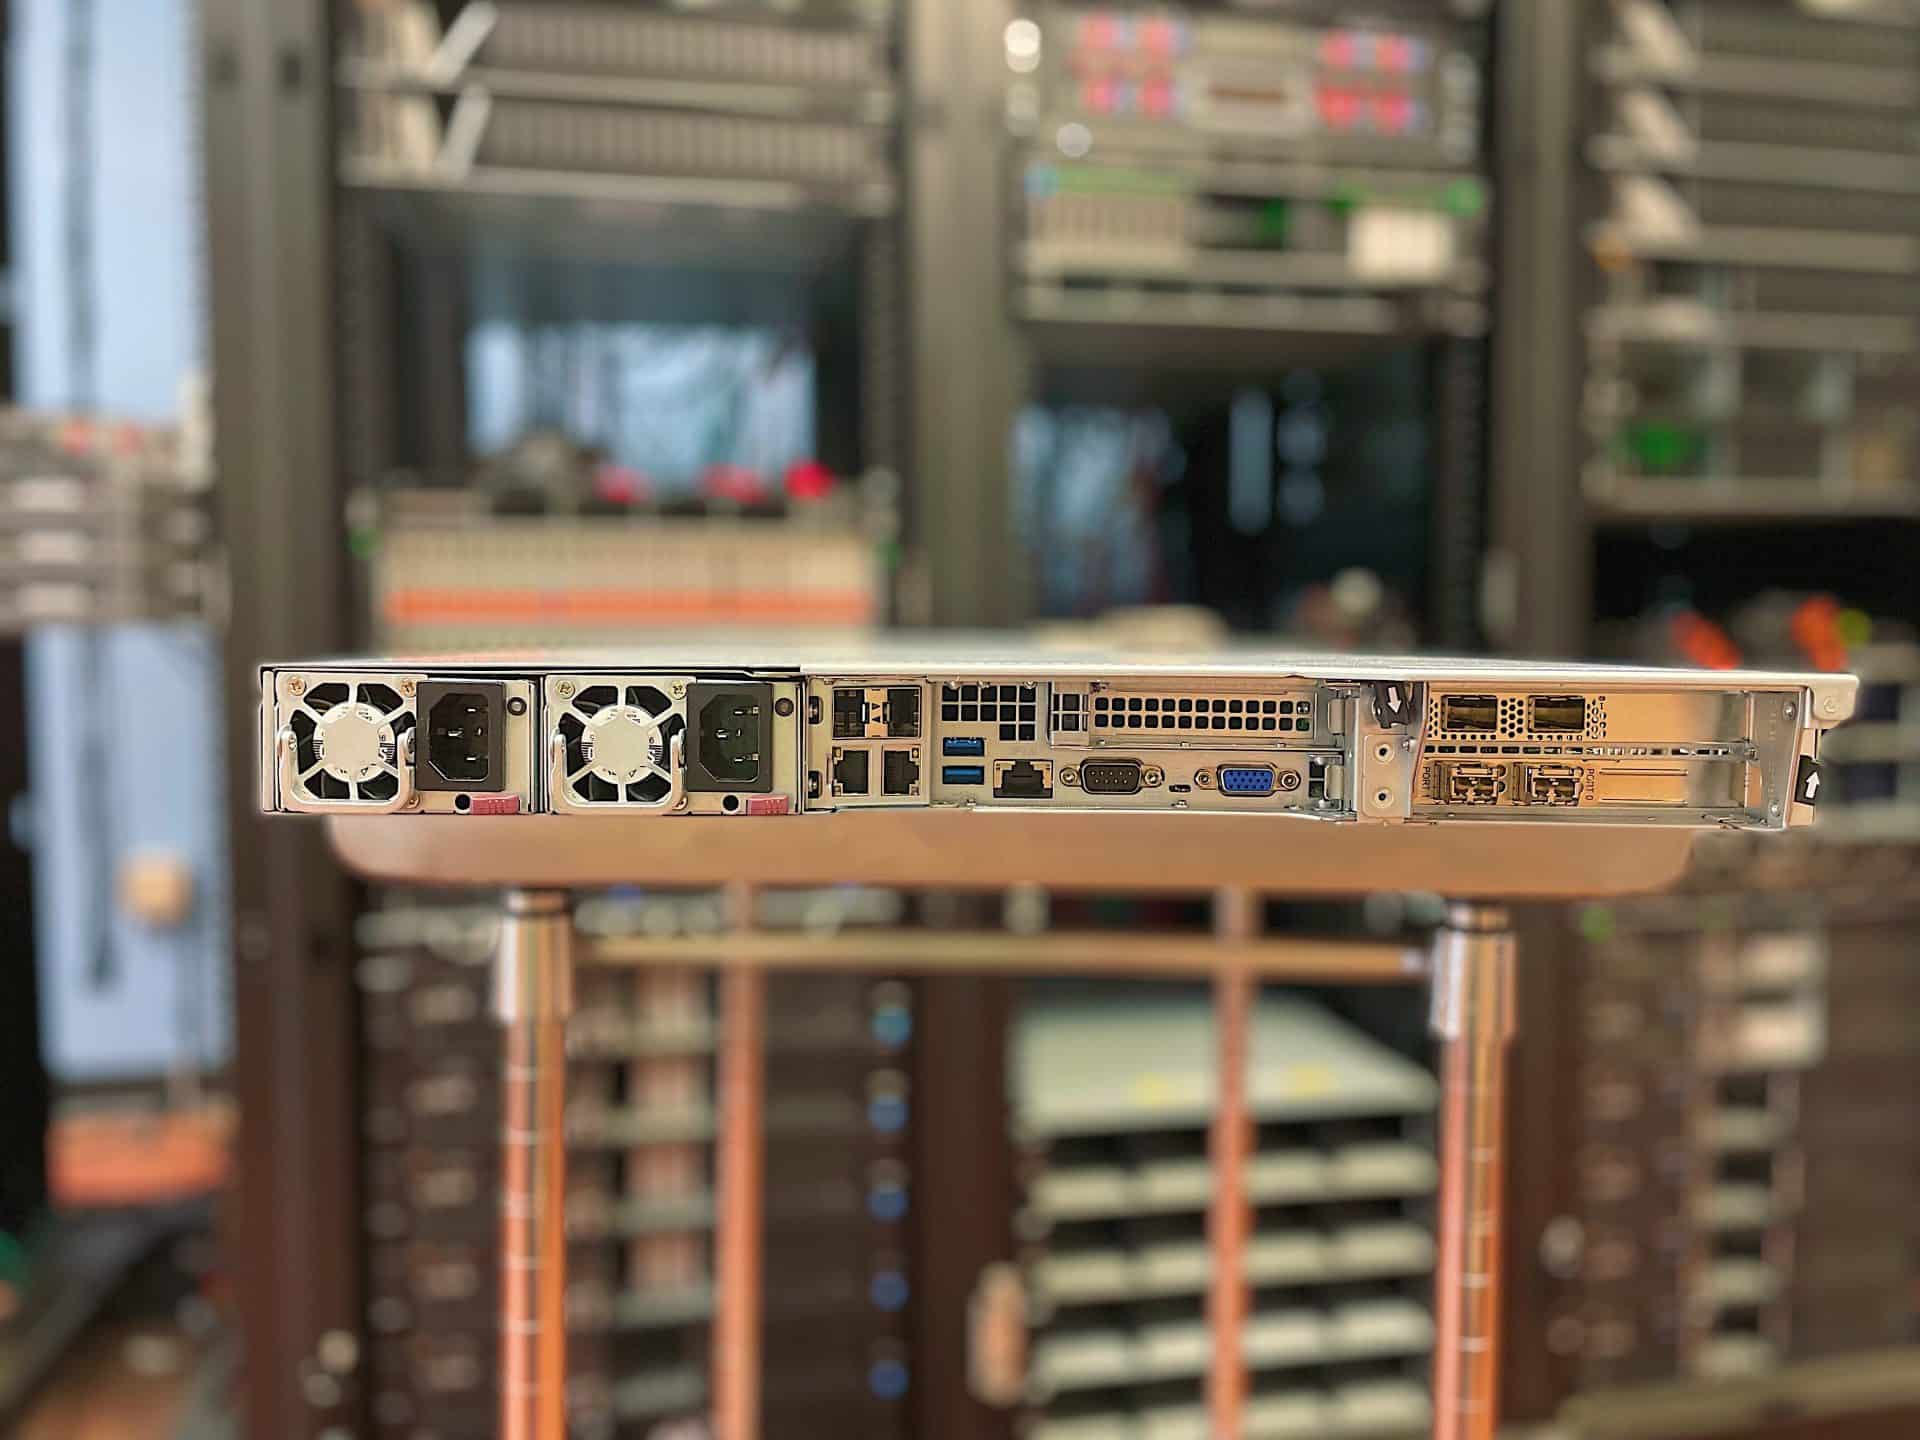
Flipping it around to the rear, the left side as the two PSUs, the right side has the 3 PCIe slots, in the middle is all the ports including four 10GbE ports, two USB 3.0 ports, a dedicated LAN port for IPMI, a serial port, a UID indicator and button, and a video port.
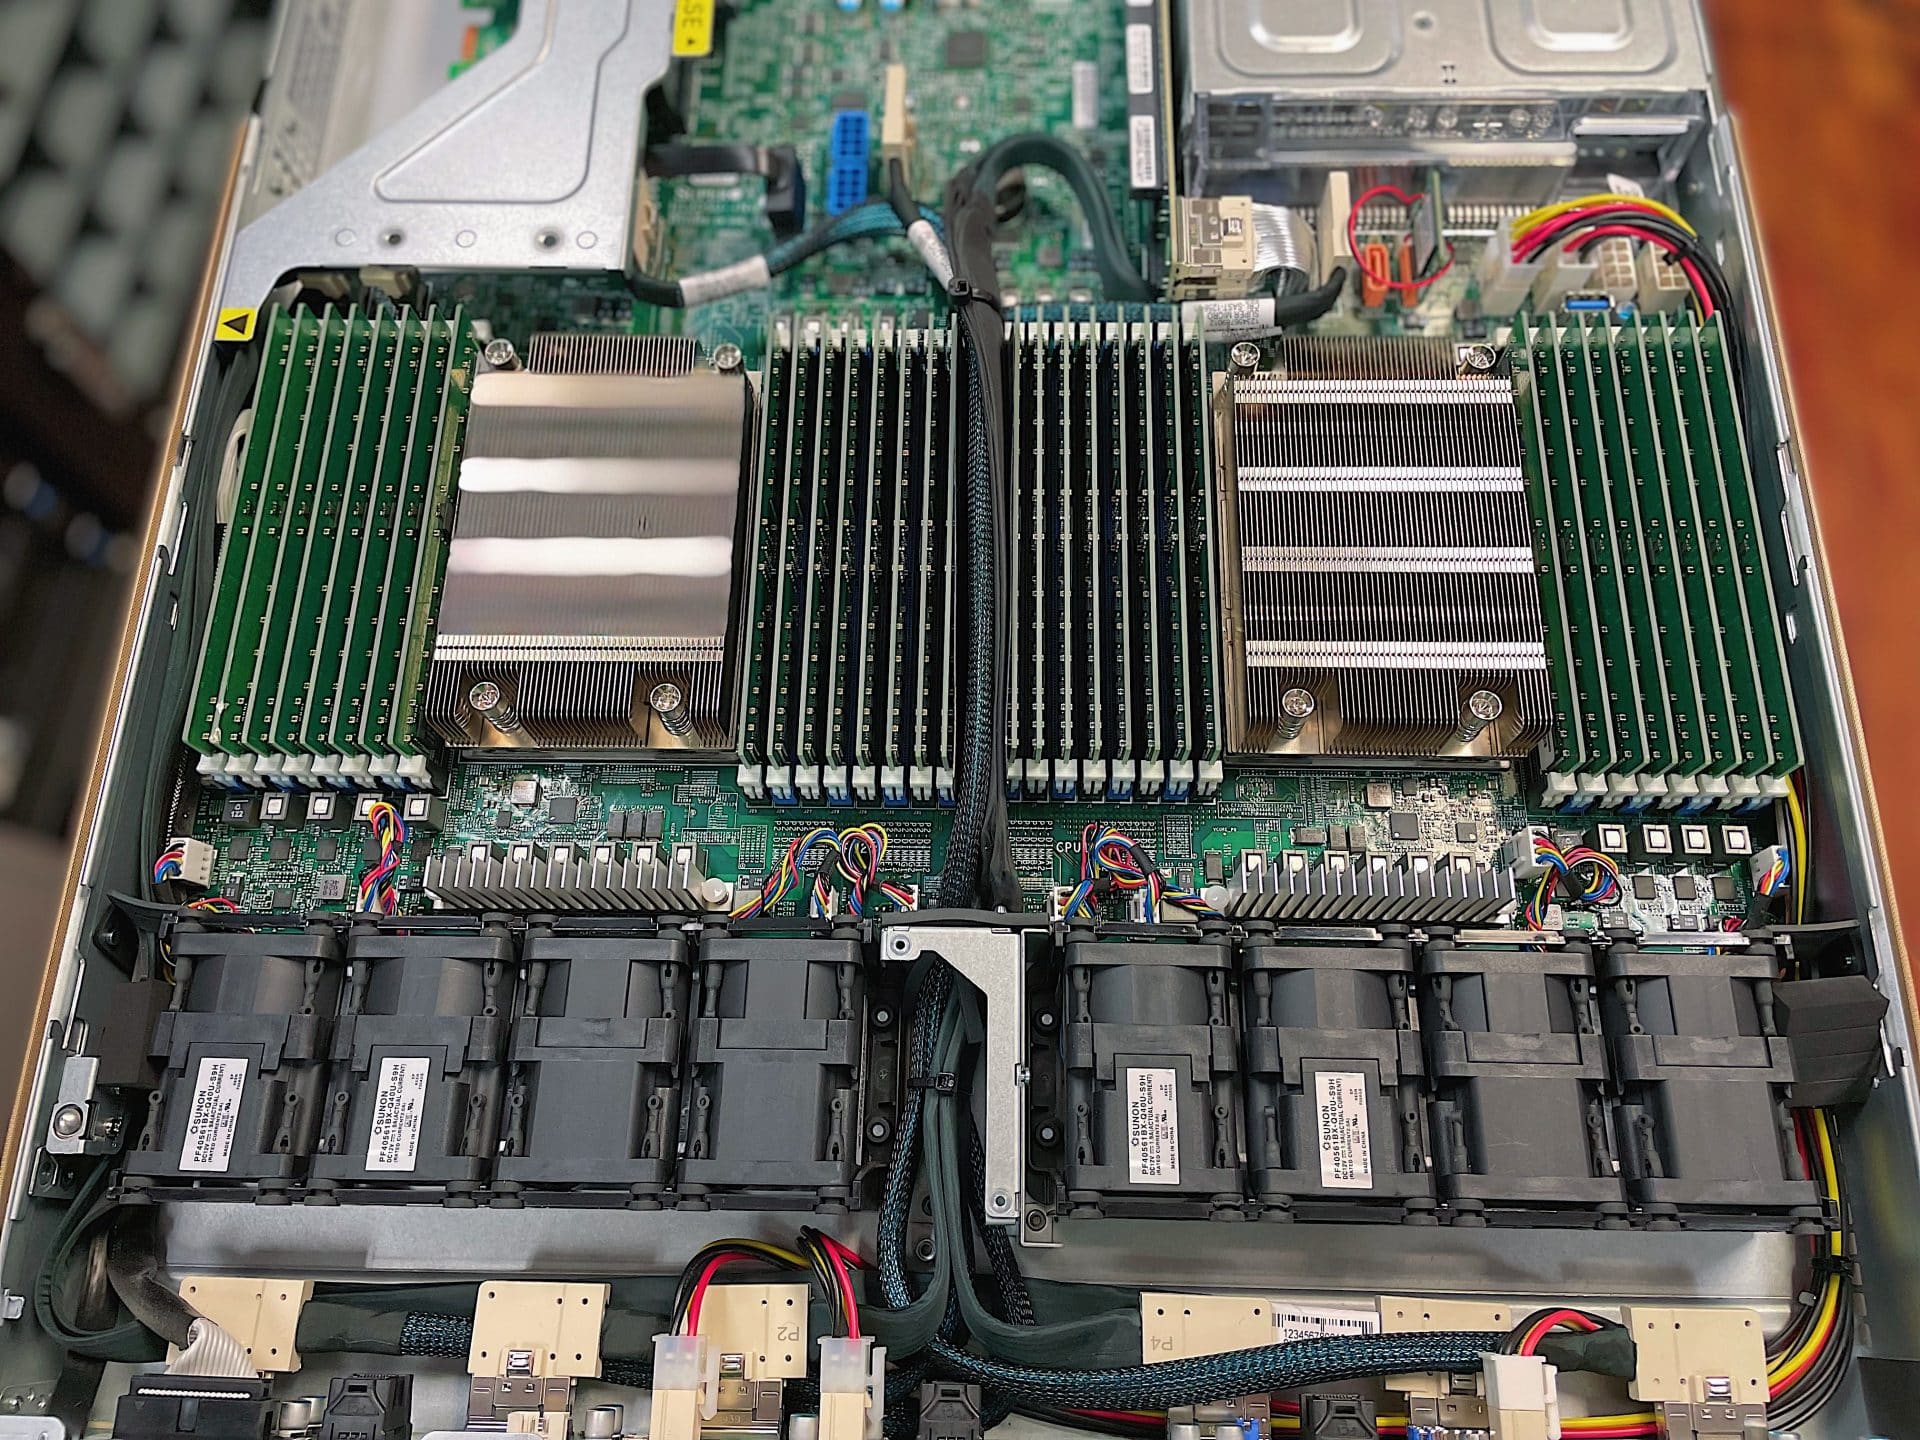
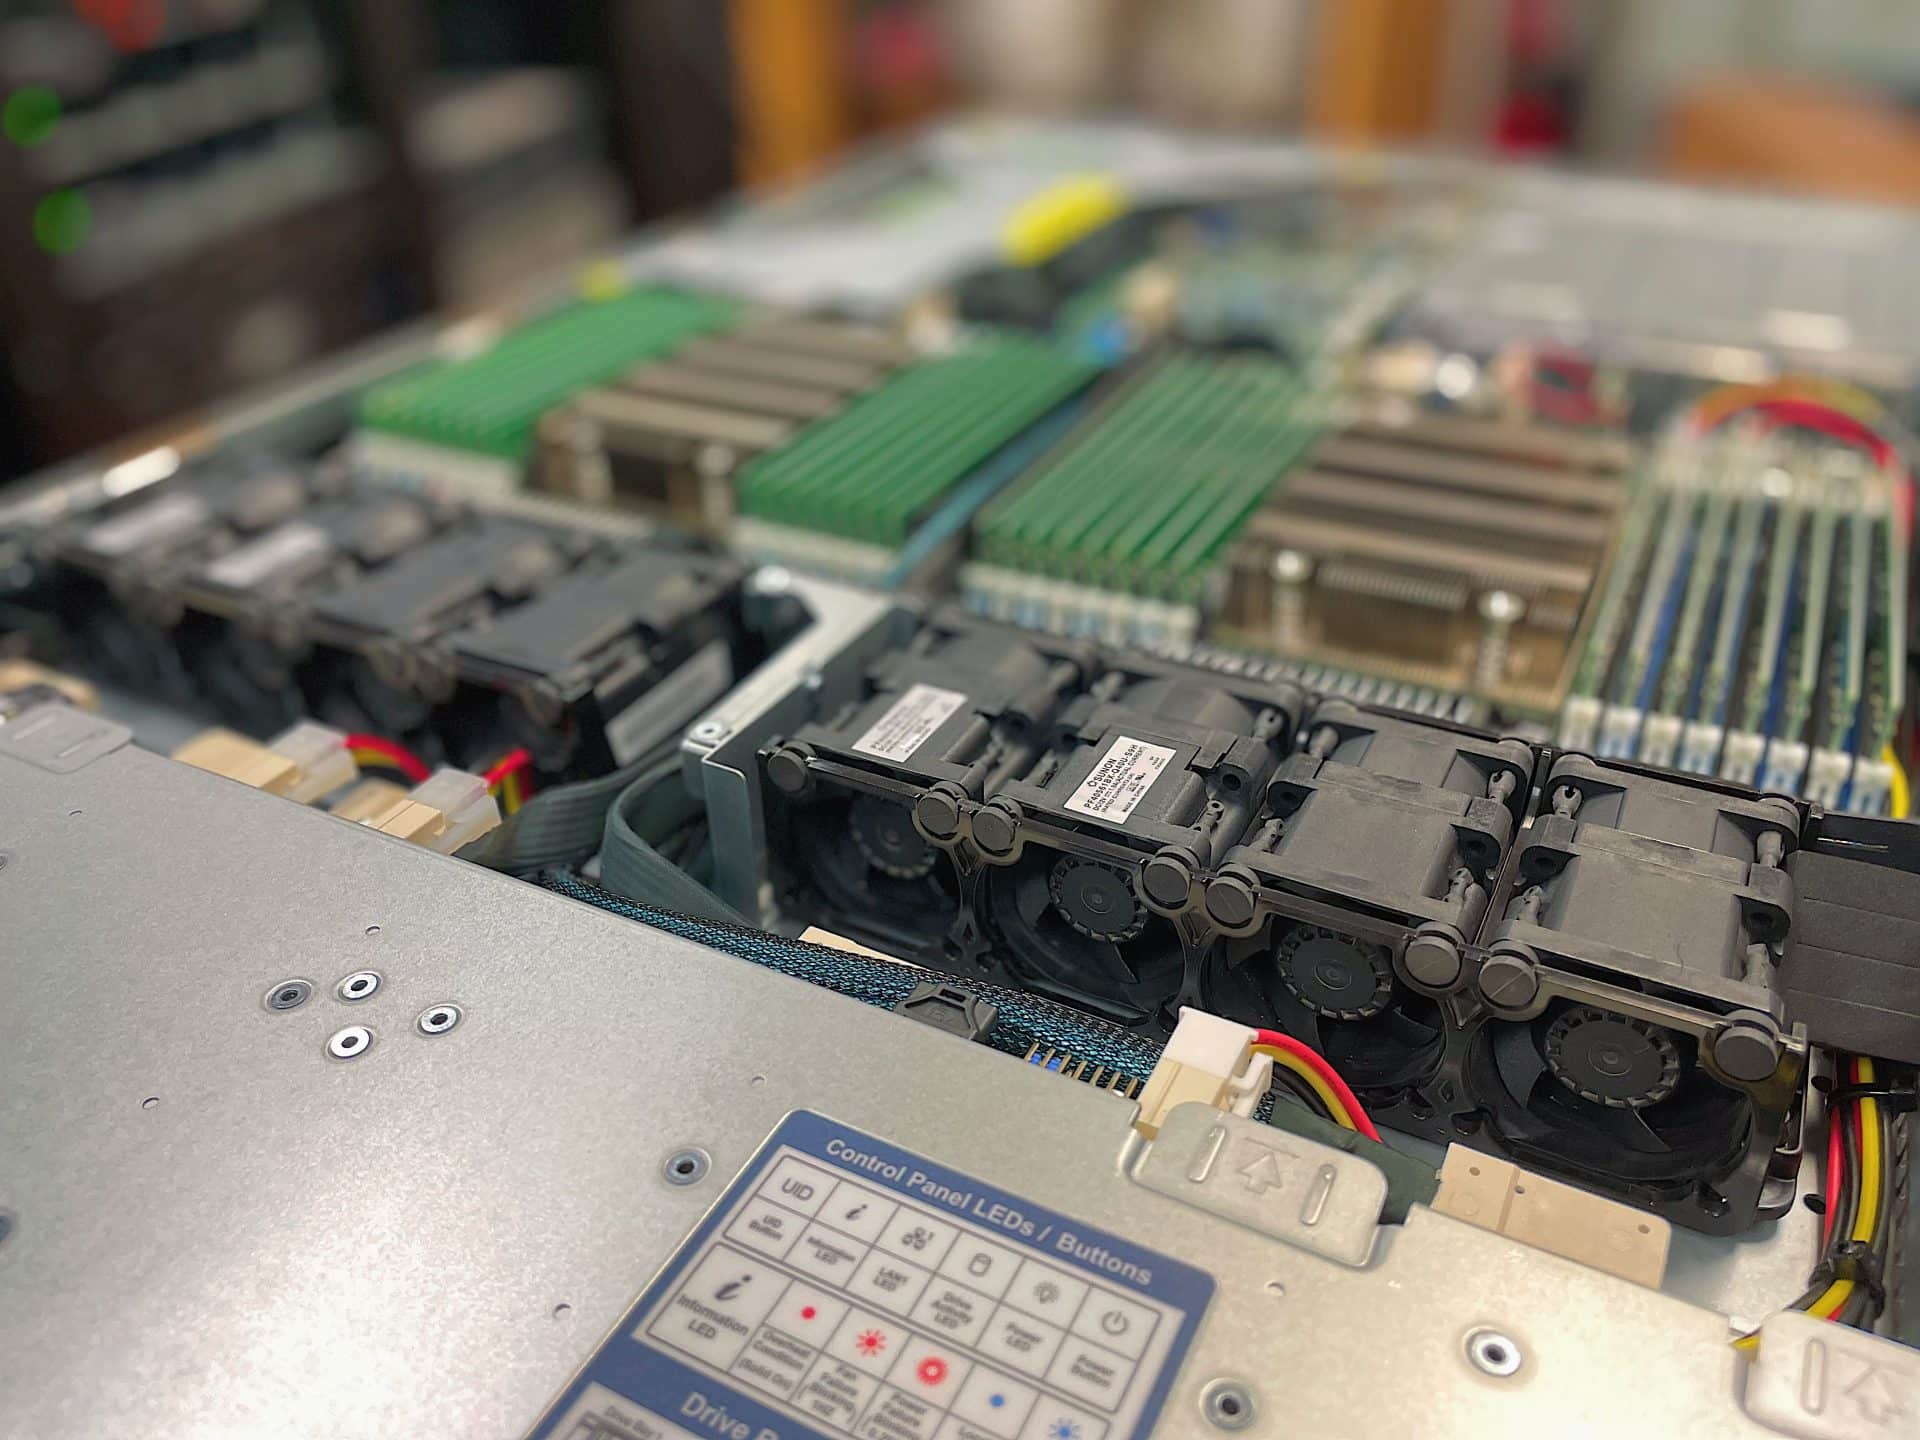
Opening it up we can see the two CPUs and the 32 DIMMS that surround them.
Supermicro 1124US-TNRP Performance
Supermicro 1124US-TNRP configuration:
- Intel P5510 3.84 PCIe Gen 4 NVMe SSDs
- AMD EPYC 7713 processor (64 core)
- 512GB DDR4 RAM
- 64GB SATADOM Boot
SQL Server Performance
StorageReview’s Microsoft SQL Server OLTP testing protocol employs the current draft of the Transaction Processing Performance Council’s Benchmark C (TPC-C), an online transaction processing benchmark that simulates the activities found in complex application environments. The TPC-C benchmark comes closer than synthetic performance benchmarks to gauging the performance strengths and bottlenecks of storage infrastructure in database environments.
Each SQL Server VM is configured with two vDisks: 100GB volume for boot and a 500GB volume for the database and log files. From a system resource perspective, we configured each VM with 16 vCPUs, 64GB of DRAM and leveraged the LSI Logic SAS SCSI controller. While our Sysbench workloads tested previously saturated the platform in both storage I/O and capacity, the SQL test looks for latency performance.
SQL Server Testing Configuration (per VM)
- Windows Server 2012 R2
- Storage Footprint: 600GB allocated, 500GB used
- SQL Server 2014
-
- Database Size: 1,500 scale
- Virtual Client Load: 15,000
- RAM Buffer: 48GB
- Test Length: 3 hours
-
- 2.5 hours preconditioning
- 30 minutes sample period
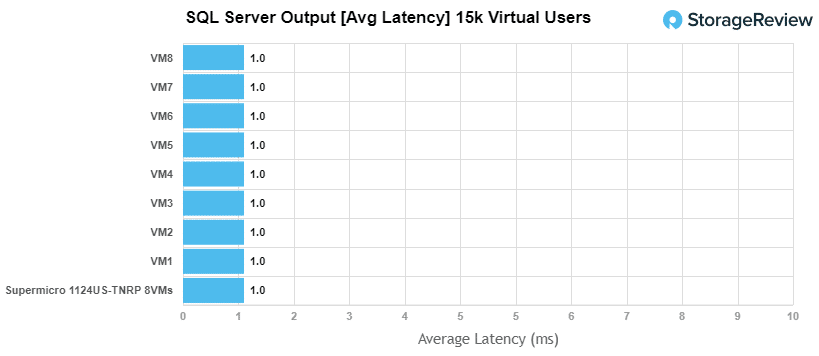
For SQL Server average latency, the Supermicro 1124US-TNRP had an aggregate score of 1ms with individual VMs each measuring 1ms.
Sysbench MySQL Performance
Our second local-storage application benchmark consists of a Percona MySQL OLTP database measured via SysBench. This test measures average TPS (Transactions Per Second), average latency, and average 99th percentile latency as well.
Each Sysbench VM is configured with three vDisks: one for boot (~92GB), one with the pre-built database (~447GB), and the third for the database under test (270GB). From a system resource perspective, we configured each VM with 16 vCPUs, 60GB of DRAM and leveraged the LSI Logic SAS SCSI controller. We utilized 8 of the 12 NVMe SSDs, placing two VMs per drive. As this is a CPU-bound benchmark it had no impact to the final performance number.
Sysbench Testing Configuration (per VM)
- CentOS 6.3 64-bit
- Percona XtraDB 5.5.30-rel30.1
- Database Tables: 100
-
- Database Size: 10,000,000
- Database Threads: 32
- RAM Buffer: 24GB
- Test Length: 3 hours
-
- 2 hours preconditioning 32 threads
- 1 hour 32 threads
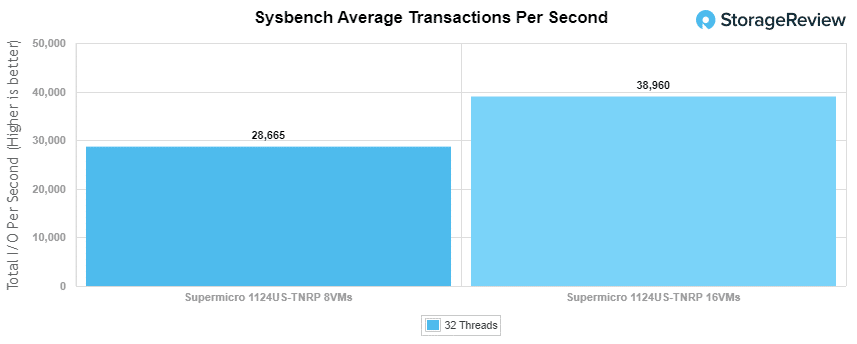
With the Sysbench OLTP, we recorded an aggregate score of 28,665 TPS for the 8VM with individual VMs ranging from 3,474 TPS to 3,707 TPS. With 16VMs we saw an aggregate score of 38,960 TPS with individual VMs ranging from 2,360 TPS to 2,492 TPS. This is incredibly high for the test, which is even more impressive when you factor in this isn’t leveraging the flagship AMD Epyc Gen3 CPUs.
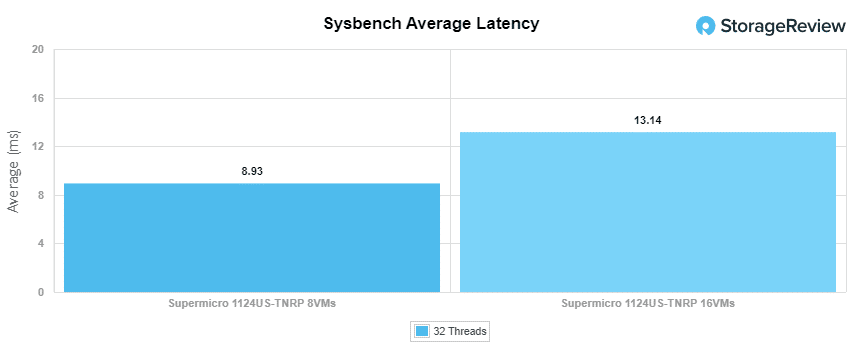
With Sysbench average latency the 8VM test saw an aggregate score of 8.93ms with individual VMs ranging from 8.63ms to 9.21ms. With 16VM we saw an aggregate of 13.14ms with individual VMs ranging between 12.82ms to 13.56ms.
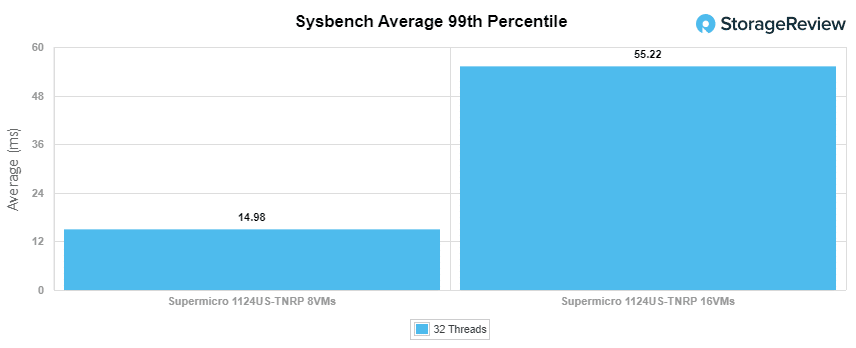
In our worst-case scenario (99th percentile) latency the 1124US had an aggregate score of 14.98ms for 8VM and 55.22ms for the aggregate score of the 16VM.
VDBench Workload Analysis
When it comes to benchmarking servers, application testing is best, and synthetic testing comes in second place. While not a perfect representation of actual workloads, synthetic tests do help to baseline storage devices with a repeatability factor that makes it easy to do apples-to-apples comparison between competing solutions.
These workloads offer a range of different testing profiles ranging from “four corners” tests, common database transfer size tests, as well as trace, captures from different VDI environments. All of these tests leverage the common vdBench workload generator, with a scripting engine to automate and capture results over a large compute testing cluster. This allows us to repeat the same workloads across a wide range of storage devices, including flash arrays and individual storage devices.
Profiles:
- 4K Random Read: 100% Read, 128 threads, 0-120% iorate
- 4K Random Write: 100% Write, 128 threads, 0-120% iorate
- 64K Sequential Read: 100% Read, 32 threads, 0-120% iorate
- 64K Sequential Write: 100% Write, 16 threads, 0-120% iorate
- Synthetic Database: SQL and Oracle
- VDI Full Clone and Linked Clone Traces
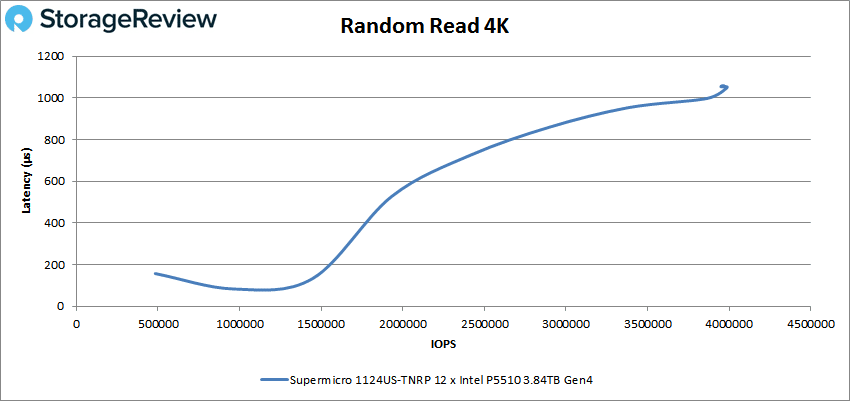
Looking at random 4K read, the Supermicro 1124US-TNRP peaked at 3,985,505 IOPS but slipped up to 1.05ms for latency.
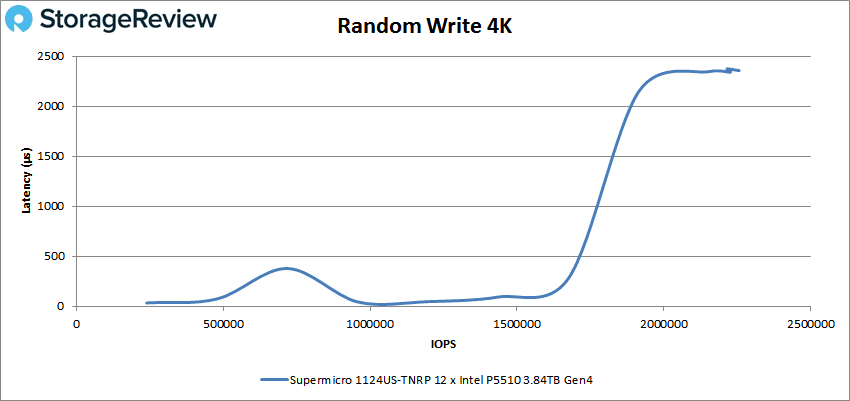
In 4K write we saw a much better latency start (34.2µs), the server went on to peak at 2,256,082 IOPS and a latency of 2.4ms.
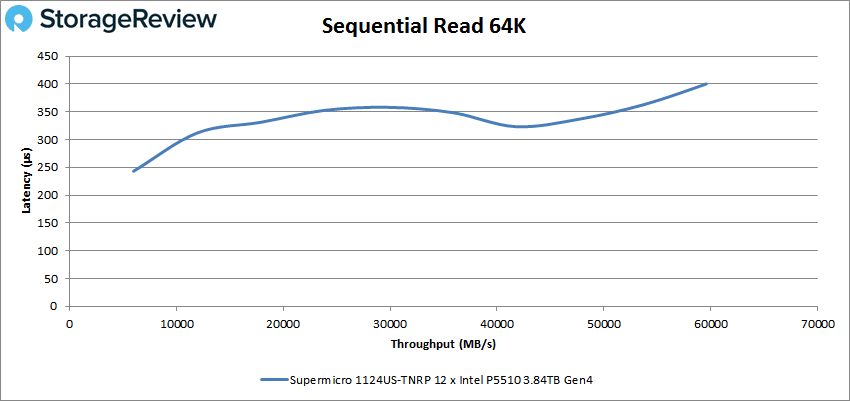
Switching to 64K sequential workloads, in read the 1124US hit an incredible peak of 953,421 IOPS or 59.6GB/s at a sub-millisecond latency of 400µs.
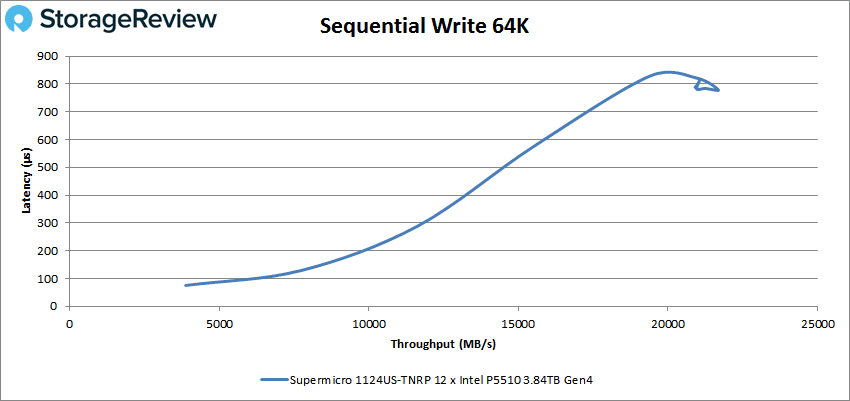
With 64K write the server started sub-100µs and went on to peak at 346,960 IOPS or 21.7GB/s at a latency of 779µs.
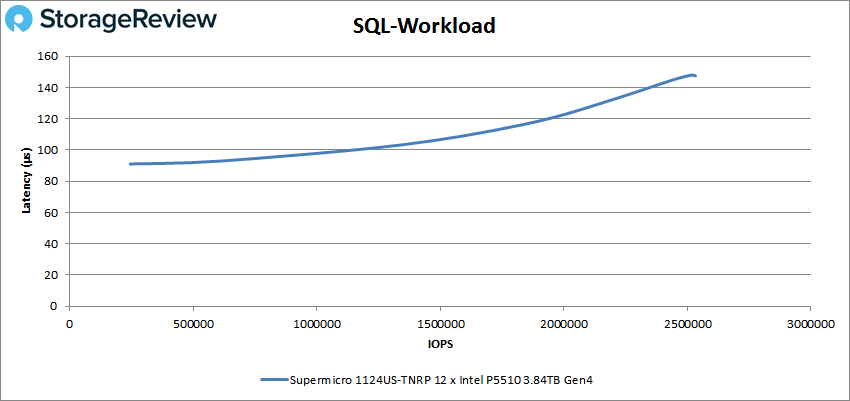
Our next set of tests are our SQL workloads: SQL, SQL 90-10, and SQL 80-20. Starting with SQL, the Supermicro 1124US peaked at 2,533,043 IOPS and a latency of 147µs.
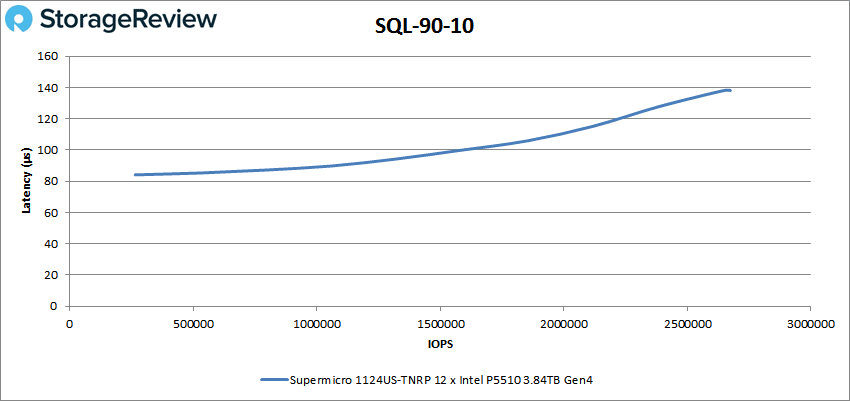
In SQL 90-10 the server had a peak of 2,674,358 IOPS and a latency of 138µs.
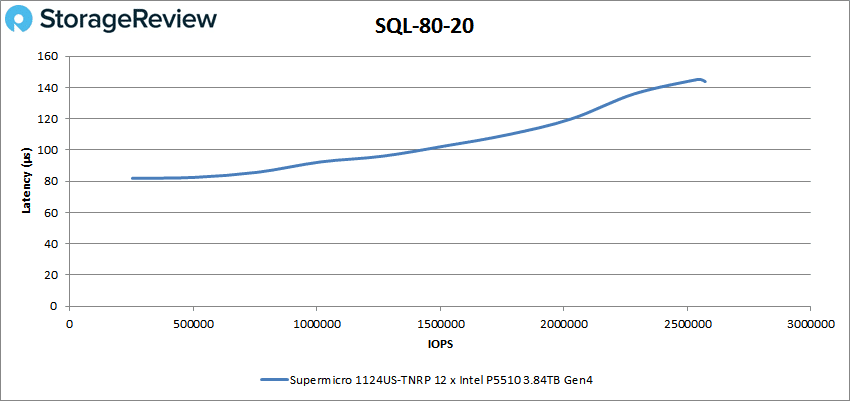
SQL 80-20 saw a peak performance of 2,572,583 IOPS with a latency of 144µs.
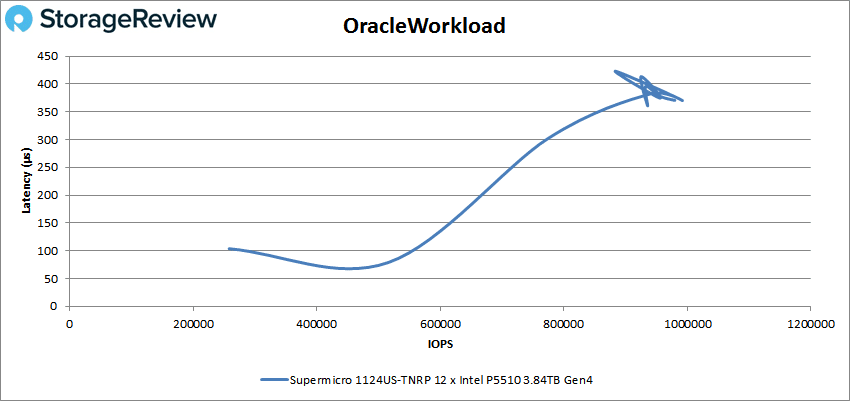
Next up are our Oracle workloads: Oracle, Oracle 90-10, and Oracle 80-20. Starting with Oracle, the 1124Us hit a peak of 991,373 IOPS with a latency of 371µs.
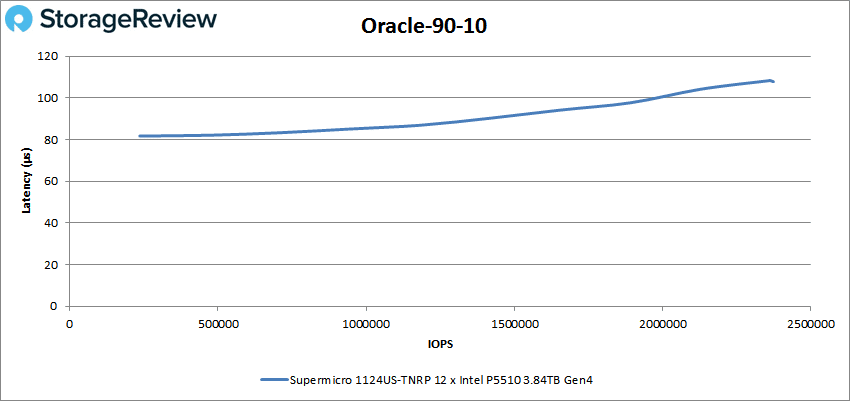
In Oracle 90-10 the server started at 82µs and stayed under 100µs until about 2 million IOPS with a peak of 2,373,884 IOPS at a latency of just 108µs.
Oracle 80-20 showed another strong, low latency performance starting at 78.2µs and staying under 100µs until about 2 million IOPS once again, before going on to peak at 2,321,212 IOPS at a latency of 111µs.

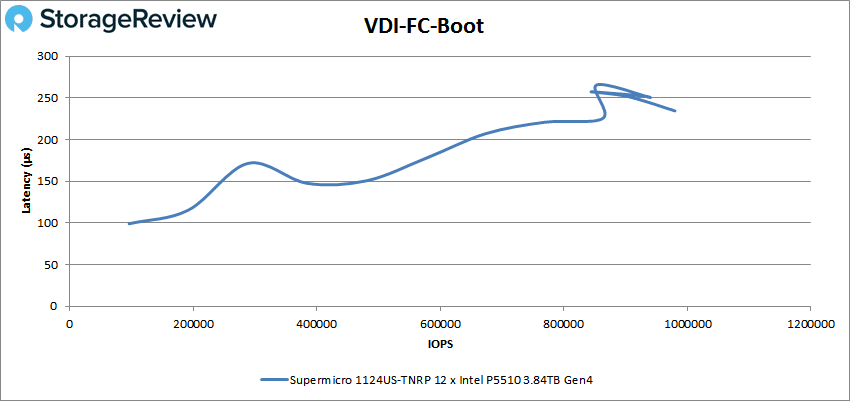
Next, we switched over to our VDI clone test, Full and Linked. For VDI Full Clone (FC) Boot, the Supermicro 1124US peaked at 980,159 IOPS with a latency of 234µs.
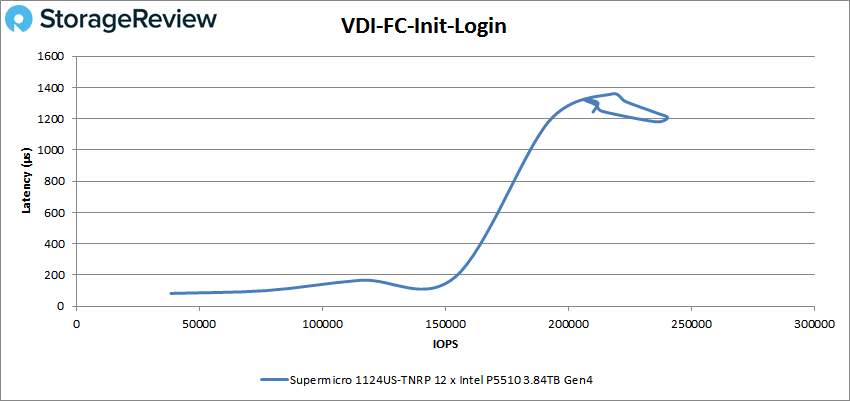
In VDI FC Initial Login saw a peak performance of 240,465 IOPS at a latency of 1.21ms.
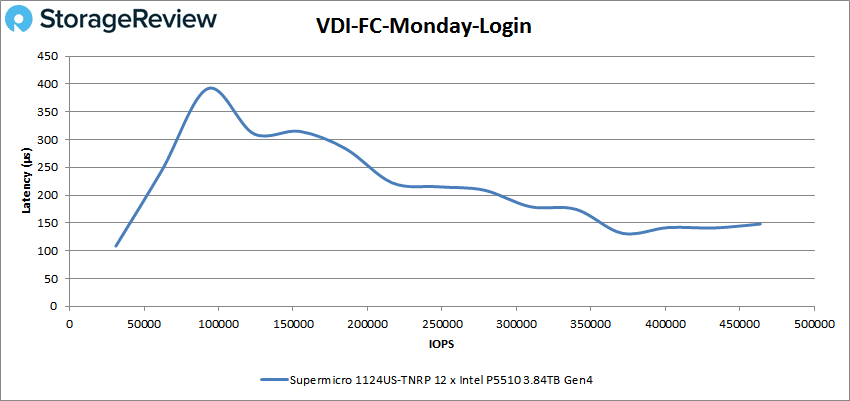
VDI FC Monday Login saw the Supermicro start with low latency, spike up a bit, and then settle at a peak of 463,803 IOPS and a latency of just 148µs.
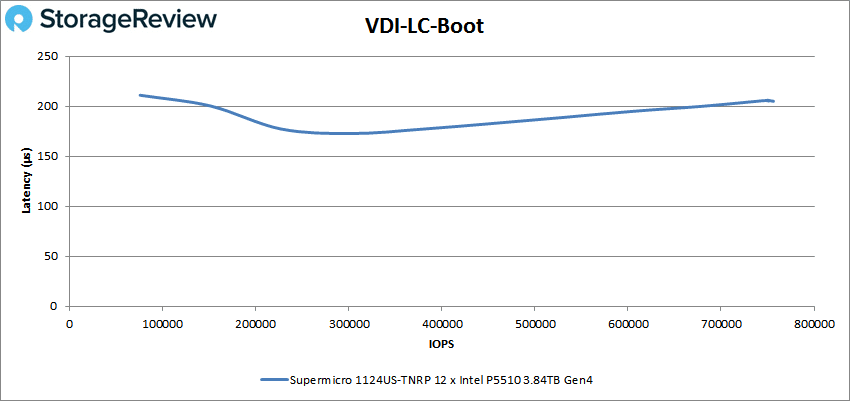
For VDI Linked Clone (LC) Boot, the Supermicro server showed a fairly consistent performance with a peak of 756,313 IOPS and 205µs for latency.
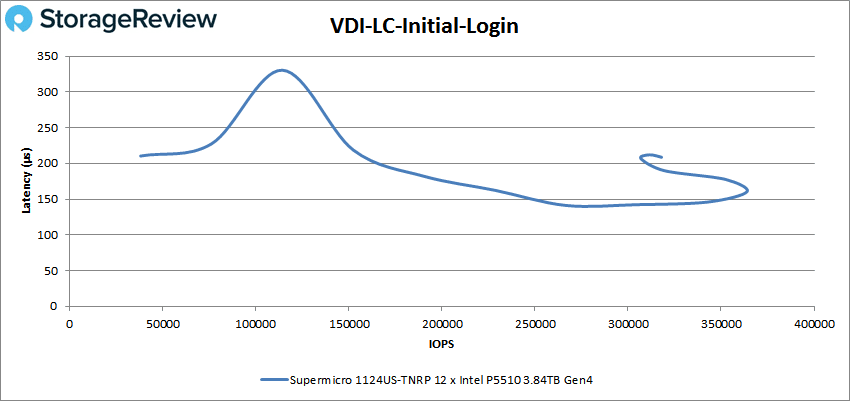
VDI LC Initial Login saw a peak of roughly 364K IOPS at a latency of 161µs.
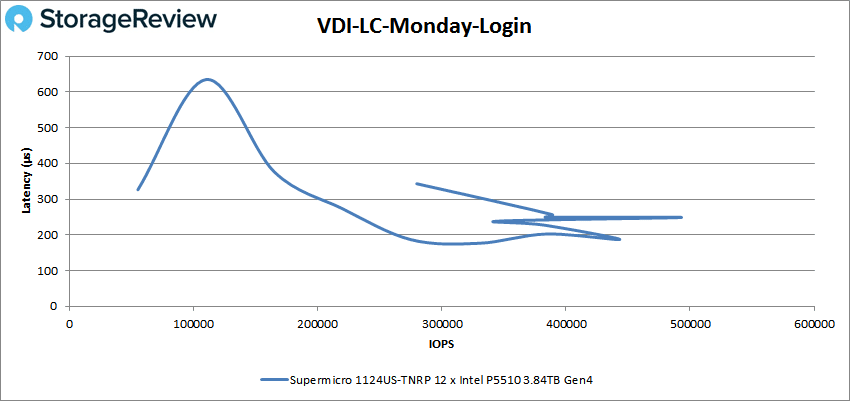
Finally, with VDI LC Monday Login the Supermicro 1124US was able to hit 492,682 IOPS at 249µs for latency.
Conclusion
Supermicro has released yet another compact server with support for the latest generation of AMD EPYC CPUs in the Supermicro 1124US-TNRP. There is a lot to like here. The sever is only 1U but it can house two third-generation AMD EPYC 7003 processors and up to 8TB of RAM through the 32 DIMM slots. There are three PCIe Gen4 x16 expansion slots in the back and two onboard 10GbE ports. Where the 1024UT fell short was the fact you could only add four NVMe drives. Here the 1124US allows users to add up to twelve. AI, ML and other compute-dense applications will do very well with this box.
To test performance, we stuffed the system full of Intel P5510 SSDs and ran our suite of Application Workload Analysis tests. In SQL Server average latency we saw an aggregate latency of 1.25ms. With Sysbench OLTP we saw aggregate scores of 28,665 TPS for the 8VM and an incredible 38,960 TPS for the 16VM test. In Sysbench average latency, there were aggregate scores of 8.93ms and 13.14ms for the 8VM and 16VM respectively. Sysbench’s worst-case scenario saw aggregate scores of 14.98ms and 55.22ms for the 8VM and 16VM respectively.
In VDBench we saw highlights that included nearly 4 million IOPS in 4K read, 2.26 million IOPS in 4K write, a whopping 59.6GB/s in 64K read, and 21.7GB/s in 64K write. With our SQL tests, we saw peaks of 2.5 million IOPS, 2.7 million IOPS in SQL 90-10, and 2.6 million IOPS in SQL 80-20. Oracle tests saw peaks of 991K IOPS, 2.4 million IOPS in Oracle 90-10, and 2.3 million IOPS in Oracle 80-20.
These were followed by our VDI clone tests Full and Linked. In Full Clone, we saw a boot peak of 980K IOPS, Initial Logon of 240K IOPS, and Monday Login of 464K IOPS. With Linked Clone we saw peaks of 756K IOPS for boot, 364K IOPS for Initial Login, and 493K IOPS for Monday Login. While the server had lots of impressive numbers in VDBench it did creep above 1ms more than once. It had higher latency in the 4K tests and the VDI FC boot.
The Supermicro 1124US-TNRP is another powerful server packed into a small footprint. If you are looking for a dense server that can really knock the performance out of the park, and have plenty of NVMe storage, the 1124US is your go-to pick.


 Amazon