

Powered by AMD’s Ryzen AI 9 HX 370 PRO processor, Dell’s Pro Max 16 workstation delivers impressive performance and NVIDIA RTX PRO Blackwell graphics in a portable and value-driven package. Though it’s the entry-level model in Dell’s new Pro Max lineup, which replaces the long-standing Precision brand, this machine feels anything but basic.
Aimed at mobile power users, engineers, graphic designers, and data scientists, the Pro Max series comes in three tiers: Base, Plus, and Premium. The Base model prioritizes performance per dollar, Plus pushes raw performance, and Premium blends high-end specs with style. The unit we’re reviewing is the AMD-based Pro Max 16, though Dell also offers an Intel flavor featuring Core Ultra 2-series H-class chips up to the Core Ultra 9 285H.
There are some differences between the AMD and Intel variants. The Intel model supports up to the RTX PRO 2000 GPU, while the AMD version is capped at the RTX PRO 1000. Display options also differ: Intel offers an FHD+ touch panel rated at 400 nits, whereas the AMD model has a non-touch FHD+ screen rated at 300 nits. Connectivity also varies: AMD offers Wi-Fi 7 as standard, while Intel includes Wi-Fi 6E with optional support for Wi-Fi 7 and mobile broadband.
Both models otherwise have feature parity, including dual M.2 slots, up to 64GB of memory, and certification for over 100 ISV applications, such as TensorFlow, PyTorch, and MATLAB. Note the AMD model uses soldered LPDDR5X, while Intel opts for upgradeable CSoDIMM modules.
The feature split is reflected in pricing: the AMD model starts at $1,349, and the Intel model at $1,449. Pricing will vary by channel partner, which is the primary purchasing route for Dell’s business systems.
Dell Pro Max 16 (AMD) Specifications
| Processor |
|
| Operating System |
|
| Memory | 16/32/64GB of LPDDR5X-8400 |
| Graphics Card |
|
| Storage | 2x M.2 SSD
RAID 0/1 supported |
| Display | 16-inch 16:10, IPS
|
| Camera | FHD IR |
| Ports |
|
| Wireless Networking | MediaTek Wi-Fi 7 MT7925 with or without Bluetooth 5.4 |
| Battery |
|
| Power Adapter | Type-C, 100W or 130W |
| Security Features |
|
| Dimensions and Weight |
|
| Warranty | Standard three years, next business day onsite repair |
Build and Design
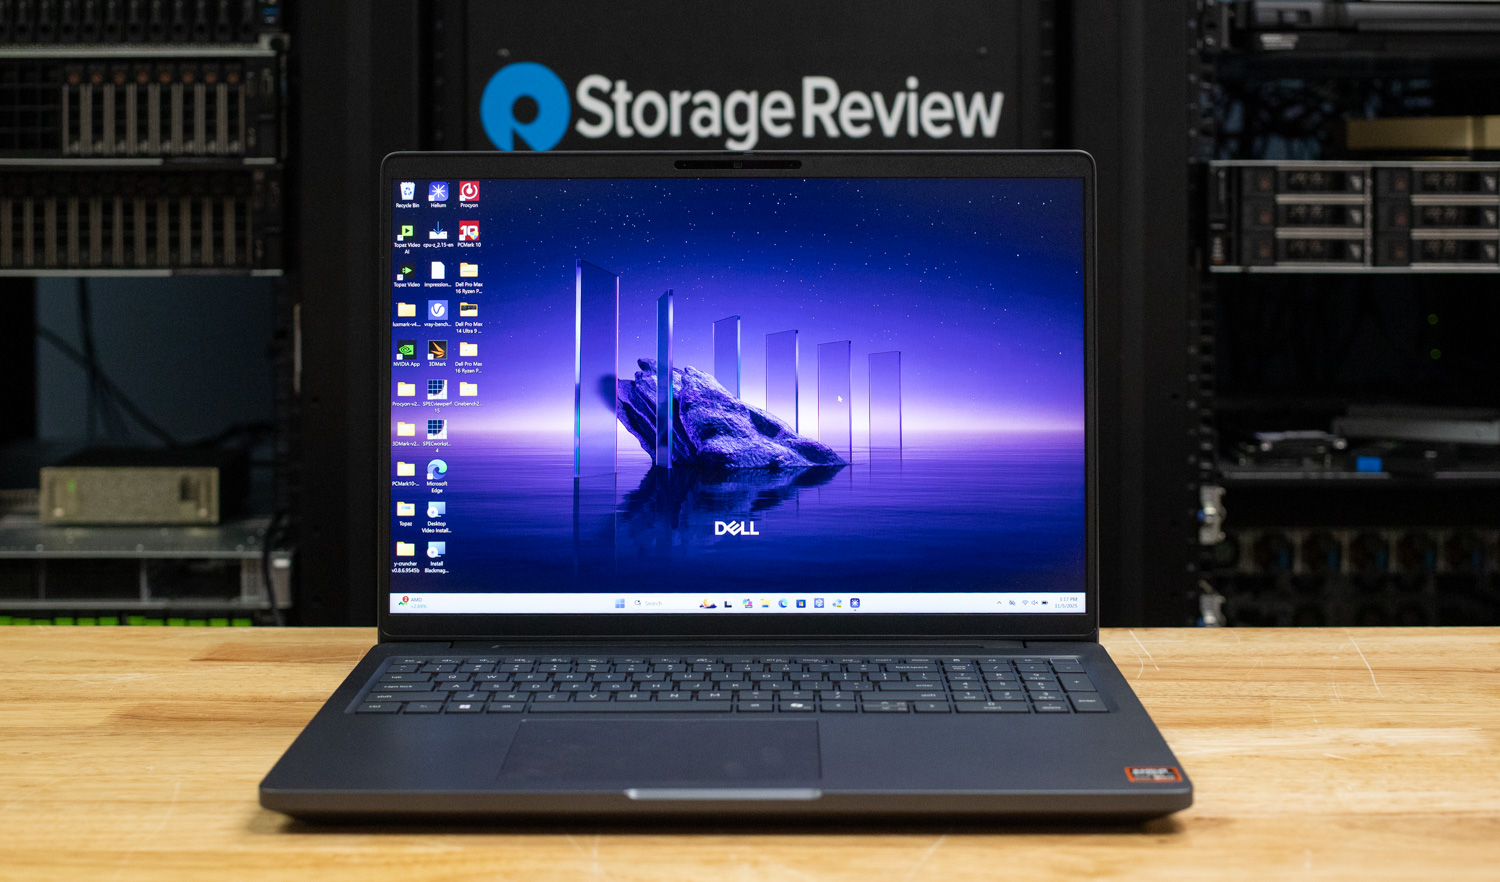
The Pro Max 16’s overall build quality is reassuringly solid, having passed MIL-STD-810H testing for durability against daily wear and tear. It has little flex anywhere. The display hinge offers just the right blend of resistance and adjustability.
Design-wise, this laptop has a utilitarian appearance that won’t attract attention. While it won’t impress style-conscious buyers, that’s not the focus of this machine. Measuring 0.75~1.01 x 14.09 x 10.08 inches (HWD) and starting at 4.59 pounds with integrated graphics, the Pro Max 16 is just portable enough for the occasional trip. Note that Dell also offers a 14-inch version of this model, though it lacks dedicated GPUs.

The Pro Max 16 has a utilitarian look but is very well-built.
Dell designs these laptops with sustainability in mind, using post-consumer recycled plastic in the screen bezel frame, speaker housing, and battery frame. It also uses recycled cobalt in the battery and bio-based rubber feet. Packaging is made from 100% recycled or renewable materials. Dell goes the extra mile by implementing modular USB-C ports on the mainboard. So, in the event of a USB-C failure, the mainboard wouldn’t need to be replaced.
Left ports include HDMI 2.1, USB-A (5Gbps), two Thunderbolt 4 (USB-C), a microSD card slot, and an optional SmartCard slot. Meanwhile, ports on the right edge include an audio jack, USB-A (5Gbps), 1Gbps Ethernet, and a wedge-shaped lock slot. The 130W power adapter connects to either of the Thunderbolt 4 ports.


Screen and Speakers
Dell’s screen options for this model include IPS panels, which offer wide viewing angles, although touch support is not available. The base screen is 1920×1200 with a 60Hz refresh rate, while we’re reviewing it with the finer 2560×1600 120Hz panel. In daily use, I found the display showed excellent detail and scrolled very smoothly. Even with a spec sheet tucked off to the side while I pulled performance metrics from another system, text and fine details stayed crisp and legible. Although HDR support is absent, that’s only a limitation if your workflow involves HDR-specific content. Viewing angles are superb.
The speakers won’t blow you away, but they’re more than adequate for everyday use. Whether streaming videos or playing background music, they deliver a balanced enough sound at moderate volumes. Crank them up, though, and you’ll notice some distortion and a compressed soundstage. Bass adds a touch of depth, but the treble can turn tinny when pushed. While they’re not built for critical listening, they do get decently loud when the moment calls for it.
Input Devices
Dell’s full-size keyboard features white backlighting and a numeric keypad. Unfortunately, tactile feedback isn’t its strong suit, as it tends to be on the mushy side, with noticeable flex under the keys that detracts from the typing experience. As someone who favors tenkeyless layouts, the full-size deck feels cramped; I’d happily ditch the number pad in exchange for roomier keys and better spacing. The keycaps are slightly undersized, which makes transitions feel more constrained than on my personal Dell XPS 15, where I do most of my note-taking and college work. Note that the power button at the top right also doubles as a fingerprint reader, while the webcam supports IR for an additional biometric option.
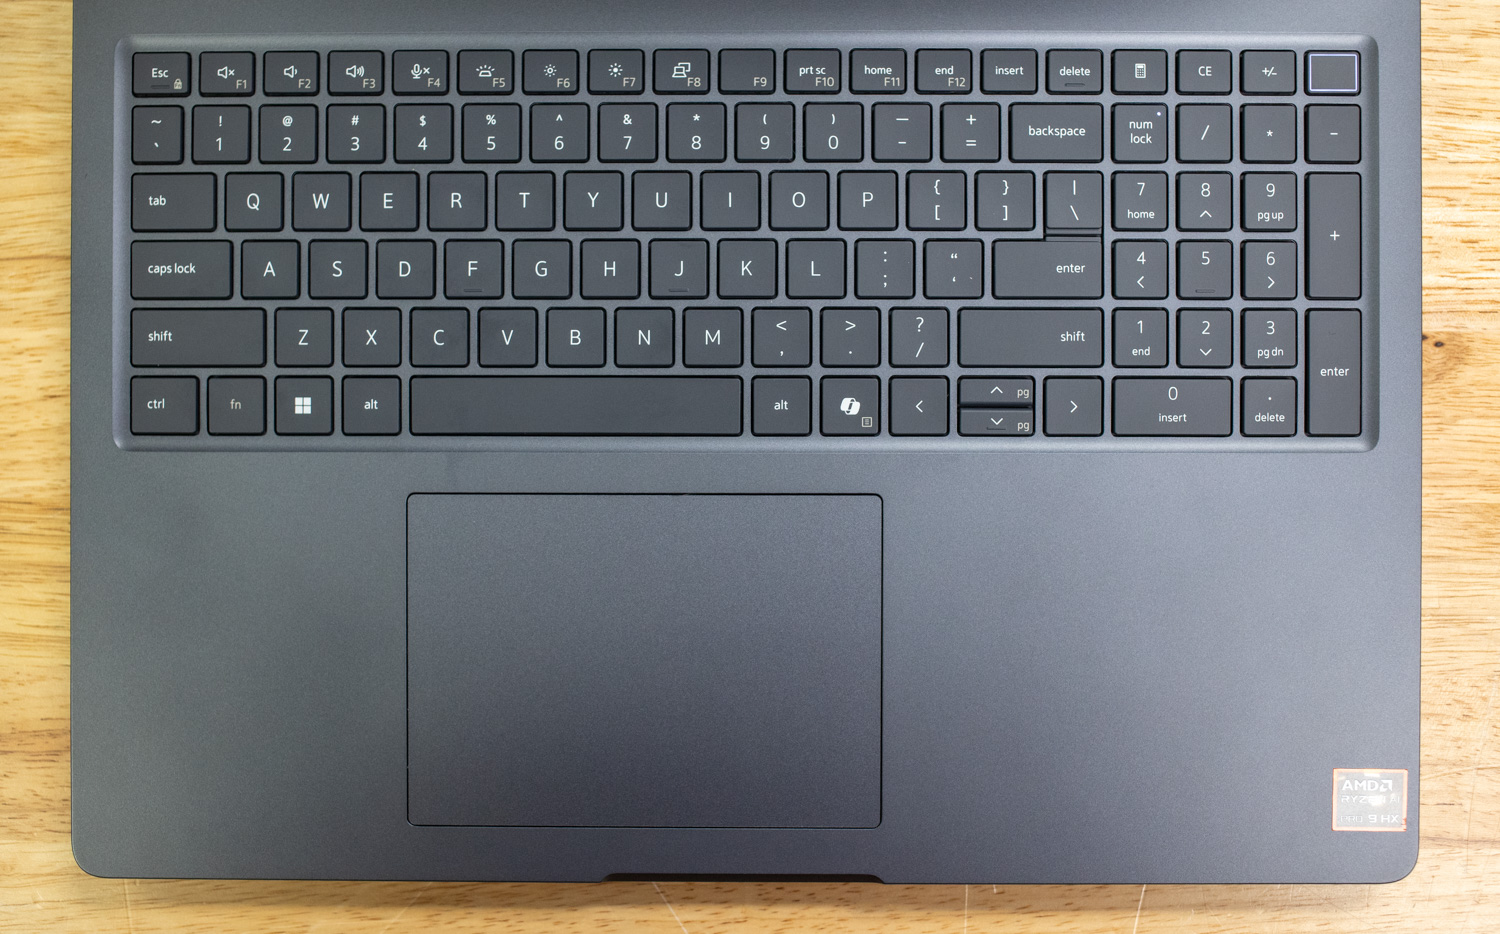
The full-size backlit keyboard is functional, though its tactile feel leaves something to be desired.
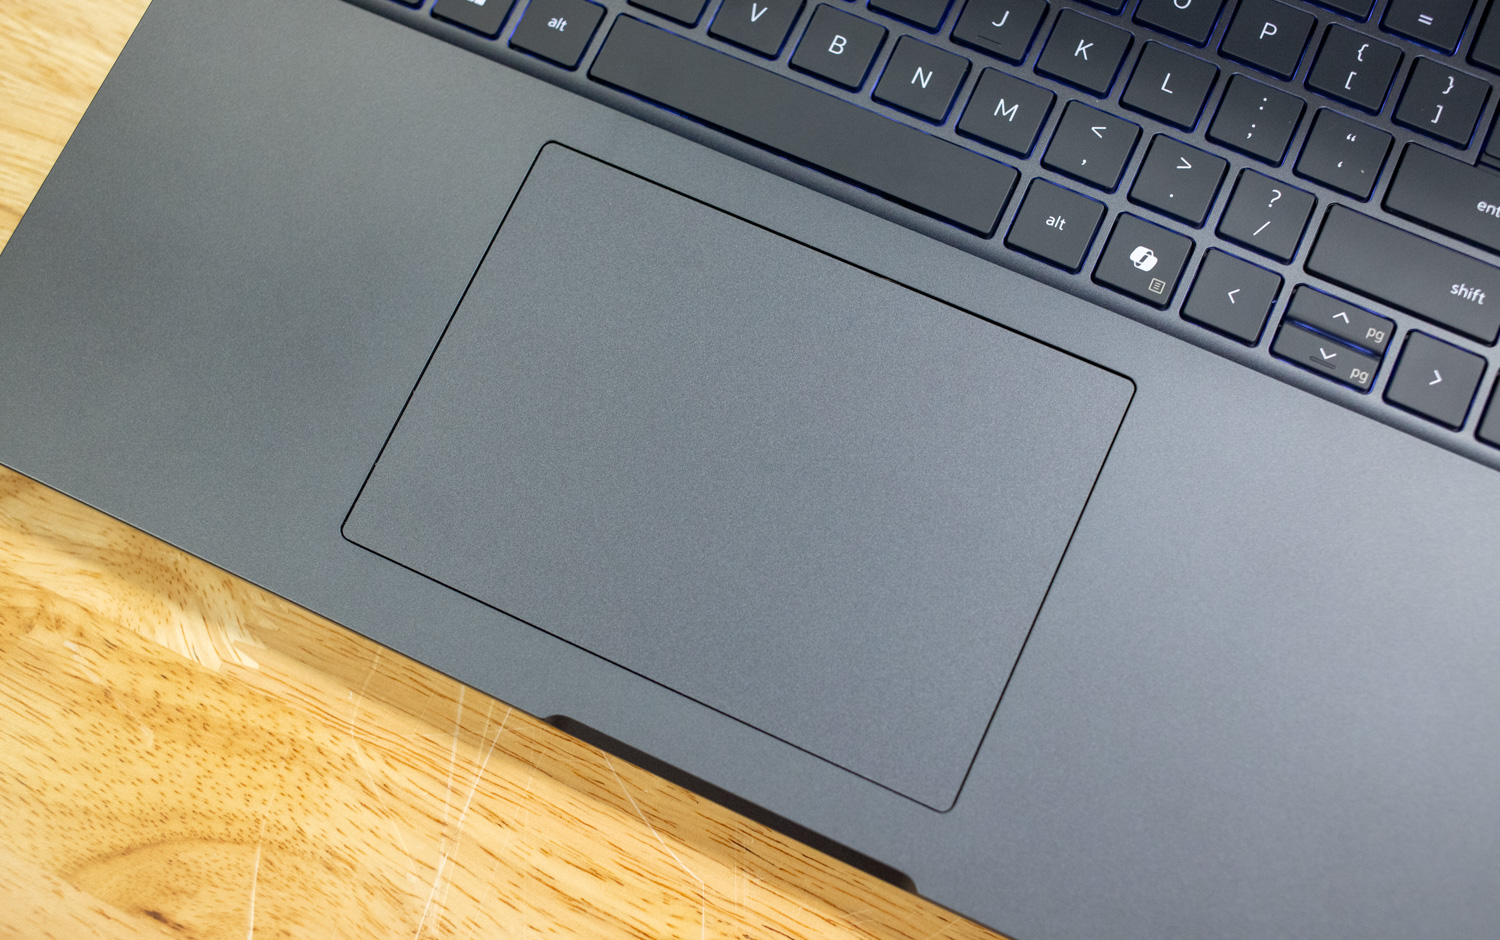
Meanwhile, the ample-sized touchpad offers excellent responsiveness and a satisfying physical clicking action.
Upgradeability
Secured by nine Philips-head screws, removing the Pro Max 16’s bottom panel is time-consuming but ultimately straightforward. Inside, upgradeable components include the two M.2 2280 SSDs, the M.2 2230 wireless card, and the battery pack. As mentioned, this AMD model’s memory is soldered LPDDR5X and therefore not upgradeable.
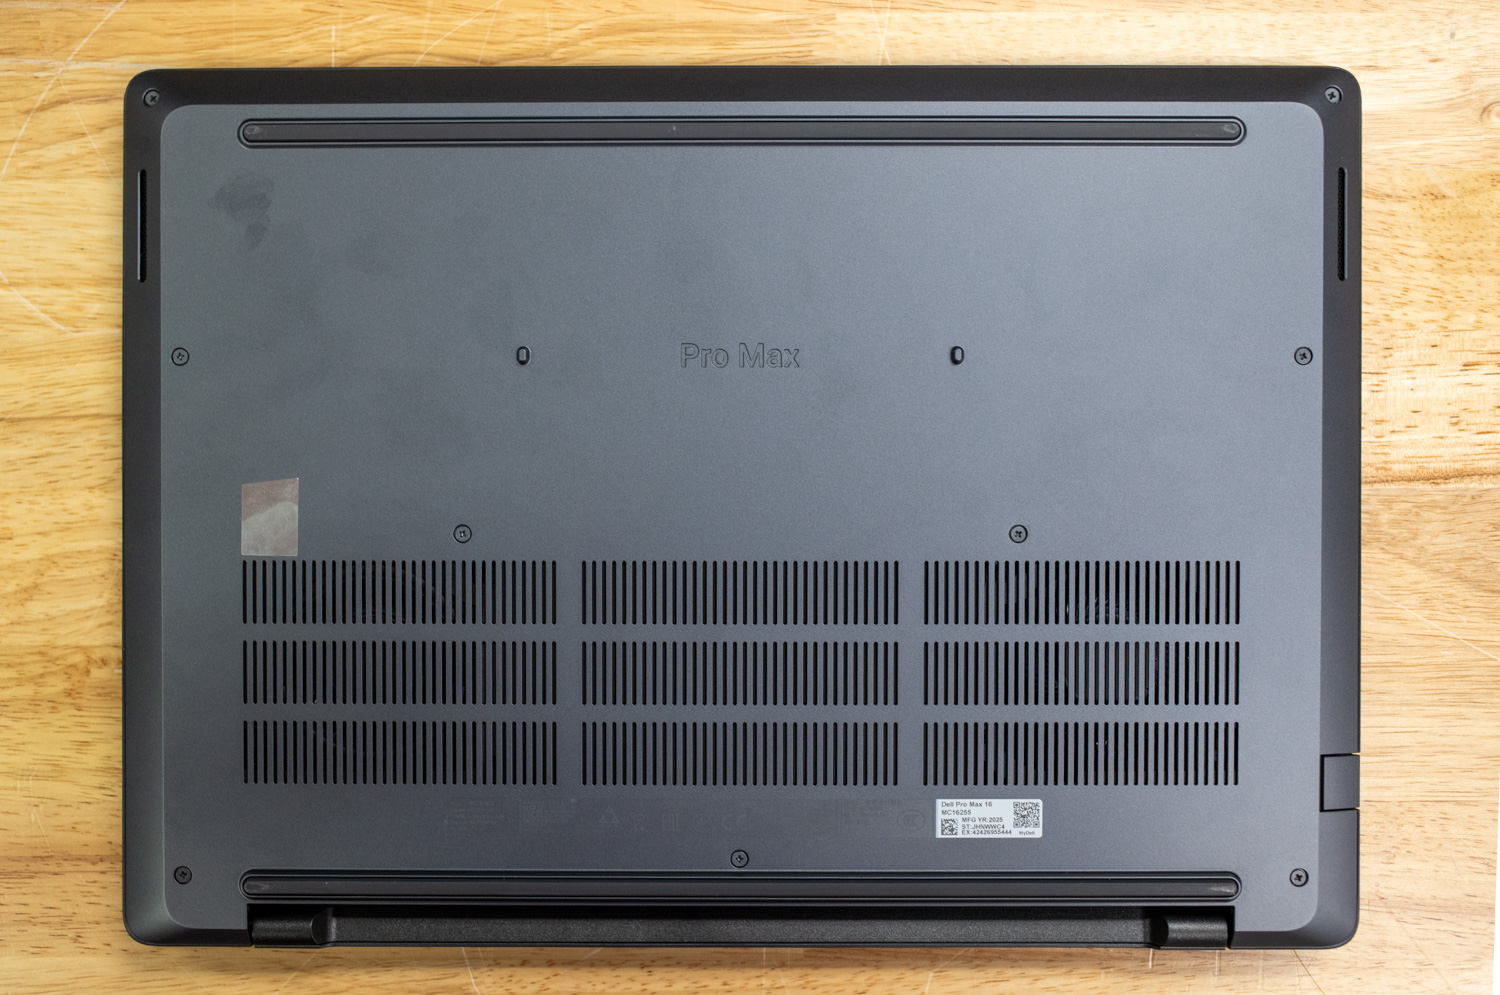
The bottom panel is secured by Philips-head screws.
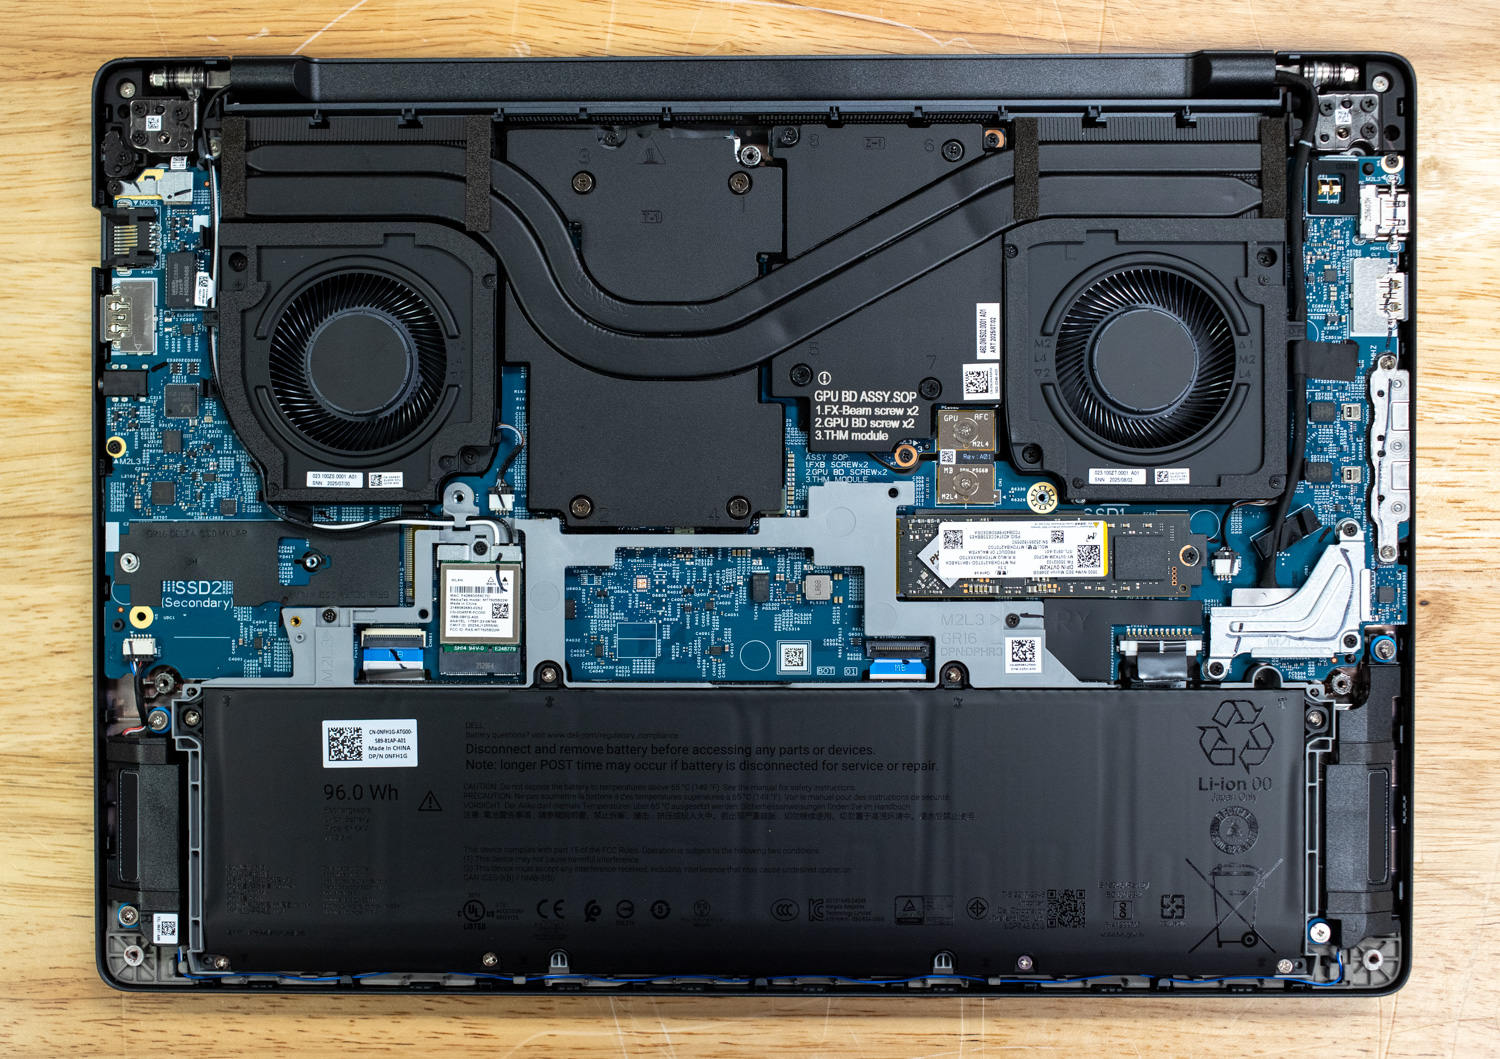
Upgradeable components include two M.2 2280 SSDs, the M.2 2230 wireless card, and the battery pack.
Performance Benchmarks
We tested the Pro Max 16, equipped with an AMD Ryzen AI 9 HX 370 processor (12 cores/24 threads, 5.1 GHz turbo, 45W), an NVIDIA RTX PRO 1000 “Blackwell” graphics card, 64GB of DDR5-8000 memory, and two 2 TB SSDs. This single-unit configuration costs $4,691 directly from Dell; however, business buyers should consult their channel partners for tailored pricing.
Our unit is substantially more powerful than the $1,349 base model, which includes a Ryzen AI 5 PRO 340 (6 cores/12 threads), integrated AMD Radeon graphics, 16GB of RAM, and a 256GB SSD. Our unit also has a 96Whr battery, an upgrade from the base model’s 64Whr, and security features including a fingerprint reader, SmartCard slot, and Control Vault 3+.
In our performance benchmarks, the Pro Max 16 will face an all-Dell lineup starting with the Pro Max 14 Premium (Core Ultra 9 285H, RTX PRO 2000 as tested) and the Pro Max 16 Premium (Core Ultra 7 265H, Intel Arc 140T). We also included two heavyweight plus models, the Pro Max 16 Plus and the Pro Max 18 Plus, featuring a Core Ultra 9 285HX and an RTX PRO 5000. Performance-wise, our review model’s Ryzen AI 9 HX 370 should be comparable to the Core Ultra H-class chips in the Premium models, but will likely not outperform the Core Ultra HX silicon in the Plus models.
The Pro Max 16’s fan noise is barely noticeable during everyday tasks, and the system remains pleasantly quiet under light workloads. When subjected to heavier demands, the fans spin up appropriately to manage thermal loads. The resulting noise is audible but never grating or disruptive.
Procyon AI Computer Vision
The Procyon AI Computer Vision Benchmark measures AI inference performance across CPUs, GPUs, and dedicated accelerators using a range of state-of-the-art neural networks. It evaluates tasks such as image classification, object detection, segmentation, and super-resolution using models that include MobileNet V3, Inception V4, YOLO V3, DeepLab V3, Real ESRGAN, and ResNet 50. Tests are run on multiple inference engines, including NVIDIA TensorRT, Intel OpenVINO, Qualcomm SNPE, Microsoft Windows ML, and Apple Core ML, providing a broad view of hardware and software efficiency. Results are reported for float- and integer-optimized models, providing a consistent, practical measure of machine vision performance for professional workloads.
In this CPU test, the Pro Max 16’s Ryzen chip proved competitive with the Pro Max 14 Premium’s Core Ultra 9 285H, scoring 120 points to the smaller machine’s 127. The Pro Max 16 Premium performed substantially better, achieving 153 points despite using a Core Ultra 7 265H, likely due to its greater thermal capacity. Meanwhile, the Core Ultra 9 285HX chips in the Plus models were in another league entirely, with the slight edge going to the larger 18-inch model (195 versus 190 points) due to its increased thermal headroom.
| CPU Results (average time in ms) | Dell Pro Max 16 AMD (AMD Ryzen AI 9 HX PRO 370)(NVIDIA RTX PRO 1000) | Dell Pro Max 16 Premium (Intel Core Ultra 7 265H) | Dell Pro Max 14 Premium (Intel Core Ultra 9 285H) (NVIDIA RTX PRO 2000) | Dell Pro Max 18 Plus (Intel Core Ultra 9 285HX) (NVIDIA RTX PRO 5000) | Dell Pro Max 16 Plus (Intel Core Ultra 9 285HX) (NVIDIA RTX PRO 5000) |
| AI Computer Vision Overall Score | 120 | 153 | 127 | 195 | 190 |
| MobileNet V3 | 1.21 ms | 0.98 ms | 1.12 ms | 1.00 ms | 0.97 ms |
| ResNet 50 | 9.75 ms | 8.83 ms | 7.05 ms | 6.98 ms | 7.29 ms |
| Inception V4 | 30.81 ms | 25.53 ms | 10.55 ms | 19.53 ms | 20.76 ms |
| DeepLab V3 | 57.37 ms | 31.94 ms | 37.46 ms | 24.15 ms | 24.02 ms |
| YOLO V3 | 67.98 ms | 63.71 ms | 77.49 ms | 44.53 ms | 44.59 ms |
| REAL-ESRGAN | 3,470.93 ms | 2,683.72 ms | 3,318.78 ms | 1,934.18 ms | 2,043.35 ms |
| CPU Integrated Graphics Results (average time in ms) | |||||
| AI Computer Vision Overall Score | 439 | 275 | 266 | 156 | 149 |
| MobileNet V3 | 0.83 | 1.05 ms | 1.00 ms | 1.35 ms | 1.35 ms |
| ResNet 50 | 3.20 | 4.18 ms | 4.54 ms | 8.86 ms | 8.90 ms |
| Inception V4 | 9.43 ms | 10.69 ms | 12.07 ms | 22.71 ms | 27.60 ms |
| DeepLab V3 | 19.26 ms | 25.38 ms | 26.13 ms | 37.80 ms | 38.68 ms |
| YOLO V3 | 15.63 ms | 28.91 ms | 29.12 ms | 54.03 ms | 57.56 ms |
| REAL-ESRGAN | 286.48 ms | 1,033.83 ms | 1,046.98 ms | 1,878.42 ms | 1,910.57 ms |
UL Procyon: AI Text Generation
The Procyon AI Text Generation Benchmark streamlines AI LLM performance testing by providing a concise and consistent evaluation method. It enables repeated testing across multiple LLM models, minimizing the complexity of large model sizes and variable factors. Developed with AI hardware leaders, it optimizes the use of local AI accelerators to deliver more reliable, efficient performance assessments. The results measured below were tested using TensorRT.
Not all the machines completed every test. While the Pro Max 16 predictably didn’t match the output from the formidable Plus models, it comfortably outperformed both the Premium machines, particularly the Pro Max 16 Premium, which relied on integrated graphics as tested. It matched or occasionally outperformed the Pro Max 14 Premium, despite the Pro Max 14 Premium using an RTX PRO 2000 against our Pro Max 16’s RTX PRO 1000, which may be due to the Pro Max 16’s card having a higher power rating.
| UL Procyon: AI Text Generation | Dell Pro Max 16 AMD (AMD Ryzen AI 9 HX PRO 370)(NVIDIA RTX PRO 1000) | Dell Pro Max 16 Premium (Intel Core Ultra 7 265H) | Dell Pro Max 14 Premium (Intel Core Ultra 9 285H) (NVIDIA RTX PRO 2000) | Dell Pro Max 18 Plus (Intel Core Ultra 9 285HX) (NVIDIA RTX PRO 5000) | Dell Pro Max 16 Plus (Intel Core Ultra 9 285HX) (NVIDIA RTX PRO 5000) |
| Phi Overall Score | 1,709 | 1,057 | 1,613 | 4,475 | 4,083 |
| Phi Output Time To First Token | 0.543 s | 0.578 s | 0.533 s | 0.237 s | 0.274 s |
| Phi Output Tokens Per Second | 61.895 tok/s | 25.202 tok/s | 54.065 tok/s | 185.118 tok/s | 178.614 tok/s |
| Phi Overall Duration | 47.564 s | 110.643 s | 53.421 s | 16.314 s | 17.133 s |
| Mistral Overall Score | 1,538 | 1,001 | 1,579 | 4,295 | 3,993 |
| Mistral Output Time To First Token | 0.865 s | 0.742 s | 0.789 s | 0.347 s | 0.370 s |
| Mistral Output Tokens Per Second | 44.929 tok/s | 16.311 tok/s | 43.210 tok/s | 140.546 tok/s | 134.228 tok/s |
| Mistral Overall Duration | 66.150 s | 169.883 s | 67.557 s | 21.665 s | 22.887 s |
| Llama3 Overall Score | 1,375 | 914 | 1,387 | 3,763 | 3,547 |
| Llama3 Output Time To First Token | 0.848 s | 0.682 s | 0.796 s | 0.344 s | 0.370 s |
| Llama3 Output Tokens Per Second | 39.475 tok/s | 14.034 tok/s | 37.701 tok/s | 119.741 tok/s | 114.741 tok/s |
| Llama3 Overall Duration | 75.026 s | 196.199 s | 77.103 s | 25.165 s | 26.319 s |
| Llama2 Overall Score | – | 937 | – | 4,155 | 4,044 |
| Llama2 Output Time To First Token | – | 1.341 s | – | 0.546 s | 0.558 s |
| Llama2 Output Tokens Per Second | – | 8.712 tok/s | – | 69.709 tok/s | 67.484 tok/s |
| Llama2 Overall Duration | – | 316.035 s | – | 42.506 s | 43.855 s |
UL Procyon: AI Image Generation
The Procyon AI Image Generation Benchmark provides a consistent and accurate method for measuring AI inference performance across a range of hardware, from low-power NPUs to high-end GPUs. It includes three tests: Stable Diffusion XL (FP16) for high-end GPUs, Stable Diffusion 1.5 (FP16) for moderately powerful GPUs, and Stable Diffusion 1.5 (INT8) for low-power devices. The benchmark uses the optimal inference engine for each system, ensuring fair and comparable results.
These results are similar to the AI Text Generation results above. Here, the presence of a dedicated GPU in the Pro Max 16 allowed it to outperform the Pro Max 16 Premium. Against the Pro Max 14 Premium, it performed better on Stable Diffusion 1.5 INT8 but was slightly behind in the FP16 and XL tests.
| UL Procyon: AI Image Generation | Dell Pro Max 16 AMD (AMD Ryzen AI 9 HX PRO 370)(NVIDIA RTX PRO 1000) | Dell Pro Max 16 Premium (Intel Core Ultra 7 265H) | Dell Pro Max 14 Premium (Intel Core Ultra 9 285H) (NVIDIA RTX PRO 2000) | Dell Pro Max 18 Plus (Intel Core Ultra 9 285HX) (NVIDIA RTX PRO 5000) | Dell Pro Max 16 Plus (Intel Core Ultra 9 285HX) (NVIDIA RTX PRO 5000) |
| Stable Diffusion 1.5 (FP16) – Overall Score | 1,027 | 334 | 1,112 | 3,687 | 3,540 |
| Stable Diffusion 1.5 (FP16) – Overall Time | 97.301 s | 298.677 s | 89.883 s | 27.119 s | 28.245 s |
| Stable Diffusion 1.5 (FP16) – Image Generation Speed | 6.081 s/image | 18.667 s/image | 5.618 s/image | 1.695 s/image | 1.765 s/image |
| Stable Diffusion 1.5 (INT8) – Overall Score | 13,504 | 1,934 | 11,830 | 44,101 | 39,329 |
| Stable Diffusion 1.5 (INT8) – Overall Time | 18.512 s | 129.216 s | 21.132 s | 5.669 s | 6.356 s |
| Stable Diffusion 1.5 (INT8) – Image Generation Speed | 2.314 s/image | 16.152 s/image | 2.614 s/image | 0.709 s/image | 0.795 s/image |
| Stable Diffusion XL (FP16) – Overall Score | 785 | 356 | 903 | 3,170 | 3,017 |
| Stable Diffusion XL (FP16) – Overall Time | 763.666 s | 1683.796 s | 663.886 s | 189.260 s | 198.869 s |
| Stable Diffusion XL (FP16) – Image Generation Speed | 47.729 s/image | 105.237 s/image | 41.493 s/image | 11.829 s/image | 12.429 s/image |
SPECviewperf 15
SPECviewperf 15 is the industry-standard benchmark for evaluating 3D graphics performance across OpenGL, DirectX, and Vulkan APIs. It introduces new workloads such as blender-01 (Blender 3.6), unreal_engine-01 (Unreal Engine 5.4, DirectX 12), and enscape-01 (Enscape 4.0, Vulkan ray tracing), along with updated traces for 3ds Max, CATIA, Creo, Maya, and Solidworks. With its redesigned GUI, modern application support, and advanced rendering workloads, SPECviewperf 15 provides consistent, real-world insights into professional graphics performance.
The GPU-centric nature of this test again puts the focus on the Pro Max 16 with the RTX PRO 1000 and the Pro Max 14 Premium with the RTX PRO 2000, where the latter proved a notch faster across all tests. The Pro Max 16 Premium’s integrated graphics prevented it from being competitive, and of course, the Plus models soared ahead with their high-wattage RTX PRO 5000 cards.
| SPECviewperf (higher is better) | Dell Pro Max 16 AMD (AMD Ryzen AI 9 HX PRO 370)(NVIDIA RTX PRO 1000) | Dell Pro Max 16 Premium (Intel Core Ultra 7 265H) | Dell Pro Max 14 Premium (Intel Core Ultra 9 285H) (NVIDIA RTX PRO 2000) | Dell Pro Max 18 Plus (Intel Core Ultra 9 285HX) (NVIDIA RTX PRO 5000) | Dell Pro Max 16 Plus (Intel Core Ultra 9 285HX) (NVIDIA RTX PRO 5000) |
| 3dsmax-08 | 20.84 | 8.50 | 28.50 | 98.71 | 97.60 |
| blender-01 | 34.79 | 6.55 | 38.68 | 83.23 | 79.46 |
| catia-07 | – | 9.86 | 48.64 | 113.18 | 107.91 |
| creo-04 | 115.03 | 23.65 | 121.82 | 247.79 | 238.60 |
| energy-04 | 52.27 | 8.09 | 58.10 | 170.27 | 161.60 |
| enscape-01 | 26.16 | 2.98 | 29.44 | 86.70 | 84.84 |
| maya-07 | 108.05 | 27.67 | 112.22 | 232.48 | 224.80 |
| medical-04 | 90.64 | 14.50 | 105.84 | 210.51 | 206.08 |
| solidworks-08 | 57.16 | 12.06 | 64.01 | 145.56 | 143.13 |
| unreal_engine-01 | 51.95 | 17.17 | 56.10 | 93.46 | 87.22 |
LuxMark
LuxMark is a GPU benchmark that utilizes LuxRender, an open-source ray-tracing renderer, to evaluate a system’s performance in handling highly detailed 3D scenes. This benchmark is relevant for assessing the graphical rendering capabilities of servers and workstations, especially for visual effects and architectural visualization applications, where accurate light simulation is crucial.
These results mirror SPECviewperf 15, with the Pro Max 16 being a clear step behind the Pro Max 14 Premium, which was 21% and 17% faster in Hallbench and Food, respectively.
| LuxMark (higher is better) | Dell Pro Max 16 AMD (AMD Ryzen AI 9 HX PRO 370)(NVIDIA RTX PRO 1000) | Dell Pro Max 16 Premium (Intel Core Ultra 7 265H) | Dell Pro Max 14 Premium (Intel Core Ultra 9 285H) (NVIDIA RTX PRO 2000) | Dell Pro Max 18 Plus (Intel Core Ultra 9 285HX) (NVIDIA RTX PRO 5000) | Dell Pro Max 16 Plus (Intel Core Ultra 9 285HX) (NVIDIA RTX PRO 5000) |
| Hallbench | 12,664 | 5,116 | 15,278 | 29,605 | 29,019 |
| Food | 4,680 | 2,055 | 5,488 | 13,042 | 12,684 |
7-Zip Compression
The 7-Zip Compression Benchmark evaluates CPU performance during compression and decompression, measuring GIPS (Giga Instructions Per Second) and CPU usage. Higher GIPS and efficient CPU usage indicate superior performance.
The Compression and Decompression numbers tell nuanced stories. There was little difference in compression between the Pro Max 16 and the Premium models, with the Pro Max 16 slotting between the two. However, the decompression test reveals a substantial performance advantage for the Pro Max 16, scoring 25% higher than the Pro Max 16 Premium and an astounding 41% higher than the Pro Max 14 Premium. Experience suggests that this test relies heavily on memory performance, where the Pro Max 16’s AMD Ryzen chip appears to have an advantage. These results carried into the Total ratings, where the Pro Max 16 finished 11% ahead of the Pro Max 16 Premium and 23% ahead of the Pro Max 14 Premium. In fact, the Pro Max 16 wasn’t far behind the Pro Max 16 Plus, which was just 14% faster.
| 7-Zip Compression Benchmark (higher is better) | Dell Pro Max 16 AMD (AMD Ryzen AI 9 HX PRO 370)(NVIDIA RTX PRO 1000) | Dell Pro Max 16 Premium (Intel Core Ultra 7 265H) | Dell Pro Max 14 Premium (Intel Core Ultra 9 285H) (NVIDIA RTX PRO 2000) | Dell Pro Max 18 Plus (Intel Core Ultra 9 285HX) (NVIDIA RTX PRO 5000) | Dell Pro Max 16 Plus (Intel Core Ultra 9 285HX) (NVIDIA RTX PRO 5000) |
| Compression | |||||
| Current CPU Usage | 2,230% | 1,307% | 1,355% | 1,905% | 1,799% |
| Current Rating/Usage | 4.953 GIPS | 8.284 GIPS | 7.824 GIPS | 7.275 GIPS | 6.252 GIPS |
| Current Rating | 110.458 GIPS | 108.266 GIPS | 105.987 GIPS | 138.244 GIPS | 110.594 GIPS |
| Resulting CPU Usage | 2,231% | 1,310% | 1,301% | 1,891% | 1,805% |
| Resulting Rating/Usage | 4.966 GIPS | 8.649 GIPS | 7.908 GIPS | 7.270 GIPS | 6.399 GIPS |
| Resulting Rating | 110.798 GIPS | 113.252 GIPS | 102.845 GIPS | 137.459 GIPS | 115.536 GIPS |
| Decompression | |||||
| Current CPU Usage | 2,109% | 1,248% | 1,275% | 2,226% | 2,187% |
| Current Rating/Usage | 6.023 GIPS | 7.745 GIPS | 7.108 GIPS | 7.175 GIPS | 7.229 GIPS |
| Current Rating | 127.034 GIPS | 96.626 GIPS | 90.621 GIPS | 159.735 GIPS | 158.102 GIPS |
| Resulting CPU Usage | 2,106% | 1,257% | 1,248% | 2,242% | 2,202% |
| Resulting Rating/Usage | 6.017 GIPS | 8.057 GIPS | 7.185 GIPS | 7.276 GIPS | 7.074 GIPS |
| Resulting Rating | 126.735 GIPS | 101.205 GIPS | 89.621 GIPS | 163.149 GIPS | 155.801 GIPS |
| Total Rating | |||||
| Total CPU Usage | 2,169% | 1,283% | 1,274% | 2,067% | 2,004% |
| Total Rating/Usage | 5.491 GIPS | 8.353 GIPS | 7.547 GIPS | 7.273 GIPS | 6.737 GIPS |
| Total Rating | 118.766 GIPS | 107.229 GIPS | 96.233 GIPS | 150.304 GIPS | 135.669 GIPS |
Blackmagic RAW Speed Test
The Blackmagic RAW Speed Test is a performance benchmarking tool that measures a system’s capabilities for handling video playback and editing using the Blackmagic RAW codec. It evaluates how well a system decodes and plays back high-resolution video files, reporting frame rates for both CPU- and GPU-based processing.
CPU testing placed the Pro Max 16 between the Premium models, underperforming the Pro Max 16 Premium’s Core Ultra 7 265H but outperforming the Pro Max 14 Premium’s Core Ultra 9 285H. However, it significantly underperformed in the OpenCL test, with just 46 frames per second (fps) compared to the Pro Max 14 Premium’s 112 fps, owing to the latter’s stronger GPU. The Plus models continued to perform several magnitudes better.
| Blackmagic RAW Speed Test | Dell Pro Max 16 AMD (AMD Ryzen AI 9 HX PRO 370)(NVIDIA RTX PRO 1000) | Dell Pro Max 16 Premium (Intel Core Ultra 7 265H) | Dell Pro Max 14 Premium (Intel Core Ultra 9 285H) (NVIDIA RTX PRO 2000) | Dell Pro Max 18 Plus (Intel Core Ultra 9 285HX) (NVIDIA RTX PRO 5000) | Dell Pro Max 16 Plus (Intel Core Ultra 9 285HX) (NVIDIA RTX PRO 5000) |
|---|---|---|---|---|---|
| 8K CPU | 75 | 82 | 64 | 128 | 130 |
| 8K OPENCL | 46 | 54 | 112 | 168 | 184 |
Blackmagic Disk Speed Test
The Blackmagic Disk Speed Test evaluates storage performance by measuring read and write speeds, providing insights into a system’s ability to handle data-intensive tasks, such as video editing and large file transfers.
These laptops can ship with various storage drive models, and performance will vary; therefore, we won’t spend a lot of time on these results. For an OEM Gen4 drive, the Pro Max performed well, achieving more than 5GB/s in read and nearly matching that in write.
| Disk Speed Test (higher is better) | Dell Pro Max 16 AMD (AMD Ryzen AI 9 HX PRO 370)(NVIDIA RTX PRO 1000) | Dell Pro Max 16 Premium (Intel Core Ultra 7 265H) | Dell Pro Max 14 Premium (Intel Core Ultra 9 285H) (NVIDIA RTX PRO 2000) | Dell Pro Max 18 Plus (Intel Core Ultra 9 285HX) (NVIDIA RTX PRO 5000) | Dell Pro Max 16 Plus (Intel Core Ultra 9 285HX) (NVIDIA RTX PRO 5000) |
| Read | 5,037.0MB/s | 6,938.6MB/s | 4,268.8MB/s | 7,776.1MB/s | 7,755.6MB/s |
| Write | 4,923.1MB/s | 6,684.1MB/s | 5,000.7MB/s | 6,022.0MB/s | 5,734.7MB/s |
Blender 4.5
Blender is an open-source 3D modeling application. This benchmark was run using the Blender Benchmark utility. The score is measured in samples per minute, with higher values indicating better performance.
This CPU test is intense and rewards the stronger Core HX chips found in the Pro Max Plus laptops. The Pro Max 16 Premium’s numbers were slightly better than those of the Pro Max 14 Premium, although only slightly more than half as good as the Pro Max 16 Plus.
| Blender CPU (samples per minute, higher is better) | Dell Pro Max 16 AMD (AMD Ryzen AI 9 HX PRO 370)(NVIDIA RTX PRO 1000) | Dell Pro Max 16 Premium (Intel Core Ultra 7 265H) | Dell Pro Max 14 Premium (Intel Core Ultra 9 285H) (NVIDIA RTX PRO 2000) | Dell Pro Max 18 Plus (Intel Core Ultra 9 285HX) (NVIDIA RTX PRO 5000) | Dell Pro Max 16 Plus (Intel Core Ultra 9 285HX) (NVIDIA RTX PRO 5000) |
| Monster | 135.1 | 107.9 | 105.8 | 237.1 | 208.48 |
| Junkshop | 92.5 | 73.1 | 69.1 | 150.7 | 131.17 |
| Classroom | 75.3 | 53.8 | 49.2 | 94.5 | 92.26 |
y-cruncher
y-cruncher is a multithreaded and scalable program that can compute Pi and other mathematical constants to trillions of digits. Since its launch in 2009, it has become a popular benchmarking and stress-testing application for overclockers and hardware enthusiasts.
These test results are the Pro Max 16’s most impressive so far. It completed the tests in just over half the time of the Premium models and largely outperformed the Plus models, except in one instance: the 2.5-billion-digit test against the Pro Max 18 Plus.
| Y-Cruncher (Total Computation Time) | Dell Pro Max 16 AMD (AMD Ryzen AI 9 HX PRO 370)(NVIDIA RTX PRO 1000)(NVIDIA RTX PRO 1000) | Dell Pro Max 16 Premium (Intel Core Ultra 7 265H) | Dell Pro Max 14 Premium (Intel Core Ultra 9 285H) (NVIDIA RTX PRO 2000) | Dell Pro Max 18 Plus (Intel Core Ultra 9 285HX) (NVIDIA RTX PRO 5000) | Dell Pro Max 16 Plus (Intel Core Ultra 9 285HX) (NVIDIA RTX PRO 5000) |
|---|---|---|---|---|---|
| 1 Billion | 21.856 s | 40.370 s | 37.877 s | 20.081 s | 22.782 s |
| 2.5 Billion | 61.851 s | 109.487 s | 110.787 s | 59.228 s | 64.209 s |
| 5 Billion | 137.051 s | – | 243.553 s | 142.822 s | 150.615 s |
| 10 Billion | 313.942 s | – | 539.174 s | 311.805 s | 332.901 s |
Geekbench 6
Geekbench 6 is a cross-platform benchmark that measures overall system performance. The Pro Max 16 proved competitive in single-core testing against the Premium models and their Core Ultra 2-series H-class chips, although it wasn’t directly compared to the higher-clocked HX chips in the Plus models. The multi-core numbers weren’t in the Pro Max 16’s favor; it finished noticeably behind the Premium models and wasn’t in the same class as the Plus laptops. The OpenCL test followed patterns observed in other tests, with the Pro Max 16 finishing behind the Pro Max 14 Premium, although ahead of the integrated-GPU Pro Max 16 Premium.
| Geekbench 6 (higher is better) | Dell Pro Max 16 AMD (AMD Ryzen AI 9 HX PRO 370)(NVIDIA RTX PRO 1000) | Dell Pro Max 16 Premium (Intel Core Ultra 7 265H) | Dell Pro Max 14 Premium (Intel Core Ultra 9 285H) (NVIDIA RTX PRO 2000) | Dell Pro Max 18 Plus (Intel Core Ultra 9 285HX) (NVIDIA RTX PRO 5000) | Dell Pro Max 16 Plus (Intel Core Ultra 9 285HX) (NVIDIA RTX PRO 5000) |
|---|---|---|---|---|---|
| CPU Single-Core | 2,875 | 2,844 | 2,841 | 2,977 | 3,032 |
| CPU Multi-Core | 15,319 | 17,310 | 16,732 | 20,717 | 20,978 |
| GPU OpenCL | 81,098 | 43,255 | 99,633 | 240,530 | 245,286 |
Topaz Video AI
Topaz Video AI is a professional application for enhancing and restoring video using advanced AI models. It supports various tasks, including upscaling footage to 4K or 8K, sharpening blurry content, reducing noise, enhancing facial details, colorizing black-and-white footage, and interpolating frames for smoother motion. The suite includes an onboard benchmark that measures system performance across its different video-enhancing algorithms, giving a clear view of how well hardware platforms handle demanding AI video processing workloads.
Although the Pro Max 16 was competitive with the Pro Max 14 and even performed better in a few instances, it primarily lived in the shadow of that model and its stronger RTX PRO 2000. Sustained workloads like these reward powerful computers. A glance at the numbers from the Plus models is enough to confirm that.
| Topaz Video AI Benchmark (Frames per second, higher is better) | Dell Pro Max 16 AMD (AMD Ryzen AI 9 HX PRO 370)(NVIDIA RTX PRO 1000) | Dell Pro Max 16 Premium (Intel Core Ultra 7 265H) | Dell Pro Max 14 Premium (Intel Core Ultra 9 285H) (NVIDIA RTX PRO 2000) | Dell Pro Max 18 Plus (Intel Core Ultra 9 285HX) (NVIDIA RTX PRO 5000) | Dell Pro Max 16 Plus (Intel Core Ultra 9 285HX) (NVIDIA RTX PRO 5000) | ||||||||||
|---|---|---|---|---|---|---|---|---|---|---|---|---|---|---|---|
| Model | 1X | 2X | 4X | 1X | 2X | 4X | 1X | 2X | 4X | 1X | 2X | 4X | 1X | 2X | 4X |
| Artemis | 5.74 | 3.99 | 1.47 | 4.81 | 3.35 | 1.20 | 5.56 | 2.48 | 0.99 | 31.10 | 16.94 | 4.22 | 29.50 | 12.34 | 3.36 |
| Iris | 5.89 | 3.70 | 1.47 | 3.87 | 2.37 | 0.75 | 6.65 | 3.46 | 2.94 | 27.77 | 16.07 | 4.16 | 27.25 | 4.40 | 3.74 |
| Proteus | 5.63 | 4.31 | 1.47 | 4.96 | 3.71 | 1.47 | 6.73 | 11.41 | 3.03 | 28.56 | 18.70 | 4.70 | 27.34 | 16.92 | 4.66 |
| Gaia | 2.43 | 1.64 | 0.93 | 1.95 | 1.33 | 0.93 | 2.97 | 1.83 | 0.42 | 38.53 | 5.88 | 4.27 | 7.85 | 5.61 | 3.91 |
| Nyx | 2.42 | 2.12 | – | .93 | 0.73 | – | 2.50 | 1.93 | – | 0.86 | – | – | 7.86 | – | – |
| Nyx Fast | 4.51 | – | – | 1.71 | – | – | 5.07 | – | – | 19.64 | – | – | 18.31 | – | – |
| Rhea | – | – | 0.33 | – | – | 0.56 | – | – | – | – | – | 3.20 | – | – | 3.14 |
| RXL | – | – | 0.30 | – | – | 0.58 | – | – | – | – | – | 3.06 | – | – | 3.03 |
| Hyperion HDR | 14.39 | – | – | 2.04 | – | – | 10.99 | – | – | 19.39 | – | – | 19.12 | – | – |
| Apollo | 8.77 | – | – | 4.23 | – | – | 7.50 | – | – | 33.49 | – | – | 33.14 | – | – |
| Aion | – | – | – | – | – | – | 25.15 | – | – | 25.06 | – | – | 24.35 | – | – |
| APFast | 27.34 | – | – | 13.47 | – | – | 20.53 | – | – | 43.90 | – | – | 59.29 | – | – |
| Chronos | 1.17 | – | – | 2.88 | – | – | 3.44 | – | – | 20.43 | – | – | 19.92 | – | – |
| CHFast | 6.71 | – | – | 4.04 | – | – | 5.75 | – | – | 30.88 | – | – | 27.82 | – | – |
3DMark CPU
The 3DMark CPU Profile evaluates processor performance across six threading levels: 1, 2, 4, 8, 16, and max threads. Each test runs the same boid-based simulation workload to assess how well the CPU scales under different thread counts, with minimal GPU involvement. The benchmark helps identify single-thread efficiency and multithreaded potential for tasks such as gaming, content creation, and rendering. Scores across 8 threads often align with modern DirectX 12 gaming performance, while 1–4-thread results reflect older or esports game scenarios.
Featuring 12 cores, the Pro Max 16’s Ryzen AI 9 HX 370 was neck-and-neck with this group through the 8-thread test, where its results fell short of the Core H-class Premium models and were completely outclassed by the Core Ultra HX-powered Plus models. In the Max Threads test, it was about 10% slower than the Pro Max 16 Premium’s Core Ultra 7 265H.
| 3DMark CPU Profile (higher is better) | Dell Pro Max 16 AMD (AMD Ryzen AI 9 HX PRO 370)(NVIDIA RTX PRO 1000) | Dell Pro Max 16 Premium (Intel Core Ultra 7 265H) | Dell Pro Max 14 Premium (Intel Core Ultra 9 285H) (NVIDIA RTX PRO 2000) | Dell Pro Max 18 Plus (Intel Core Ultra 9 285HX) (NVIDIA RTX PRO 5000) | Dell Pro Max 16 Plus (Intel Core Ultra 9 285HX) (NVIDIA RTX PRO 5000) |
|---|---|---|---|---|---|
| Max Threads | 10,396 | 11,593 | 11,214 | 16,497 | 16,832 |
| 16 Threads | 9,879 | 11,658 | 10,536 | 13,224 | 13,658 |
| 8 Threads | 7,214 | 7,984 | 7,010 | 7,658 | 9,028 |
| 4 threads | 4,445 | 4,604 | 4,388 | 4,583 | 4,799 |
| 2 threads | 2,310 | 2,391 | 2,309 | 2,435 | 2,464 |
| 1 threads | 1,173 | 1,225 | 1,198 | 1,234 | 1,263 |
3DMark Storage
The 3DMark Storage Benchmark tests your SSD’s gaming performance by measuring tasks like loading games, saving progress, installing game files, and recording gameplay. It evaluates how well your storage performs in real-world gaming and supports the latest storage technologies to provide accurate performance insights.
As with the CrystalDiskMark storage test, we won’t rely too heavily on storage test results, since the drive model in these laptops isn’t guaranteed. That said, the Pro Max 16 led the group with the highest score of 2,459, ahead of the next-best Pro Max 18 Plus, which scored 2,368.
| 3DMark Storage (higher is better) | Dell Pro Max 16 AMD (AMD Ryzen AI 9 HX PRO 370)(NVIDIA RTX PRO 1000) | Dell Pro Max 16 Premium (Intel Core Ultra 7 265H) | Dell Pro Max 14 Premium (Intel Core Ultra 9 285H) (NVIDIA RTX PRO 2000) | Dell Pro Max 18 Plus (Intel Core Ultra 9 285HX) (NVIDIA RTX PRO 5000) | Dell Pro Max 16 Plus (Intel Core Ultra 9 285HX) (NVIDIA RTX PRO 5000) |
|---|---|---|---|---|---|
| Score | 2,459 | 1,014 | 2,174 | 2,368 | 2,172 |
V-Ray
The V-Ray Benchmark measures rendering performance for CPUs, NVIDIA GPUs, or both using advanced V-Ray 6 engines. It utilizes quick tests and a simple scoring system to enable users to evaluate and compare their systems’ rendering capabilities. It’s an essential tool for professionals seeking efficient performance insights.
This test shows that our Pro Max 16’s RTX PRO 1000 is about 12.5% slower than the RTX PRO 2000 in the Pro Max 14 Premium, which probably won’t significantly impact most workflows. (The Pro Max 16 Premium couldn’t complete this test since it didn’t have an NVIDIA GPU as we tested it.)
| Vray (higher is better) | Dell Pro Max 16 AMD (AMD Ryzen AI 9 HX PRO 370)(NVIDIA RTX PRO 1000) | Dell Pro Max 14 Premium (Intel Core Ultra 9 285H) (NVIDIA RTX PRO 2000) | Dell Pro Max 18 Plus (Intel Core Ultra 9 285HX) (NVIDIA RTX PRO 5000) | Dell Pro Max 16 Plus (Intel Core Ultra 9 285HX) (NVIDIA RTX PRO 5000) |
|---|---|---|---|---|
| Score | 2,787 | 3,186 | 8,191 | 7,804 |
PCMark battery
To measure battery life in mobile systems, we use PCMark 10. It includes a Modern Office benchmark, providing a realistic assessment of battery life during typical workday tasks. It simulates everyday office activities, such as writing documents, browsing the web, and participating in video conferences, with built-in periods of inactivity to mirror how people use their laptops. This isn’t just about peak performance; it focuses on sustained usage under a moderate workload. It helps you understand how long you can expect a laptop to last through a day of office work.
The test operates in 10-minute cycles, balancing active tasks with periods of inactivity. Specifically, the Writing and Web Browsing workloads involve roughly 4.5 minutes of activity followed by 5.5 minutes of inactivity, while Video Conferencing is lighter, at 2 minutes of busy time and 8 minutes of idle time. This approach provides a more accurate representation of real-world battery drain than running demanding tasks continuously, giving you a better idea of longevity for everyday productivity.
The Pro Max 16 really impressed here, with a spectacular showing of 16 hours and 2 minutes. The Premium models were nowhere near as good, with the Pro Max 16 Premium only managing 10 hours and 2 minutes despite using integrated graphics. The Plus models predictably fared much worse, with the Pro Max 16 Plus reaching only 6 hours and 21 minutes.
| PCMark Battery (higher is better) | Dell Pro Max 16 AMD (AMD Ryzen AI 9 HX PRO 370)(NVIDIA RTX PRO 1000) | Dell Pro Max 16 Premium (Intel Core Ultra 7 265H) | Dell Pro Max 14 Premium (Intel Core Ultra 9 285HX) (NVIDIA RTX PRO 2000) | Dell Pro Max 18 Plus (Intel Core Ultra 9 285HX) (NVIDIA RTX PRO 5000) | Dell Pro Max 16 Plus (Intel Core Ultra 9 285HX) (NVIDIA RTX PRO 5000) |
|---|---|---|---|---|---|
| Time Elapsed | 16 Hr 2 Min | 10 Hr 2 Min | 8 Hr 29 Min | 3 Hr 39 Min | 6 Hr 21 Min |
Final Thoughts
Dell’s Pro Max 16 opens the door to professional and AI workloads without a premium-tier investment. Its Ryzen AI 9 HX 370 processor holds its own against Intel’s Core Ultra 2-series H-class chips, occasionally outperforming them, though more often trailing slightly. Given the AMD variant’s lower cost, this tradeoff feels reasonable. On the GPU front, the RTX PRO 1000 Blackwell GPU isn’t particularly powerful, but it delivers entry-level performance with ISV certifications for key professional applications.
We were disappointed to see that the AMD version of this laptop lacks several features available in the Intel version, including superior display options, upgradeable memory, mobile broadband, and the RTX PRO 2000 GPU. Still, the price difference helps soften those omissions. The keyboard could also benefit from a more tactile feel, though it remains serviceable.
Where the Pro Max 16 truly shines is battery life, outlasting its Premium and particularly its Plus siblings by a wide margin. This makes it especially compelling for edge deployments where power access is limited. All in all, it’s a strong contender for businesses seeking a capable and cost-conscious workstation.


 Amazon