

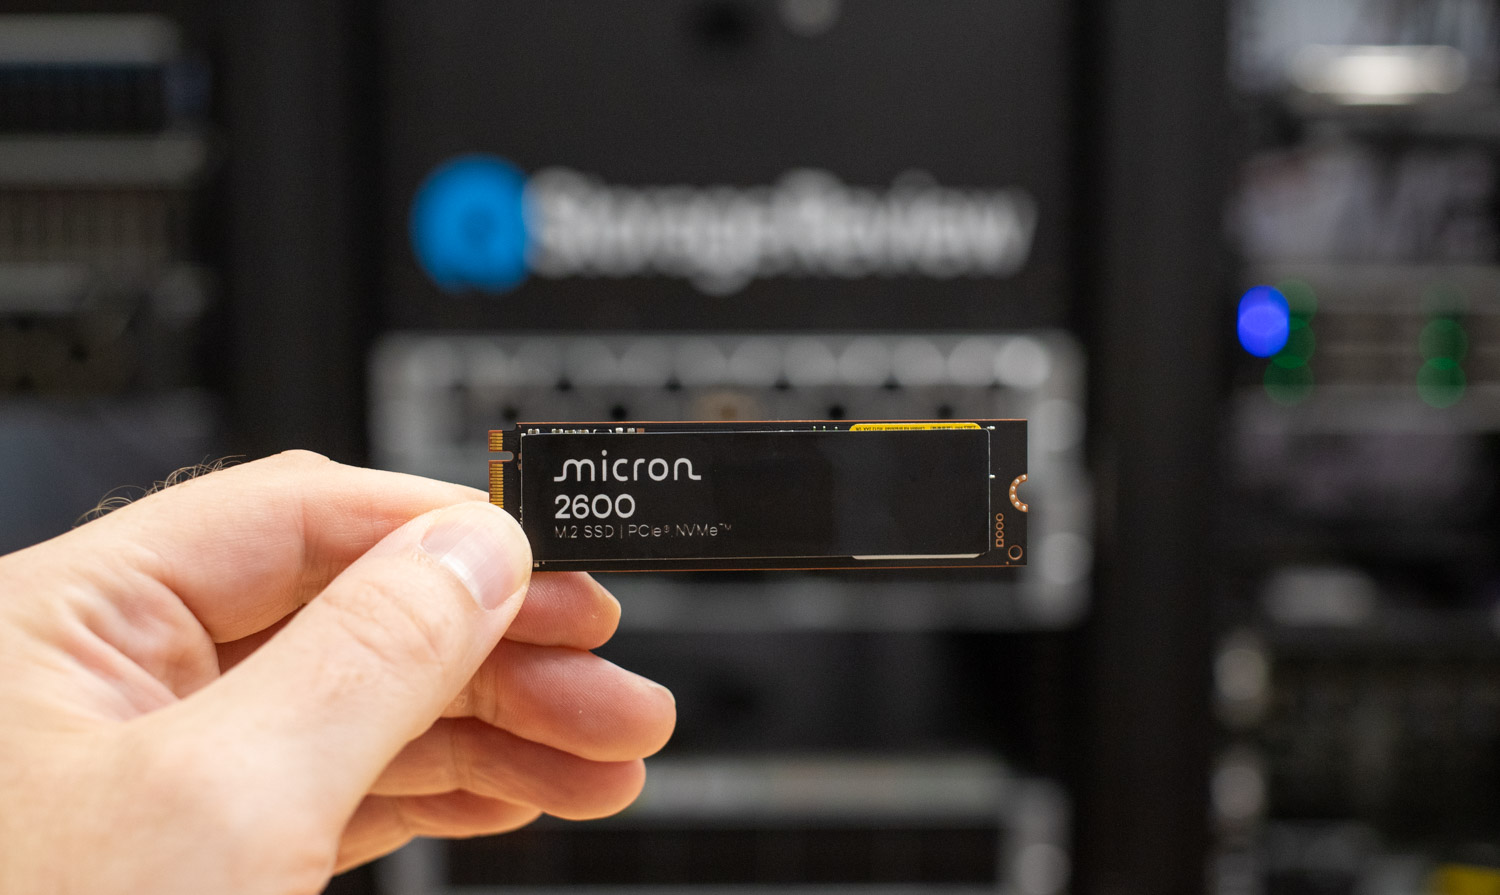
The Micron 2600 SSD targets mainstream computing needs, but takes a more ambitious approach than most QLC-based drives. It uses Micron’s latest 9th-generation QLC NAND and introduces Adaptive Write Technology (AWT), a firmware feature that improves write performance during heavier workloads. This makes the 2600 a viable option for OEMs and integrators looking for a value-tier SSD that doesn’t compromise on responsiveness or sustained speed.
It comes in multiple M.2 form factors and is available in capacities of 512GB, 1TB, and 2TB. Micron sees the 2600 as a value-focused QLC SSD that offers more than what you typically get from DRAM-less models. Adaptive Write Technology plays a key role here by enabling the drive to handle heavier, sustained workloads, such as OS imaging, large media transfers, and game installations. These areas are where QLC drives often encounter performance limitations. Micron also points to better results in user experience benchmarks, suggesting the drive feels more responsive in everyday use.
Examining the performance specs reveals that sequential reads peak at 7,200MB/s for the 1TB and 2TB models (compared to 5,000MB/s for the 512GB model), and writes reach 6,500MB/s for the largest SKU. Random IOPS scale as expected, reaching up to 1,100K for reads and 1,000K for writes on the 2TB variant. Latencies are respectable, with typical read and write values at 50µs and 12µs, respectively. As usual, we’ll take a closer look at its performance in our benchmark section below and see if there’s any truth to these claims.
Micron 2600 Features and Market Positioning
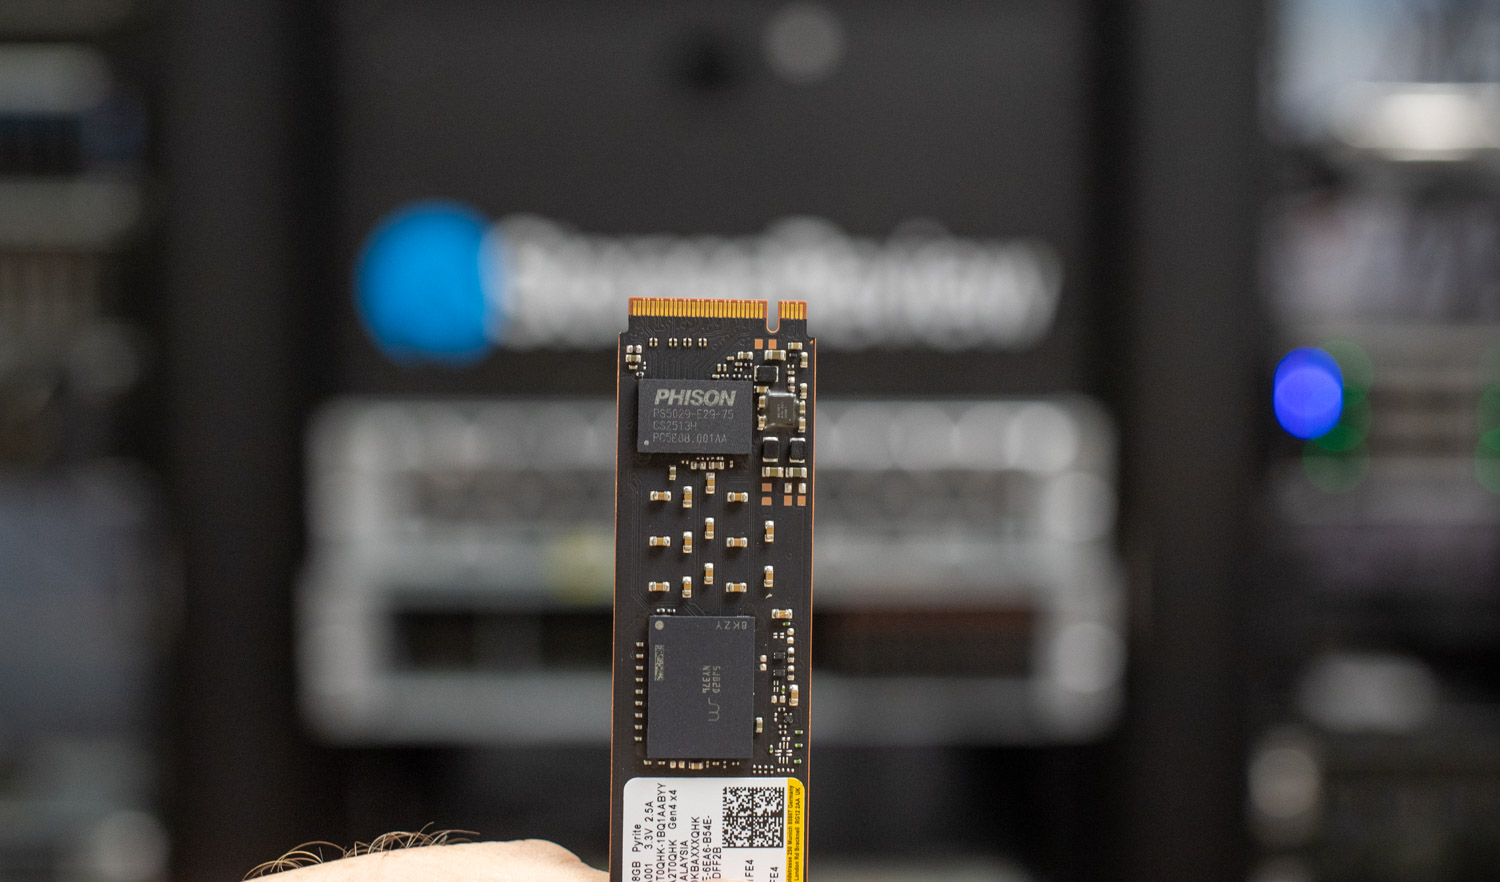
Micron leverages its G9 QLC NAND on the 2600, which it claims has the fastest I/O rate for any shipping QLC NAND (up to 3.6 GB/s internally), effectively closing the gap between value-tier QLC and mainstream TLC SSDs. That NAND is then paired with the Phison E29T controller.
Endurance ranges from 200TBW for the 512GB model to 700TBW for the 2TB version, which are moderate figures but in line with what’s typical for current QLC SSDs. Moreover, power efficiency across all capacities is tuned for notebook deployment with sub-5mW idle and <2.5mW sleep power draw. In terms of positioning, the Micron 2600 is a direct competitor to the Samsung BM9C1, KIOXIA XG7, and WD SN5000S on the QLC side, while also targeting TLC-based value drives like the Samsung PM9C1a, KIOXIA BG6, WD SN740, and SK hynix BC901.
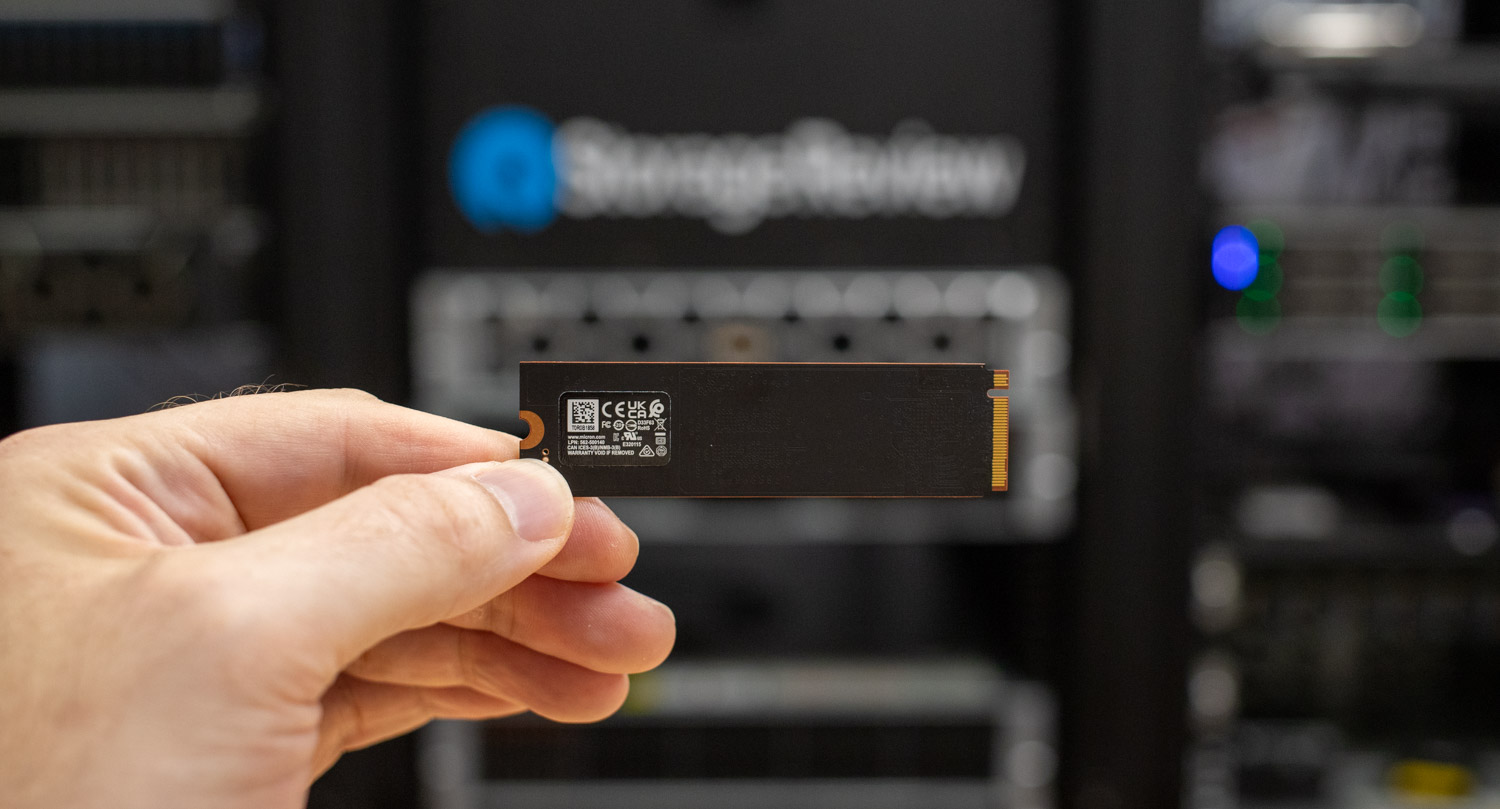
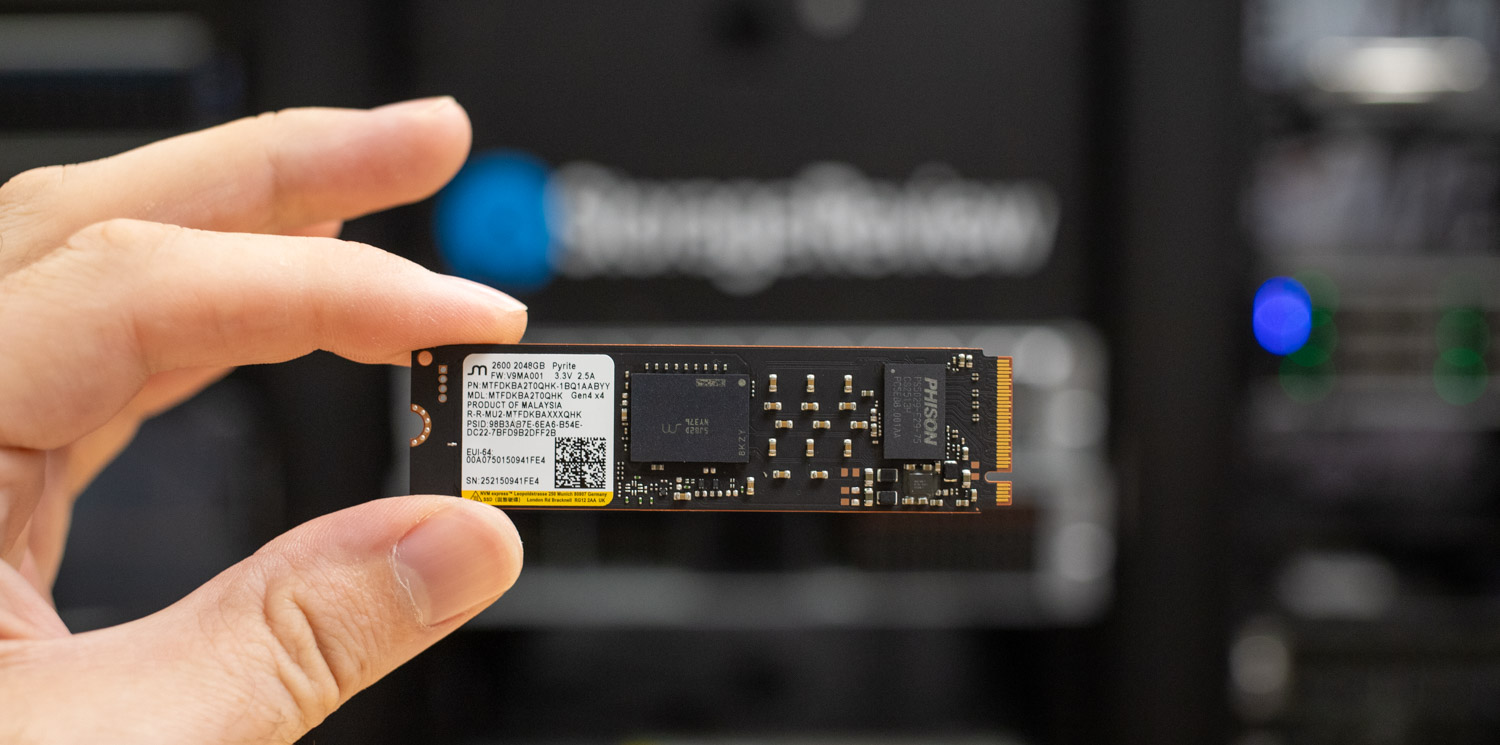
The Micron 2600 comes in 22x80mm, 22x42mm, and 22x30mm M.2 options. We will be reviewing the 2TB 2280 model.
Micron 2600 Specifications
| Specification | Detail |
| Form Factor | M.2 (22x80mm, 22x42mm, 22x30mm) |
| Capacities | 512GB, 1TB, 2TB |
| NAND Type | Micron 9th Generation QLC |
| Interface | PCIe Gen4, NVMe 2.0d |
| Controller Features | Micron Adaptive Write Technology (AWT) |
| Sequential Read (Max) | Up to 7,200 MB/s (1TB & 2TB), 5,000 MB/s (512GB) |
| Sequential Write (Max) | Up to 6,500 MB/s (1TB & 2TB) |
| Random Read (Max) | Up to 1,100K IOPS (2TB) |
| Random Write (Max) | Up to 1,000K IOPS (2TB) |
| Read Latency | Typical 50µs |
| Write Latency | Typical 12µs |
| Endurance (TBW) | 200TBW (512GB), up to 700TBW (2TB) |
| Idle Power | <5mW |
| Sleep Power | <2.5mW |
| Performance Features | Micron Adaptive Write Technology, fastest QLC NAND I/O (up to 3.6GB/s) |
| Use Case Focus | OS imaging, content creation, game installs, software builds, system integration |
Before diving into the benchmarks, here’s a list of comparable Gen4 and Gen5 drives tested alongside the Micron 2600 2TB and their respective PCIe generation:
- SanDisk SN8100 (PCIe Gen5)
- Kingston FURY Renegade G5 (PCIe Gen5)
- Samsung 9100 Pro (PCIe Gen5)
- SK hynix Platinum P51 (PCIe Gen5)
- Crucial T705 (PCIe Gen5)
- Lexar Professional NM1090 PRO (PCIe Gen5)
- PNY CS2150 (PCIe Gen5)
- Crucial P510 (PCIe Gen5)
- TEAMGROUP T-Force GE (PCIe Gen5)
- TEAMGROUP T-Force GC (PCIe Gen5)
- Samsung 990 Pro (PCIe Gen4)
- WD SN850X 2TB (PCIe Gen4)
We subjected these drives to various tests to evaluate their real-world and synthetic performance. This includes LLM load times to measure how quickly they handle large AI models, DirectStorage tests to assess how fast they load game assets and process in-game data, and BlackMagic Design tests to evaluate read and write speeds for high-resolution video editing. We also ran PCMark10 to gauge overall system responsiveness, 3DMark Storage to test gaming performance, and FIO tests to measure peak sequential and random read/write speeds under heavy workloads.
Here’s the high-performance test rig we used for benchmarking:
- CPU: AMD Ryzen 7 9800X3D
- Motherboard: Asus ROG Crosshair X870E Hero
- RAM: G.SKILL Trident Z5 Royal Series DDR5-6000 (2x16GB)
- GPU: NVIDIA GeForce RTX 4090
- OS: Windows 11 Pro, Ubuntu 24.10 Desktop
Peak Synthetic Performance
The FIO test is a flexible and powerful benchmarking tool used to measure the performance of storage devices, including SSDs and HDDs. It evaluates metrics such as bandwidth, IOPS, and latency under different workloads, like sequential and random read/write operations. This test helps to assess the peak performance of storage systems, making it useful for comparing different devices or configurations. We measured the peak burst performance for this test, limiting the workload to a 10GB footprint on both SSDs.
In the FIO test, the QLC-based Micron 2600 holds its own against other Gen4 mainstream SSDs, particularly considering its architecture. It delivers 5,702 MB per second sequential read with 1.47 ms latency and 6,612 MB per second sequential write, putting it close to the Crucial P310 and WD SN850X in raw throughput. For random 4K reads, the 2600 reaches 1.11 million IOPS, slightly behind the 1.2 million IOPS seen from TLC competitors, and performs well in random 4K writes at 1.36 million IOPS, surpassing the WD SN850X. While its latency trails the top-tier drives, the 2600 still provides capable responsiveness and throughput for general workloads, offering reliable performance in a value-oriented Gen4 profile.
| FIO Test (higher MB/s/IOPS is better) | Sequential 128K Read (1T/64Q) | Sequential 128K Write (1T/64Q) | Random 4K Read (16T/32Q) | Random 4K Write (16T/32Q) |
| SanDisk SN8100 | 15,000 MB/s (0.56ms avg latency) | 14,100 MB/s (0.59ms avg latency) | 2.312M IOPS (0.22ms avg latency) | 2.144M IOPS (0.24ms avg latency) |
| Kingston FURY Renegade G5 | 14,600 MB/s (0.57ms avg latency) | 14,100 MB/s (0.59ms avg latency) | 2.028M IOPS (0.25ms avg latency) | 2.028M IOPS (0.25ms avg latency) |
| Samsung 9100 Pro | 14,600 MB/s (0.57ms avg latency) | 13,300 MB/s (0.63ms avg latency) | 2.734M IOPS (0.18ms avg latency) | 2.734M IOPS (0.19ms avg latency) |
| SK hynix Platinum P51 | 14,500 MB/s (0.58ms avg latency) | 13,500 MB/s (0.62ms avg latency) | 2.369M IOPS (0.22ms avg latency) | 2.669M IOPS (0.19ms avg latency) |
| Crucial T705 | 14,400 MB/s (0.58ms avg latency) | 12,300 MB/s (0.68ms avg latency) | 1.585M IOPS (0.32ms avg latency) | 2.703M IOPS (0.19ms avg latency) |
| TEAMGROUP GE Pro 2TB | 13,900 MB/s (0.60ms avg latency) | 12,800 MB/s (0.65ms avg latency) | 2.585M IOPS (0.23ms avg latency) | 1.818M IOPS (0.28ms avg latency) |
| Lexar Professional NM1090 PRO | 13,800GB/s (0.61ms avg latency) | 13,600 MB/s (0.62ms avg latency) | 2.251M IOPS (0.23ms avg latency) | 1.818M IOPS (0.28ms avg latency) |
| TEAMGROUP GC Pro 2TB | 13,600 MB/s (0.62ms avg latency) | 12,700 MB/s (0.66ms avg latency) | 2.110M IOPS (0.24ms avg latency) | 1.686M IOPS (0.28ms avg latency) |
| PNY CS2150 | 10,400GB/s (0.80ms avg latency) | 8,801MB/s (0.95ms avg latency) | 1.379M IOPS (0.371ms avg latency) | 1.623 IOPS (0.32ms avg latency) |
| Crucial P510 | 8,835 MiB/s (0.90 ms avg latency) | 9,961 MB/s (0.80 ms avg latency) | 1.163M IOPS (0.44ms avg latency) | 1.196M IOPS (0.51ms avg latency) |
| Samsung 990 Pro | 7,483 MB/s (1.12ms avg latency) | 7,197 MB/s (1.16ms avg latency) | 1.400M IOPS (0.36ms avg latency) | 1.403M IOPS (0.36ms avg latency) |
| Crucial P310 2TB | 7,197 MB/s (1.16ms avg latency) | 6,376 MB/s (1.31ms avg latency) | 1.163M IOPS (0.44ms avg latency) | 1.196M IOPS (0.43ms avg latency) |
| WD SN850X 2TB | 6,632 MB/s (0.76ms avg latency) | 7,235 MB/s (0.92ms avg latency) | 1.2M IOPS (0.43ms avg latency) | 825K IOPS (0.62ms avg latency) |
| Micron 2600 2TB | 5,702 MB/s (1.47ms avg latency) | 6,612 MB/s (1.27ms avg latency) | 1.11M IOPS (0.46ms avg latency) | 1.36M IOPS (0.38ms avg latency) |
Average LLM Load Time
The Average LLM Load Time test evaluated the load times of three different LLMs: DeepSeek R1 7B, Meta Llama 3.2 11B, and DeepSeek R1 32B. Each model was tested 10 times, and the average load time was calculated. This test measures the drive’s ability to load large language models (LLMs) into memory quickly. LLM load times are critical for AI-related tasks, especially for real-time inference and extensive dataset processing. Faster loading enables the model to process data rapidly, thereby improving AI responsiveness and reducing waiting time.
The Micron 2600 shows longer load times across all tested LLMs compared to the top-tier Gen5 TLC drives. For the DeepSeek R1 7B, it loads in 3.3178 seconds, approximately 30% slower than the SK hynix Platinum P51, the fastest drive in this test. In the Meta Llama 3.2 11B benchmark, it posts 3.9174 seconds, around 9 percent slower than the leader. The most pronounced gap appears with the DeepSeek R1 32B model, where it records 5.9060 seconds, roughly 41 percent behind the SK hynix. While the 2600 is not at the bottom of the stack, it tends to fall behind the top Gen5 performers, particularly with larger model loads. This may be a consideration for users focused on real-time inference and low-latency AI workloads.
| Average LLM Load Time (lower is better) | DeepSeek R1 7B | Meta Llama 3.2 11B Vision | DeepSeek R1 32B |
| SK hynix Platinum P51 | 2.5481s | 3.5809s | 4.1790s |
| SanDisk SN8100 | 2.5702s | 3.5856s | 4.2870s |
| Samsung 9100 Pro 4TB | 2.6173s | 3.6017s | 4.3735s |
| PNY CS2150 | 2.8107s | 3.6820s | 4.8962s |
| Crucial T705 2TB | 2.8758s | 3.6312s | 5.1080s |
| Samsung 990 Pro 2TB | 2.8758s | 3.6312s | 5.1080s |
| Crucial P510 1TB | 2.8817s | 3.6631s | 5.0594s |
| TEAMGROUP GE Pro 2TB | 2.9092s | 3.9136s | 4.8974s |
| TEAMGROUP GC Pro 2TB | 2.9379s | 3.9267s | 4.8188s |
| WD SN850X 2TB | 3.0082s | 3.6543s | 5.4844s |
| Kingston FURY Renegade G5 | 3.1843s | 4.8009s | 4.6523s |
| Crucial P310 2TB | 3.1889s | 3.7083s | 5.4844s |
| Lexar Professional NM1090 PRO | 3.2135s | 4.9504s | 7.2108s |
| Micron 2600 2TB | 3.3178s | 3.9174s | 5.9060s |
3DMark Direct Storage
The 3DMark DirectStorage Feature Test evaluates how Microsoft’s DirectStorage optimizes game asset loading on PCIe SSDs. By reducing CPU overhead and improving data transfer speeds, DirectStorage enhances loading times, especially when paired with GDeflate compression and Windows 11’s BypassIO. This test isolates storage performance to highlight the potential bandwidth improvements when DirectStorage is enabled.
The Micron 2600 delivers lower throughput in DirectStorage workloads compared to higher-end Gen5 drives. In the GDeflate compressed transfer from storage to VRAM, it reaches 14.11GB/s, while the SK hynix Platinum P51 leads at 26.32GB/s, a 1.86 times difference. For uncompressed transfers with DirectStorage enabled, it delivers 5.93GB/s, compared to 12.94GB/s on the SanDisk SN8100, a more than twofold gap. With DirectStorage disabled, Micron posts 5.27 GB/s, which is behind drives that exceed 8.9 GB/s. In storage-to-RAM transfers, both with and without DirectStorage, it remains behind the top-tier performers.
| 3DMark Direct Storage, (GB/s, higher is better) | Storage to VRAM (GDeflate Compression) | Storage to VRAM (DirectStorage on, Uncompressed) | Storage to VRAM (DirectStorage off, Uncompressed) | Storage to RAM (DirectStorage on, Uncompressed) | Storage to RAM (DirectStorage off, Uncompressed) | GDeflate Decompression Bandwidth |
| SK hynix Platinum P51 | 26.32 | 11.20 | 7.75 | 12.85 | 9.46 | 64.68 |
| SanDisk SN8100 | 26.11 | 12.94 | 7.63 | 12.94 | 9.78 | 64.51 |
| Crucial T705 2TB | 25.75 | 10.71 | 8.79 | 12.03 | 8.83 | 66.36 |
| TEAMGROUP GE Pro 2TB | 24.70 | 10.19 | 7.49 | 11.33 | 9.35 | 65.05 |
| Lexar Professional NM1090 PRO | 24.03 | 11.23 | 7.57 | 12.18 | 8.72 | 63.15 |
| Samsung 9100 Pro 4TB | 23.77 | 11.26 | 8.92 | 11.62 | 9.48 | 66.61 |
| Kingston FURY Renegade G5 | 23.29 | 10.03 | 7.44 | 11.81 | 9.63 | 65.79 |
| TEAMGROUP GC Pro 2TB | 22.94 | 9.46 | 7.13 | 10.71 | 8.14 | 63.80 |
| Crucial P510 1TB | 19.63 | 8.33 | 6.92 | 9.06 | 7.49 | 66.22 |
| PNY CS2150 | 19.49 | 8.60 | 6.98 | 9.22 | 7.70 | 62.43 |
| WD SN850X 2TB | 15.28 | 11.11 | 8.93 | 6.78 | 6.27 | 64.96 |
| Crucial P310 2TB | 14.81 | 10.75 | 8.56 | 6.46 | 5.87 | 65.43 |
| Samsung 990 Pro 2TB | 14.18 | 11.28 | 8.84 | 6.57 | 6.20 | 65.71 |
| Micron 2600 2TB | 14.11 | 5.93 | 5.27 | 6.34 | 5.50 | 64.09 |
BlackMagic Disk Speed Test
The BlackMagic Disk Speed Test benchmarks a drive’s read and write speeds, estimating its performance, especially for video editing tasks. It helps users ensure their storage is fast enough for high-resolution content, like 4K or 8K video.
The Micron 2600 achieved 5,607.4MB/s in write speed and 4,663.3MB/s in read speed in the BlackMagic Disk Speed Test, placing it last among the tested drives. While its raw throughput trails the rest of the pack, the drive still comfortably supports a wide range of professional video formats. It shows full compatibility with ProRes 422 HQ and H.265 for formats up to 12K DCI at 60 fps, as well as BlackMagic RAW up to 8K DCI at 60 fps and 12K DCI at 24 fps. Despite its lower ranking, the 2600 remains a capable option for high-resolution workflows, handling everything from 1080p60 to 8K DCI ProRes editing without issue. For uncompressed RAW at the highest resolutions or users seeking maximum bandwidth, a higher-performing TLC-based SSD may be better suited.
| BlackMagic Disk Speed (MB/s, higher is better) | Read MB/s | Write MB/s |
| SanDisk SN8100 | 10,005.2 | 10,581.0 |
| Kingston FURY Renegade G5 | 9,665.0 | 10,831.0 |
| Samsung 9100 Pro 4TB | 9,542.3 | 9,907.9 |
| SK hynix Platinum P51 | 9,241.0 | 9,109.0 |
| Lexar Professional NM1090 PRO | 9,149.2 | 10,466.6 |
| Crucial T705 2TB | 8,464.2 | 10,256.4 |
| Crucial P510 1TB | 7,853.9 | 7,939.6 |
| TEAMGROUP GE Pro 2TB | 6933.6 | 8700.6 |
| PNY CS2150 | 6,625.5 | 7,299.5 |
| TEAMGROUP GC Pro 2TB | 6476.8 | 7,796.8 |
| WD SN850X 2TB | 5,862.6 | 5,894.8 |
| Samsung 990 Pro 2TB | 5,769.5 | 5,842.9 |
| Crucial P310 2TB | 5,282.4 | 5,458.9 |
| Micron 2600 2TB | 4,663.3 | 5,607.4 |
PCMark 10 Storage Benchmark
PCMark 10 Storage Benchmarks evaluate real-world storage performance using application-based traces. It tests the system and data drives, measuring bandwidth, access times, and consistency under load. These benchmarks offer practical insights beyond synthetic tests, enabling users to compare modern storage solutions effectively.
The Micron 2600 2TB scored 5,885 in the PCMark 10 Data Drive benchmark, placing it near the bottom of the pack but still ahead of some Gen4 TLC drives, such as the WD SN850X. It trails the top performer, the Crucial T705, by approximately 33 percent. Even mid-range options, such as the Samsung 990 Pro and TEAMGROUP GC Pro, post higher scores, indicating stronger responsiveness in real-world tasks like file transfers and application launches. While not leading in this test, the 2600 delivers performance that remains competitive within its class and ahead of certain TLC-based alternatives.
| PCMark 10 Data Drive (higher is better) | Overall Score |
| Crucial T705 2TB | 8,783 |
| SK hynix Platinum P51 | 8,665 |
| SanDisk SN8100 | 8,644 |
| Lexar Professional NM1090 PRO | 8,247 |
| Kingston FURY Renegade G5 | 8,062 |
| TEAMGROUP GC Pro 2TB | 7,648 |
| Samsung 9100 Pro 4TB | 7,552 |
| Samsung 990 Pro 2TB | 7,173 |
| TEAMGROUP GE Pro 2TB | 6,957 |
| Crucial P310 2TB | 6,436 |
| PNY CS2150 | 6,070 |
| Micron 2600 2TB | 5,885 |
| WD SN850X 2TB | 4,988 |
3DMark Storage
The 3DMark Storage Benchmark tests your SSD’s gaming performance by measuring tasks like loading games, saving progress, installing game files, and recording gameplay. It evaluates how well your storage handles real-world gaming activities and supports the latest storage technologies for accurate performance insights.
The Micron 2600 scored 4,018 in the 3DMark Storage Benchmark, placing third from last but finishing ahead of the WD SN850X and Crucial P310. This includes one Gen4 TLC and one QLC-based drive, showing the 2600 holds its own within its category. It trails the top performer, the SanDisk SN8100, by about 34 percent, and midrange options like the Samsung 990 Pro and PNY CS2150 post higher scores. Still, the Micron drive should be more than enough for loading games, saving progress, installing game files, and recording gameplay.
| 3DMark Storage benchmark (higher is better) | Overall Score |
| SanDisk SN8100 | 6,047 |
| Kingston FURY Renegade G5 | 5,670 |
| Crucial T705 2TB | 5,100 |
| SK hynix Platinum P51 | 5,082 |
| Lexar Professional NM1090 PRO | 4,828 |
| Samsung 9100 Pro 4TB | 4,779 |
| TEAMGROUP GC Pro 2TB | 4,713 |
| TEAMGROUP GE Pro 2TB | 4,380 |
| Crucial P510 1TB | 4,148 |
| PNY CS2150 | 4,193 |
| Samsung 990 Pro 2TB | 4,128 |
| Micron 2600 2TB | 4,018 |
| WD SN850X 2TB | 3,962 |
| Crucial P310 2TB | 3,848 |
GPU Direct Storage
One of the tests we conducted on this testbench was the Magnum IO GPU Direct Storage (GDS) test. GDS is a feature developed by NVIDIA that allows GPUs to bypass the CPU when accessing data stored on NVMe drives or other high-speed storage devices. Instead of routing data through the CPU and system memory, GDS enables direct communication between the GPU and the storage device, significantly reducing latency and improving data throughput.
How GPU Direct Storage Works
Traditionally, when a GPU processes data stored on an NVMe drive, the data must first travel through the CPU and system memory before reaching the GPU. This process introduces bottlenecks, as the CPU becomes a middleman, adding latency and consuming valuable system resources. GPU Direct Storage eliminates this inefficiency by enabling the GPU to access data directly from the storage device via the PCIe bus. This direct path reduces the overhead associated with data movement, allowing faster and more efficient data transfers.
AI workloads, especially those involving deep learning, are highly data-intensive. Training large neural networks requires processing terabytes of data, and any delay in data transfer can lead to underutilized GPUs and longer training times. GPU Direct Storage addresses this challenge by ensuring that data is delivered to the GPU as quickly as possible, minimizing idle time and maximizing computational efficiency.
In addition, GDS is particularly beneficial for workloads that involve streaming large datasets, such as video processing, natural language processing, or real-time inference. By reducing the reliance on the CPU, GDS accelerates data movement and frees up CPU resources for other tasks, further enhancing overall system performance.
Results
The Micron 2600 delivered mid-to-lower-tier performance in the GPU Direct Storage (GDSIO) test, notably as block sizes increased. With a 16K block size and a queue depth of 128, it achieved 3.1 GiB/s read and 2.1 GiB/s write rates, along with 202.4K and 140.8K IOPS, respectively. These figures are competitive with more capable drives, such as the SK hynix Platinum P51 and Samsung 9100 Pro, in small-block reads, but the Micron starts to fall behind in larger transfers. At 128K, it managed 4.0 GiB/s read and 3.9 GiB/s write, which are well below the 5.9 to 6.0 GiB/s range seen on top-tier drives like the Kingston FURY Renegade G5 and SanDisk SN8100. Performance dropped further at the 1M block size, where the Micron capped out at 4.4 GiB/s read and 4.2 GiB/s write, approximately 2 GiB/s slower than the leading drives. IOPS similarly dropped, landing in the 4.3K to 4.5K range compared to over 6.5K on top performers.
Overall, the Micron 2600 showed decent responsiveness at smaller block sizes but lacked the throughput to compete at scale. For workloads involving large AI datasets or real-time streaming to GPU memory, this performance places it in a functional but not optimal tier, suited more for moderate inference tasks rather than heavy training or high-throughput pipelines.
| GDSIO Chart (16K,128K,1M Block Size Averages) | (16K Block Size 128 IO Depth) Average Read | (16K Block Size 128 IO Depth) Average Write | (128K Block Size 128 IO Depth) Average Read | (128K Block Size 128 IO Depth) Average Write | (1M Block Size 128 IO Depth) Average Read | (1M Block Size 128 IO Depth) Average Write |
| Kingston FURY Renegade G5 | 3.7 GiB/s (0.526ms) IOPS: 242.1K | 2.4 GiB/s (0.824ms) IOPS: 154.7K | 5.9 GiB/s (2.704ms) IOPS: 48.5K | 5.8 GiB/s (0.564ms) IOPS: 47.3K | 6.5 GiB/s (19.356ms) IOPS: 6.6K | 6.3 GiB/s (19.690ms) IOPS: 6.5K |
| Lexar Professional NM1090 PRO | 3.6 GiB/s (0.533ms) IOPS: 238.7K | 2.3 GiB/s (0.845ms) IOPS: 150.8K | 5.9 GiB/s (2.639ms) IOPS: 48.4K | 4.2 GiB/s (3.714ms) IOPS: 34.4K | 6.5 GiB/s (19.274ms) IOPS: 6.6K | 6.2 GiB/s (20.127ms) IOPS: 6.4K |
| SanDisk SN8100 | 3.4 GiB/s (0.564ms) IOPS: 225.9K | 2.1 GiB/s (0.907ms) IOPS: 140.6K | 5.9 GiB/s (2.626ms) IOPS: 48.7K | 5.8 GiB/s (2.668ms) IOPS: 47.9K | 6.5 GiB/s (19.264ms) IOPS: 6.6K | 5.9 GiB/s (21.063ms) IOPS: 6.1K |
| Samsung 9100 Pro 4TB | 3.4 GiB/s (0.565ms) IOPS: 226.4K | 2.3 GiB/s (0.839ms) IOPS: 161.7K | 5.2 GiB/s (3.001ms) IOPS: 44.9K | 5.9 GiB/s (2.662ms) IOPS: 47.3K | 6.3 GiB/s (19.877ms) IOPS: 6.4K | 6.1 GiB/s (20.579ms) IOPS: 6.2K |
| Crucial T705 2TB | 3.3 GiB/s (0.587ms) IOPS: 217.0K | 2.3 GiB/s (0.836ms) IOPS: 152.6K | 5.5 GiB/s (2.863ms) IOPS: 44.7K | 5.6 GiB/s (2.799ms) IOPS: 45.7K | 6.0 GiB/s (20.738ms) IOPS: 6.2K | 6.0 GiB/s (20.855ms) IOPS: 6.1K |
| SK hynix Platinum P51 | 3.1 GiB/s (0.634ms) IOPS: 200.9K | 1.5 GiB/s (1.314ms) IOPS: 97.2K | 5.6 GiB/s (2.781ms) IOPS: 46.0K | 3.9 GiB/s (4.014ms) IOPS: 31.9K | 6.2 GiB/s (20.126ms) IOPS: 6.4K | 4.2 GiB/s (29.576ms) IOPS: 4.3K |
| Crucial P310 2TB | 3.1 GiB/s (0.627ms) IOPS: 203.2K | 2.2 GiB/s (0.902ms) IOPS: 141.4K | 4.1 GiB/s (3.845ms) IOPS: 33.3K | 3.9 GiB/s (3.992ms) IOPS: 32.0K | 4.4 GiB/s (28.462ms) IOPS: 4.5K | 4.1 GiB/s (30.964ms) IOPS: 4.2K |
| Micron 2600 2TB | 3.1 GiB/s (0.629ms) IOPS: 202.4K | 2.1 GiB/s (0.906ms) IOPS: 140.8K | 4.0 GiB/s (3.889ms) IOPS: 32.9K | 3.9 GiB/s (3.960ms) IOPS: 32.3K | 4.4 GiB/s (28.535ms) IOPS: 4.5K | 4.2 GiB/s (30.053ms) IOPS: 4.3K |
| Samsung 990 Pro 2TB | 2.7 GiB/s (0.731ms) IOPS: 174.4K | 2.2 GiB/s (0.903ms) IOPS: 141.2K | 4.0 GiB/s (3.944ms) IOPS: 32.4K | 4.1 GiB/s (3.849ms) IOPS: 33.2K | 3.9 GiB/s (32.415ms) IOPS: 3.9K | 4.2 GiB/s (29.520ms) IOPS: 4.3K |
| PNY CS2150 | 2.5 GiB/s (0.779ms) IOPS: 163.5K | 1.8 GiB/s 1.107ms) IOPS: 115.3K | 4.5 GiB/s (3.473ms) IOPS: 36.8K | 4.7 GiB/s (3.357ms) IOPS: 38.1K | 4.6 GiB/s (27.157ms) IOPS: 174.4K | 4.9 GiB/s (25.682ms) IOPS: 5.0K |
| Crucial P510 | 2.3 GiB/s (0.837ms) IOPS: 152.2K | 2.3 GiB/s (0.842ms) IOPS: 151.5K | 4.5 GiB/s (3.450ms) IOPS: 37.1K | 4.8 GiB/s (3.262ms) IOPS: 39.2K | 4.8 GiB/s (26.218ms) IOPS: 4.9K | 5.0 GiB/s (25.121ms) IOPS: 5.1K |
| WD SN850X | 2.3 GiB/s (0.736ms) IOPS: 173.2K | 2.0 GiB/s (0.989ms) IOPS: 129.0K | 4.1 GiB/s (3.878ms) IOPS: 33.3K | 4.0 GiB/s (3.958ms) IOPS: 33.0K | 4.4 GiB/s (30.501ms) IOPS: 4.5K | 4.1 GiB/s (30.782ms) IOPS: 4.2K |
| TEAMGROUP GE PRO 2TB | 0.8 GiB/s (2.464ms) IOPS: 51.8K | 1.0 GiB/s (1.913ms) IOPS: 68.8K | 2.8 GiB/s (5.627ms) IOPS: 22.7K | 2.1 GiB/s (7.309ms) IOPS: 17.5K | 4.2 GiB/s (29.599ms) IOPS: 4.3K | 2.7 GiB/s (49.915ms) IOPS: 2.7K |
| TEAMGROUP GC PRO 2TB | 0.8 GiB/s (2.589ms) IOPS: 49.3K | 1.0 GiB/s (1.899ms) IOPS: 67.3K | 2.7 GiB/s (5.860ms) IOPS: 21.8K | 2.4 GiB/s (6.636ms) IOPS: 19.3K | 3.7 GiB/s (34.007ms) IOPS: 3.8K | 3.7 GiB/s (33.414ms) IOPS: 3.8K |
Conclusion
The Micron 2600 series SSDs present a solid value-focused option for OEMs and system builders looking to balance cost and mainstream performance. Leveraging Micron’s latest 9th generation QLC NAND and Adaptive Write Technology, it stands out among QLC drives by maintaining better sustained write speeds and responsiveness under load.
However, when compared to TLC SSDs, the performance gap becomes clear. Across synthetic, real-world, and AI-centric benchmarks, the 2600 falls behind the crop of previous-generation Gen4 TLC SSDs and newer Gen5 models, such as the Crucial T705, Kingston FURY Renegade G5, and SanDisk SN8100. These TLC-based models deliver superior throughput, lower latency, and faster application load times, making them more suitable for enthusiast and workstation workloads. For situations that need that extra performance, Micron has those areas covered with the high-performance 4600. For areas that don’t require added performance but instead need a reliable, cost-effective solution, the Micron 2600 is there to meet those needs.


 Amazon