

Samsung’s new 990 SSD joins the consumer lineup as a mainstream PCIe Gen4 drive that prioritizes efficiency and value over raw speed. Samsung calls it its most power-efficient SSD to date, claiming up to 38% better power efficiency than the 990 PRO. The 2TB model is rated at 7,250MB/s sequential read and 6,450MB/s write, with random I/O up to 850K IOPS read and 1,200K IOPS write. The 1TB model steps down slightly to 7,150MB/s sequential read, 700K IOPS random read, and 1,100K IOPS random write. The drive ships in 1TB and 2TB capacities at MSRPs of $269.99 and $529.99, respectively.
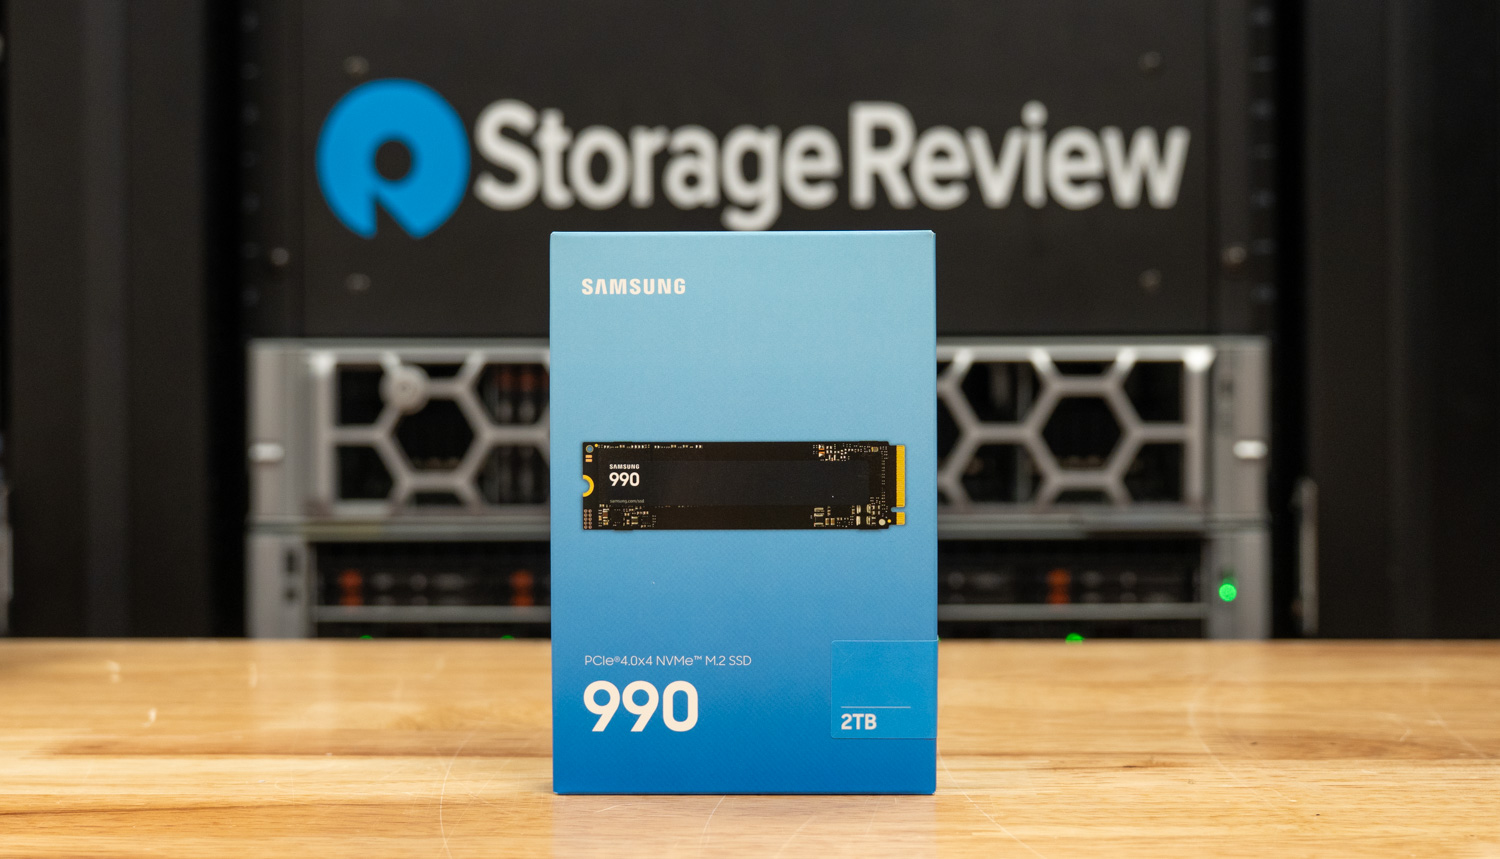
The name deserves a modest explanation. Samsung’s 990 family already includes the 990 PRO, 990 EVO, and 990 EVO Plus. The plain “990” now sits alongside them as an entry SSD rather than starting a new generation. It pairs a Samsung in-house controller with V-NAND (more on that later) in a DRAM-less design that relies on a Host Memory Buffer. It carries a three-year warranty, compared to the PRO’s five-year warranty, and is rated for 400TB and 800TB of writes at 1TB and 2TB capacities. Sequential read matches the 990 EVO Plus at 7,250MB/s but trails the 990 PRO’s 7,450MB/s. The 850K IOPS random read rating is well under the PRO’s 1,400K. Samsung’s pitch centers on two numbers: sequential writes are over 50% faster than the 990 EVO, and a 38% efficiency gain; 1,686MB/s per watt on 2TB reads versus 1,221MB/s per watt for the 990 PRO in Samsung’s internal testing. Buyers who prioritize outright speed already have Samsung’s Gen5 9100 PRO family, which we reviewed at launch and again in its 8TB capacity, so the 990 is not meant to compete directly with those drives.
Samsung has been down this road before. The 980, its first DRAM-less consumer NVMe drive, came through our lab in 2021 and left a poor impression. The smaller capacities, in particular, landed at the bottom of our charts, and the drive was relentlessly mocked around the lab. But the market has shifted dramatically since then. The AI buildout is soaking up NAND and DRAM supply, component pricing is climbing, and consumers are feeling the pinch across the board. In that environment, a Gen4 drive that offers solid sequential speed, low power draw, and decent capacity starts to look like a sensible choice, provided the street price cooperates.
One spec Samsung refused to provide is the NAND itself. The reviewer’s guide lists only “Samsung V-NAND.” When we asked directly, the company said it cannot disclose component details beyond official specifications, pointing us back to rated performance and its “latest Samsung V-NAND technology.” So we are left to read between the lines, which point to TLC rather than QLC. The endurance spec is the giveaway: 400TB and 800TB over a three-year warranty works out to roughly 133TB and 267TB of writes per year, essentially the same annual allowance as the 990 PRO’s 600TB and 1,200TB across five years. The likeliest answer is a lower-bin Samsung TLC V-NAND in this drive or a lower-cost, shorter-warranty option to make the drive more affordable. It’s odd that they’re being intentionally coy on what’s typically a foundational specification.
Our review unit is the 2TB model (MZ-V9V2T0), a pre-production sample running firmware 0B2QLXL7, which we put through fio, GDS, and AI model-load testing detailed below.
Samsung 990 SSD Specifications
| Specification | Samsung 990 1TB | Samsung 990 2TB |
|---|---|---|
| Platform Overview | ||
| Interface | PCIe 4.0 x4, NVMe 2.0 (backward compatible with PCIe 3.0) | |
| Form Factor | M.2 2280 Max 80.15 x 22.15 x 2.38 (mm) |
|
| Controller | Samsung in-house controller | |
| NAND | Samsung V-NAND | |
| Cache Memory | HMB (Host Memory Buffer), DRAM-less | |
| Model Code | MZ-V9V1T0 | MZ-V9V2T0 |
| Performance | ||
| Sequential Read | Up to 7,150MB/s | Up to 7,250MB/s |
| Sequential Write | Up to 6,450MB/s | Up to 6,450MB/s |
| Random Read | Up to 700K IOPS | Up to 850K IOPS |
| Random Write | Up to 1,100K IOPS | Up to 1,200K IOPS |
| Power and Endurance | ||
| Active Power (Avg. Read) | 4.0W | 4.3W |
| Active Power (Avg. Write) | 3.7W | 3.8W |
| Idle Power (Typical) | 55mW PS3 (APST on) 3mW PS4 (L1.2) |
|
| Endurance (TBW) | 400TB | 800TB |
| MTBF | 1.5 million hours | |
| Warranty | 3 years limited | |
| Features | ||
| Supporting Features | TRIM (OS support required) Garbage Collection S.M.A.R.T. |
|
| Data Security | AES 256-bit Full Disk Encryption TCG/Opal V2.0 Encrypted Drive (IEEE1667) |
|
| Software | Samsung Magician 9.0 | |
| MSRP | $269.99 | $529.99 |
Samsung 990 SSD Design and Build
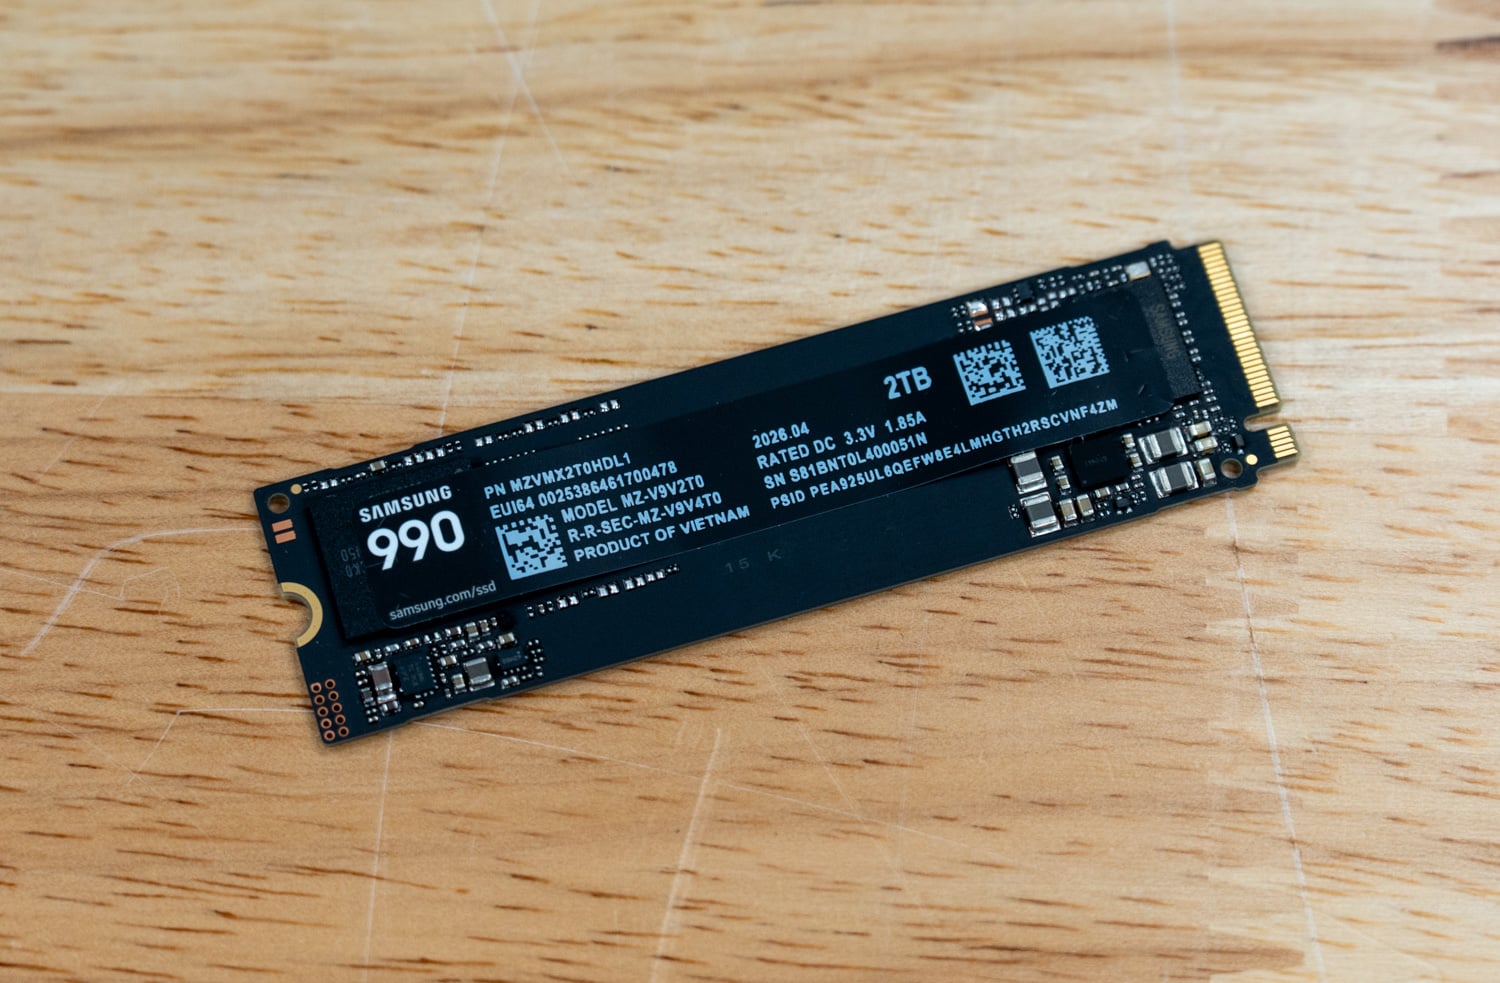
The Samsung 990 uses the familiar M.2 2280 form factor, measuring up to 80.15 x 22.15 x 2.38mm. It has a single-sided design and launches without a dedicated heatsink option. This makes it a good physical fit for notebooks, compact PCs, and desktop motherboards with their own M.2 cooling. The overall construction is simple, with Samsung keeping the controller, NAND, and supporting circuitry on one side of the PCB.
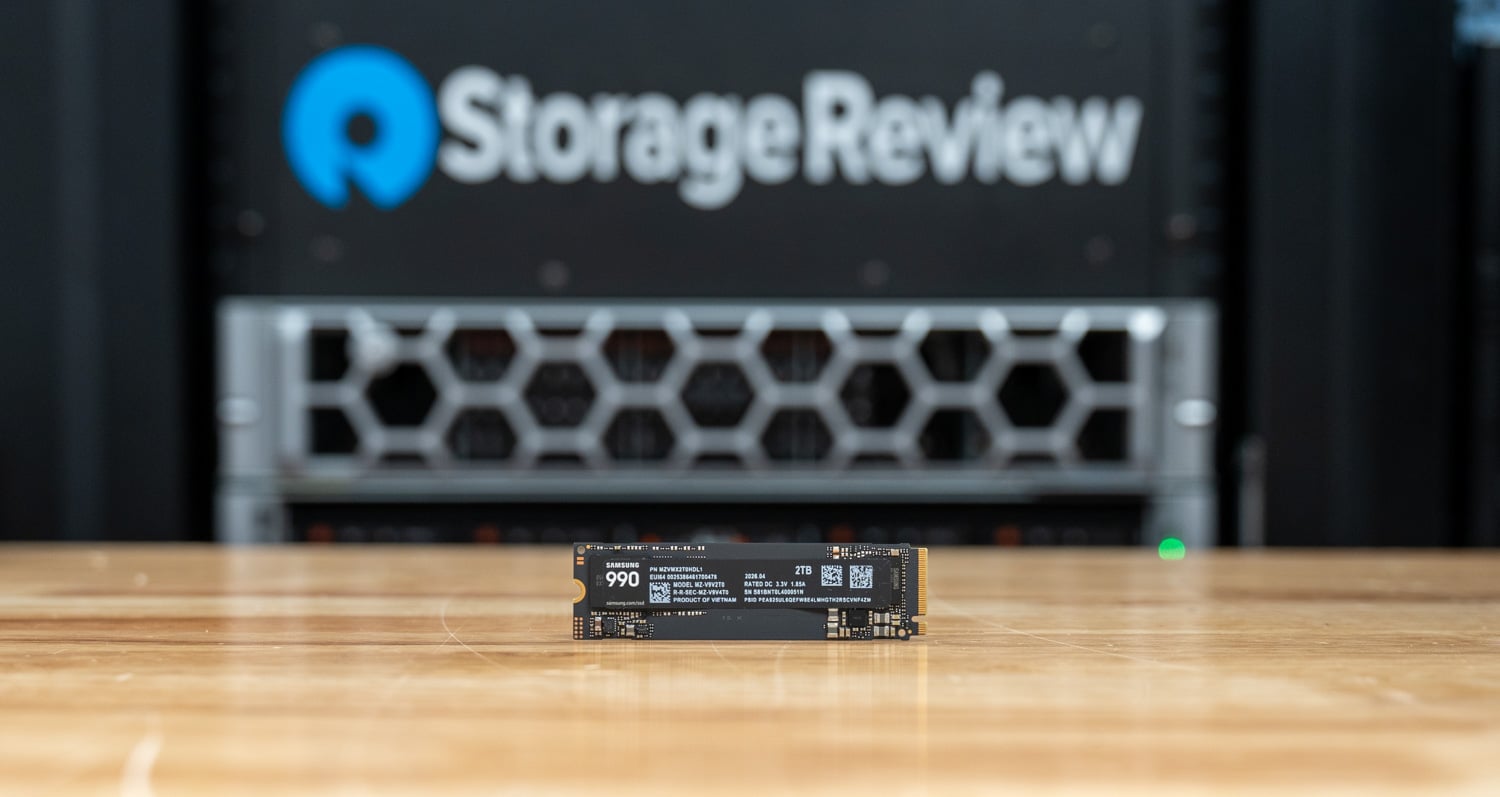
The front label displays the Samsung 990 branding, 2TB capacity, model number, firmware, and electrical specifications. There is no integrated heat spreader, so cooling relies on system airflow and an M.2 heatsink you provide.
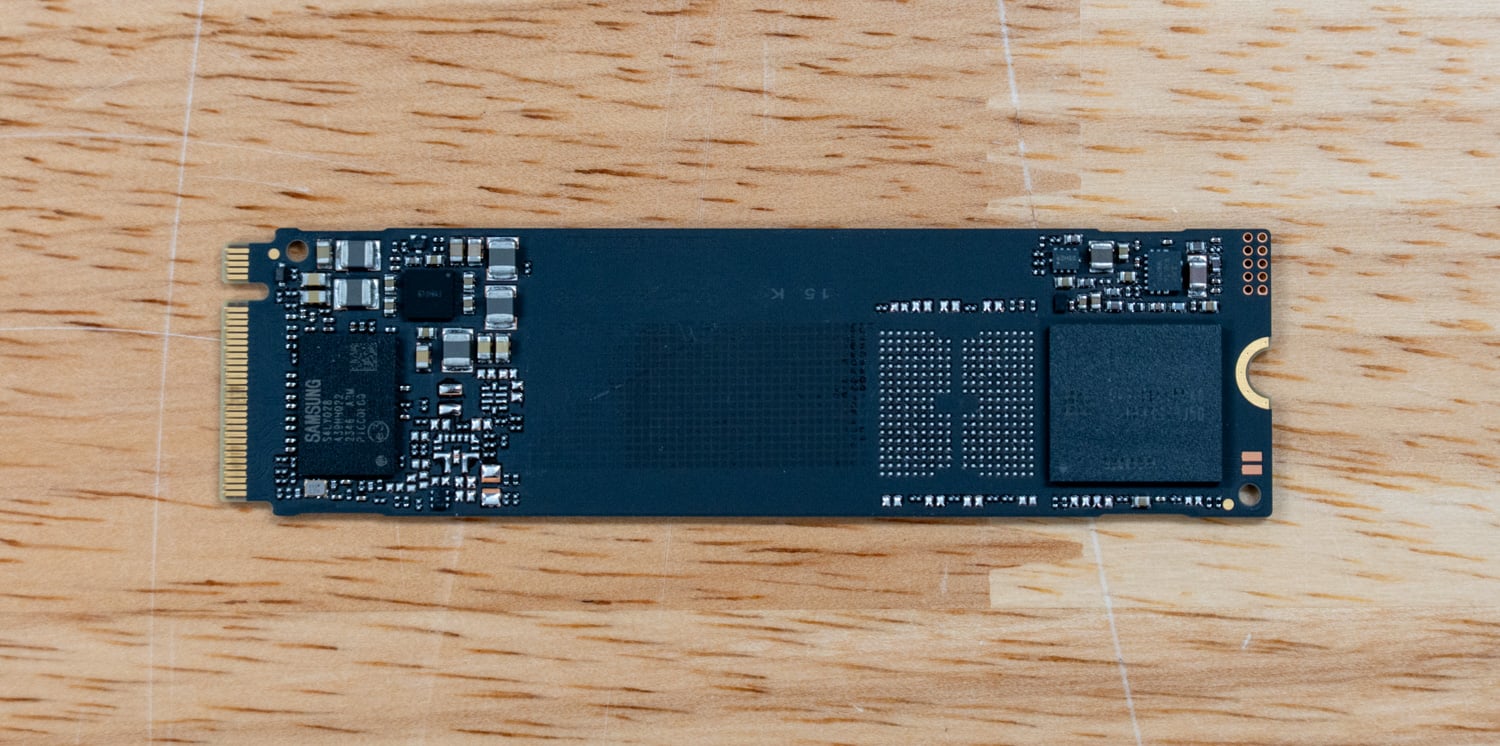
With the label removed, you can see Samsung’s in-house controller sitting close to the M.2 connector, with the power components packed around it. The NAND sits at the other end of the board, leaving quite a bit of unused space in the middle. Since this is a DRAM-less drive, there is no separate DRAM chip on the PCB.
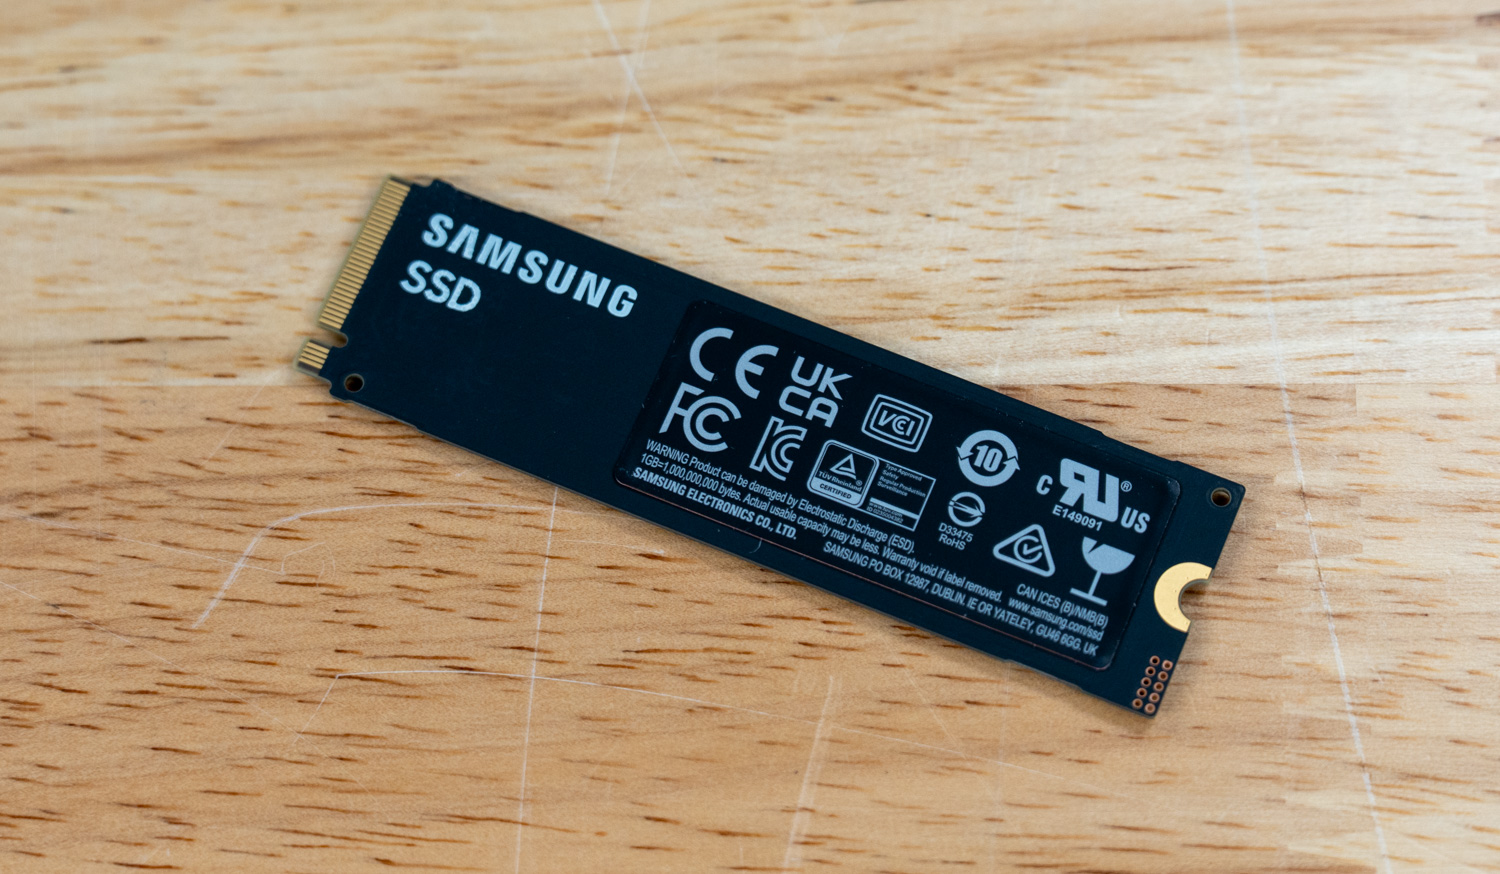
The back of the drive is mostly taken up by the regulatory label, with no active components underneath. Again, because the 990 uses a single-sided layout, it should be easier to fit in thin laptops and compact systems where space around the M.2 slot can be tight.
On the software side, the 990 is managed through Samsung Magician 9.0, which covers the essentials: firmware updates, drive health and S.M.A.R.T. monitoring, diagnostic scans, benchmarking, and secure erase, along with setup for the drive’s AES 256-bit encryption features. There’s nothing 990-specific to configure, since the HMB arrangement requires no user tuning. It’s worth installing at first boot to keep the firmware up to date, and Magician is generally a very capable tool that adds value.
Samsung 990 Performance
Peak Synthetic Performance
The FIO test is a flexible and powerful benchmarking tool for measuring the performance of storage devices, including SSDs and HDDs. It evaluates metrics such as bandwidth, IOPS, and latency under different workloads, like sequential and random read/write operations. This test helps to assess the peak performance of storage systems, making it useful for comparing different devices or configurations. We measured the peak burst performance for this test, limiting the workload to a 10GB footprint on both SSDs.
Peak Synthetic Performance: The Samsung 990 delivered 7,177 MB/s sequential read, 6,070 MB/s sequential write, 872K random read IOPS, and 1.08M random write IOPS, placing it near the bottom of this PCIe Gen4/Gen5 comparison group. Compared to the Samsung 990 Pro, the 990 trailed by about 4% in sequential read, but fell 15.7% behind in sequential write, 37.7% behind in random read IOPS, and 23.0% behind in random write IOPS. Against the fastest Gen5 drive, the SanDisk SN8100, the gap widened considerably, with the 990 delivering roughly 52% lower sequential read throughput, 57% lower sequential write throughput, 62% lower random read performance, and 50% lower random write performance.
| FIO Test (higher MB/s/IOPS is better) | Sequential 128K Read (1T/64Q) | Sequential 128K Write (1T/64Q) | Random 4K Read (16T/32Q) | Random 4K Write (16T/32Q) |
|---|---|---|---|---|
| SanDisk SN8100 | 15,000MB/s (0.56ms avg latency) | 14,100MB/s (0.59ms avg latency) | 2.312M IOPS (0.22ms avg latency) | 2.144M IOPS (0.24ms avg latency) |
| Kingston FURY Renegade G5 | 14,600MB/s (0.57ms avg latency) | 14,100MB/s (0.59ms avg latency) | 2.028M IOPS (0.25ms avg latency) | 2.028M IOPS (0.25ms avg latency) |
| Samsung 9100 Pro | 14,600MB/s (0.57ms avg latency) | 13,300MB/s (0.63ms avg latency) | 2.734M IOPS (0.18ms avg latency) | 2.734M IOPS (0.19ms avg latency) |
| SK hynix Platinum P51 | 14,500MB/s (0.58ms avg latency) | 13,500 MB/s (0.62ms avg latency) | 2.369M IOPS (0.22ms avg latency) | 2.669M IOPS (0.19ms avg latency) |
| Crucial T705 | 14,400MB/s (0.58ms avg latency) | 12,300MB/s (0.68ms avg latency) | 1.585M IOPS (0.32ms avg latency) | 2.703M IOPS (0.19ms avg latency) |
| TEAMGROUP GE Pro 2TB | 13,900MB/s (0.60ms avg latency) | 12,800MB/s (0.65ms avg latency) | 2.585M IOPS (0.23ms avg latency) | 1.818M IOPS (0.28ms avg latency) |
| Lexar Professional NM1090 PRO | 13,800MB/s (0.61ms avg latency) | 13,600MB/s (0.62ms avg latency) | 2.251M IOPS (0.23ms avg latency) | 1.818M IOPS (0.28ms avg latency) |
| TEAMGROUP GC Pro 2TB | 13,600MB/s (0.62ms avg latency) | 12,700MB/s (0.66ms avg latency) | 2.110M IOPS (0.24ms avg latency) | 1.686M IOPS (0.28ms avg latency) |
| PNY CS2150 | 10,400MB/s (0.80ms avg latency) | 8,801MB/s (0.95ms avg latency) | 1.379M IOPS (0.371ms avg latency) | 1.623M IOPS (0.32ms avg latency) |
| Corsair MP700 MICRO 4TB | 9,169MB/s (0.91ms avg latency) | 7,948MB/s (1.06ms avg latency) | 1.277M IOPS (0.40ms avg latency) | 1.540M IOPS (0.33ms avg latency) |
| Crucial P510 | 8,835MB/s (0.90 ms avg latency) | 9,961MB/s (0.80 ms avg latency) | 1.163M IOPS (0.44ms avg latency) | 1.196M IOPS (0.51ms avg latency) |
| Micron 3610 2TB | 6,839MB/s (1.23ms avg latency) | 9,673MB/s (0.87ms avg latency) | 1.523M IOPS (0.34ms avg latency) | 1.871M IOPS (0.27ms avg latency) |
| Samsung 990 Pro | 7,483MB/s (1.12ms avg latency) | 7,197MB/s (1.16ms avg latency) | 1.400M IOPS (0.36ms avg latency) | 1.403M IOPS (0.36ms avg latency) |
| Crucial P310 2TB | 7,197MB/s (1.16ms avg latency) | 6,376MB/s (1.31ms avg latency) | 1.163M IOPS (0.44ms avg latency) | 1.196M IOPS (0.43ms avg latency) |
| Samsung 990 2TB | 7,177MB/s (1.17ms avg latency) | 6,070MB/s (1.38ms avg latency) | 872K IOPS (0.59ms avg latency) | 1.08M IOPS (0.47ms avg latency) |
| WD SN850X 2TB | 6,632MB/s (0.76ms avg latency) | 7,235MB/s (0.92ms avg latency) | 1.2M IOPS (0.43ms avg latency) | 825K IOPS (0.62ms avg latency) |
| Micron 2600 2TB | 5,702MB/s (1.47ms avg latency) | 6,612MB/s (1.27ms avg latency) | 1.11M IOPS (0.46ms avg latency) | 1.36M IOPS (0.38ms avg latency) |
Average LLM Load Time
The Average LLM Load Time test evaluated the load times of three different LLMs: DeepSeek R1 7B, Meta Llama 3.2 11B, and DeepSeek R1 32B. Each model was tested 10 times, and the average load time was calculated. This test measures the drive’s ability to load large language models (LLMs) into memory quickly. LLM load times are critical for AI-related tasks, especially for real-time inference and processing large datasets. Faster loading enables the model to process data more quickly, thereby improving AI responsiveness and reducing wait times.
Average LLM Load Time: AI model loading was the Samsung 990’s weakest test, with the drive finishing at or near the bottom across all three workloads. It recorded 5.06 seconds for DeepSeek R1 7B, 7.61 seconds for Meta Llama 3.2 11B Vision, and 7.86 seconds for DeepSeek R1 32B. Compared to the fastest drive, the SK hynix Platinum P51, the Samsung 990 took approximately 99% longer to load the 7B model, 112% longer to load the 11B Vision model, and 88% longer to load the 32B model. The more interesting result is the Samsung 990 Pro, which lands at the bottom of these charts right alongside its value sibling: the 990 edged out the Pro by about 1% on the 7B load and trailed it by 15% on the 11B Vision model and 8% on the 32B model. Whatever Samsung’s Gen4 drives give up in this workload, they give it up together, so stepping up to the Pro buys little for AI model loading.
| Average LLM Load Time (lower is better) | DeepSeek R1 7B | Meta Llama 3.2 11B Vision | DeepSeek R1 32B |
|---|---|---|---|
| SK hynix Platinum P51 | 2.5481s | 3.5809s | 4.1790s |
| SanDisk SN8100 | 2.5702s | 3.5856s | 4.2870s |
| Samsung 9100 Pro 4TB | 2.6173s | 3.6017s | 4.3735s |
| PNY CS2150 | 2.8107s | 3.6820s | 4.8962s |
| Crucial T705 2TB | 2.8758s | 3.6312s | 5.1080s |
| Crucial P510 1TB | 2.8817s | 3.6631s | 5.0594s |
| TEAMGROUP GE Pro 2TB | 2.9092s | 3.9136s | 4.8974s |
| TEAMGROUP GC Pro 2TB | 2.9379s | 3.9267s | 4.8188s |
| WD SN850X 2TB | 3.0082s | 3.6543s | 5.4844s |
| Kingston FURY Renegade G5 | 3.1843s | 4.8009s | 4.6523s |
| Crucial P310 2TB | 3.1889s | 3.7083s | 5.4844s |
| Lexar Professional NM1090 PRO | 3.2135s | 4.9504s | 7.2108s |
| Micron 2600 2TB | 3.3178s | 3.9174s | 5.9060s |
| Corsair MP700 MICRO 4TB | 3.4694s | 5.2106s | 5.3990s |
| Micron 3610 2TB | 3.5348s | 5.3853s | 5.5731s |
| Samsung 990 2TB | 5.0645s | 7.6087s | 7.8619s |
| Samsung 990 Pro 2TB | 5.1255s | 6.6051s | 7.3021s |
One of the tests conducted on this testbench was the Magnum IO GPU Direct Storage (GDS) test. GDS is a feature developed by NVIDIA that allows GPUs to bypass the CPU when accessing data stored on NVMe drives or other high-speed storage devices. Instead of routing data through the CPU and system memory, GDS enables direct communication between the GPU and the storage device, significantly reducing latency and improving data throughput.
How GPU Direct Storage Works
Traditionally, when a GPU processes data stored on an NVMe drive, the data must first travel through the CPU and system memory before reaching the GPU. This process introduces bottlenecks because the CPU acts as a middleman, adding latency and consuming valuable system resources. GPU Direct Storage eliminates this inefficiency by enabling the GPU to access data directly from the storage device via the PCIe bus. This direct path reduces data-movement overhead, enabling faster, more efficient data transfers.
AI workloads, especially those involving deep learning, are highly data-intensive. Training large neural networks requires processing terabytes of data, and any delay in data transfer can lead to underutilized GPUs and longer training times. GPU Direct Storage addresses this challenge by ensuring that data is delivered to the GPU as quickly as possible, minimizing idle time and maximizing computational efficiency.
In addition, GDS is particularly beneficial for workloads that involve streaming large datasets, such as video processing, natural language processing, or real-time inference. By reducing the reliance on the CPU, GDS accelerates data movement and frees up CPU resources for other tasks, further enhancing overall system performance.
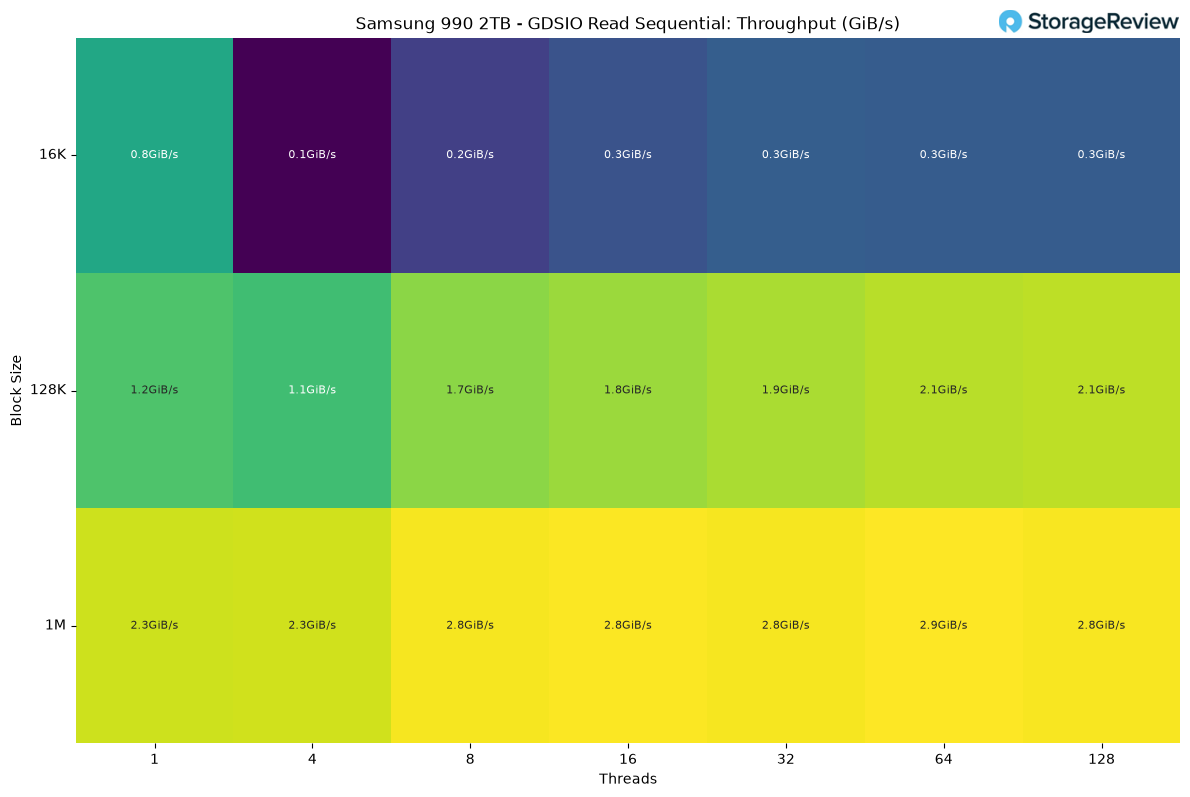
Throughput on the read side climbed steadily as thread count increased. At the 1M block size, the Samsung 990 started at 2.27 GiB/s on a single thread and peaked at 2.89 GiB/s with 64 threads, then settled to 2.79 GiB/s at 128 threads. The 128K block size followed a similar curve, increasing from 1.21 GiB/s at 1 thread to 2.12 GiB/s at 128 threads, roughly a 75% gain. The 16K block size behaved differently. It peaked at a single thread (0.82 GiB/s), dropped sharply once concurrency was introduced, and plateaued around 0.3 GiB/s from 8 threads onward. This pattern is consistent with small block I/O saturating on per-operation overhead rather than raw bandwidth.
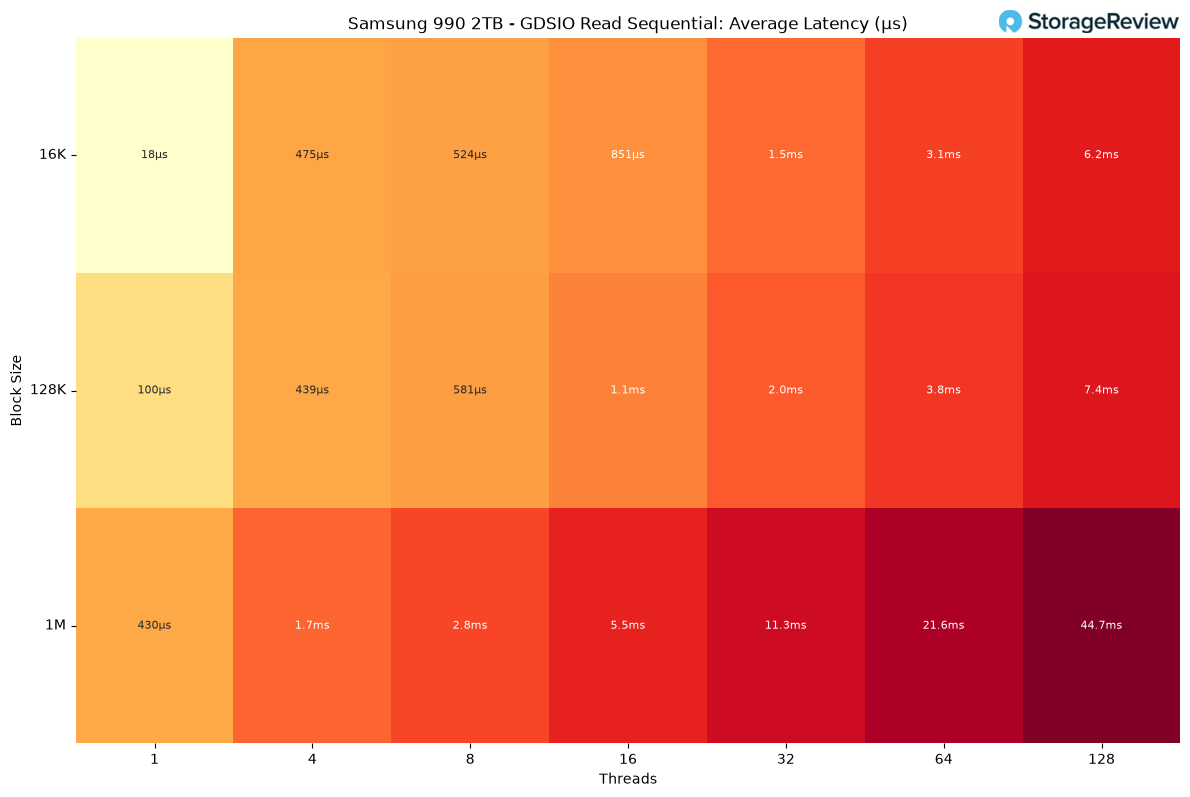
Latency scaled as expected, rising with thread count. At 1M, average latency grew from 430 microseconds on one thread to 44.7 milliseconds on 128 threads, roughly a 100x increase, reflecting increased queue depth due to more concurrent GPUDirect Storage threads. The 128K and 16K block sizes showed the same upward trend, reaching 7.4 milliseconds and 6.2 milliseconds, respectively, at 128 threads. Notably, 16K had the lowest single-thread latency of the three (18 microseconds), reflecting its smaller per-operation payload, even though its overall throughput ceiling was the lowest.
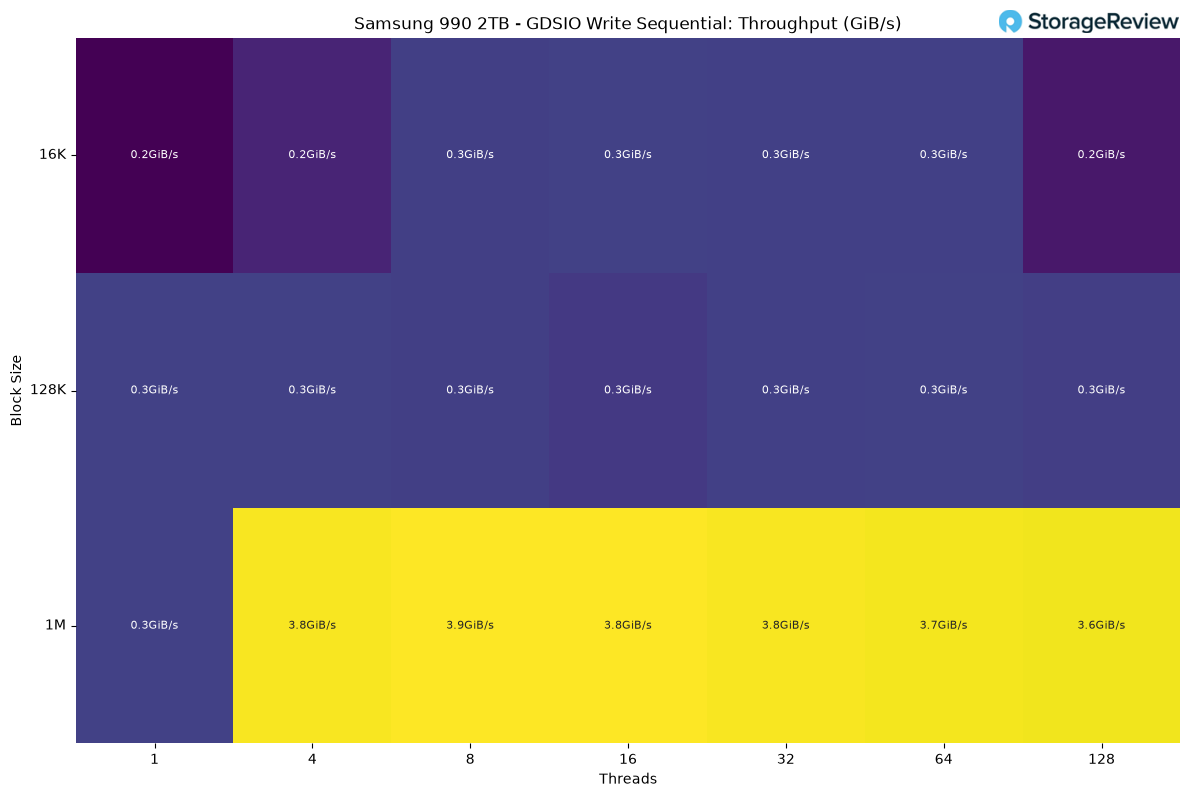
Write throughput varied by block size. The 1M block size stood out, jumping from 0.32 GiB/s at a single thread to 3.89 GiB/s at 8 threads, its peak, before tapering slightly to 3.63 GiB/s at 128 threads as queueing overhead increased. The 128K and 16K block sizes remained flat across the thread range, hovering near 0.3 GiB/s regardless of concurrency. This suggests the write path is limited by per-I/O overhead or controller queuing rather than bandwidth at those sizes.
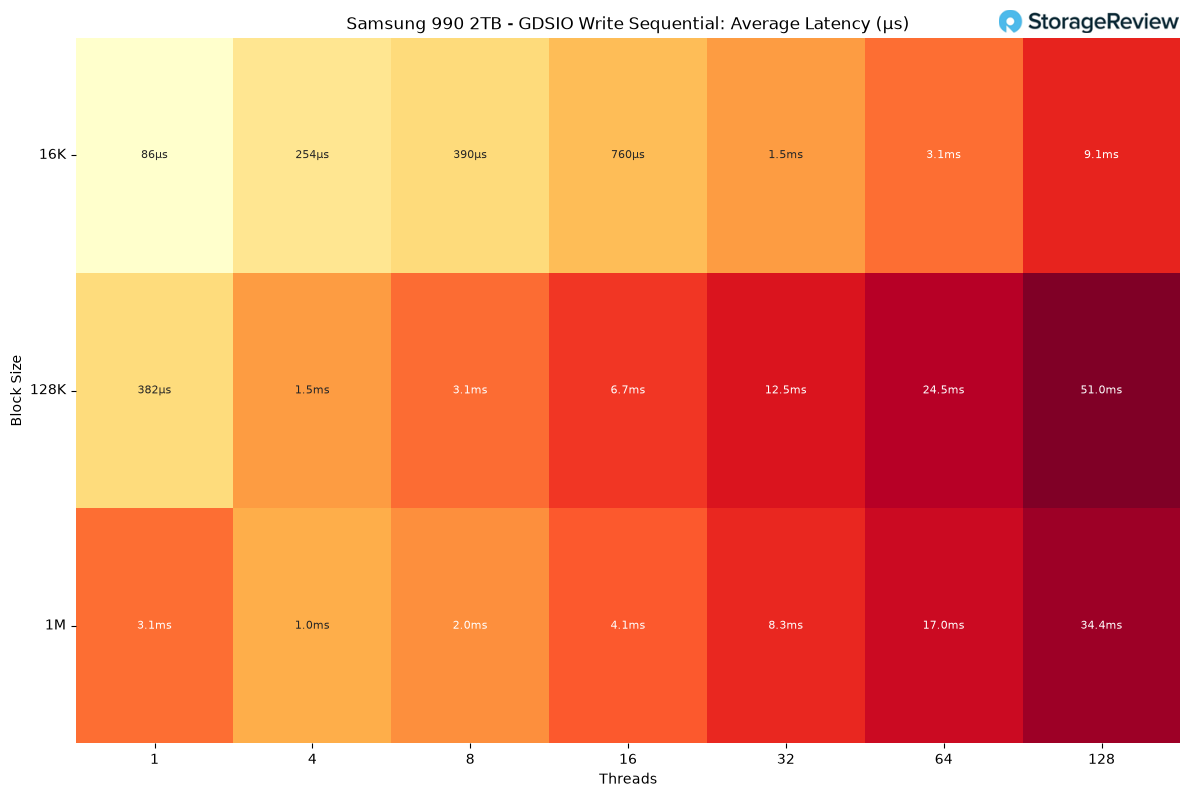
Latency on writes rose more steeply than on reads, particularly at 128K, which climbed from 382 microseconds at one thread to 51.0 milliseconds at 128 threads, the highest figure recorded across either write or read testing. The 1M block size showed an unusual dip, with latency dropping from 3.06 milliseconds on one thread to 1.03 milliseconds on four threads, likely because the single-thread run was not yet saturating the write path, then climbing steadily to 34.4 milliseconds on 128 threads. The 16K block size stayed the most consistent, closing the sweep at 9.1 milliseconds, the lowest ceiling of the three block sizes.
Conclusion
The Samsung 990 isn’t chasing the top of the charts, and the numbers make that clear. It trailed the 990 Pro across every FIO test we ran, from a 4% gap in sequential read to a 38% deficit in random read IOPS, and fell well behind the fastest Gen4 and Gen5 drives in this comparison group. AI model loading tells a similar story, with the 990 and 990 Pro finishing at the bottom of the field together; the 990 actually edged its Pro sibling on the DeepSeek R1 7B load while trailing by 8 to 15% on the larger models. Buyers who need peak throughput for demanding workloads should look elsewhere in Samsung’s lineup, starting with the Gen5 9100 Pro.
That said, judging the 990 against the fastest drives on the market misses the point of the drive. This is a mainstream Gen4 SSD built around efficiency and value, not benchmark supremacy, and compared to its real predecessor, the 990 EVO, it’s a solid upgrade. Sequential writes are more than 50% faster, power efficiency is up 38% by Samsung’s own numbers, and the drive still delivers sequential read speeds in line with the 990 EVO Plus. Samsung chose to stay quiet on the NAND itself, but the endurance ratings suggest a competent TLC implementation rather than a QLC design.
For buyers who don’t need Gen5 speeds or Pro-tier random I/O, and who want a dependable, power-efficient Gen4 drive at a workable price, the 990 is a sensible upgrade path from the EVO line. Notably, stepping up to the 990 Pro buys nothing for AI model loading, so the choice between the two comes down to random I/O and sustained writes rather than anything AI-related. At $269.99 for 1TB and $529.99 for 2TB, the MSRPs reflect the current memory market more than the drive’s entry positioning, so the 990’s value case will ultimately be set by street prices. It’s not the drive to buy if raw performance is the priority, but it does what it’s meant to do.


 Amazon