

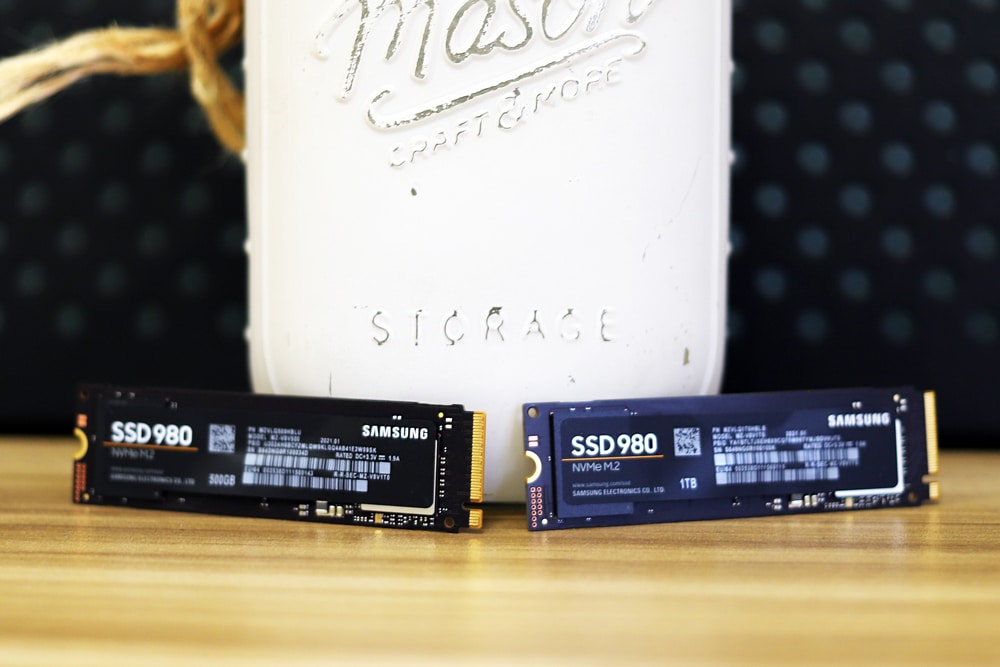
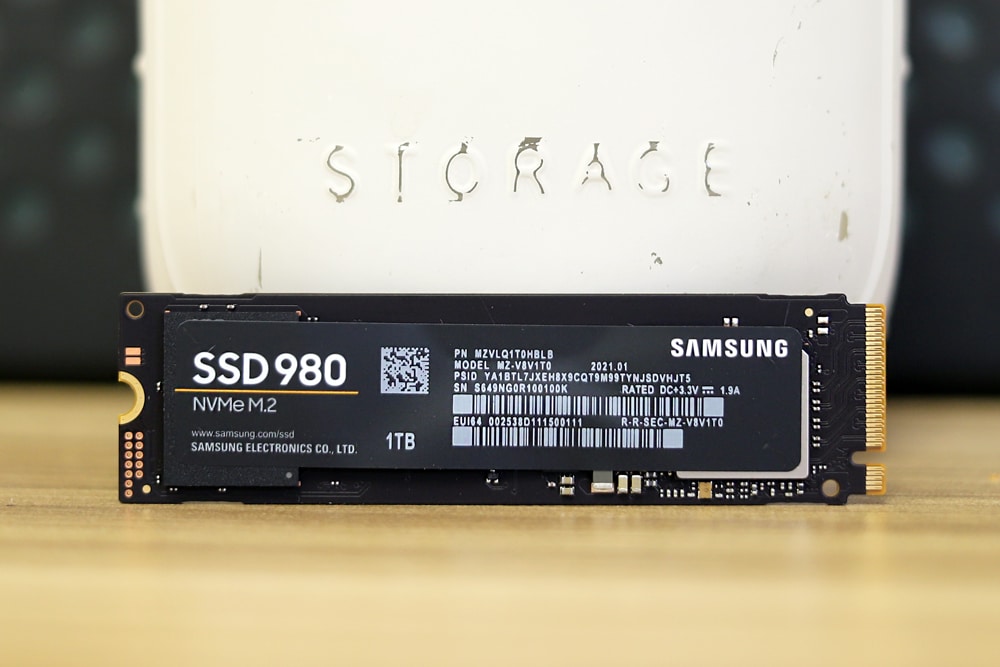
Today Samsung released yet another client drive with the Samsung SSD 980. While the name can be a bit confusing as the company typically releases both a PRO and an EVO version of a drive and currently have a 980 PRO. The new 980, sans any follow-up name, is the company’s first DRAM-less client SSD.
An SSD without DRAM sounds like a recipe for slow storage, as is typically the case. This is fine if a potential buyer is looking for a cost-effective drive and not really worried about performance. However, Samsung tends to dominate in the performance departments of SSDs and the Samsung is taking steps to ensure that the 980 is no exception.
Even though the drive lacks DRAM, it still comes with quoted speeds up to 3.5GB/s read and throughput of half a million IOPS. This is achieved by utilizing Host Memory Buffer technology to link directly to the host processor’s DRAM. Combine this with the company’s sixth-generation V-NAND, TurboWrite 2.0, and this is slated to make the drive perform much better than the regular DRAM-less SSD.
While the drive is aimed at every day, general use PC users, gamers may find something to love here as well. Not only is the drive affordable, users leveraging Samsung Magician 6.3 can go into “Full Power Mode” allowing the 980 to continuously run at peak performance for uninterrupted play. Dynamic Thermal Guard technology along with the nickel-coated controller and heat spreader label keep the drive from overheating.
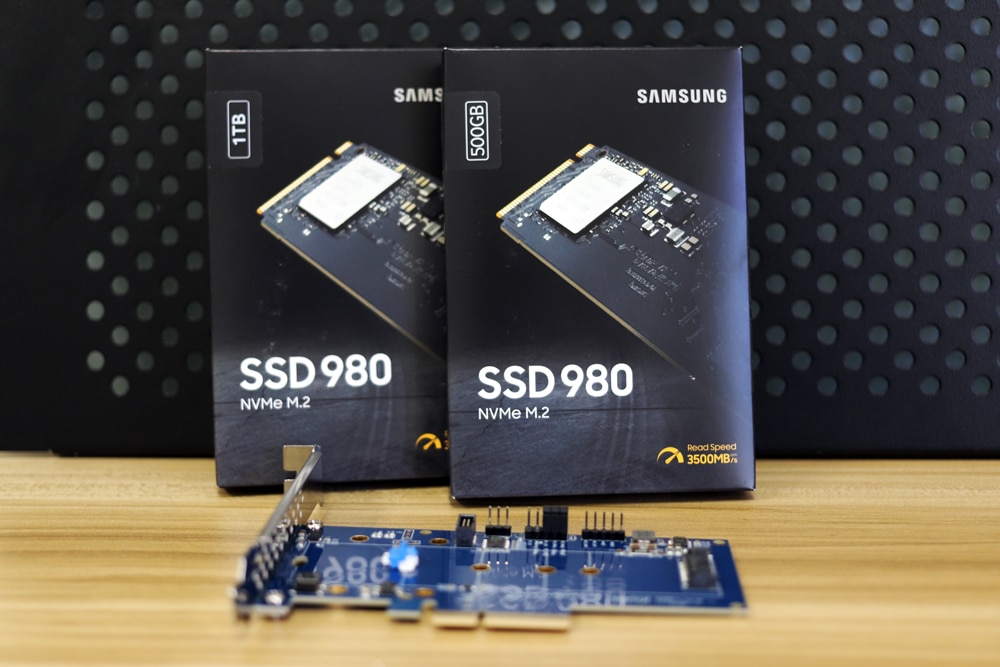
The Samsung SSD 980 comes with a five-year warranty, M.2 form factor, and an MSRP of $50 for the 250GB, $70 for the 500GB, and $130 for the 1TB. For our review, we are testing both 500GB and 1TB.
Samsung SSD 980 Specifications
| Usage Application | Client PCs | ||
| Interface | PCIe Gen 3.0 x4, NVMe 1.4 | ||
| Hardware Information | |||
| Capacity | 250GB | 500GB | 1TB |
| Controller | Samsung in-house Controller | ||
| NAND Flash Memory | Samsung V-NAND 3bit MLC | ||
| Dimension | Max 80.15 x Max 22.15 x Max 2.38 (mm) | ||
| Form Factor | M.2 (2280) | ||
| Performance (Up to.) | |||
| Sequential Read | 2,900 MB/s | 3,100 MB/s | 3,500 MB/s |
| Sequential Write | 1,300 MB/s | 2,600 MB/s | 3,000 MB/s |
| QD 1 Thread 1 | |||
| Ran. Read | 17K IOPS | 17K IOPS | 17K IOPS |
| Ran. Write | 53K IOPS | 54K IOPS | 54K IOPS |
| QD 32 Thread 16 | |||
| Ran. Read | 230K IOPS | 400K IOPS | 500K IOPS |
| Ran. Write | 320K IOPS | 470K IOPS | 480K IOPS |
| Power Consumption (Up to) | |||
| Idle (ASPT on) | 45mW | ||
| Active (Avg.) | |||
| Read | 3.7W | 4.3W | 4.5W |
| Write | 3.2 W | 4.2 W | 4.6 W |
| L1.2 mode | 5 mW | ||
| Reliability | |||
| Temp. | |||
| Operating | 0°C to 70°C | ||
| Non-Operating | -40°C to 85°C | ||
| Humidity | 5% to 95% non-condensing | ||
| Shock | Non-Operating | 1,500G(Gravity), duration: 0.5ms, 3 axis | |
| Vibration | Non-Operating | 20~2,000Hz, 20G | |
| MTBF | 1.5 million hours | ||
| Warranty | |||
| TBW | 150TB | 300TB | 600TB |
| Period | 5 years limited | ||
| Supporting Features | TRIM (Required OS support), Garbage Collection, S.M.A.R.T | ||
| Data Security | AES 256-bit Full Disk Encryption, TCG/Opal V2.0, Encrypted Drive (IEEE1667) | ||
Samsung SSD 980 Performance
Testbed
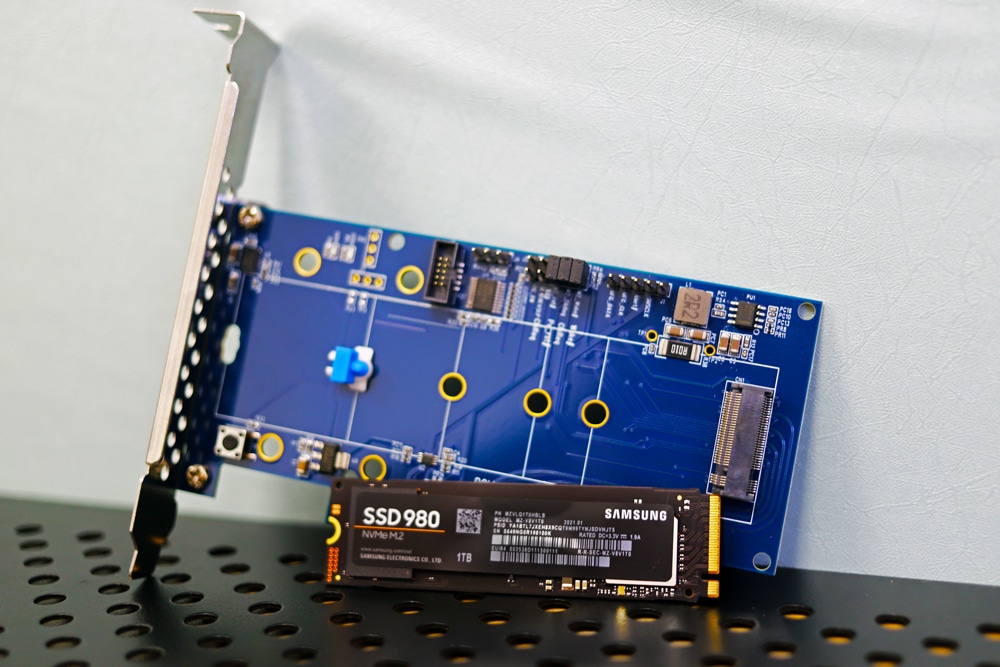
The test platform leveraged in these tests is a Dell PowerEdge R740xd server. We measure SATA performance through a Dell H730P RAID card inside this server, although we set the card in HBA mode only to disable the impact of the RAID card cache. NVMe is tested natively through an M.2 to PCIe adapter card. The methodology used better reflects end-user workflow with the consistency, scalability, and flexibility testing within virtualized server offers.
A large focus is put on drive latency across the entire load range of the drive, not just at the smallest QD1 (Queue-Depth 1) levels. We do this because many of the common consumer benchmarks don’t adequately capture end-user workload profiles.
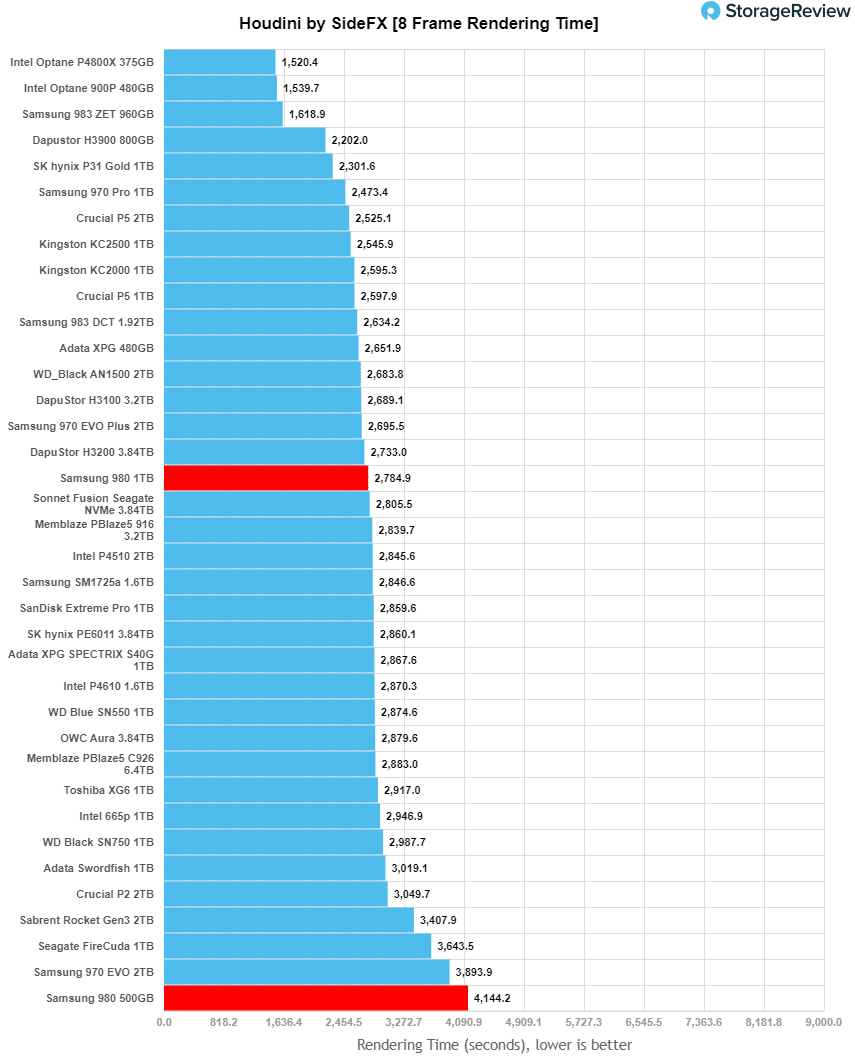
Houdini by SideFX
The Houdini test is specifically designed to evaluate storage performance as it relates to CGI rendering. The testbed for this application is a variant of the core Dell PowerEdge R740xd server type we use in the lab with dual Intel 6130 CPUs and 64GB DRAM. In this case, we installed Ubuntu Desktop (ubuntu-16.04.3-desktop-amd64) running bare metal. The output of the benchmark is measured in seconds to complete, with fewer being better.
The Maelstrom demo represents a section of the rendering pipeline that highlights the performance capabilities of storage by demonstrating its ability to effectively use the swap file as a form of extended memory. The test does not write out the result data or process the points in order to isolate the wall-time effect of the latency impact to the underlying storage component. The test itself is composed of five phases, three of which we run as part of the benchmark, which is as follows:
- Loads packed points from disk. This is the time to read from the disk. This is single-threaded, which may limit overall throughput.
- Unpacks the points into a single flat array in order to allow them to be processed. If the points do not have a dependency on other points, the working set could be adjusted to stay in-core. This step is multi-threaded.
- (Not Run) Processes the points.
- Repacks them into bucketed blocks suitable for storing back to disk. This step is multi-threaded.
- (Not Run) Writes the bucketed blocks back out to disk.
Here, we see the 1TB Samsung SSD 980 hit 2,784.947 seconds and the 500GB version hit 4,144.171. This puts the 500GB version on the very bottom and the 1TB about in the middle.
SQL Server Performance
Each SQL Server VM is configured with two vDisks: 100GB volume for boot and a 500GB volume for the database and log files. From a system resource perspective, we configured each VM with 16 vCPUs, 64GB of DRAM, and leveraged the LSI Logic SAS SCSI controller. While our Sysbench workloads tested previously saturated the platform in both storage I/O and capacity, the SQL test is looking for latency performance.
This test uses SQL Server 2014 running on Windows Server 2012 R2 guest VMs and is stressed by Quest’s Benchmark Factory for Databases. StorageReview’s Microsoft SQL Server OLTP testing protocol employs the current draft of the Transaction Processing Performance Council’s Benchmark C (TPC-C), an online transaction-processing benchmark that simulates the activities found in complex application environments.
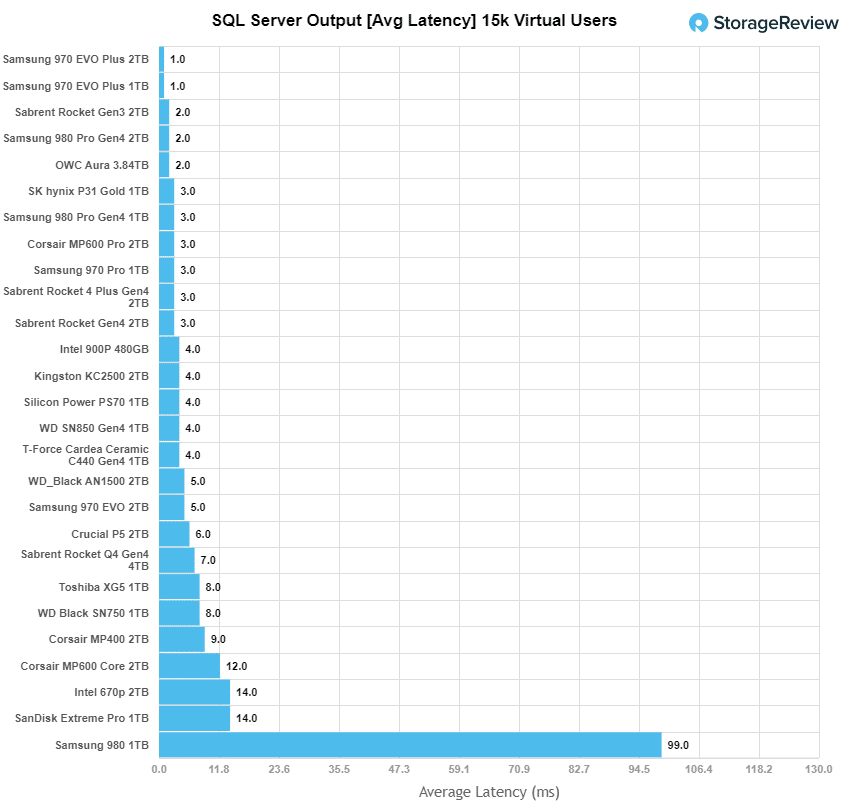
The TPC-C benchmark comes closer than synthetic performance benchmarks to gauging the performance strengths and bottlenecks of storage infrastructure in database environments. Each instance of our SQL Server VM for this review uses a 333GB (1,500 scale) SQL Server database and measures the transactional performance and latency under a load of 15,000 virtual users.
SQL Server Testing Configuration (per VM)
- Windows Server 2012 R2
- Storage Footprint: 600GB allocated, 500GB used
- SQL Server 2014
- Database Size: 1,500 scale
-
- Virtual Client Load: 15,000
- RAM Buffer: 48GB
- Test Length: 3 hours
-
- 2.5 hours preconditioning
- 30 minutes sample period
The 500GB was too small a sample for SQL Server, but the Samsung SSD 980 1TB had 99ms, well below the rest of the pack.
VDBench Workload Analysis
When it comes to benchmarking storage devices, application testing is best, and synthetic testing comes in second place. While not a perfect representation of actual workloads, synthetic tests do help to baseline storage devices with a repeatability factor that makes it easy to do apples-to-apples comparison between competing solutions. These workloads offer a range of different testing profiles ranging from “four corners” tests, common database transfer size tests, to trace captures from different VDI environments.
All of these tests leverage the common vdBench workload generator, with a scripting engine to automate and capture results over a large compute testing cluster. This allows us to repeat the same workloads across a wide range of storage devices, including flash arrays and individual storage devices. Our testing process for these benchmarks fills the entire drive surface with data, then partitions a drive section equal to 5% of the drive capacity to simulate how the drive might respond to application workloads. This is different than full entropy tests which use 100% of the drive and take them into a steady state. As a result, these figures will reflect higher-sustained write speeds.
Profiles:
- 4K Random Read: 100% Read, 128 threads, 0-120% iorate
- 4K Random Write: 100% Write, 64 threads, 0-120% iorate
- 64K Sequential Read: 100% Read, 16 threads, 0-120% iorate
- 64K Sequential Write: 100% Write, 8 threads, 0-120% iorate
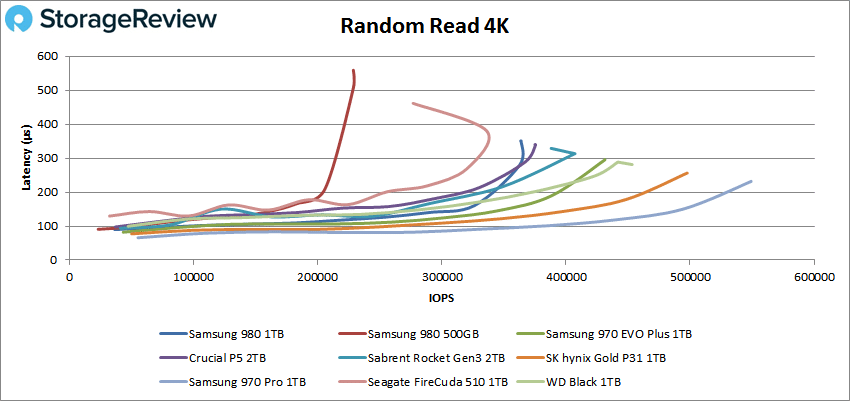
Comparables for this review:
First up is random 4K read. Here the 1TB came in seventh with a peak of 363,791 IOPS at a latency of 351µs. the 500GB Samsung SSD 980 came in last with a peak of 228,583 IOPS and a latency of 506µs.
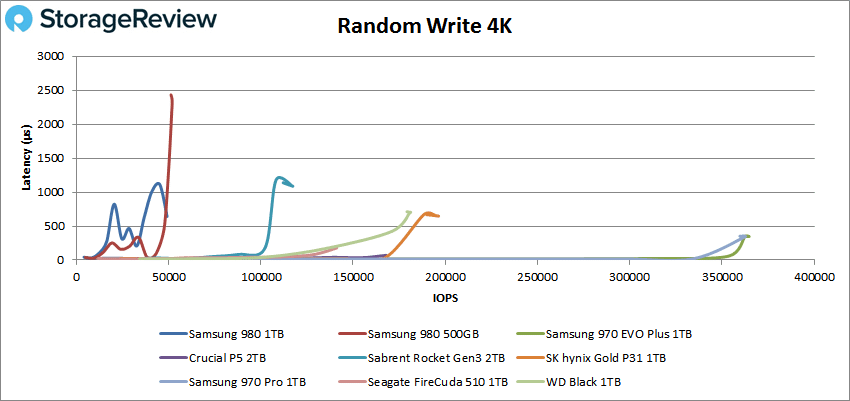
4K random write saw the 1TB 980 peak at 49,151 IOPS at a latency of 642µs for the last place and the 500GB came in eighth with a peak of 51,923 IOPS and a latency of 2.3ms before dropping off some.
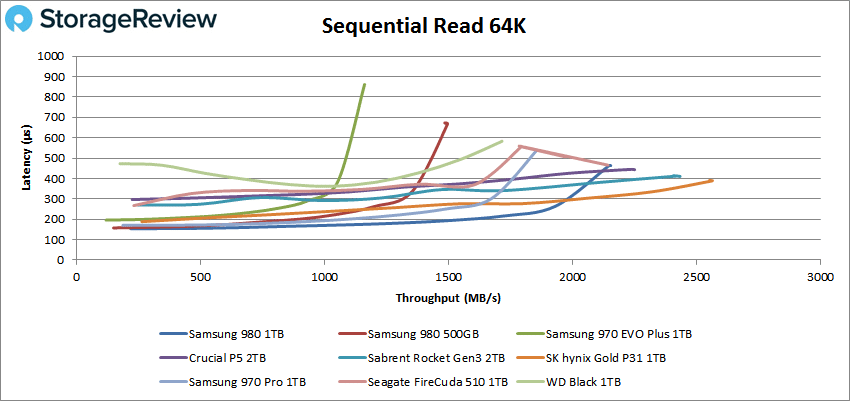
Switching over to sequential, the Samsung SSD 980 1TB came in sixth with a peak of 34,447 IOPS or 2.2GB/s at a latency of 464µs in 64K read. The 500GB came in last with a peak of 23,923 IOPS or 1.5GB/s with a latency of 667µs.
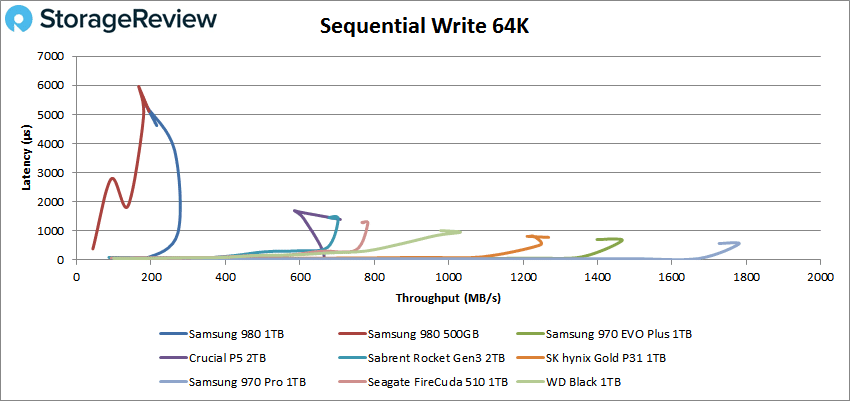
64K sequential write saw the 1TB version of the 980 hit a peak of about 4,200 IOPS or about 263MB/s at a latency of 2ms before dropping off quite a bit, putting it in eighth. The 500GB took last with a peak of 3,122 IOPS or 195MB/s with a latency of 5.1ms.
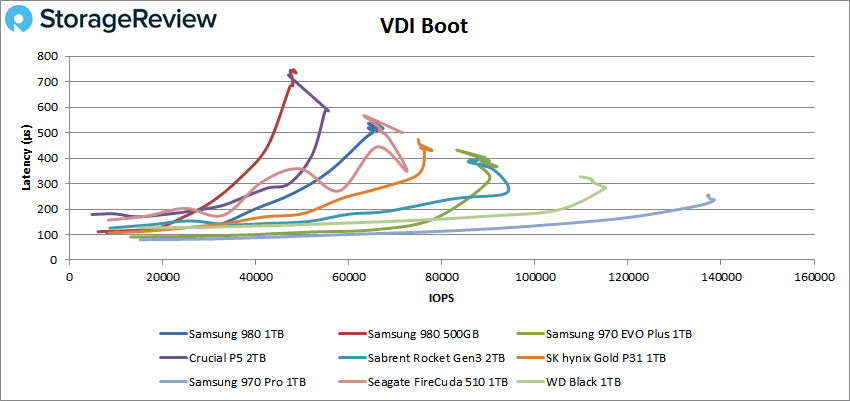
Next, we looked at our VDI benchmarks, which are designed to tax the drives even further. Here you can obviously see that all of these drives struggled, though this was expected due to their focus on price point and read performance only. These tests include Boot, Initial Login, and Monday Login. That said, the Boot test showed the 1TB version of the 980 takes seventh with a peak of 67,535 IOPS at a latency of 516µs. The 500GB version took last with a peak of 48,652 IOPS and a latency of 684µs.
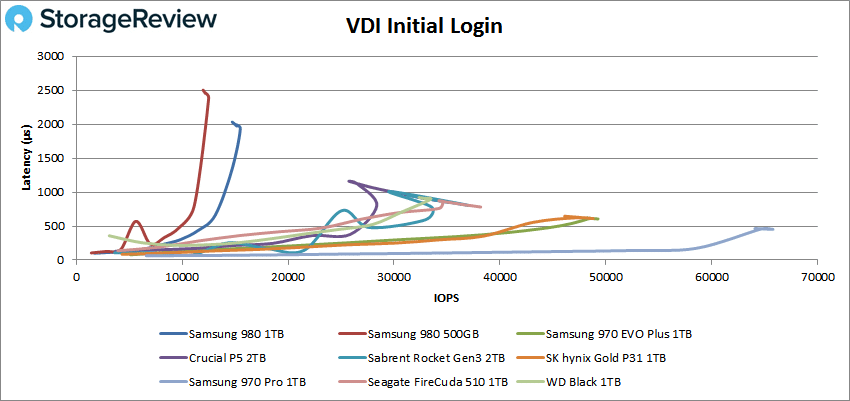
With VDI Initial Login the 980 1TTB peaked at 15,479 IOPS with 2ms for eighth place and the 500GB took last with a peak of 12,491 IOPS and a latency of 2.5ms.
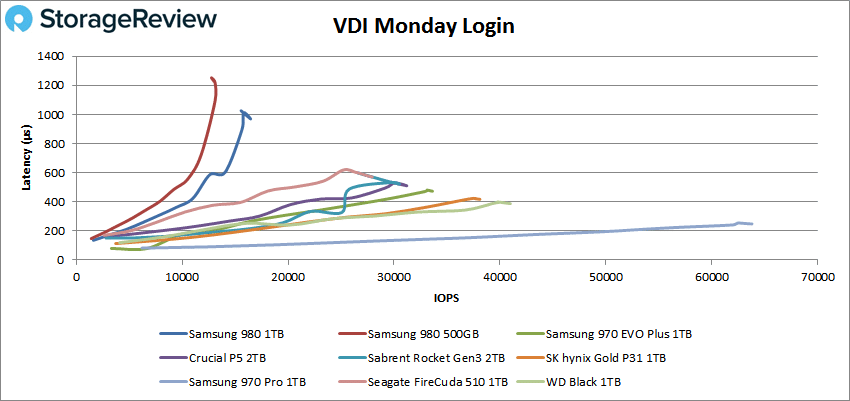
Finally, with Monday Login the Samsung SSD 980 took eighth (1TB) and last (500GB) with peaks and latencies of 16,450 IOPS and latency of 970µs and 13,096 IOPS and 1.21ms respectively.
BlackMagic
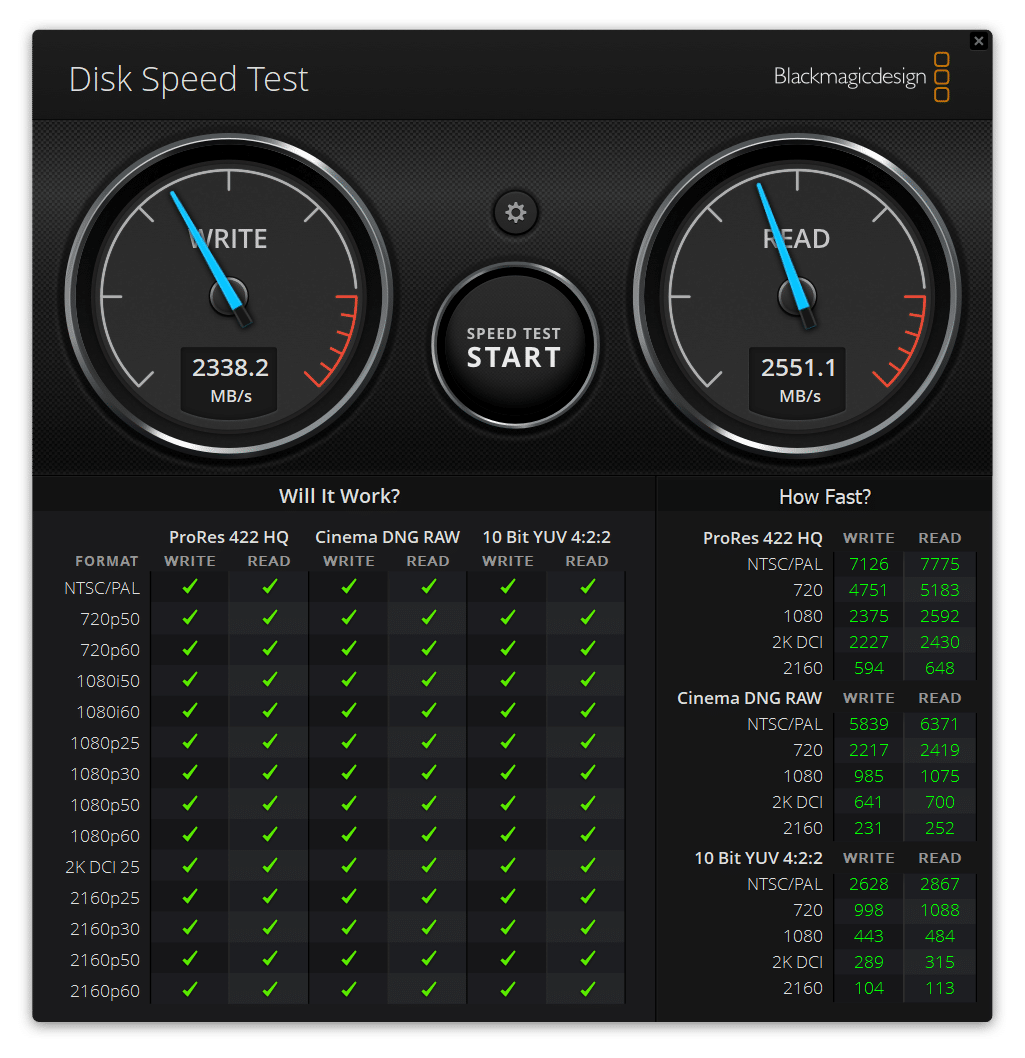
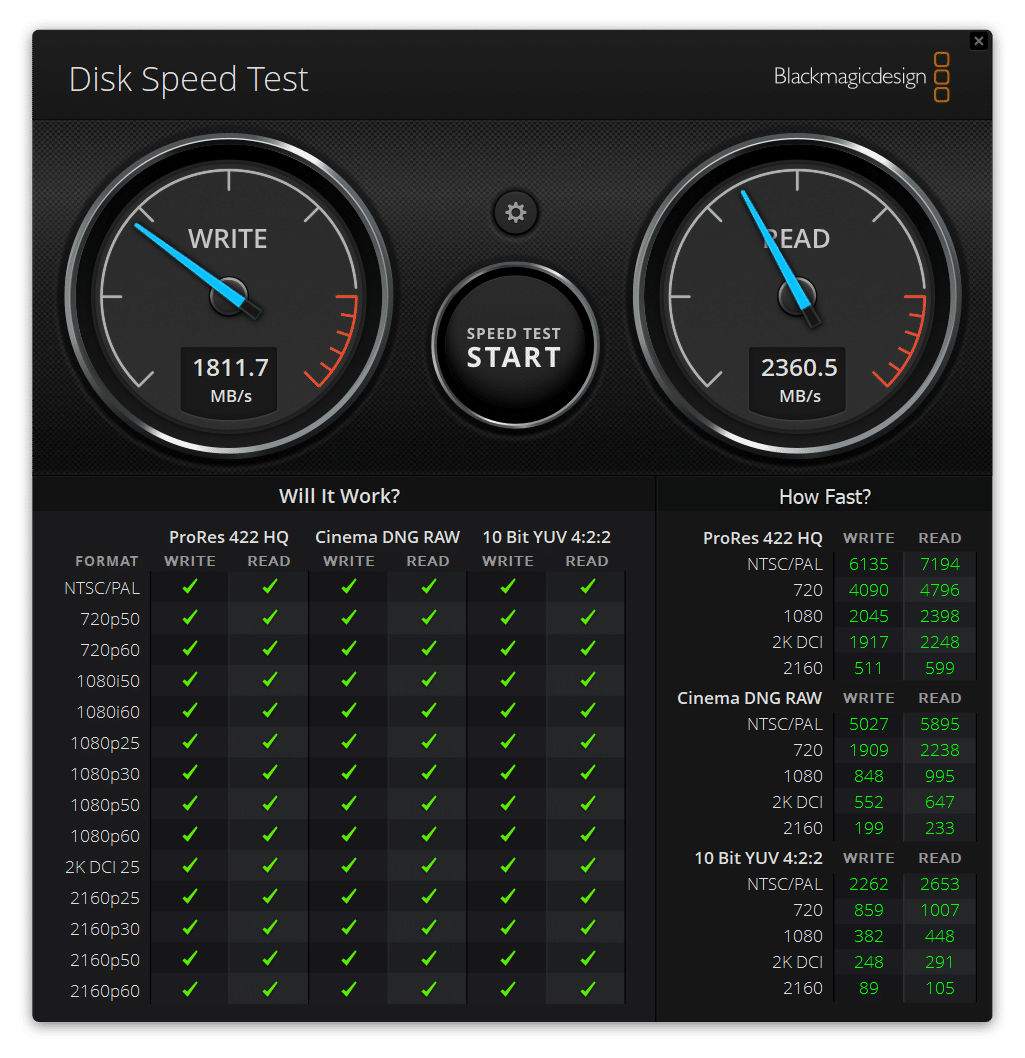
To further test the Samsung SSD 980, we ran the Blackmagic Disk Speed Test on the Lenovo ThinkStation P620.
Here we saw the 980 hit 2.55GB/s read and 2.34GB/s write for the 1TB and 2.36GB/s read and 1.81GB/s write for the 500GB.
| Blackmagic | ||
| Drive | Read | Write |
| Samsung SSD 980 1TB | 2.55GB/s | 2.34GB/s |
| Samsung SSD 980 500GB | 2.36GB/s | 1.81GB/s |
| Samsung 970 PRO | 2.63GB/s | 2.53GB/s |
| Samsung 970 EVO Plus 1TB | 2.32GB/s | 1.98GB/s |
| WD_BLACK 1TB | 2.88GB/s | 2.34GB/s |
| Crucial P5 2TB | 1.49GB/s | 1.23GB/s |
| Crucial P2 2TB | 1.47GB/s | 1.52GB/s |
| SK hynix P31 1TB | 2.42GB/s | 2.67GB/s |
| Sabrent Gen3 Rocket 2TB | 2.53GB/s | 2.63GB/s |
Conclusion
The Samsung SSD 980 is the company’s newest PCIe Gen3 drive with a bit of a twist, this is Samsung’s first client drive that doesn’t have DRAM. Instead of on-board DRAM this M.2 SSD uses HMB to access the host processor’s DRAM allowing it to quote numbers such as 3.5GB/s and throughput of 500K IOPS. The drive comes in capacities of 250GB, 500GB, and 1TB. And to top it all off, the 980 is very affordable at launch.
Looking at the performance we see that for Samsung, this drive is a bit of a letdown, with a caveat. Anything that routinely places in eighth and last isn’t exactly stellar in the performance department. However, the drive was tested against other SSD with DRAM, also the MSRP is about the same as the street price of some of the existing drives. For testing, we ran our Application Workload Analysis, VDBench, and Blackmagic and we tested both the 1TB version and the 500GB version.
With Applications Workload Analysis, the drive came in last on SQL Server with 99ms. In Houdini by SideFX the 1TB drive did ok placing near the middle with 2,785 seconds. The 500GB took last once more with 4,144 seconds. VDBench saw the 1TB drive hit 364K IOPS in 4K read, 49K IOPS in 4K write, 2.2GB/s in 64K read, 263MB/s in 64K write, 68K IOPS in VDI Boot, 15K IOPS in Initial Login, and 16K IOPS in Monday Login.
For the 500GB version, we saw 229K IOPS in 4K read, 52K IOPS in 4K write, 1.5GB/s in 64K read, 195MB/s in 64K write, 49K IOPS in Boot, 12K IOPS in Initial Login, and 13K IOPS in Monday Login. Latency was frequently above 1ms. Finally, Blackmagic saw the 1TB version hit 2.6GB/s read and 2.3GB/s write while the 500GB hit 2.4GB/s read and 1.8GB/s write.
The Samsung SSD 980 is a DRAM-less, client SSD that attempts to sidestep the performance drop of removing the DRAM with a few inventive tricks. In the end, though, the drive is still slower than the existing PCIe Gen3 comparables across many operating systems and benchmarks. Ultimately the performance causes this drive to be a letdown until the price drops substantially to make it a better value play.


 Amazon