

When we tested the 4TB Samsung 9100 Pro earlier this year, it quickly stood out as one of the most capable Gen5 x4 SSDs we had seen, in some cases setting a new benchmark in our performance charts. Built around Samsung’s in-house Presto controller and eighth-generation V-NAND, the drive delivered the kind of throughput that could handle AI models, massive video projects, and next-gen gaming without breaking a sweat. At launch, the 4TB version was the highest capacity available, but Samsung emphasized that an 8TB SKU was on the roadmap. Now, the drive is finally here.
Samsung 9100 Pro 8TB Features
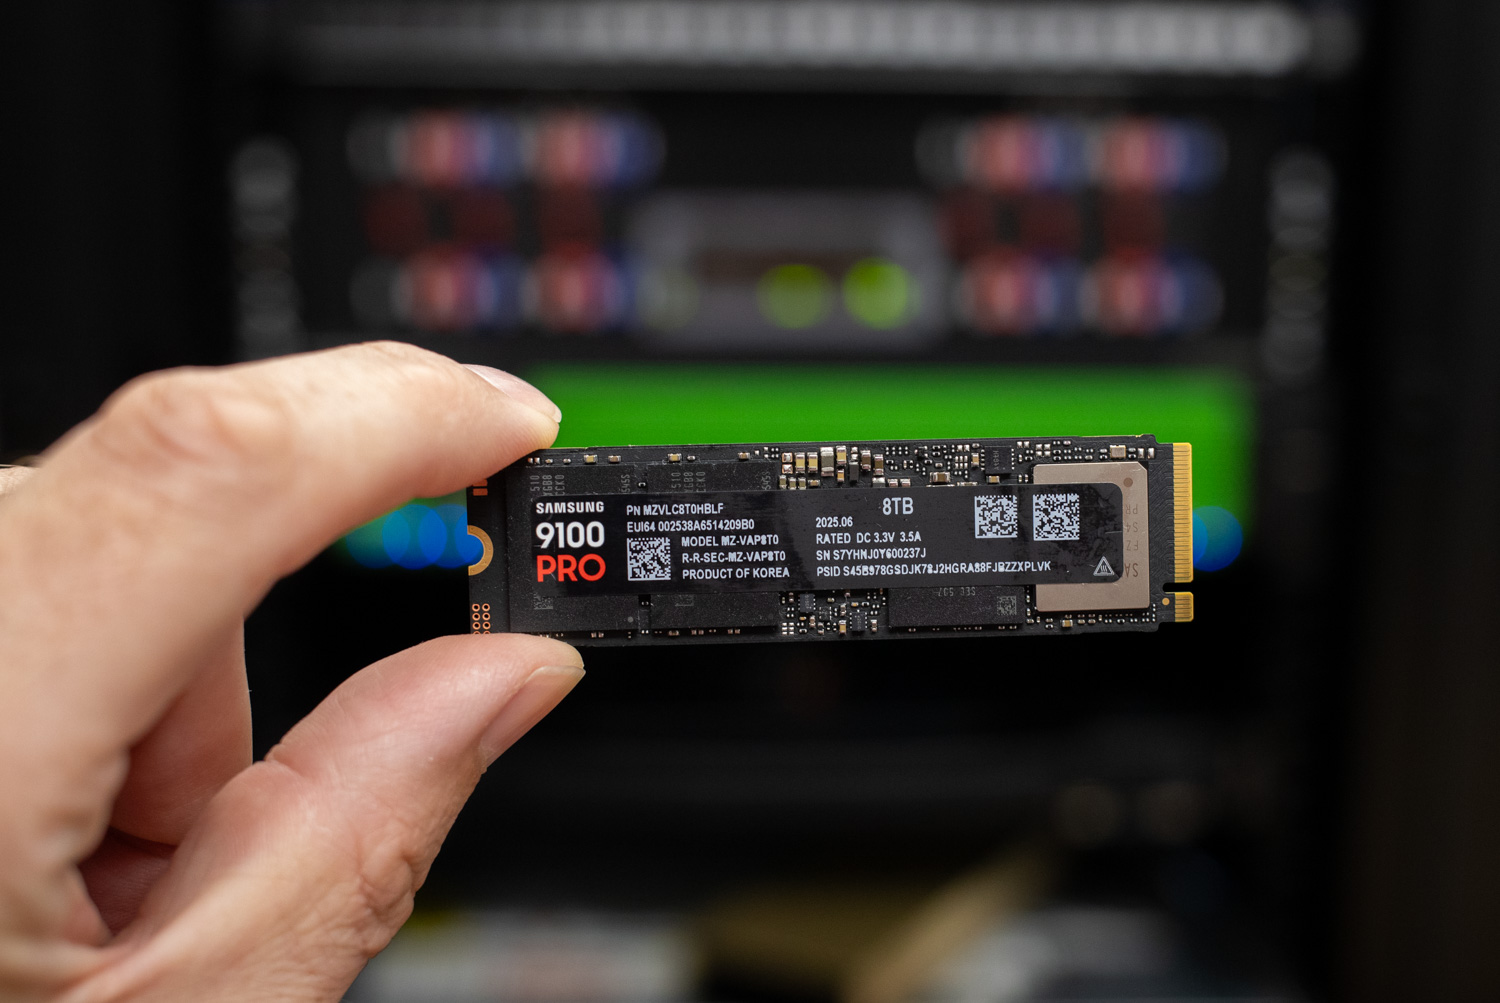
The 8TB 9100 Pro has the same performance profile as the smaller capacities, with sequential read speeds of up to 14,800MB/s, write speeds of 13,400MB/s, and random workloads achieving as many as 2,200K IOPS. What it does bring is scale. This is Samsung’s first consumer SSD to reach 8TB in a single M.2 drive, doubling the capacity of the 4TB version, which places it in rare company among high-performance drives. For professionals dealing with multi-terabyte datasets or creators with overflowing video projects, that extra headroom is very much welcomed.
Samsung 9100 Pro vs Past Generations
| Feature | 9100 Pro | 990 Pro | 990 EVO |
| Launch Year | 2025 | 2022 | 2023 |
| Interface | PCIe Gen5 x4 | PCIe Gen4 x4 | PCIe Gen4 x4 / Gen5 x2 |
| NAND Type | 8th Gen V-NAND TLC | 7th Gen V-NAND TLC | 7th Gen V-NAND TLC |
| Controller | Presto (5nm) | Pascal (8nm) | In-house (Pascal-Lite) |
| Max Capacity | Up to 8TB | Up to 4TB | Up to 2TB |
| Sequential Read/Write | Up to 14,800MB/s / 13,400MB/s | Up to 7,450MB/s / 6,900MB/s | Up to 5,000MB/s / 4,200MB/s |
| Random Read/Write | Up to 2,200K / 2,600K IOPS | Up to 1,600K / 1,550K IOPS | Up to 700K / 800K IOPS |
| Power Efficiency | 49% higher vs. 990 Pro | Improved vs. 980 Pro | Up to 70% better than 970 EVO Plus |
| Endurance (TBW) | Up to 4,800 TB | Up to 2,400 TB | Up to 1,200 TB |
| Heatsink Option | Yes | Yes | No |
| Target Audience | High-end prosumers, AI, 8K video, content creation | High-performance gaming, professional workloads | Mainstream users, casual gaming, general use |
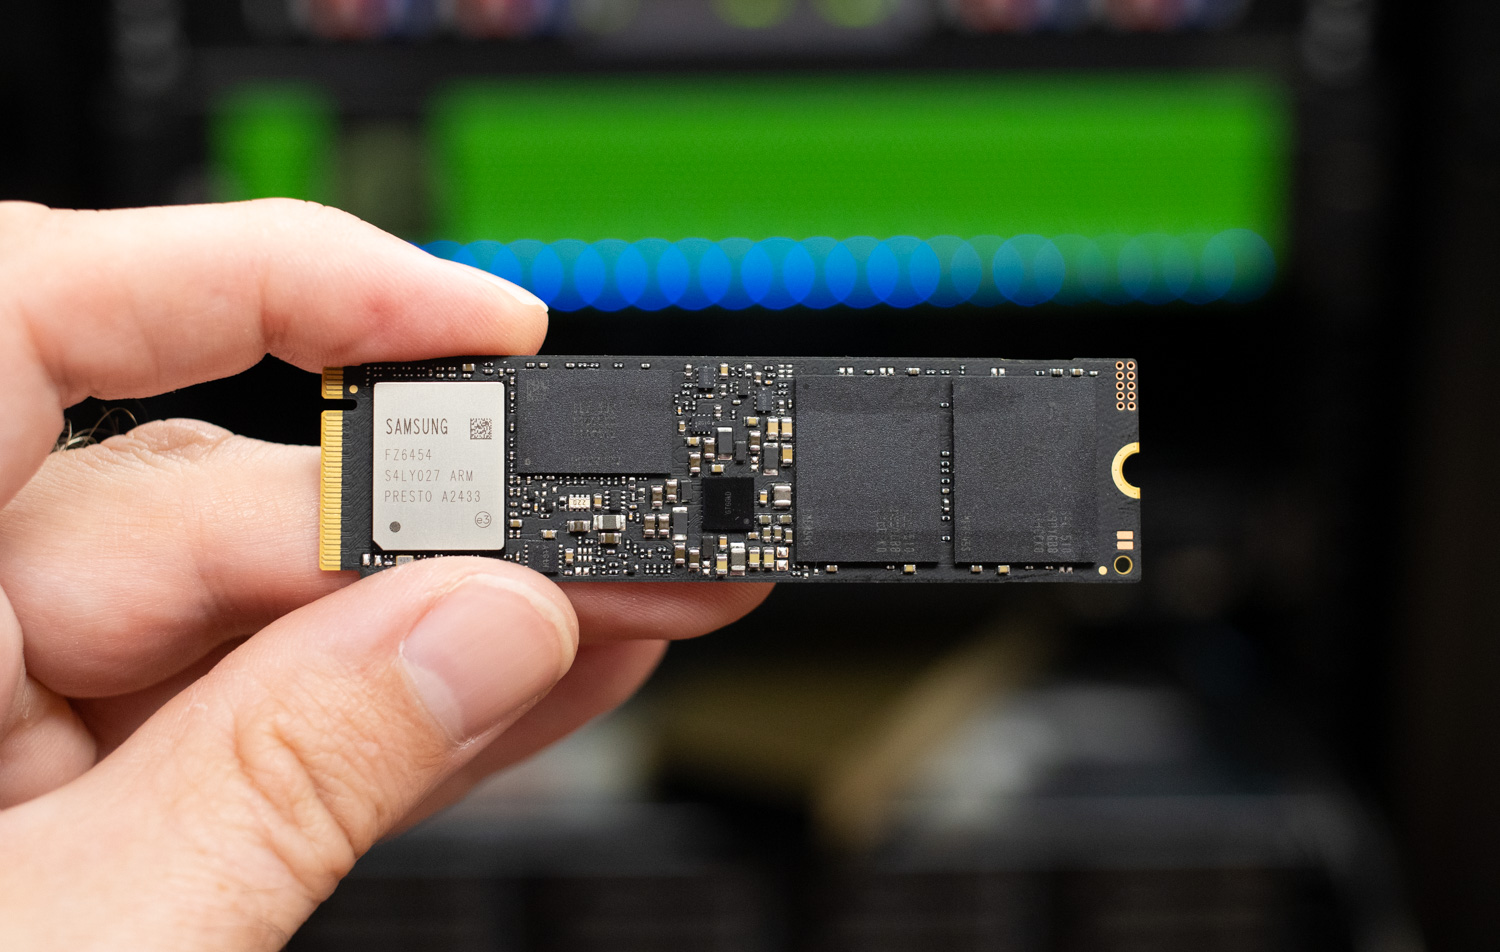
From a design perspective, you still get Samsung’s Presto 5nm controller, Intelligent TurboWrite 2.0 with dynamic SLC caching, and endurance ratings that scale all the way up to 4,800 TBW on this new capacity tier. The 8TB model also carries more onboard DRAM (8GB of LPDDR4X) to keep mapping overhead under control at such a large scale.
The biggest advantage of the 8TB model is that you can keep huge AI models local, manage 8K video timelines without relying on external storage, or install a huge game library and still have room to spare. For desktop users with the right platform, this becomes an all-in-one solution. Even PlayStation 5 owners get a plug-and-play option if they choose the heatsink version, though the 11.25mm z-height of the 8TB heatsink model is a little thicker than the smaller capacities.
Ultimately, we already know how fast and efficient the 9100 Pro is, as the 4TB model proved that in our testing. The 8TB version will certainly extends it in the way power users were waiting for with the convenience of massive local storage.
Samsung 9100 Pro 8TB Availability
The 8TB models are now available, carrying a price tag of $999.99, or $1,019.99 with the heatsink. Rounding out the lineup, and also available, are the 1TB, 2TB, and 4TB models.
Samsung 9100 Pro 8TB Specifications
The table below outlines the Samsung 9100 PRO series lineup, highlighting the available capacities, performance characteristics, power consumption, endurance, and key features across both the standard and heatsink models.
| Specification | Samsung 9100 PRO | Samsung 9100 PRO with Heatsink |
| Interface | PCIe® 5.0 x4, NVMe™ 2.0 | |
| Form Factor | M.2 (2280) | M.2 (2280 with Heatsink) |
| NAND | Samsung V-NAND TLC (V8) | |
| Controller | Samsung In-House Controller | |
| Cache Memory | 1GB / 2GB / 4GB / 8GB LPDDR4X (based on capacity) | |
| Capacities | 1TB, 2TB, 4TB, 8TB | |
| Sequential Read/Write | 1TB: 14,700 / 13,300 MB/s 2TB: 14,700 / 13,400 MB/s 4TB: 14,800 / 13,400 MB/s 8TB: 14,800 / 13,400 MB/s |
|
| Random Read/Write (QD32) | 1TB–2TB: 1,850K / 2,600K IOPS 4TB–8TB: 2,200K / 2,600K IOPS |
|
| Power (Active) | 1TB: 7.6W (R) / 7.2W (W) 2TB: 8.1W (R) / 7.9W (W) 4TB: 9.0W (R) / 8.2W (W) 8TB: TBD |
|
| Device Sleep (L1.2) | 1TB: 4.0mW / 3.3mW 2TB: 4.8mW / 4.0mW 4TB: 6.5mW / 5.7mW 8TB: TBD |
|
| Intelligent TurboWrite 2.0 | 1TB: 114GB 2TB: 226GB 4TB: 442GB 8TB: TBD |
|
| Data Encryption | AES 256-bit, TCG/Opal v2.0, MS eDrive (IEEE1667) | |
| Endurance (TBW) | 1TB: 600 TBW 2TB: 1,200 TBW 4TB: 2,400 TBW 8TB: 4,800 TBW |
|
| Warranty | 5-Year Limited Warranty | |
Samsung 9100 Pro 8TB Performance
Before diving into the benchmarks, here’s a list of comparable Gen5 drives tested alongside the Samsung 9100 Pro 8TB, along with a few Gen4 SSDs:
- Phison E28 (reference design)
- PNY CS2150
- Lexar Professional NM1090 PRO
- SK hynix Platinum P51
- Kingston FURY Renegade G5
- SanDisk WD_BLACK SN8100
- Crucial T705
- Crucial P510
- Samsung 9100 Pro
- Crucial T710
- WD SN5100 (PCIe Gen4)
- Samsung 990 Pro (PCIe Gen4)
- WD SN850X (PCIe Gen4)
We subjected these drives to various tests to evaluate their real-world and synthetic performance. This includes LLM load times to measure how quickly they handle large AI models, DirectStorage tests to assess how fast they load game assets and process in-game data, and BlackMagic Design tests to evaluate read and write speeds for high-resolution video editing. We’ll also run PCMark 10 to gauge overall system responsiveness, 3DMark Storage to test gaming performance, and FIO tests to measure peak sequential and random read/write speeds under heavy workloads.
Here’s the high-performance test rig we used for benchmarking:
- CPU: AMD Ryzen 7 9800X3D
- Motherboard: Asus ROG Crosshair X870E Hero
- RAM: G.SKILL Trident Z5 Royal Series DDR5-6000 (2x16GB)
- GPU: NVIDIA GeForce RTX 4090
- OS: Windows 11 Pro, Ubuntu 24.10 Desktop
Peak Synthetic Performance
The FIO test is a flexible and powerful benchmarking tool used to measure the performance of storage devices, including SSDs and HDDs. It evaluates metrics such as bandwidth, IOPS (Input/Output Operations Per Second), and latency under different workloads, like sequential and random read/write operations. This test helps to assess the peak performance of storage systems, making it useful for comparing different devices or configurations. We measured the peak burst performance for this test, limiting the workload to a 10GB footprint on both SSDs.
When comparing the Samsung 9100 PRO lineup to other PCIe Gen5 drives, the results highlight both consistency and some interesting trade-offs between capacities. The 8TB model largely mirrors the 4TB’s sequential performance, posting nearly identical read and write speeds around 14.6GB/s and 13.3GB/s, respectively. Where the differences show is in random workloads. The 4TB drive led the pack with standout 4K random performance at 2.73M IOPS for both read and write, edging out many competitors in this test. The 8TB, while still strong, came in slightly lower at 2.25M IOPS in random read but matched (and slightly exceeded) the 4TB in random write with 2.74M IOPS.
Against other flagship Gen5 options like the SanDisk SN8100, Kingston Fury Renegade G5, or SK hynix Platinum P51, Samsung’s 9100 PRO series remains competitive across the board. The 4TB model in particular pushes the envelope in random performance, while the 8TB demonstrates that scaling to higher capacities doesn’t mean sacrificing sequential throughput
| FIO Test (higher MB/s/IOPS is better) | Sequential 128K Read (1T/64Q) | Sequential 128K Write (1T/64Q) | Random 4K Read (16T/32Q) | Random 4K Write (16T/32Q) |
| SanDisk SN8100 2TB | 15,000MB/s (0.56ms avg latency) | 14,100MB/s (0.59ms avg latency) | 2.312M IOPS (0.22ms avg latency) | 2.144M IOPS (0.24ms avg latency) |
| Kingston FURY Renegade G5 2TB | 14,600MB/s (0.57ms avg latency) | 14,100MB/s (0.59ms avg latency) | 2.028M IOPS (0.25ms avg latency) | 2.028M IOPS (0.25ms avg latency) |
| Samsung 9100 Pro 4TB | 14,600MB/s (0.57ms avg latency) | 13,300MB/s (0.63ms avg latency) | 2.734M IOPS (0.18ms avg latency) | 2.734M IOPS (0.19ms avg latency) |
| Samsung 9100 Pro 8TB | 14,600MB/s (0.57ms avg latency) | 13,300MB/s (0.63ms avg latency) | 2.253M IOPS (0.22ms avg latency) | 2.746M IOPS (0.18ms avg latency) |
| SK hynix Platinum P51 2TB | 14,500MB/s (0.58ms avg latency) | 13,500MB/s (0.62ms avg latency) | 2.369M IOPS (0.22ms avg latency) | 2.669M IOPS (0.19ms avg latency) |
| Crucial T710 2TB | 14,400MB/s (0.58ms avg latency) | 13,500MB/s (0.62ms avg latency) | 2.265M IOPS (0.23ms avg latency) | 2.306M IOPS (0.22ms avg latency) |
| Crucial T705 2TB | 14,400MB/s (0.58ms avg latency) | 12,300MB/s (0.68ms avg latency) | 1.585M IOPS (0.32ms avg latency) | 2.703M IOPS (0.19ms avg latency) |
| Phison PS5028-E28 2TB | 14,00MB/s (0.60ms avg latency) | 14,000MB/s (0.57ms avg latency) | 2.559M IOPS (0.32ms avg latency) | 3.288M IOPS (0.32ms avg latency) |
| Lexar Professional NM1090 PRO 2TB | 13,800GB/s (0.61ms avg latency) | 13,600 MB/s (0.62ms avg latency) | 2.073M IOPS (0.32ms avg latency) | 2.215M IOPS (0.23ms avg latency) |
| PNY CS2150 2TB | 10,400GB/s (0.80ms avg latency) | 8,801MB/s (0.95ms avg latency) | 1.379M IOPS (0.371ms avg latency) | 1.623 IOPS (0.32ms avg latency) |
| Crucial P510 1TB | 8,835 MiB/s (0.90 ms avg latency) | 9,961MB/s (0.80 ms avg latency) | 1.163M IOPS (0.44ms avg latency) | 1.196M IOPS (0.51ms avg latency) |
| Samsung 990 Pro 2TB | 7,483MB/s (1.12ms avg latency) | 7,197MB/s (1.16ms avg latency) | 1.400M IOPS (0.36ms avg latency) | 1.403M IOPS (0.36ms avg latency) |
| WD SN5100 2TB | 7,329MB/s (1.14ms avg latency) | 6,740MB/s (1.24ms avg latency) | 415K IOPS (1.23ms avg latency) | 931K IOPS (0.55ms avg latency) |
| WD SN850X 2TB | 6,632MB/s (0.76ms avg latency) | 7,235MB/s (0.92ms avg latency) | 1.2M IOPS (0.43ms avg latency) | 825K IOPS (0.62ms avg latency) |
Average LLM Load Time
The Average LLM Load Time test evaluated the load times of three different LLMs: DeepSeek R1 7B, Meta Llama 3.2 11B, and DeepSeek R1 32B. Each model was tested 10 times, and the average load time was calculated. This test measures the drive’s ability to load large language models (LLMs) into memory quickly. LLM load times are crucial for AI-related tasks, particularly for real-time inference and processing large datasets. Faster loading enables the model to process data rapidly, thereby improving AI responsiveness and reducing waiting time.
The Average LLM Load Time test highlights how each drive handles real-world AI workloads. The Samsung 9100 PRO 8TB posted 2.60s (DeepSeek R1 7B), 3.64s (Llama 3.2 11B), and 4.46s (DeepSeek R1 32B), while the 4TB model came in at 2.62s, 3.60s, and 4.37s, respectively. In practice, the 4TB edged ahead in the 11B and 32B runs, though the gap between the two models was never more than 0.09 seconds.
At the very top, the SK hynix Platinum P51 2TB led the group with 2.55s / 3.58s / 4.18s, closely followed by the SanDisk SN8100 2TB at 2.57s / 3.59s / 4.29s. This puts Samsung’s 9100 PRO series within striking distance of the fastest Gen5 drives, trailing by just 0.05–0.10 seconds in most cases
| Average LLM Load Time (lower is better) | DeepSeek R1 7B | Meta Llama 3.2 11B Vision | DeepSeek R1 32B |
| SK hynix Platinum P51 2TB | 2.5481s | 3.5809s | 4.1790s |
| SanDisk SN8100 2TB | 2.5702s | 3.5856s | 4.2870s |
| Phison PS5028-E28 2TB | 2.5730s | 3.6380s | 4.3407s |
| Crucial T710 2TB | 2.6138s | 3.6942s | 4.4588s |
| Samsung 9100 Pro 8TB | 2.6039s | 3.6352s | 4.4561s |
| Samsung 9100 Pro 4TB | 2.6173s | 3.6017s | 4.3735s |
| PNY CS2150 2TB | 2.8107s | 3.6820s | 4.8962s |
| Crucial T705 2TB | 2.8758s | 3.6312s | 5.1080s |
| Samsung 990 Pro 2TB | 2.8758s | 3.6312s | 5.1080s |
| Crucial P510 1TB | 2.8817s | 3.6631s | 5.0594s |
| WD SN5100 2TB | 2.9940s | 3.6650s | 5.5808s |
| WD SN850X 2TB | 3.0082s | 3.6543s | 5.4844s |
| Kingston FURY Renegade G5 2TB | 3.1843s | 4.8009s | 4.6523s |
| Lexar Professional NM1090 PRO 2TB | 3.2135s | 4.9504s | 7.2108s |
3DMark Direct Storage
The 3DMark DirectStorage Feature Test evaluates how Microsoft’s DirectStorage optimizes game asset loading on PCIe SSDs. By reducing CPU overhead and improving data transfer speeds, DirectStorage enhances loading times, especially when paired with GDeflate compression and Windows 11’s BypassIO. This test isolates storage performance to highlight the potential bandwidth improvements when DirectStorage is enabled.
Storage to VRAM with GDeflate compression enabled, the top drives all clustered in the 25–26GB/s range, including the SK hynix Platinum P51 (26.32GB/s), SanDisk SN8100 (26.11GB/s), and Phison PS5028-E28 (26.22GB/s). The Samsung 9100 PRO 8TB followed closely at 25.39GB/s, while the 4TB trailed slightly at 23.77GB/s.
In uncompressed storage-to-VRAM transfers with DirectStorage on, Samsung’s 8TB model hit 11.00GB/s versus 11.26GB/s for the 4TB. When DirectStorage was disabled, throughput dropped across the board, with the 8TB landing at 8.48GB/s and the 4TB at 8.92GB/s. For storage-to-RAM transfers, the 8TB came in at 11.75GB/s (DS on) and 8.83GB/s (DS off), nearly identical to the 4TB’s 11.62GB/s and 9.48GB/s.
The GDeflate decompression bandwidth numbers also showed strong consistency, with the Samsung 9100 PRO 4TB reaching 66.61GB/s, one of the highest in the group, while the 8TB was slightly lower at 63.46GB/s. Overall, both Samsung models slot into the upper tier of Gen5 results, trading blows with leaders like SK hynix and SanDisk, and demonstrating that even high-capacity drives like the 8TB can still deliver competitive game-loading acceleration with DirectStorage.
| 3DMark Direct Storage, (GB/s, higher is better) | Storage to VRAM (GDeflate Compression) | Storage to VRAM (DirectStorage on, Uncompressed) | Storage to VRAM (DirectStorage off, Uncompressed) | Storage to RAM (DirectStorage on, Uncompressed) | Storage to RAM (DirectStorage off, Uncompressed) | GDeflate Decompression Bandwidth |
| SK hynix Platinum P51 2TB | 26.32 | 11.20 | 7.75 | 12.85 | 9.46 | 64.68 |
| Phison PS5028-E28 2TB | 26.22 | 10.89 | 7.46 | 11.15 | 9.86 | 65.58 |
| SanDisk SN8100 2TB | 26.11 | 12.94 | 7.63 | 12.94 | 9.78 | 64.51 |
| Crucial T710 2TB 2TB | 25.96 | 10.60 | 7.57 | 12.70 | 9.76 | 64.07 |
| Crucial T705 2TB | 25.75 | 10.71 | 8.79 | 12.03 | 8.83 | 66.36 |
| Samsung 9100 Pro 8TB | 25.39 | 11.00 | 8.48 | 11.75 | 8.83 | 63.46 |
| Lexar Professional NM1090 PRO 2TB | 24.03 | 11.23 | 7.57 | 12.18 | 8.72 | 63.15 |
| Samsung 9100 Pro 4TB | 23.77 | 11.26 | 8.92 | 11.62 | 9.48 | 66.61 |
| Kingston FURY Renegade G52TB | 23.29 | 10.03 | 7.44 | 11.81 | 9.63 | 65.79 |
| Crucial P510 1TB | 19.63 | 8.33 | 6.92 | 9.06 | 7.49 | 66.22 |
| PNY CS2150 2TB | 19.49 | 8.60 | 6.98 | 9.22 | 7.70 | 62.43 |
| WD SN850X 2TB | 15.28 | 11.11 | 8.93 | 6.78 | 6.27 | 64.96 |
| WD SN5100 2TB | 15.22 | 11.06 | 5.83 | 6.70 | 6.34 | 65.61 |
| Samsung 990 Pro 2TB | 14.18 | 11.28 | 8.84 | 6.57 | 6.20 | 65.71 |
BlackMagic Disk Speed Test
The BlackMagic Disk Speed Test benchmarks a drive’s read and write speeds, estimating its performance, especially for video editing tasks. It helps users ensure their storage is fast enough for high-resolution content, like 4K or 8K video.
In our BlackMagic Disk Speed Test, the Samsung 9100 PRO 8TB secured second place overall, delivering 10,557MB/s read and 10,555MB/s write, just behind the Phison PS5028-E28 2TB. The Samsung 9100 PRO 4TB landed in the fifth spot, with 9,542MB/s read and 9,908MB/s write, comfortably ahead of most competitors but trailing the top Gen5 performers.
Here’s our current BlackMagic disk speed leaderboard:
| BlackMagic Disk Speed (MB/s, higher is better) | Read MB/s | Write MB/s |
| Phison PS5028-E28 2TB | 11,216.1 | 10,570.7 |
| Samsung 9100 Pro 8TB | 10,557.3 | 10,554.7 |
| SanDisk SN8100 2TB | 10,005.2 | 10,581.0 |
| Kingston FURY Renegade G5 2TB | 9,665.0 | 10,831.0 |
| Samsung 9100 Pro 4TB | 9,542.3 | 9,907.9 |
| Crucial T710 2TB | 9,415.3 | 10,688.2 |
| SK hynix Platinum P51 2TB | 9,241.0 | 9,109.0 |
| Lexar Professional NM1090 PRO 2TB | 9,149.2 | 10,466.6 |
| Crucial T705 2TB | 8,464.2 | 10,256.4 |
| Crucial P510 1TB | 7,853.9 | 7,939.6 |
| PNY CS2150 2TB | 6,625.5 | 7,299.5 |
| WD SN850X 2TB | 5,862.6 | 5,894.8 |
| Samsung 990 Pro 2TB | 5,769.5 | 5,842.9 |
| WD SN5100 2TB | 5,394.6 | 5,865.8 |
PCMark10 Storage
PCMark 10 Storage Benchmarks evaluate real-world storage performance using application-based traces. They test system and data drives, measuring bandwidth, access times, and consistency under load. These benchmarks offer practical insights beyond synthetic tests, enabling users to compare modern storage solutions effectively.
In PCMark 10, the Samsung 9100 PRO 8TB placed eighth overall with a score of 7,602, while the Samsung 9100 PRO 4TB followed in ninth place at 7,552. Both drives performed solidly but sat behind top Gen5 competitors like the Phison PS5028-E28 2TB (9,347, first place) and Crucial T705 2TB (8,783, second place).
| PCMark 10 Data Drive (higher is better) | Overall Score |
| Phison PS5028-E28 2TB | 9,347 |
| Crucial T705 2TB 2TB | 8,783 |
| SK hynix Platinum P51 2TB | 8,665 |
| SanDisk SN8100 2TB | 8,644 |
| Lexar Professional NM1090 PRO 2TB | 8,247 |
| Kingston FURY Renegade G5 2TB | 8,062 |
| Crucial T710 2TB | 7.918 |
| Samsung 9100 Pro 8TB | 7,602 |
| Samsung 9100 Pro 4TB | 7,552 |
| Samsung 990 Pro 2TB | 7,173 |
| Crucial P310 2TB | 6,436 |
| WD SN5100 2TB | 6,379 |
| PNY CS2150 2TB | 6,070 |
| WD SN850X 2TB | 4,988 |
3DMark Storage
The 3DMark Storage Benchmark tests your SSD’s gaming performance by measuring tasks like loading games, saving progress, installing game files, and recording gameplay. It evaluates how well your storage handles real-world gaming activities and supports the latest storage technologies for accurate performance insights.
In the 3DMark Storage Benchmark, the Samsung 9100 PRO 4TB finished in eighth place overall with a score of 4,779. The Samsung 9100 PRO 8TB followed closely behind in ninth place at 4,516. Both drives delivered solid gaming performance, though they trailed the leaders like the SanDisk SN8100 2TB (6,047, first place) and Phison PS5028-E28 2TB (5,879, second place).
| 3DMark Storage benchmark (higher is better) | Overall Score |
| SanDisk SN8100 2TB | 6,047 |
| Phison PS5028-E28 2TB | 5,879 |
| Kingston FURY Renegade G5 2TB | 5,670 |
| Crucial T705 2TB | 5,100 |
| Crucial T710 2TB | 5,083 |
| SK hynix Platinum P51 2TB | 5,082 |
| Lexar Professional NM1090 PRO 2TB | 4,828 |
| Samsung 9100 Pro 4TB | 4,779 |
| Samsung 9100 Pro 8TB | 4,516 |
| WD SN5100 2TB | 4,192 |
| Crucial P510 1TB 2TB | 4,148 |
| PNY CS2150 2TB | 4,193 |
| Samsung 990 Pro 2TB | 4,128 |
| WD SN850X 2TB | 3,962 |
| Crucial P310 2TB | 3,848 |
GPU Direct Storage
One of the tests we conducted on this testbench was the Magnum IO GPU Direct Storage (GDS) test. GDS is a feature developed by NVIDIA that allows GPUs to bypass the CPU when accessing data stored on NVMe drives or other high-speed storage devices. Instead of routing data through the CPU and system memory, GDS enables direct communication between the GPU and the storage device, significantly reducing latency and improving data throughput.
How GPU Direct Storage Works
Traditionally, when a GPU processes data stored on an NVMe drive, the data must first travel through the CPU and system memory before reaching the GPU. This process introduces bottlenecks, as the CPU becomes a middleman, adding latency and consuming valuable system resources. GPU Direct Storage eliminates this inefficiency by enabling the GPU to access data directly from the storage device via the PCIe bus. This direct path reduces the overhead associated with data movement, allowing faster and more efficient data transfers.
AI workloads, especially those involving deep learning, are highly data-intensive. Training large neural networks requires processing terabytes of data, and any delay in data transfer can lead to underutilized GPUs and longer training times. GPU Direct Storage addresses this challenge by ensuring that data is delivered to the GPU as quickly as possible, minimizing idle time and maximizing computational efficiency.
In addition, GDS is particularly beneficial for workloads that involve streaming large datasets, such as video processing, natural language processing, or real-time inference. By reducing the reliance on the CPU, GDS accelerates data movement and frees up CPU resources for other tasks, further enhancing overall system performance.
Results
In our GDSIO testing, the Samsung 9100 Pro 8TB showed strong and consistent throughput across block sizes, though its performance was slightly mixed compared to the 4TB model. At the 16K block size (128 queue depth), the 8TB reached 3.4GiB/s read (220K IOPS) and 2.4GiB/s write (155K IOPS), which was nearly identical in read speed to the 4TB (3.4GiB/s, 226K IOPS) but with a small edge in write throughput over the 4TB’s 2.3GiB/s (161K IOPS). Moving to the 128K block size, the 8TB matched the 4TB in sequential write at 5.9GiB/s, but the 4TB showed stronger read performance at 5.2GiB/s versus the 8TB’s 5.9GiB/s, highlighting some variation between capacities.
At the largest 1M block size, both capacities delivered steady sequential performance, with the 8TB recording 6.0GiB/s read and 6.1GiB/s write, while the 4TB produced 6.3GiB/s read and 6.1GiB/s write. This puts the two drives essentially on par in sustained large-block transfers, though the 4TB had a slight edge on read bandwidth.
Against other drives, the 9100 Pro 8TB stayed competitive with leading Gen5 models like the Phison PS5028-E28 and Kingston FURY Renegade G5, which posted higher consistency in 128K workloads, while Gen4 drives such as the previous gen Samsung 990 Pro and WD SN850X trailed significantly in every block size. Overall, the 9100 Pro 8TB demonstrates performance that scales well with capacity, keeping pace with the 4TB model while offering only small trade-offs in certain workloads.
Here’s a full run-down:
| GDSIO Chart (16K,128K,1M Block Size Averages) | (16K Block Size 128 IO Depth) Average Read | (16K Block Size 128 IO Depth) Average Write | (128K Block Size 128 IO Depth) Average Read | (128K Block Size 128 IO Depth) Average Write | (1M Block Size 128 IO Depth) Average Read | (1M Block Size 128 IO Depth) Average Write |
| Phison PS5028-E28 2TB | 3.7GiB/s (0.519ms) IOPS: 245.1K | 2.4GiB/s (0.824ms) IOPS: 154.7K | 5.9GiB/s (2.647ms) IOPS: 48.2K | 5.9GiB/s (2.650ms) IOPS: 48.31K | 6.4GiB/s (19.650ms) IOPS: 6.5K | 6.2GiB/s (20.033ms) IOPS: 6.4K |
| Kingston FURY Renegade G5 2TB | 3.7GiB/s (0.526ms) IOPS: 242.1K | 2.4GiB/s (0.824ms) IOPS: 154.7K | 5.9GiB/s (2.704ms) IOPS: 48.5K | 5.8GiB/s (0.564ms) IOPS: 47.3K | 6.5GiB/s (19.356ms) IOPS: 6.6K | 6.3GiB/s (19.690ms) IOPS: 6.5K |
| Crucial T710 2TB | 3.7GiB/s (0.526ms) IOPS: 242.0K | 2.4GiB/s (0.823ms) IOPS: 155.0K | 5.8GiB/s (2.613ms) IOPS: 48.9K | 3.7GiB/s (2.669ms) IOPS: 47.9K | 6.4GiB/s (0.526ms) IOPS: 6.6K | 6.1GiB/s (19.479ms) IOPS: 6.3K |
| Lexar Professional NM1090 PRO 2TB | 3.6GiB/s (0.533ms) IOPS: 238.7K | 2.3GiB/s (0.845ms) IOPS: 150.8K | 5.9GiB/s (2.639ms) IOPS: 48.4K | 4.2GiB/s (3.714ms) IOPS: 34.4K | 6.5GiB/s (19.274ms) IOPS: 6.6K | 6.2GiB/s (20.127ms) IOPS: 6.4K |
| SanDisk SN8100 2TB | 3.4GiB/s (0.564ms) IOPS: 225.9K | 2.1GiB/s (0.907ms) IOPS: 140.6K | 5.9GiB/s (2.626ms) IOPS: 48.7K | 5.8GiB/s (2.668ms) IOPS: 47.9K | 6.5GiB/s (19.264ms) IOPS: 6.6K | 5.9GiB/s (21.063ms) IOPS: 6.1K |
| Samsung 9100 Pro 4TB | 3.4GiB/s (0.565ms) IOPS: 226.4K | 2.3GiB/s (0.839ms) IOPS: 161.7K | 5.2GiB/s (3.001ms) IOPS: 44.9K | 5.9GiB/s (2.662ms) IOPS: 47.3K | 6.3GiB/s (19.877ms) IOPS: 6.4K | 6.1GiB/s (20.579ms) IOPS: 6.2K |
| Samsung 9100 Pro 8TB | 3.4GiB/s (0.577ms) IOPS: 220.4K | 2.4GiB/s (0.821ms) IOPS: 155.3K | 5.9GiB/s (2.676ms) IOPS: 47.8K | 5.9GiB/s (2.659ms) IOPS: 48.1K | 6.0GiB/s (19.592ms) IOPS: 6.5K | 6.1GiB/s (20.847ms) IOPS: 6.1K |
| Crucial T705 2TB | 3.3GiB/s (0.587ms) IOPS: 217.0K | 2.3GiB/s (.836ms) IOPS: 152.6K | 5.5GiB/s (2.863ms) IOPS: 44.7K | 5.6GiB/s (2.799ms) IOPS: 45.7K | 6.0GiB/s (20.738ms) IOPS: 6.2K | 6.0GiB/s (20.855ms) IOPS: 6.1K |
| SK hynix Platinum P51 2TB | 3.1GiB/s (0.634ms) IOPS: 200.9K | 1.5GiB/s (1.314ms) IOPS: 97.2K | 5.6GiB/s (2.781ms) IOPS: 46.0K | 3.9GiB/s (4.014ms) IOPS: 31.9K | 6.2GiB/s (20.126ms) IOPS: 6.4K | 4.2GiB/s (29.576ms) IOPS: 4.3K |
| Samsung 990 Pro 2TB | 2.7GiB/s (0.731ms) IOPS: 174.4K | 2.2GiB/s (0.903ms) IOPS: 141.2K | 4.0GiB/s (3.944ms) IOPS: 32.4K | 4.1GiB/s (3.849ms) IOPS: 33.2K | 3.9GiB/s (32.415ms) IOPS: 3.9K | 4.2GiB/s (29.520ms) IOPS: 4.3K |
| PNY CS2150 2TB | 2.5GiB/s (0.779ms) IOPS: 163.5K | 1.8GiB/s 1.107ms) IOPS: 115.3K | 4.5GiB/s (3.473ms) IOPS: 36.8K | 4.7GiB/s (3.357ms) IOPS: 38.1K | 4.6GiB/s (27.157ms) IOPS: 174.4K | 4.9GiB/s (25.682ms) IOPS: 5.0K |
| Crucial P510 1TB | 2.3GiB/s (0.837ms) IOPS: 152.2K | 2.3GiB/s (0.842ms) IOPS: 151.5K | 4.5GiB/s (3.450ms) IOPS: 37.1K | 4.8GiB/s (3.262ms) IOPS: 39.2K | 4.8GiB/s (26.2181ms) IOPS: 4.9K | 5.0GiB/s (25.121ms) IOPS: 5.1K |
| WD SN850X 2TB | 2.3GiB/s (0.736ms) IOPS: 173.2K | 2.0GiB/s (0.989ms) IOPS: 129.0K | 4.1GiB/s (3.878ms) IOPS: 33.3K | 4.0GiB/s (3.958ms) IOPS: 33.0K | 4.4GiB/s (30.501ms) IOPS: 4.5K | 4.1GiB/s (30.782ms) IOPS: 4.2K |
| WD SN5100 2TB | 2.3GiB/s (0.847ms) IOPS: 150.4K | 2.2GiB/s (0.877ms) IOPS: 145.4K | 3.8GiB/s (4.161ms) IOPS: 30.7K | 3.6GiB/s (4.318ms) IOPS: 29.6K | 4.1GiB/s (30.223ms) IOPS: 4.2K | 4.0GiB/s (30.981ms) IOPS: 4.1K |
Conclusion
Samsung’s 9100 Pro made a strong impression when we tested the 4TB version earlier this year. What the 8TB adds is scale. It doubles the maximum capacity while holding on to the same level of performance, consistency, and efficiency we saw in the smaller model.
In our benchmarks, the 8TB drive stayed right on target. It matched the 4TB in sequential throughput and, in some cases, edged slightly ahead in random write workloads. LLM load times and DirectStorage tests showed a close back and forth between the two capacities, but the differences were small enough that most users would never notice. The real takeaway is that Samsung scaled the drive to 8TB without hurting performance or introducing major thermal or power trade-offs.
Of course, the 8TB model is going to be expensive, and not everyone needs this much storage in a single M.2 slot. For professionals working with multi-terabyte datasets, creators with large 8K projects, or gamers who want to keep a massive library installed at once, it opens up possibilities that smaller drives cannot match. Even PlayStation 5 users can take advantage of it if they go with the heatsink version, though the thicker z-height of the 8TB design could be limiting in certain builds.
The bottom line is that Samsung proved the 9100 Pro can scale up in size without losing what made the 4TB model so impressive. The 4TB version still offers a great balance for enthusiasts, but the 8TB is the flagship option for power users who want to remove storage limits altogether. With improved efficiency over the 990 Pro, excellent endurance, and Samsung’s five-year warranty, the 9100 Pro series remains one of the strongest choices in the Gen5 SSD space.


 Amazon