

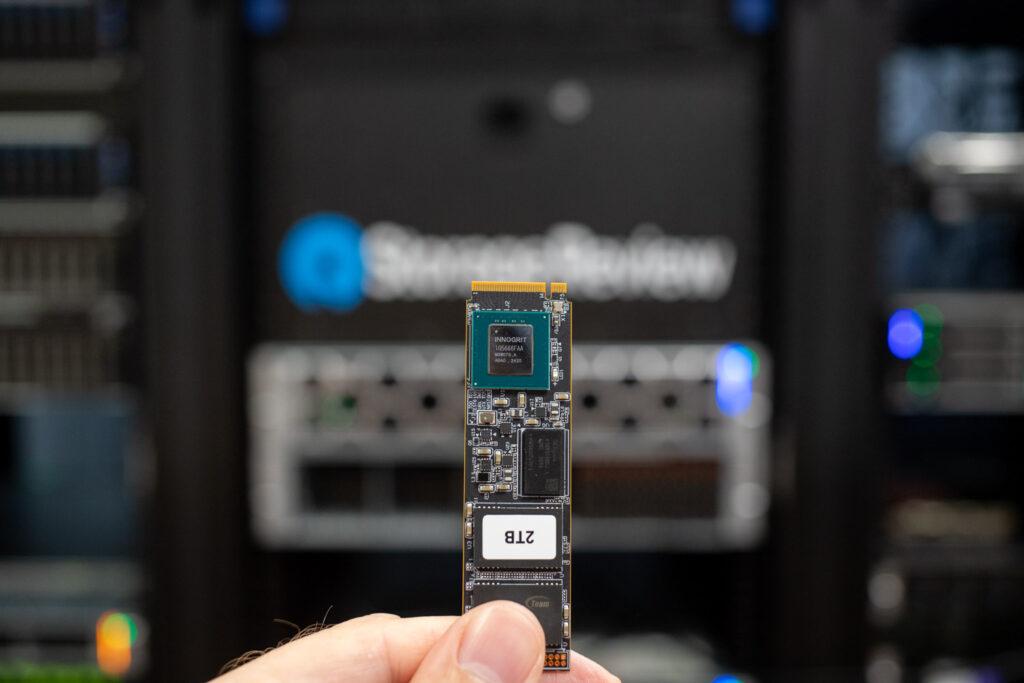
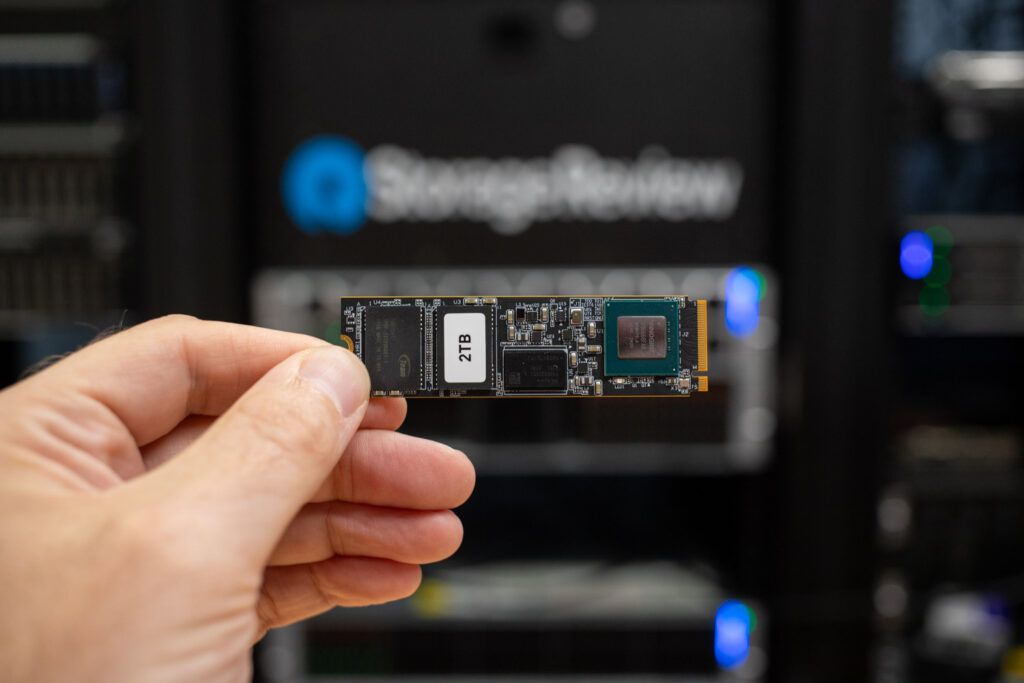
The TEAMGROUP T-Force GE Pro and GC Pro SSDs provide a distinctive gaming experience, thanks to their performance-enhancing multi-core architecture. These SSDs maintain consistent performance levels based on internal temperature, allowing for varying power consumption and operating modes, which improves efficiency. They feature the Innogrit IG5666 controller, which is said to adapt to different workloads and performance requirements.
The SSDs feature enhanced controller Data Security Isolation, ensuring a more complete data storage security process. Data Security Isolation prevents data alteration from malicious attackers from any external source. To enhance the product’s reliability, the GE Pro features built-in error correction technology. This ensures more accurate data usage and increased stability. The feature utilizes the 1/4 LDPC, which can extend the lifespan of SSDs.
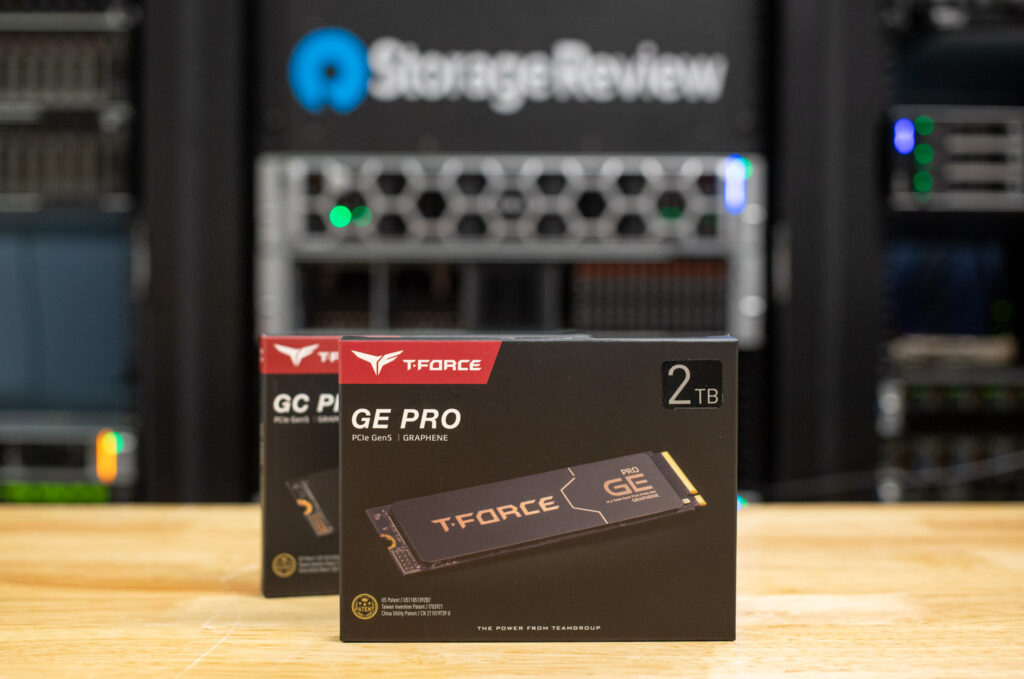
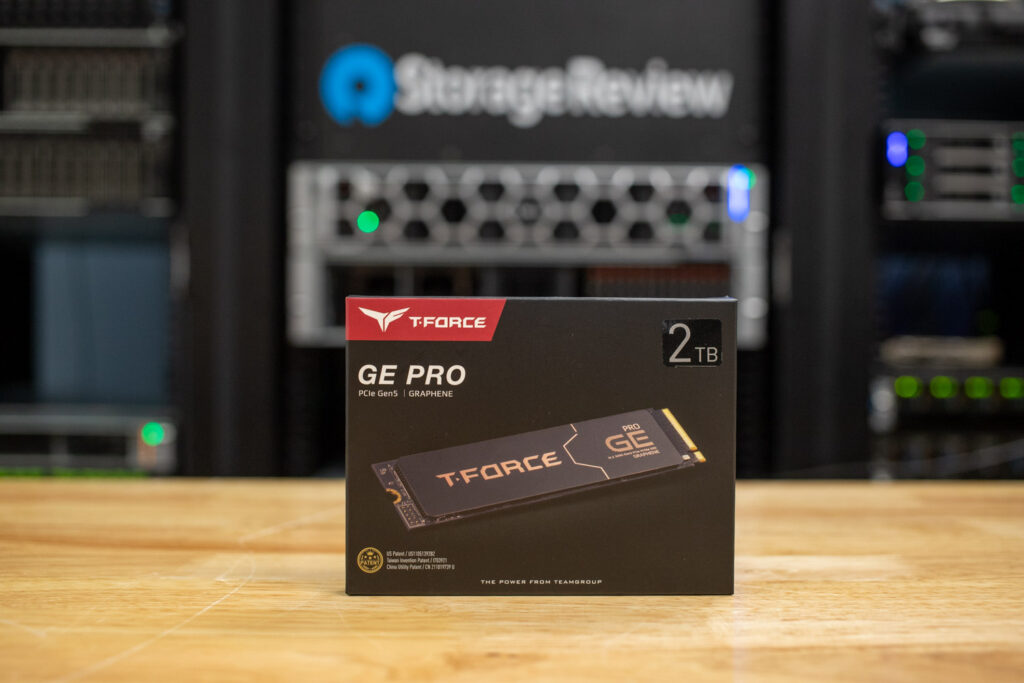
The GE Pro is available in four sizes: 1TB, 2TB, 4TB, and 8TB. The 1TB model has slightly lower sequential read and write speeds compared to the others. It delivers 11,700MB/s read and 9,500MB/s write speeds. The higher-capacity drives offer better performance, except for the 8TB drive, which achieves 13,500MB/s read and 11,000MB/s write speeds. The GE Pro 2TB and 4TB versions each deliver sequential read and write capacities of 14,000MB/s and 11,800MB/s, respectively. With those numbers, the 2TB or 4TB options would be a better choice for overall performance, price, and endurance. The GC Pro is also available in 2TB and 4TB sizes, each offering sequential read and write speeds of 12,500MB/s and 11,000MB/s.
The GE Pro and GC Pro are equipped with features that enhance data security and improve storage efficiency. Features such as SLC Cache, 3D NAND Flash, and DRAM Cache all contribute to keeping data moving quickly and reducing the likelihood of errors. Additional operations with the SSDs, such as wear leveling and trimming, assist the operating system by smoothing out and cleaning the data. These features enhance the efficiency of data flow by improving speeds, data security, and power usage.
TeamGroup GE PRO M.2 PCIe SSD Models
| Product | Capacity | Seq. Read | Seq. Write | TBW | AES-256 Hardware Encryption | Model Number |
|---|---|---|---|---|---|---|
| GE PRO M.2 PCIe SSD | 8 TB | up to 13,500 MB/s | up to 11,000 MB/s | 4800 TBW | YES | TM8FFS008T0C129 |
| GE PRO M.2 PCIe SSD | 4 TB | up to 14,000 MB/s | up to 11,800 MB/s | 2400 TBW | YES | TM8FFS004T0C129 |
| GE PRO M.2 PCIe SSD | 2 TB | up to 14,000 MB/s | up to 11,800 MB/s | 1200 TBW | YES | TM8FFS002T0C129 |
| GE PRO M.2 PCIe SSD | 1 TB | up to 11,700 MB/s | up to 9,500 MB/s | 600 TBW | YES | TM8FFS001T0C129 |
| GE PRO M.2 PCIe SSD | 8 TB | up to 13,500 MB/s | up to 11,000 MB/s | 4800 TBW | YES | TM8FG3008T0C133 |
| GE PRO M.2 PCIe SSD | 4 TB | up to 14,000 MB/s | up to 11,800 MB/s | 2400 TBW | YES | TM8FG3004T0C133 |
| GE PRO M.2 PCIe SSD | 2 TB | up to 14,000 MB/s | up to 11,800 MB/s | 1200 TBW | YES | TM8FG3002T0C133 |
| GE PRO M.2 PCIe SSD | 1 TB | up to 11,700 MB/s | up to 9,500 MB/s | 600 TBW | YES | TM8FG3001T0C133 |
General Product Specifications
| Interface | PCIe Gen5×4 with NVMe |
|---|---|
| Voltage | DC +3.3 V |
| Operating Temperature | 0 °C – 70 °C |
| Storage Temperature | –40 °C – 85 °C |
| Weight | 7 g |
| Dimensions | 80.0 × 22.0 × 3.9 mm (with Graphene heat sink) 77.0 × 24.7 × 62.3 mm (with AirFlow I heat sink) |
| Vibration | 80 Hz–2,000 Hz / 20 G |
| Shock | 1,500 G / 0.5 ms |
| MTBF | 1,700,000 Hours |
| Operating System Support | Windows 11 / 10 / 8.1 / 8 / 7 / Vista macOS 10.4 or later Linux 2.6.33 or later |
| Warranty | 5-year limited warranty |
Before diving into the benchmarks, here’s a list of comparable drives tested alongside the T-Force GE Pro/GC Pro and their respective PCIe generation:
- SanDisk SN8100 (PCIe Gen5)
- Kingston FURY Renegade G5 (PCIe Gen5)
- Samsung 9100 Pro (PCIe Gen5)
- SK hynix Platinum P51 (PCIe Gen5)
- Crucial T705 (PCIe Gen5)
- Lexar Professional NM1090 PRO (PCIe Gen5)
- PNY CS2150 (PCIe Gen5)
- Crucial P510 (PCIe Gen5)
- Samsung 990 Pro (PCIe Gen4)
- WD SN850X 2TB (PCIe Gen4)
For this review, we focus on the TEAMGROUP T-Force GE PRO M.2 PCIe SSD 2TB model. The T-Force GC PRO M.2 PCIe SSD 2TB model is also included.
We subjected these drives to various tests to evaluate their real-world and synthetic performance. This includes LLM load times to measure how quickly they handle large AI models, DirectStorage tests to assess how fast they load game assets and process in-game data, and Blackmagic Design tests to evaluate read and write speeds for high-resolution video editing. We’ll also run PCMark10 to gauge overall system responsiveness, 3DMark Storage to test gaming performance, and FIO tests to measure peak sequential and random read/write speeds under heavy workloads.
Here’s the high-performance test rig we used for benchmarking:
- CPU: AMD Ryzen 7 9800X3D
- Motherboard: Asus ROG Crosshair X870E Hero
- RAM: G.SKILL Trident Z5 Royal Series DDR5-6000 (2x16GB)
- GPU: NVIDIA GeForce RTX 4090
- OS: Windows 11 Pro, Ubuntu 24.10 Desktop
Peak Synthetic Performance
The FIO test is a flexible and powerful benchmarking tool used to measure the performance of storage devices, including SSDs and HDDs. It evaluates metrics such as bandwidth, IOPS, and latency under different workloads, like sequential and random read/write operations. This test helps to assess the peak performance of storage systems, making it useful for comparing different devices or configurations. We measured the peak burst performance for this test, limiting the workload to a 10GB footprint on both SSDs.
Here, the GE Pro delivers strong results that are very similar to those of the Lexar Professional NM1090 PRO, which consistently averages strong results. The sequential 128K reads reach 13,900MB/s with an average latency of 0.60ms. This places it in the middle range among other Gen5 competitors while still being able to keep up with drives like the SK hynix Platinum P51 or the Crucial T705. The sequential 128K Write score is impressive, with a speed of 12,800MB/s and an average latency of 0.65 ms. While these results are above average and demonstrate solid performance, they don’t quite match the top contenders on the list. The GC Pro features a sequential read speed of 13,600 MB/s and a write speed of 12,700MB/s. In comparison, the GE Pro is 300MB/s slower in read speed and 100MB/s slower in write speed. This difference is nearly indistinguishable, especially considering that both models have similar average response times, with latencies of 0.62 ms for reading and 0.66 ms for writing.
Where the GE Pro shines is in the 4K random workloads score, with results of 2.585 million IOPS for 4K reads and 18.18 million IOPS for 4K writes. While showing the same average score as the Lexar Professional NM1090 PRO, the 4K read result is impressive, being only 0.149 million IOPS behind the highest-performing competitor in that section, the Samsung 9100 Pro. The latencies for 4K read and write are similar to the Lexar SSD, with 0.23ms on random 4K read and 0.28 ms on random 4K write. The GC Pro continues the trend seen in 4K random read and write performance, achieving 2.110 million IOPS with an average read latency of 0.24ms, and 1.686 million IOPS with an average write latency of 0.28ms. It also performs slightly slower than its GE Pro counterpart in 128K read and write speeds.
| FIO Test (higher MB/s/IOPS is better) | Sequential 128K Read (1T/64Q) | Sequential 128K Write (1T/64Q) | Random 4K Read (16T/32Q) | Random 4K Write (16T/32Q) |
| SanDisk SN8100 | 15,000 MB/s (0.56ms avg latency) | 14,100 MB/s (0.59ms avg latency) | 2.312M IOPS (0.22ms avg latency) | 2.144M IOPS (0.24ms avg latency) |
| Kingston FURY Renegade G5 | 14,600 MB/s (0.57ms avg latency) | 14,100 MB/s (0.59ms avg latency) | 2.028M IOPS (0.25ms avg latency) | 2.028M IOPS (0.25ms avg latency) |
| Samsung 9100 Pro | 14,600 MB/s (0.57ms avg latency) | 13,300 MB/s (0.63ms avg latency) | 2.734M IOPS (0.18ms avg latency) | 2.734M IOPS (0.19ms avg latency) |
| SK hynix Platinum P51 | 14,500 MB/s (0.58ms avg latency) | 13,500 MB/s (0.62ms avg latency) | 2.369M IOPS (0.22ms avg latency) | 2.669M IOPS (0.19ms avg latency) |
| Crucial T705 | 14,400 MB/s (0.58ms avg latency) | 12,300 MB/s (0.68ms avg latency) | 1.585M IOPS (0.32ms avg latency) | 2.703M IOPS (0.19ms avg latency) |
| TEAMGROUP GE Pro 2TB | 13,900 MB/s (0.60ms avg latency) | 12,800 MB/s (0.65ms avg latency) | 2.585M IOPS (0.23ms avg latency) | 1.818M IOPS (0.28ms avg latency) |
| Lexar Professional NM1090 PRO | 13,800GB/s (0.61ms avg latency) | 13,600 MB/s (0.62ms avg latency) | 2.251M IOPS (0.23ms avg latency) | 1.818M IOPS (0.28ms avg latency) |
| TEAMGROUP GC Pro 2TB | 13,600 MB/s (0.62ms avg latency) | 12,700 MB/s (0.66ms avg latency) | 2.110M IOPS (0.24ms avg latency) | 1.686M IOPS (0.28ms avg latency) |
| PNY CS2150 | 10,400GB/s (0.80ms avg latency) | 8,801MB/s (0.95ms avg latency) | 1.379M IOPS (0.371ms avg latency) | 1.623 IOPS (0.32ms avg latency) |
| Crucial P510 | 8,835 MiB/s (0.90 ms avg latency) | 9,961 MB/s (0.80 ms avg latency) | 1.163M IOPS (0.44ms avg latency) | 1.196M IOPS (0.51ms avg latency) |
| Samsung 990 Pro | 7,483 MB/s (1.12ms avg latency) | 7,197 MB/s (1.16ms avg latency) | 1.400M IOPS (0.36ms avg latency) | 1.403M IOPS (0.36ms avg latency) |
| WD SN850X 2TB | 6,632 MB/s (0.76ms avg latency) | 7,235 MB/s (0.92ms avg latency) | 1.2M IOPS (0.43ms avg latency) | 825K IOPS (0.62ms avg latency) |
Average LLM Load Time
The Average LLM Load Time test evaluated the load times of three different LLMs: DeepSeek R1 7B, Meta Llama 3.2 11B, and DeepSeek R1 32B. Each model was tested 10 times, and the average load time was calculated. This test measures the drive’s ability to load large language models (LLMs) into memory quickly. LLM load times are critical for AI-related tasks, especially for real-time inference and extensive dataset processing. Faster loading enables the model to process data rapidly, thereby improving AI responsiveness and reducing waiting time.
The T-Force GE Pro posted relatively average results when compared to each competitor in all three of these measured tests. With the DeepSeek R1 7B model, the GE Pro’s average time of 2.91 seconds places it roughly 0.3 seconds faster than the highest measured time of the Lexar Pro and about 0.35 seconds slower than the SK hynix’s lowest average time. It performed well in the 11B model, with an average time of 3.91 seconds, which is slower than most of the other SSDs in our test group.
Being mere hundredths of seconds slower than the GE Pro in 2 categories, the GC Pro provides a similar consistent performance under all three loads. Processing data as quickly as 2.9379s in the 7B model, 3.9267s in the 11B model, and 4.8188s in the 32B model, which ends up being 0.0786s faster under the largest workload, illustrating that the GC Pro can keep up with its GE counterpart in this LLM load time benchmark.
| Average LLM Load Time (lower is better) | DeepSeek R1 7B | Meta Llama 3.2 11B Vision | DeepSeek R1 32B |
| SK hynix Platinum P51 | 2.5481s | 3.5809s | 4.1790s |
| SanDisk SN8100 | 2.5702s | 3.5856s | 4.2870s |
| Samsung 9100 Pro 4TB | 2.6173s | 3.6017s | 4.3735s |
| PNY CS2150 | 2.8107s | 3.6820s | 4.8962s |
| Crucial T705 2TB | 2.8758s | 3.6312s | 5.1080s |
| Samsung 990 Pro 2TB | 2.8758s | 3.6312s | 5.1080s |
| Crucial P510 1TB | 2.8817s | 3.6631s | 5.0594s |
| TEAMGROUP GE Pro 2TB | 2.9092s | 3.9136s | 4.8974s |
| TEAMGROUP GC Pro 2TB | 2.9379s | 3.9267s | 4.8188s |
| WD SN850X 2TB | 3.0082s | 3.6543s | 5.4844s |
| Kingston FURY Renegade G5 | 3.1843s | 4.8009s | 4.6523s |
| Lexar Professional NM1090 PRO | 3.2135s | 4.9504s | 7.2108s |
3DMark Direct Storage
The 3DMark DirectStorage Feature Test evaluates how Microsoft’s DirectStorage optimizes game asset loading on PCIe SSDs. By reducing CPU overhead and improving data transfer speeds, DirectStorage enhances loading times, especially when paired with GDeflate compression and Windows 11’s BypassIO. This test isolates storage performance to highlight the potential bandwidth improvements when DirectStorage is enabled.
Here, the GE pro delivers decent performance, with many of the compared speeds ranging from below average to competitive with other Gen5 competitors. With its compressed asset transfer rate to VRAM of 24.7GB/s, which comes very close to the Gen5 leaders, it still lags. While the GE Pro sits near the top of the list, the GC Pro is not as closely paired with its GE counterpart, achieving a 22.94GB/s compressed asset transfer rate to VRAM.
In uncompressed transfers with DirectStorage enabled, the GE Pro achieves 10.19GB/s, which is on the lower end of our dataset, comparable to the Kingston FURY G5. With DirectStorage disabled, it performs at the same rate as the others, reaching 7.49GB/s. The GC Pro, although not providing as high a transfer speed, still produces relatively decent numbers, reaching 9.46GB/s to VRAM with DS enabled and 7.13GB/s to VRAM with DS disabled. This was not as severe a drop with DirectStorage disabled as we saw in the GE Pro.
The RAM transfer speed shows a similar story for both the GE Pro and GC Pro, as both produced average speeds of 11.33GB/s (GE Pro) and 10.71GB/s(GC Pro) with DirectStorage on, and with DirectStorage off, 9.35GB/s (GE Pro) and 8.14GB/s (GC Pro). These results are competitive with those of the other Gen5 units and do not reveal any glaring downsides. The GDeflate Decompression Bandwidth of 65.05GB/s (GE Pro) is comfortably above the tested average, while 63.80GB/s (GC Pro) is still slightly below average; however, it is not terrible.
| 3DMark Direct Storage, (GB/s, higher is better) | Storage to VRAM (GDeflate Compression) | Storage to VRAM (DirectStorage on, Uncompressed) | Storage to VRAM (DirectStorage off, Uncompressed) | Storage to RAM (DirectStorage on, Uncompressed) | Storage to RAM (DirectStorage off, Uncompressed) | GDeflate Decompression Bandwidth |
| SK hynix Platinum P51 | 26.32 | 11.20 | 7.75 | 12.85 | 9.46 | 64.68 |
| SanDisk SN8100 | 26.11 | 12.94 | 7.63 | 12.94 | 9.78 | 64.51 |
| Crucial T705 2TB | 25.75 | 10.71 | 8.79 | 12.03 | 8.83 | 66.36 |
| TEAMGROUP GE Pro 2TB | 24.70 | 10.19 | 7.49 | 11.33 | 9.35 | 65.05 |
| Lexar Professional NM1090 PRO | 24.03 | 11.23 | 7.57 | 12.18 | 8.72 | 63.15 |
| Samsung 9100 Pro 4TB | 23.77 | 11.26 | 8.92 | 11.62 | 9.48 | 66.61 |
| Kingston FURY Renegade G5 | 23.29 | 10.03 | 7.44 | 11.81 | 9.63 | 65.79 |
| TEAMGROUP GC Pro 2TB | 22.94 | 9.46 | 7.13 | 10.71 | 8.14 | 63.80 |
| PNY CS2150 | 19.49 | 8.60 | 6.98 | 9.22 | 7.70 | 62.43 |
| WD SN850X 2TB | 15.28 | 11.11 | 8.93 | 6.78 | 6.27 | 64.96 |
| Samsung 990 Pro 2TB | 14.18 | 11.28 | 8.84 | 6.57 | 6.20 | 65.71 |
| Crucial P510 1TB | 19.63 | 8.33 | 6.92 | 9.06 | 7.49 | 66.22 |
Blackmagic Disk Speed Test
The Blackmagic Disk Speed Test benchmarks a drive’s read and write speeds, estimating its performance, especially for video editing tasks. It helps users ensure their storage is fast enough for high-resolution content, like 4K or 8K video.
The T-Force GE Pro results yield a below-average read speed of 6933.6MB/s, placing it just above the PNY CS2150 and below the Crucial P510 1TB in read performance. The tested write speed reaching 8700.6MB/s is similarly under-performing compared to the top Gen5 competitors in this list. It is a significant step up from some of the other compared drives and will still be suitable for some demanding workloads. Again, seeing the GC Pro sit slightly lower in the results with 6476.8MB/s read and 7796.8MB/s write. It is a step slower that might not be easily noticed by most for typical everyday workloads.
| Blackmagic Disk Speed (MB/s, higher is better) | Read MB/s | Write MB/s |
| SanDisk SN8100 | 10,005.2 | 10,581.0 |
| Kingston FURY Renegade G5 | 9,665.0 | 10,831.0 |
| Samsung 9100 Pro 4TB | 9,542.3 | 9,907.9 |
| SK hynix Platinum P51 | 9,241.0 | 9,109.0 |
| Lexar Professional NM1090 PRO | 9,149.2 | 10,466.6 |
| Crucial T705 2TB | 8,464.2 | 10,256.4 |
| Crucial P510 1TB | 7,853.9 | 7,939.6 |
| TEAMGROUP GE Pro 2TB | 6933.6 | 8700.6 |
| PNY CS2150 | 6,625.5 | 7,299.5 |
| TEAMGROUP GC Pro 2TB | 6476.8 | 7,796.8 |
| WD SN850X 2TB | 5,862.6 | 5,894.8 |
| Samsung 990 Pro 2TB | 5,769.5 | 5,842.9 |
PCMark 10 Storage Benchmark
PCMark 10 Storage Benchmarks evaluate real-world storage performance using application-based traces. It tests system and data drives, measuring bandwidth, access times, and consistency under load. These benchmarks offer practical insights beyond synthetic tests, enabling users to compare modern storage solutions effectively.
T-Force GE Pro achieved an overall score of 6957, placing it in the bottom half, hovering around Gen4 scores, and just behind the Samsung 990 Pro 2TB and 4TB. This result is not competitive when compared to the scores of the other SSDs in the group. In this scenario, the GC Pro performed with an overall score higher than the GE Pro, at a value of 7648. This indicates that the GC Pro will be more consistent, have faster access times, and a higher bandwidth on average than the GE Pro.
| PCMark 10 Data Drive (higher is better) | Overall Score |
| Crucial T705 2TB | 8,783 |
| SK hynix Platinum P51 | 8,665 |
| SanDisk SN8100 | 8,644 |
| Lexar Professional NM1090 PRO | 8,247 |
| Kingston FURY Renegade G5 | 8,062 |
| TEAMGROUP GC Pro 2TB | 7,648 |
| Samsung 9100 Pro 4TB | 7,552 |
| Samsung 990 Pro 2TB | 7,173 |
| TEAMGROUP GE Pro 2TB | 6,957 |
| Crucial P310 2TB | 6,436 |
| PNY CS2150 | 6,070 |
| WD SN850X 2TB | 4,988 |
3DMark Storage
The 3DMark Storage Benchmark tests your SSD’s gaming performance by measuring tasks like loading games, saving progress, installing game files, and recording gameplay. It evaluates how well your storage handles real-world gaming activities and supports the latest storage technologies for accurate performance insights.
The T-Force GE Pro’s overall score from this test was 4380, placing it just below the average of the tested drives. Although it trailed many of the other drives, it achieved a slightly higher score than the Crucial P510 1TB. Similarly, the GC Pro places itself right behind some of the higher scores, with a comparably better score, 4713, than the GE Pro. This illustrates that GC Pro will perform tasks such as loading, saving, and installing games more efficiently.
| 3DMark Storage benchmark (higher is better) | Overall Score |
| SanDisk SN8100 | 6,047 |
| Kingston FURY Renegade G5 | 5,670 |
| Crucial T705 2TB | 5,100 |
| SK hynix Platinum P51 | 5,082 |
| Lexar Professional NM1090 PRO | 4,828 |
| Samsung 9100 Pro 4TB | 4,779 |
| TEAMGROUP GC Pro 2TB | 4,713 |
| TEAMGROUP GE Pro 2TB | 4,380 |
| Crucial P510 1TB | 4,148 |
| PNY CS2150 | 4,193 |
| Samsung 990 Pro 2TB | 4,128 |
| WD SN850X 2TB | 3,962 |
| Crucial P310 2TB | 3,848 |
GPU Direct Storage
One of the tests we conducted on this testbench was the Magnum IO GPU Direct Storage (GDS) test. GDS is a feature developed by NVIDIA that allows GPUs to bypass the CPU when accessing data stored on NVMe drives or other high-speed storage devices. Instead of routing data through the CPU and system memory, GDS enables direct communication between the GPU and the storage device, significantly reducing latency and improving data throughput.
How GPU Direct Storage Works
Traditionally, when a GPU processes data stored on an NVMe drive, the data must first travel through the CPU and system memory before reaching the GPU. This process introduces bottlenecks, as the CPU becomes a middleman, adding latency and consuming valuable system resources. GPU Direct Storage eliminates this inefficiency by enabling the GPU to access data directly from the storage device via the PCIe bus. This direct path reduces the overhead associated with data movement, allowing faster and more efficient data transfers.
AI workloads, especially those involving deep learning, are highly data-intensive. Training large neural networks requires processing terabytes of data, and any delay in data transfer can lead to underutilized GPUs and longer training times. GPU Direct Storage addresses this challenge by ensuring that data is delivered to the GPU as quickly as possible, minimizing idle time and maximizing computational efficiency.
In addition, GDS is particularly beneficial for workloads that involve streaming large datasets, such as video processing, natural language processing, or real-time inference. By reducing the reliance on the CPU, GDS accelerates data movement and frees up CPU resources for other tasks, further enhancing overall system performance.
Results
The T-Force GE Pro and GC Pro showed the lowest performance results across five of the six block size categories. For 16K block sizes at high queue depth, they achieved 0.8 GiB/s read and 1.0 GiB/s write for the GE Pro, and 0.8 GiB/s read and 1.0 GiB/s write for the GC Pro, which are by far the worst results comparing it to all the competitors by anywhere from 0.5 GiB’s to almost 3.0 GiB/s slower for the top Gen5 performers. Between each other, the GE Pro operates only slightly faster than the GC Pro in 16K read and write.
At the 128K block size, performance remains substantially more sluggish at a read of 2.8 GiB/s and write of 2.1GiB/s, and a read of 2.7 GiB/s and write of 2.4GiB/s. These speeds of 1-3 GiB/s are slower than those of the higher performers.
For the large 1M blocks, the GE Pro hits 4.2 GiB/s in reads and 2.7 GiB/s in writes. The 1M read block size is the only category that shows comparable numbers, despite being the second slowest in the group. The GE Pro write speed, however, drops by almost half, while the competitors’ write speeds stay within a range of 0 to 0.5 GiB/s less than their respective read speeds, showing a drop of 1.5 GiB/s. This doesn’t seem ideal for many workloads of 1M or more blocks, making the 128K block workloads the most suitable for the GE Pro. However, the GC Pro has 3.7GiB/s reads and writes, maintaining a consistency even with the higher 1M block size, unlike the GE Pro.
Here’s the full run-down:
| GDSIO Chart (16K,128K,1M Block Size Averages) | (16K Block Size 128 IO Depth) Average Read | (16K Block Size 128 IO Depth) Average Write | (128K Block Size 128 IO Depth) Average Read | (128K Block Size 128 IO Depth) Average Write | (1M Block Size 128 IO Depth) Average Read | (1M Block Size 128 IO Depth) Average Write |
| Kingston FURY Renegade G5 | 3.7 GiB/s (0.526ms) IOPS: 242.1K | 2.4 GiB/s (0.824ms) IOPS: 154.7K | 5.9 GiB/s (2.704ms) IOPS: 48.5K | 5.8 GiB/s (0.564ms) IOPS: 47.3K | 6.5 GiB/s (19.356ms) IOPS: 6.6K | 6.3 GiB/s (19.690ms) IOPS: 6.5K |
| Lexar Professional NM1090 PRO | 3.6 GiB/s (0.533ms) IOPS: 238.7K | 2.3 GiB/s (0.845ms) IOPS: 150.8K | 5.9 GiB/s (2.639ms) IOPS: 48.4K | 4.2 GiB/s (3.714ms) IOPS: 34.4K | 6.5 GiB/s (19.274ms) IOPS: 6.6K | 6.2 GiB/s (20.127ms) IOPS: 6.4K |
| SanDisk SN8100 | 3.4 GiB/s (0.564ms) IOPS: 225.9K | 2.1 GiB/s (0.907ms) IOPS: 140.6K | 5.9 GiB/s (2.626ms) IOPS: 48.7K | 5.8 GiB/s (2.668ms) IOPS: 47.9K | 6.5 GiB/s (19.264ms) IOPS: 6.6K | 5.9 GiB/s (21.063ms) IOPS: 6.1K |
| Samsung 9100 Pro 4TB | 3.4 GiB/s (0.565ms) IOPS: 226.4K | 2.3 GiB/s (0.839ms) IOPS: 161.7K | 5.2 GiB/s (3.001ms) IOPS: 44.9K | 5.9 GiB/s (2.662ms) IOPS: 47.3K | 6.3 GiB/s (19.877ms) IOPS: 6.4K | 6.1 GiB/s (20.579ms) IOPS: 6.2K |
| Crucial T705 2TB | 3.3 GiB/s (0.587ms) IOPS: 217.0K | 2.3 GiB/s (0.836ms) IOPS: 152.6K | 5.5 GiB/s (2.863ms) IOPS: 44.7K | 5.6 GiB/s (2.799ms) IOPS: 45.7K | 6.0 GiB/s (20.738ms) IOPS: 6.2K | 6.0 GiB/s (20.855ms) IOPS: 6.1K |
| SK hynix Platinum P51 | 3.1 GiB/s (0.634ms) IOPS: 200.9K | 1.5 GiB/s (1.314ms) IOPS: 97.2K | 5.6 GiB/s (2.781ms) IOPS: 46.0K | 3.9 GiB/s (4.014ms) IOPS: 31.9K | 6.2 GiB/s (20.126ms) IOPS: 6.4K | 4.2 GiB/s (29.576ms) IOPS: 4.3K |
| Samsung 990 Pro 2TB | 2.7 GiB/s (0.731ms) IOPS: 174.4K | 2.2 GiB/s (0.903ms) IOPS: 141.2K | 4.0 GiB/s (3.944ms) IOPS: 32.4K | 4.1 GiB/s (3.849ms) IOPS: 33.2K | 3.9 GiB/s (32.415ms) IOPS: 3.9K | 4.2 GiB/s (29.520ms) IOPS: 4.3K |
| PNY CS2150 | 2.5 GiB/s (0.779ms) IOPS: 163.5K | 1.8 GiB/s 1.107ms) IOPS: 115.3K | 4.5 GiB/s (3.473ms) IOPS: 36.8K | 4.7 GiB/s (3.357ms) IOPS: 38.1K | 4.6 GiB/s (27.157ms) IOPS: 174.4K | 4.9 GiB/s (25.682ms) IOPS: 5.0K |
| Crucial P510 | 2.3 GiB/s (0.837ms) IOPS: 152.2K | 2.3 GiB/s (0.842ms) IOPS: 151.5K | 4.5 GiB/s (3.450ms) IOPS: 37.1K | 4.8 GiB/s (3.262ms) IOPS: 39.2K | 4.8 GiB/s (26.218ms) IOPS: 4.9K | 5.0 GiB/s (25.121ms) IOPS: 5.1K |
| WD SN850X | 2.3 GiB/s (0.736ms) IOPS: 173.2K | 2.0 GiB/s (0.989ms) IOPS: 129.0K | 4.1 GiB/s (3.878ms) IOPS: 33.3K | 4.0 GiB/s (3.958ms) IOPS: 33.0K | 4.4 GiB/s (30.501ms) IOPS: 4.5K | 4.1 GiB/s (30.782ms) IOPS: 4.2K |
| TEAMGROUP GE PRO 2TB | 0.8 GiB/s (2.464ms) IOPS: 51.8K | 1.0 GiB/s (1.913ms) IOPS: 68.8K | 2.8 GiB/s (5.627ms) IOPS: 22.7K | 2.1 GiB/s (7.309ms) IOPS: 17.5K | 4.2 GiB/s (29.599ms) IOPS: 4.3K | 2.7 GiB/s (49.915ms) IOPS: 2.7K |
| TEAMGROUP GC PRO 2TB | 0.8 GiB/s (2.589ms) IOPS: 49.3K | 1.0 GiB/s (1.899ms) IOPS: 67.3K | 2.7 GiB/s (5.860ms) IOPS: 21.8K | 2.4 GiB/s (6.636ms) IOPS: 19.3K | 3.7 GiB/s (34.007ms) IOPS: 3.8K | 3.7 GiB/s (33.414ms) IOPS: 3.8K |
Conclusion
Overall, the TeamGroup T-Force GE Pro and GC Pro are PCIe Gen5 SSDs that deliver slightly below average performance. While not the strongest SSDs in the space, they offer decent mainstream performance, leaving ample room for improvement in more demanding use cases, such as AI tasks.
Across every test, the GE Pro/GC Pro results were average to below average in most categories when compared to the Gen5 and Gen4 competitors. Showing average performance in sequential FIO tests and somewhat worse performance relatively during the LLM model test, where it could not keep up with many of the top performers. The GE Pro and GC Pro don’t stack up well against the others in key areas, such as GPU Direct storage, general read and write performance, and PCMark 10 responsiveness. And, they struggled during the GDSIO tests with smaller blocksize workloads.
The TEAMGROUP GE Pro and GC Pro are suitable for most mainstream uses, provided the price is competitive; however, buyers should look elsewhere for more intensive use cases.


 Amazon