

Crucial continues its Gen5 SSD push with the launch of the T710, its third-generation PCIe Gen5 NVMe drive, following the T700 and T705. Available with and without heatsink variants, the T710 is a single-sided M.2 2280 drive aimed at gamers, creators, and high-performance desktop and laptop users. With tighter thermals, improved power efficiency, and updated firmware, it’s designed to strike a better balance between speed, heat, and energy draw than its predecessors.
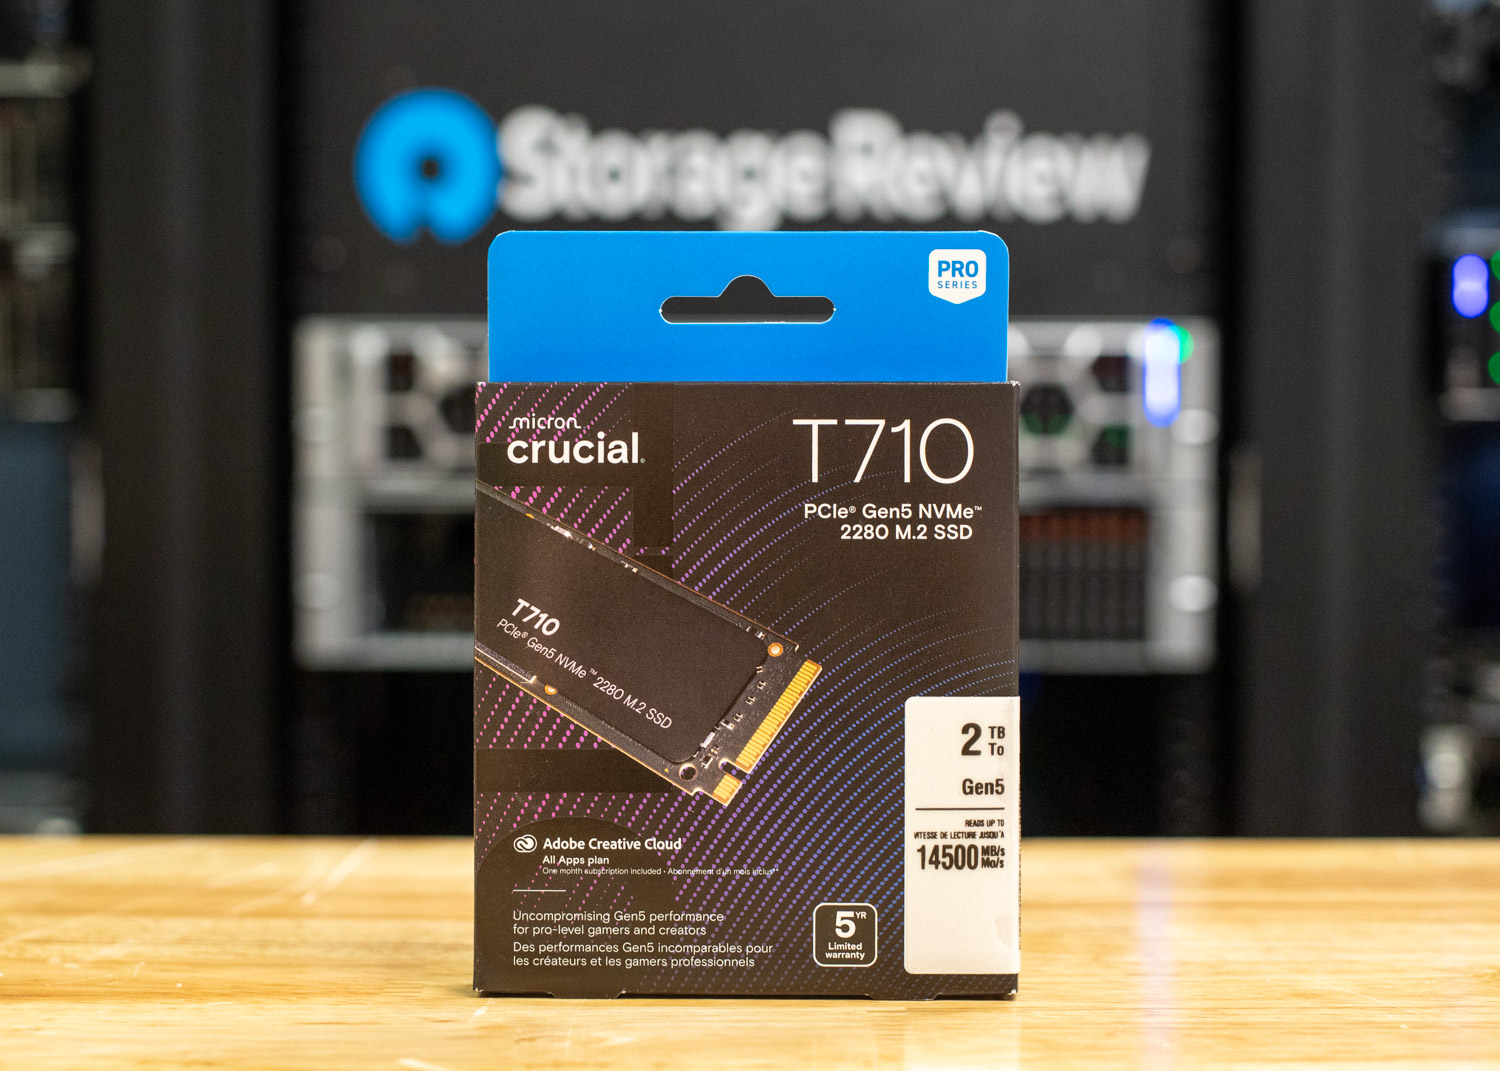
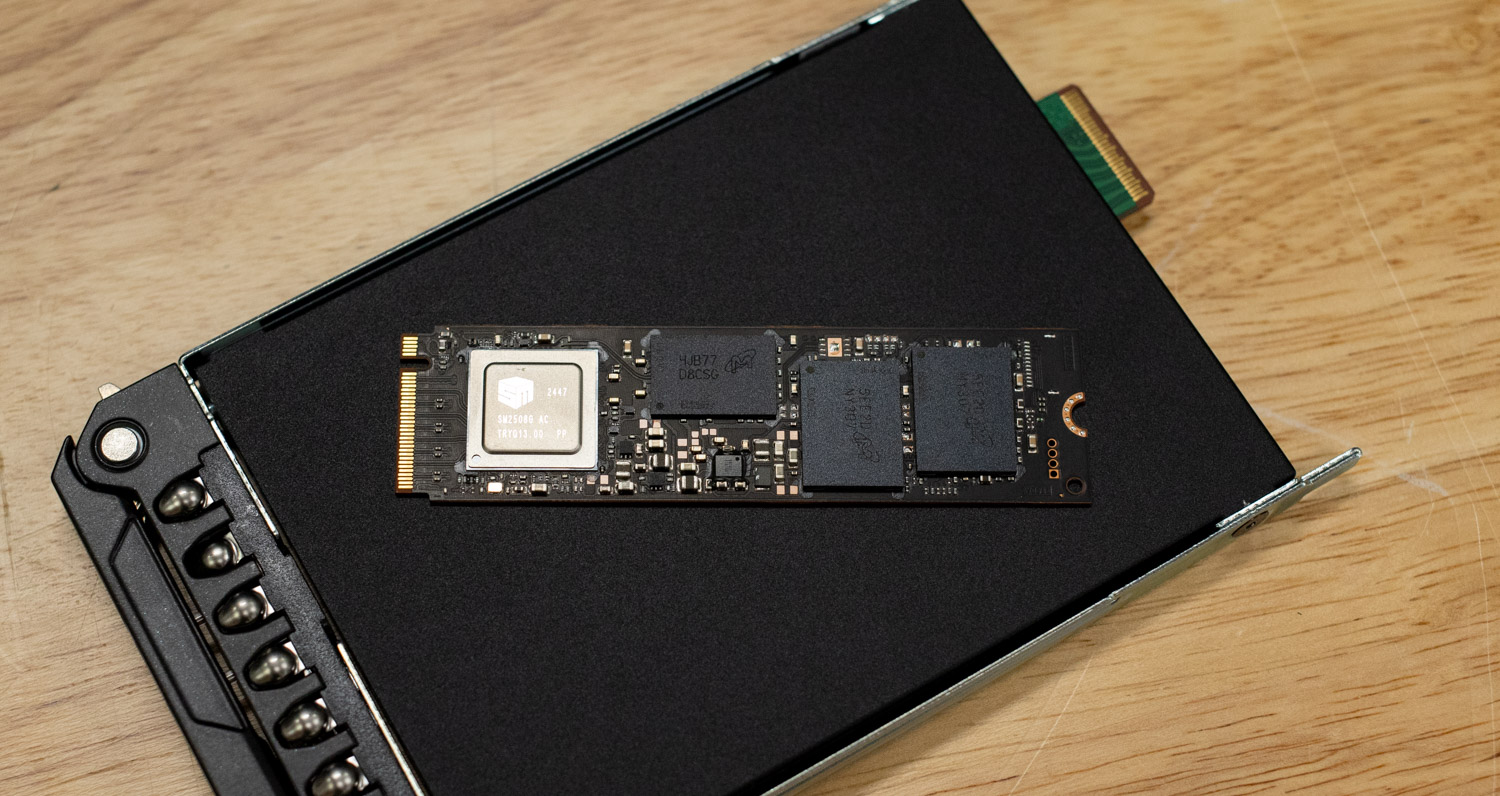
Paired with a Silicon Motion SM2508 Gen5 controller, the Crucial T710 features Micron’s latest 232-layer TLC NAND (G9 generation) operating at 3.6 GT/s, with firmware enhancements specifically tuned for Gen5 performance. Sequential speeds are now quoted to reach up to 14,900MB/s for reads and 13,800MB/s for writes, depending on the capacity. The 4TB model reaches 14,500MB/s and 13,800MB/s, respectively. Random performance varies by SKU, scaling up to 2.2 million IOPS for reads and 2.3 million IOPS for writes. This places the Crucial T710 firmly among the top Gen5 drives currently available. Compared to the T705, Micron claims improvements of 28% in random reads, 42% in random writes, and up to 9% in sequential throughput. These gains are quite significant, though, as always, we will verify those claims in the benchmarking section below.
The drive is offered in 1TB, 2TB, and 4TB capacities, all sharing the same basic architecture. Endurance scales with size, starting at 600TBW for the 1TB and doubling at each tier to 2,400TBW for the 4TB. Despite the jump in performance, Crucial says the T710 draws 24% less average power than their earlier Gen5 models, which could help keep fan speeds (and noise) down in desktop systems, or extend battery life in mobile ones. This efficiency gain makes the T710 a more suitable option for compact builds.
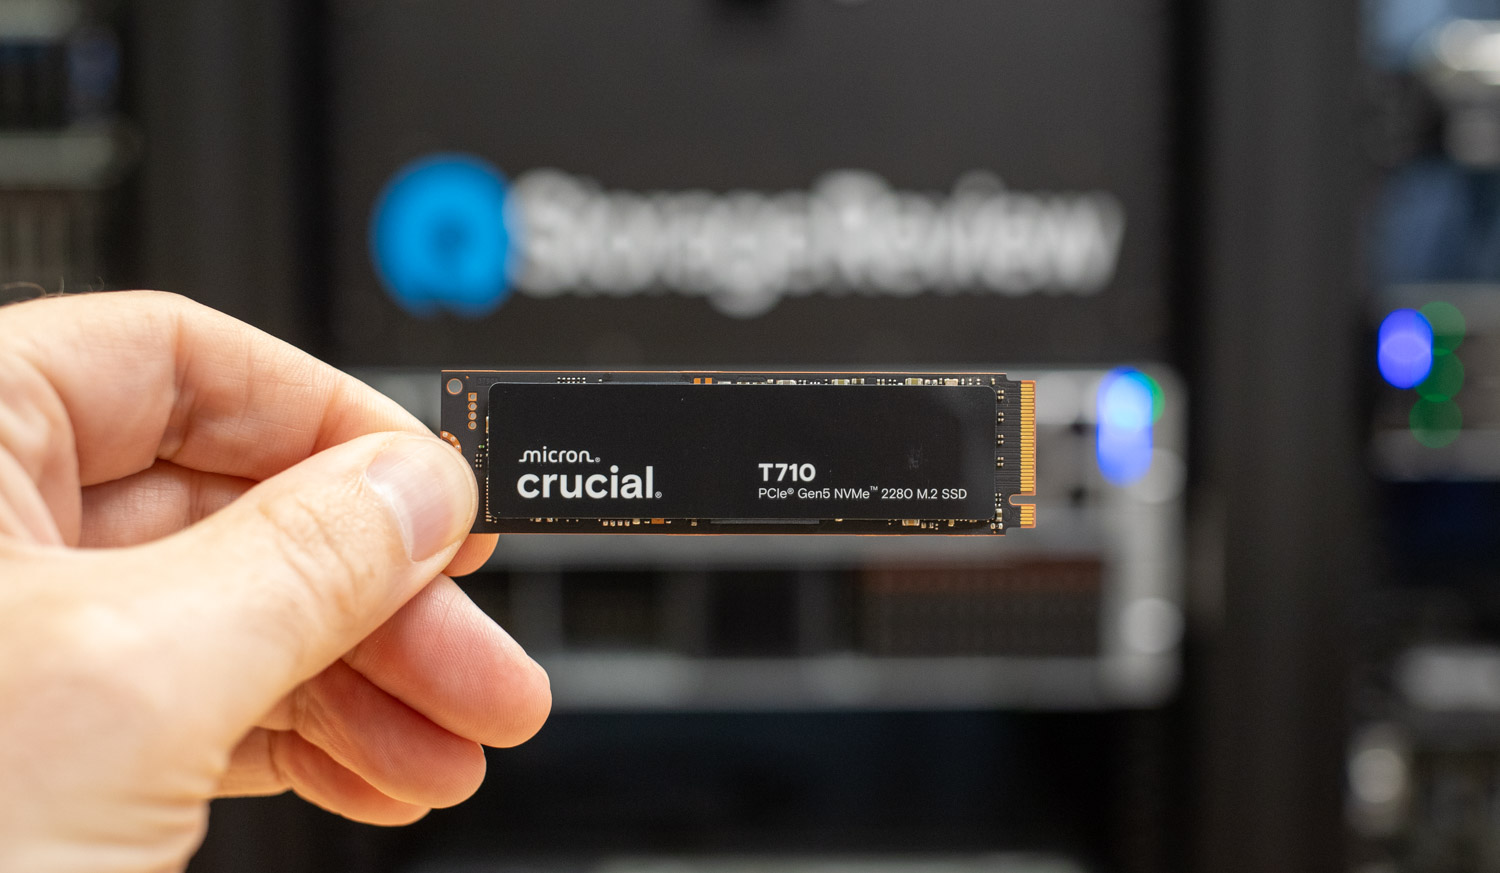
The heatsink version is low-profile and compatible with the PlayStation 5. Moreover, Crucial also includes support for Microsoft’s DirectStorage, SMART monitoring, thermal protection, integrated power-loss immunity, and AES-256 encryption via TCG Opal 2.01 or later. All versions support NVMe low-power states, including L1.2. This feature set makes the T710 a practical choice for both enthusiasts looking for high-end speed and professionals who prioritize data security and consistent responsiveness under demanding workloads.
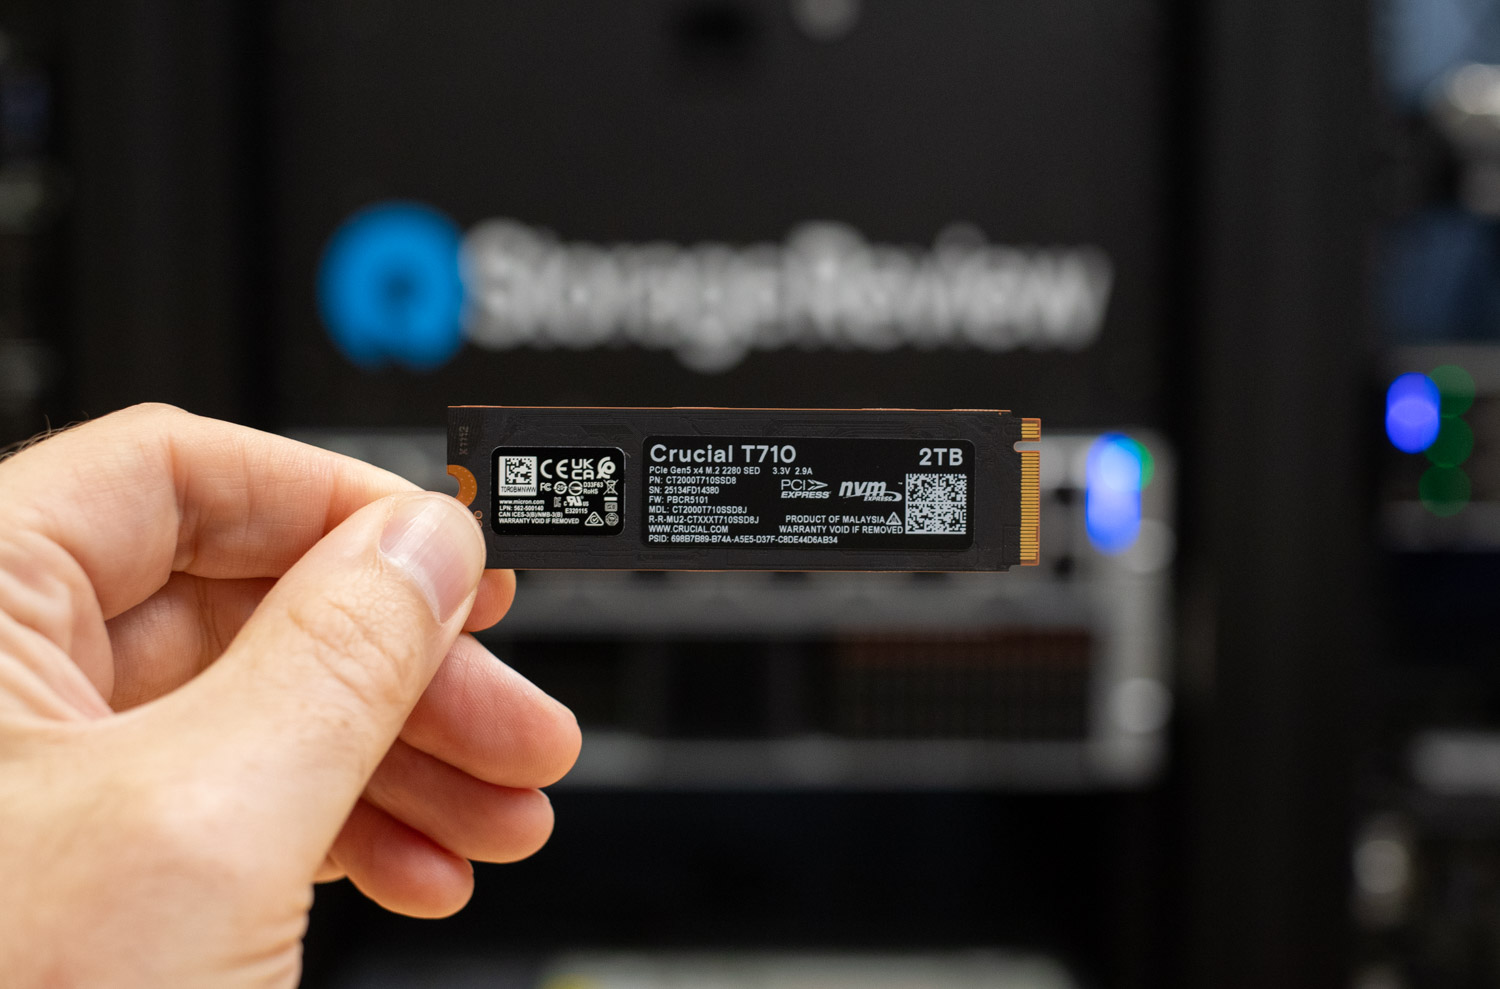
Backed by a 5-year limited warranty, the Crucial T710 comes with competitive pricing across its three capacities. The standard 1TB model is priced at $179.99, while the 2TB and 4TB models are priced at $279.99 and $549.99, respectively. For those looking to simplify thermal management or install the drive in a PlayStation 5, heat sink-equipped versions are available for a small premium: $199.99 for 1TB, $299.99 for 2TB, and $569.99 for 4TB. In this article, we will be reviewing the 2TB model.
Crucial T710 Specifications
| Specification | Detail |
| Form Factor | M.2 2280 (with and without heatsink options) |
| Interface | PCIe Gen5 x4, NVMe 2.0 |
| Controller | Silicon Motion SM2508 |
| NAND | Micron 232-layer TLC NAND |
| DRAM | LPDDR4 DRAM |
| Capacities | 1TB, 2TB, 4TB |
| Sequential Read (Max) |
|
| Sequential Write (Max) | Up to 13,700MB/s (1TB) Up to 13,800MB/s (2TB/4TB) |
| Random Read (4KB, QD256) |
|
| Random Write (4KB, QD256) |
|
| Endurance (TBW) | 1TB – 600TBW 2TB – 1,200TBW 4TB – 2,400TBW |
| MTTF | 1.5 million hours |
| Operating Temperature | 0°C to 70°C |
| Heatsink Option | Yes, with integrated heatsink for Gen5-ready desktops |
| Warranty | 5-Year Limited Warranty |
Crucial T710 Performance
Before diving into the benchmarks, here’s a list of comparable Gen5 drives tested alongside a 2TB Crucial T710, along with a few Gen4 SSDs:
- Phison E28 (Reference design)
- PNY CS2150
- Lexar Professional NM1090 PRO
- SK hynix Platinum P51
- Kingston FURY Renegade G5
- SanDisk WD_BLACK SN8100
- Crucial T705
- Crucial P510
- Samsung 9100 Pro
- Samsung 990 Pro (PCIe Gen4)
- WD SN850X (PCIe Gen4)
We subjected these drives to various tests to evaluate their real-world and synthetic performance. This includes LLM load times to measure how quickly they handle large AI models, DirectStorage tests to assess how fast they load game assets and process in-game data, and BlackMagic Design tests to evaluate read and write speeds for high-resolution video editing. We’ll also run PCMark 10 to gauge overall system responsiveness, 3DMark Storage to test gaming performance, and FIGO tests to measure peak sequential and random read/write speeds under heavy workloads.
Here’s the high-performance test rig we used for benchmarking:
- CPU: AMD Ryzen 7 9800X3D
- Motherboard: Asus ROG Crosshair X870E Hero
- RAM: G.SKILL Trident Z5 Royal Series DDR5-6000 (2x16GB)
- GPU: NVIDIA GeForce RTX 4090
- OS: Windows 11 Pro, Ubuntu 24.10 Desktop
Peak Synthetic Performance
The FIO test is a flexible and powerful benchmarking tool used to measure the performance of storage devices, including SSDs and HDDs. It evaluates metrics such as bandwidth, IOPS (Input/Output Operations Per Second), and latency under different workloads, like sequential and random read/write operations. This test helps to assess the peak performance of storage systems, making it useful for comparing different devices or configurations. We measured the peak burst performance for this test, limiting the workload to a 10GB footprint on both SSDs.
The Crucial T710 performed well in our FIO benchmarks. In sequential reads, it surpasses the earlier T705 by matching its 14,400MB/s speed at a slightly lower latency of 0.58 ms. For sequential writes, it spikes to 13,500MB/s, which significantly outpaces the T705’s 12,300 MB/s and nearly closes the gap on top Gen5 drives. In random 4K read/write tests, the T710 achieves approximately 2.27 million reads and 2.31 million writes, delivering significantly stronger read IOPS than the T705 (1.59 million) and substantially improving write performance. Latency remains low (about 0.23ms for reads and 0.22ms for writes).
| FIO Test (higher MB/s/IOPS is better) | Sequential 128K Read (1T/64Q) | Sequential 128K Write (1T/64Q) | Random 4K Read (16T/32Q) | Random 4K Write (16T/32Q) |
| SanDisk SN8100 | 15,000MB/s (0.56ms avg latency) | 14,100MB/s (0.59ms avg latency) | 2.312M IOPS (0.22ms avg latency) | 2.144M IOPS (0.24ms avg latency) |
| Kingston FURY Renegade G5 | 14,600MB/s (0.57ms avg latency) | 14,100MB/s (0.59ms avg latency) | 2.028M IOPS (0.25ms avg latency) | 2.028M IOPS (0.25ms avg latency) |
| Samsung 9100 Pro | 14,600MB/s (0.57ms avg latency) | 13,300MB/s (0.63ms avg latency) | 2.734M IOPS (0.18ms avg latency) | 2.734M IOPS (0.19ms avg latency) |
| SK hynix Platinum P51 | 14,500MB/s (0.58ms avg latency) | 13,500MB/s (0.62ms avg latency) | 2.369M IOPS (0.22ms avg latency) | 2.669M IOPS (0.19ms avg latency) |
| Crucial T710 | 14,400MB/s (0.58ms avg latency) | 13,500MB/s (0.62ms avg latency) | 2.265M IOPS (0.23ms avg latency) |
2.306M IOPS (0.22ms avg latency) |
| Crucial T705 | 14,400MB/s (0.58ms avg latency) | 12,300MB/s (0.68ms avg latency) | 1.585M IOPS (0.32ms avg latency) | 2.703M IOPS (0.19ms avg latency) |
| Phison PS5028-E28 | 14,00MB/s (0.60ms avg latency) | 14,000MB/s (0.57ms avg latency) | 2.559M IOPS (0.32ms avg latency) | 3.288M IOPS (0.32ms avg latency) |
| Lexar Professional NM1090 PRO | 13,800GB/s (0.61ms avg latency) | 13,600 MB/s (0.62ms avg latency) | 2.073M IOPS (0.32ms avg latency) | 2.215M IOPS (0.23ms avg latency) |
| PNY CS2150 | 10,400GB/s (0.80ms avg latency) | 8,801MB/s (0.95ms avg latency) | 1.379M IOPS (0.371ms avg latency) | 1.623 IOPS (0.32ms avg latency) |
| Crucial P510 | 8,835 MiB/s (0.90 ms avg latency) | 9,961MB/s (0.80 ms avg latency) | 1.163M IOPS (0.44ms avg latency) | 1.196M IOPS (0.51ms avg latency) |
| Samsung 990 Pro | 7,483MB/s (1.12ms avg latency) | 7,197MB/s (1.16ms avg latency) | 1.400M IOPS (0.36ms avg latency) | 1.403M IOPS (0.36ms avg latency) |
| WD SN850X 2TB | 6,632MB/s (0.76ms avg latency) | 7,235MB/s (0.92ms avg latency) | 1.2M IOPS (0.43ms avg latency) | 825K IOPS (0.62ms avg latency) |
Average LLM Load Time
The Average LLM Load Time test evaluated the load times of three different LLMs: DeepSeek R1 7B, Meta Llama 3.2 11B, and DeepSeek R1 32B. Each model was tested 10 times, and the average load time was calculated. This test measures the drive’s ability to load large language models (LLMs) into memory quickly. LLM load times are crucial for AI-related tasks, particularly for real-time inference and processing large datasets. Faster loading enables the model to process data rapidly, thereby improving AI responsiveness and reducing waiting time.
When it comes to loading large language models, the T710 holds its own among the Gen5 competition. It averaged 2.61 seconds for the DeepSeek R1 7B model, 3.69 seconds for the Meta Llama 3.2 11B version, and 4.46 seconds for the more comprehensive DeepSeek R1 32B model. That places it just behind the fastest contenders, such as the SK hynix P51 and SanDisk SN8100, but comfortably ahead of the T705, which clocked higher load times of around 2.88 and 5.11 seconds for 7B and 32B, respectively.
| Average LLM Load Time (lower is better) | DeepSeek R1 7B | Meta Llama 3.2 11B Vision | DeepSeek R1 32B |
| SK hynix Platinum P51 | 2.5481s | 3.5809s | 4.1790s |
| SanDisk SN8100 | 2.5702s | 3.5856s | 4.2870s |
| Phison PS5028-E28 | 2.5730s | 3.6380s | 4.3407s |
| Crucial T710 | 2.6138s | 3.6942s | 4.4588s |
| Samsung 9100 Pro 4TB | 2.6173s | 3.6017s | 4.3735s |
| PNY CS2150 | 2.8107s | 3.6820s | 4.8962s |
| Crucial T705 2TB | 2.8758s | 3.6312s | 5.1080s |
| Samsung 990 Pro 2TB | 2.8758s | 3.6312s | 5.1080s |
| Crucial P510 1TB | 2.8817s | 3.6631s | 5.0594s |
| WD SN850X 2TB | 3.0082s | 3.6543s | 5.4844s |
| Kingston FURY Renegade G5 | 3.1843s | 4.8009s | 4.6523s |
| Lexar Professional NM1090 PRO | 3.2135s | 4.9504s | 7.2108s |
3DMark Direct Storage
The 3DMark DirectStorage Feature Test evaluates how Microsoft’s DirectStorage optimizes game asset loading on PCIe SSDs. By reducing CPU overhead and improving data transfer speeds, DirectStorage enhances loading times, especially when paired with GDeflate compression and Windows 11’s BypassIO. This test isolates storage performance to highlight the potential bandwidth improvements when DirectStorage is enabled.
Here, the Crucial T710 demonstrated strong throughput, landing just below the top three Gen5 SSDs. It delivered 25.96GB/s in compressed asset transfers (GDeflate), closely trailing the Phison E28 and SanDisk SN8100. Its performance remained consistent across uncompressed workloads as well, posting 10.60GB/s (DirectStorage on) and 7.57GB/s (off). RAM-related figures were similarly solid, particularly 12.70GB/s when DirectStorage was enabled. While not the leader, the T710 proves it can easily handle modern gaming and content streaming scenarios.
| 3DMark Direct Storage, (GB/s, higher is better) | Storage to VRAM (GDeflate Compression) | Storage to VRAM (DirectStorage on, Uncompressed) | Storage to VRAM (DirectStorage off, Uncompressed) | Storage to RAM (DirectStorage on, Uncompressed) | Storage to RAM (DirectStorage off, Uncompressed) | GDeflate Decompression Bandwidth |
| SK hynix Platinum P51 | 26.32 | 11.20 | 7.75 | 12.85 | 9.46 | 64.68 |
| Phison PS5028-E28 | 26.22 | 10.89 | 7.46 | 11.15 | 9.86 | 65.58 |
| SanDisk SN8100 | 26.11 | 12.94 | 7.63 | 12.94 | 9.78 | 64.51 |
| Crucial T710 | 25.96 | 10.60 | 7.57 | 12.70 | 9.76 | 64.07 |
| Crucial T705 | 25.75 | 10.71 | 8.79 | 12.03 | 8.83 | 66.36 |
| Lexar Professional NM1090 PRO | 24.03 | 11.23 | 7.57 | 12.18 | 8.72 | 63.15 |
| Samsung 9100 Pro | 23.77 | 11.26 | 8.92 | 11.62 | 9.48 | 66.61 |
| Kingston FURY Renegade G5 | 23.29 | 10.03 | 7.44 | 11.81 | 9.63 | 65.79 |
| PNY CS2150 | 19.49 | 8.60 | 6.98 | 9.22 | 7.70 | 62.43 |
| WD SN850X | 15.28 | 11.11 | 8.93 | 6.78 | 6.27 | 64.96 |
| Samsung 990 Pro | 14.18 | 11.28 | 8.84 | 6.57 | 6.20 | 65.71 |
| Crucial P510 | 19.63 | 8.33 | 6.92 | 9.06 | 7.49 | 66.22 |
BlackMagic Disk Speed Test
The BlackMagic Disk Speed Test benchmarks a drive’s read and write speeds, estimating its performance, especially for video editing tasks. It helps users ensure their storage is fast enough for high-resolution content, like 4K or 8K video.
The Crucial T710 posted 9,415 MB/s reads and 10,688 MB/s writes. That places it above the SK hynix P51 and Lexar NM1090 PRO in raw throughput, although it falls just shy of leaders like the Kingston Fury Renegade and SanDisk SN8100. Its write speeds are excellent, landing among the highest tested and indicating strong sustained bandwidth for demanding 4K and 8K video editing tasks. These numbers suggest that the T710 is well-suited for professionals who need high sequential performance in real-time workloads.
Here’s our current BlackMagic disk speed leaderboard:
| BlackMagic Disk Speed (MB/s, higher is better) | Read MB/s | Write MB/s |
| Phison PS5028-E28 | 11,216.1 | 10,570.7 |
| SanDisk SN8100 | 10,005.2 | 10,581.0 |
| Kingston FURY Renegade G5 | 9,665.0 | 10,831.0 |
| Samsung 9100 Pro | 9,542.3 | 9,907.9 |
| Crucial T710 | 9,415.3 | 10,688.2 |
| SK hynix Platinum P51 | 9,241.0 | 9,109.0 |
| Lexar Professional NM1090 PRO | 9,149.2 | 10,466.6 |
| Crucial T705 | 8,464.2 | 10,256.4 |
| Crucial P510 | 7,853.9 | 7,939.6 |
| PNY CS2150 | 6,625.5 | 7,299.5 |
| WD SN850X | 5,862.6 | 5,894.8 |
| Samsung 990 Pro | 5,769.5 | 5,842.9 |
PCMark10 Storage
PCMark 10 Storage Benchmarks evaluate real-world storage performance using application-based traces. They test system and data drives, measuring bandwidth, access times, and consistency under load. These benchmarks offer practical insights beyond synthetic tests, enabling users to compare modern storage solutions effectively.
Here, the Crucial T710 scored 7,918. This places it slightly behind higher-end scores, such as the Crucial T705 and Phison E28, and in the middle of the pack. Nonetheless, the Crucial’s new drive will undoubtedly do the job for everyday multitasking and heavy desktop workloads, even if it doesn’t break new ground at the top of the chart.
| PCMark 10 Data Drive (higher is better) | Overall Score |
| Phison PS5028-E28 | 9,347 |
| Crucial T705 2TB | 8,783 |
| SK hynix Platinum P51 | 8,665 |
| SanDisk SN8100 | 8,644 |
| Lexar Professional NM1090 PRO | 8,247 |
| Kingston FURY Renegade G5 | 8,062 |
| Crucial T710 | 7.918 |
| Samsung 9100 Pro | 7,552 |
| Samsung 990 Pro | 7,173 |
| Crucial P310 | 6,436 |
| PNY CS2150 | 6,070 |
| WD SN850X | 4,988 |
3DMark Storage
The 3DMark Storage Benchmark tests your SSD’s gaming performance by measuring tasks like loading games, saving progress, installing game files, and recording gameplay. It evaluates how well your storage handles real-world gaming activities and supports the latest storage technologies for accurate performance insights.
The Crucial T710 achieved a score of 5,083 in the 3DMark Storage test, effectively tying with the SK hynix P51 and coming in just above the Lexar NM1090 PRO. While it’s not quite in the same league as the Phison E28 or SanDisk SN8100, this score keeps it well within the high-performance tier for gaming-focused workloads. Tasks like saving progress, installing large games, or capturing gameplay should all feel smooth and responsive, making the T710 a solid choice for gamers looking to take advantage of Gen5 bandwidth.
| 3DMark Storage benchmark (higher is better) | Overall Score |
| SanDisk SN8100 | 6,047 |
| Phison PS5028-E28 | 5,879 |
| Kingston FURY Renegade G5 | 5,670 |
| Crucial T705 | 5,100 |
| Crucial T710 | 5,083 |
| SK hynix Platinum P51 | 5,082 |
| Lexar Professional NM1090 PRO | 4,828 |
| Samsung 9100 Pro | 4,779 |
| Crucial P510 | 4,148 |
| PNY CS2150 | 4,193 |
| Samsung 990 Pro | 4,128 |
| WD SN850X | 3,962 |
| Crucial P310 | 3,848 |
GPU Direct Storage
One of the tests we conducted on this testbench was the Magnum IO GPU Direct Storage (GDS) test. GDS is a feature developed by NVIDIA that allows GPUs to bypass the CPU when accessing data stored on NVMe drives or other high-speed storage devices. Instead of routing data through the CPU and system memory, GDS enables direct communication between the GPU and the storage device, significantly reducing latency and improving data throughput.
How GPU Direct Storage Works
Traditionally, when a GPU processes data stored on an NVMe drive, the data must first travel through the CPU and system memory before reaching the GPU. This process introduces bottlenecks, as the CPU becomes a middleman, adding latency and consuming valuable system resources. GPU Direct Storage eliminates this inefficiency by enabling the GPU to access data directly from the storage device via the PCIe bus. This direct path reduces the overhead associated with data movement, allowing faster and more efficient data transfers.
AI workloads, especially those involving deep learning, are highly data-intensive. Training large neural networks requires processing terabytes of data, and any delay in data transfer can lead to underutilized GPUs and longer training times. GPU Direct Storage addresses this challenge by ensuring that data is delivered to the GPU as quickly as possible, minimizing idle time and maximizing computational efficiency.
In addition, GDS is particularly beneficial for workloads that involve streaming large datasets, such as video processing, natural language processing, or real-time inference. By reducing the reliance on the CPU, GDS accelerates data movement and frees up CPU resources for other tasks, further enhancing overall system performance.
Results
Here, the Crucial T710 keeps pace with top-tier Gen5 drives, delivering excellent throughput across all block sizes. With 16K reads and writes, it sustains read and write speeds of 3.7GiB/s and 2.4GiB/s, respectively, matching the Phison E28 and Kingston G5. At 128K, it pulls off 5.8GiB/s reads and 3.7GiB/s writes, which are substantial numbers, especially for read performance, and just shy of the Phison E28’s 5.9GiB/s. At the largest 1M block size, it achieves read and write speeds of 6.4GiB/s and 6.1GiB/s, respectively, which match or exceed those of most of its competitors, including the SanDisk SN8100 and Samsung 9100 Pro.
Compared to the Crucial T705, the newer model achieves faster read and write speeds across all block sizes.
Here’s a full run-down:
| GDSIO Chart (16K,128K,1M Block Size Averages) | (16K Block Size 128 IO Depth) Average Read | (16K Block Size 128 IO Depth) Average Write | (128K Block Size 128 IO Depth) Average Read | (128K Block Size 128 IO Depth) Average Write | (1M Block Size 128 IO Depth) Average Read | (1M Block Size 128 IO Depth) Average Write |
| Phison PS5028-E28 | 3.7GiB/s (0.519ms) IOPS: 245.1K | 2.4GiB/s (0.824ms) IOPS: 154.7K | 5.9GiB/s (2.647ms) IOPS: 48.2K | 5.9GiB/s (2.650ms) IOPS: 48.31K | 6.4GiB/s (19.650ms) IOPS: 6.5K | 6.2GiB/s (20.033ms) IOPS: 6.4K |
| Kingston FURY Renegade G5 | 3.7GiB/s (0.526ms) IOPS: 242.1K | 2.4GiB/s (0.824ms) IOPS: 154.7K | 5.9GiB/s (2.704ms) IOPS: 48.5K | 5.8GiB/s (0.564ms) IOPS: 47.3K | 6.5GiB/s (19.356ms) IOPS: 6.6K | 6.3GiB/s (19.690ms) IOPS: 6.5K |
| Crucial T710 | 3.7GiB/s (0.526ms) IOPS: 242.0K | 2.4GiB/s (0.823ms) IOPS: 155.0K | 5.8GiB/s (2.613ms) IOPS: 48.9K | 3.7GiB/s (2.669ms) IOPS: 47.9K | 6.4GiB/s (0.526ms) IOPS: 6.6K | 6.1GiB/s (19.479ms) IOPS: 6.3K |
| Lexar Professional NM1090 PRO | 3.6GiB/s (0.533ms) IOPS: 238.7K | 2.3GiB/s (0.845ms) IOPS: 150.8K | 5.9GiB/s (2.639ms) IOPS: 48.4K | 4.2GiB/s (3.714ms) IOPS: 34.4K | 6.5GiB/s (19.274ms) IOPS: 6.6K | 6.2GiB/s (20.127ms) IOPS: 6.4K |
| SanDisk SN8100 | 3.4GiB/s (0.564ms) IOPS: 225.9K | 2.1GiB/s (0.907ms) IOPS: 140.6K | 5.9GiB/s (2.626ms) IOPS: 48.7K | 5.8GiB/s (2.668ms) IOPS: 47.9K | 6.5GiB/s (19.264ms) IOPS: 6.6K | 5.9GiB/s (21.063ms) IOPS: 6.1K |
| Samsung 9100 Pro 4TB | 3.4GiB/s (0.565ms) IOPS: 226.4K | 2.3GiB/s (0.839ms) IOPS: 161.7K | 5.2GiB/s (3.001ms) IOPS: 44.9K | 5.9GiB/s (2.662ms) IOPS: 47.3K | 6.3GiB/s (19.877ms) IOPS: 6.4K | 6.1GiB/s (20.579ms) IOPS: 6.2K |
| Crucial T705 2TB | 3.3GiB/s (0.587ms) IOPS: 217.0K | 2.3GiB/s (.836ms) IOPS: 152.6K | 5.5GiB/s (2.863ms) IOPS: 44.7K | 5.6GiB/s (2.799ms) IOPS: 45.7K | 6.0GiB/s (20.738ms) IOPS: 6.2K | 6.0GiB/s (20.855ms) IOPS: 6.1K |
| SK hynix Platinum P51 | 3.1GiB/s (0.634ms) IOPS: 200.9K | 1.5GiB/s (1.314ms) IOPS: 97.2K | 5.6GiB/s (2.781ms) IOPS: 46.0K | 3.9GiB/s (4.014ms) IOPS: 31.9K | 6.2GiB/s (20.126ms) IOPS: 6.4K | 4.2GiB/s (29.576ms) IOPS: 4.3K |
| Samsung 990 Pro 2TB | 2.7GiB/s (0.731ms) IOPS: 174.4K | 2.2GiB/s (0.903ms) IOPS: 141.2K | 4.0GiB/s (3.944ms) IOPS: 32.4K | 4.1GiB/s (3.849ms) IOPS: 33.2K | 3.9GiB/s (32.415ms) IOPS: 3.9K | 4.2GiB/s (29.520ms) IOPS: 4.3K |
| PNY CS2150 | 2.5GiB/s (0.779ms) IOPS: 163.5K | 1.8GiB/s 1.107ms) IOPS: 115.3K | 4.5GiB/s (3.473ms) IOPS: 36.8K | 4.7GiB/s (3.357ms) IOPS: 38.1K | 4.6GiB/s (27.157ms) IOPS: 174.4K | 4.9GiB/s (25.682ms) IOPS: 5.0K |
| Crucial P510 | 2.3GiB/s (0.837ms) IOPS: 152.2K | 2.3GiB/s (0.842ms) IOPS: 151.5K | 4.5GiB/s (3.450ms) IOPS: 37.1K | 4.8GiB/s (3.262ms) IOPS: 39.2K | 4.8GiB/s (26.2181ms) IOPS: 4.9K | 5.0GiB/s (25.121ms) IOPS: 5.1K |
| WD SN850X | 2.3GiB/s (0.736ms) IOPS: 173.2K | 2.0GiB/s (0.989ms) IOPS: 129.0K | 4.1GiB/s (3.878ms) IOPS: 33.3K | 4.0GiB/s (3.958ms) IOPS: 33.0K | 4.4GiB/s (30.501ms) IOPS: 4.5K | 4.1GiB/s (30.782ms) IOPS: 4.2K |
Conclusion
Crucial’s T710 represents a good step forward in the company’s Gen5 SSD lineup. It offers excellent peak performance that rivals or even surpasses most high-end competitors across synthetic and real-world tests, including GPU Direct Storage and DirectStorage workloads. With its combination of Micron’s 232-layer TLC NAND and the Silicon Motion SM2508 controller, the T710 handles heavy read and write operations with excellent consistency. The power efficiency improvements over the T705 are also welcome, especially for desktop users sensitive to fan noise or thermals in compact builds.
Across gaming, creative, and AI workloads, the T710 delivered consistently high throughput. Results like loading LLMs, capturing 8K video, or launching modern games with DirectStorage make it clear that this drive can handle a wide range of demanding scenarios. And where it might lack in performance on our charts, the experience for most users won’t differ dramatically from that of similarly equipped Gen5 SSDs. That makes things like thermal design, endurance, and software support just as important in the buying decision, and Crucial does well in those areas.
In terms of pricing, the T710 lands in the middle of the current Gen5 market. The 2TB model’s $280 tag (a bit more with the heatsink version) places it well above the PNY CS2150, which is roughly $175, but still comfortably below the Kingston FURY Renegade G5 at $330. For users who want a reliable, high-performance Gen5 SSD without spending top dollar, the T710 strikes a nice balance. Unless you’re specifically looking for the very fastest numbers on the market, this is a smart, future-ready upgrade for both enthusiast and professional setups.
Crucial T710 at Amazon (affiliate link)


 Amazon