

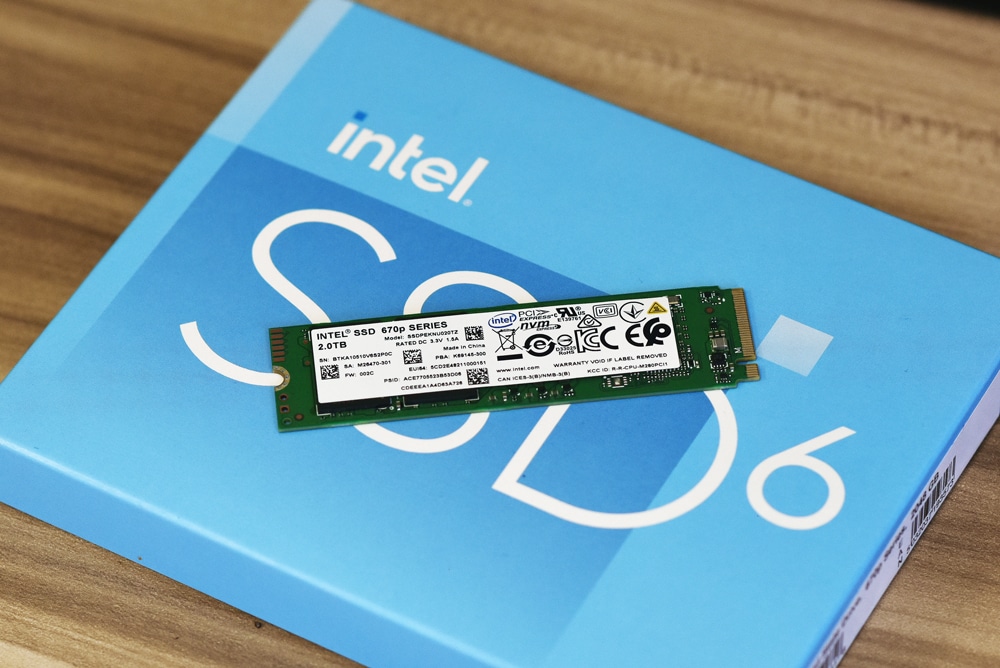
Intel has released a new model in its end-user QLC SSD line with the Intel 670p. A step up from the Intel 665p, the new SSD is based on the company’s 144-layer 3D NAND and leverages an NVMe interface. Much like its predecessors, the Intel SSD 670p is a single-sided M.2 form factor and comes in capacities up to 2TB. The drive is designed for general use, like web tasks and light office applications.
The Intel SSD 670p offers performance up to 3.5GB/s and up to 340K IOPS, which the company claims is a 20% increase over previous drives (though they do compare it to the Intel 660p, not the 665p, based on volume). One of the ways in which the SSD has better performance is that it has improved the dynamic SLC cache, up to 280GB per 2TB drive. The 670p also offers up to 185 TBW per 512GB for endurance, scaling up to 740 TBW for the 2TB model. Endurance this high makes it a good choice for your average PC user.
So, what is the difference here? Is Intel just swapping out a number and sending it out into the world? QLC drives are often thought of as a higher capacity, lower price drive, but with the drawback of not quite having as high of performance. The biggest difference between drives is the NAND.
The 660p uses 64-Layer NAND, the 665p uses 96-Layer, and the 670p has 144-Layer, each representing a 50% increase in bit density over the previous. Intel refers to this as their Gen4 NAND, which is a tad confusing as they chose to use PCIe Gen3 as the interface. This was done because they claim the vast majority of users still leverage PCIe Gen3, which is true, but their processors still don’t support Gen4 (at the time of this writing), so maybe that had something to do with it. Either way, this may run into some resistance with potential customers when they see right off the bat there is a potential limitation in performance.
As mentioned, part of the performance equation is the Dynamic Cache. This time around the company says the cache is improved, though the top end of the cache is still 280GB, this time with a combination of dynamic (256GB) SLC and static (24GB) SLC. This way the static always provides a performance boost and the dynamic can provide more, up to a point, for given loads.
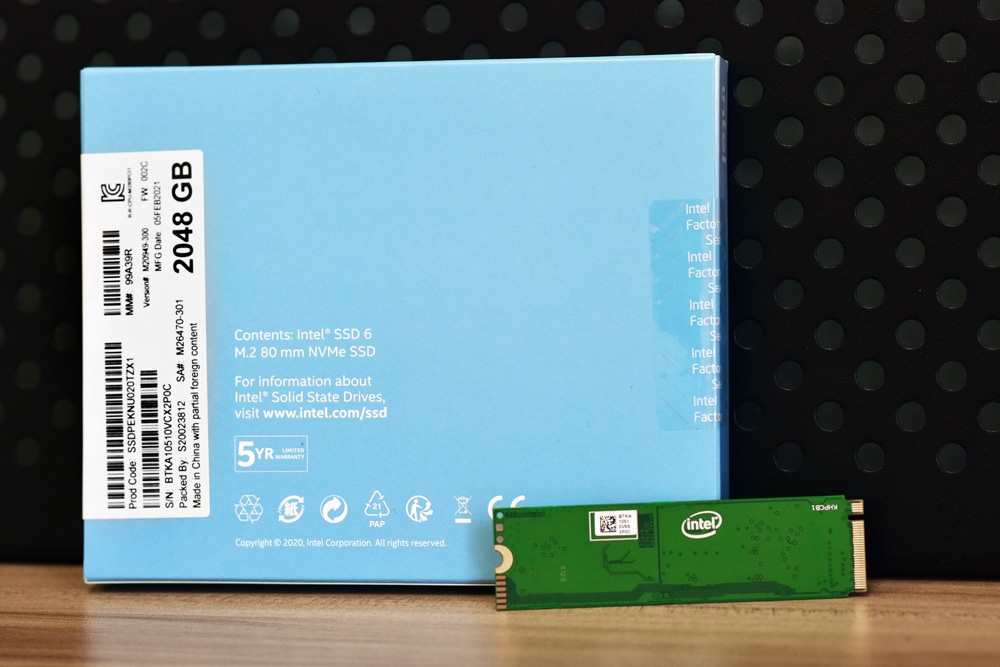
The Intel SSD 670p comes in 512GB, 1TB, and 2TB, the latter of which we are looking at today for our review. The 670p comes with an MSRP of $90 for the 512GB, $154 for the 1TB, and $320 for the 2TB.
Intel SSD 670p Specifications
| Capacity and Form Factor | 80mm (single-sided) 2280-S3-M 512GB, 1TB, 2TB |
| Interface | PCIe 3.0×4, NVMe |
| Media | 144-layer, Intel 3D NAND |
| Performance | Sequential Read: Up to 3,500 MB/s Sequential Write: Up to 2,700 MB/ Random 4KB Reads: Up to 310K IOPS Random 4KB Writes: Up to 340K IOPS |
| Endurance | 512GB: 185 TBW 1TB: 370 TBW 2TB: 740 TBW |
| Power | Active: 80mW, Idle: 25mW |
| Operating Temperature | 0° C to 70° C |
| Warranty | 5-year limited warranty |
Intel SSD 670p Design and Build
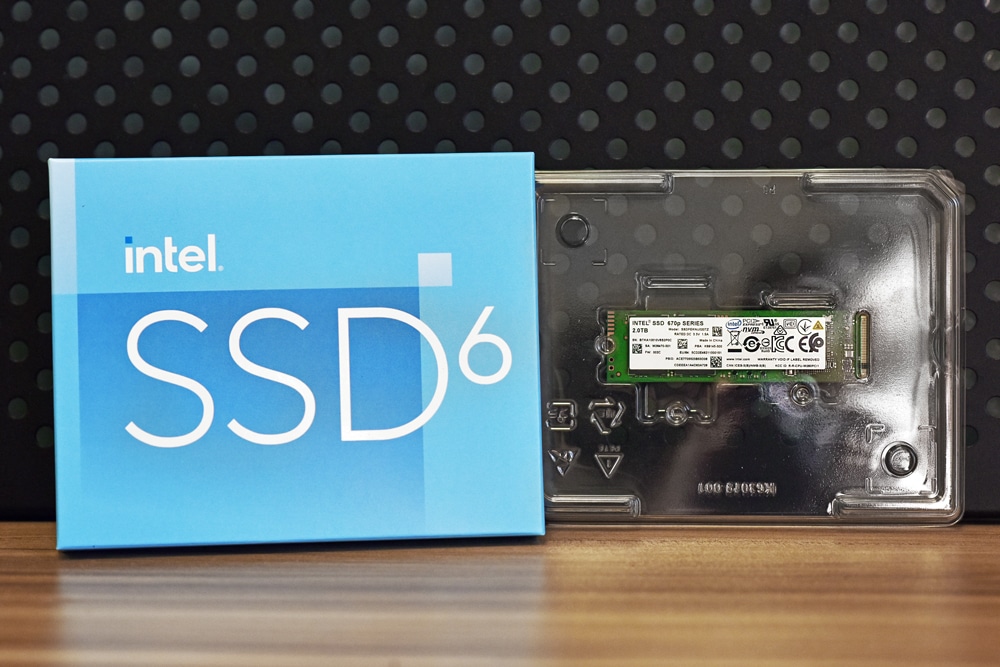
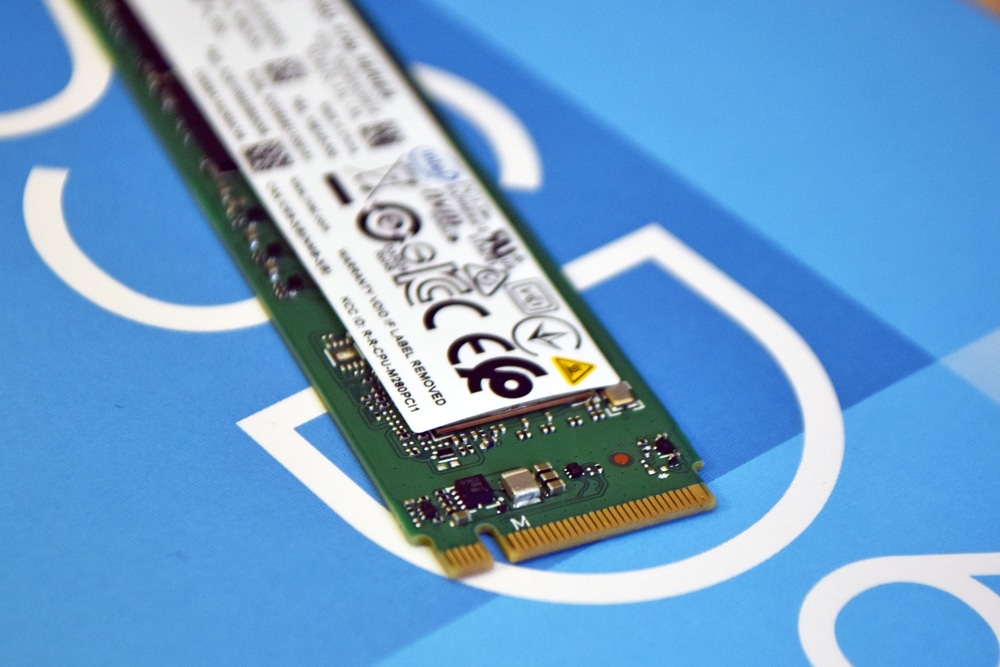
The Intel SSD 670p is a single-sided M.2 SSD. The NAND packs and controller are on one side covered by a sticker with pertinent information on it.
The back of the drive is a blank PCB.
Intel SSD 670p Performance
Testbed
The test platform leveraged in these tests is a Dell PowerEdge R740xd server. We measure SATA performance through a Dell H730P RAID card inside this server, although we set the card in HBA mode only to disable the impact of the RAID card cache. NVMe is tested natively through an M.2 to PCIe adapter card. The methodology used better reflects end-user workflow with the consistency, scalability, and flexibility testing within virtualized server offers. A large focus is put on drive latency across the entire load range of the drive, not just at the smallest QD1 (Queue-Depth 1) levels. We do this because many of the common consumer benchmarks don’t adequately capture end-user workload profiles.
To more appropriately test the QLC-based SSDs we modified our consumer testing methodology to better reflect how these drives are designed to work out in the field. Compared to MLC or even TLC products, QLC-based SSDs have a very small continuous write ability. QLC SSDs mitigate this through adaptive SLC caching, but the short version of the story is after writing 10-15GB of data to the SSD at once, write speeds will drop from 500MB/s down to 100MB/s. Manufacturers see this drive instead of working in burst activity, where users mostly read data from the drive, or write in chunks, allowing the drive to stay in the faster performance zone. To accommodate this workload, we modified our testing process to partition 1% of the drive surface, instead of the 5% that we would traditionally test for a consumer product.
SQL Server Performance
Each SQL Server VM is configured with two vDisks: 100GB volume for boot and a 500GB volume for the database and log files. From a system resource perspective, we configured each VM with 16 vCPUs, 64GB of DRAM and leveraged the LSI Logic SAS SCSI controller. While our Sysbench workloads tested previously saturated the platform in both storage I/O and capacity, the SQL test is looking for latency performance.
This test uses SQL Server 2014 running on Windows Server 2012 R2 guest VMs and is stressed by Quest’s Benchmark Factory for Databases. StorageReview’s Microsoft SQL Server OLTP testing protocol employs the current draft of the Transaction Processing Performance Council’s Benchmark C (TPC-C), an online transaction-processing benchmark that simulates the activities found in complex application environments.
The TPC-C benchmark comes closer than synthetic performance benchmarks to gauging the performance strengths and bottlenecks of storage infrastructure in database environments. Each instance of our SQL Server VM for this review uses a 333GB (1,500 scale) SQL Server database and measures the transactional performance and latency under a load of 15,000 virtual users.
SQL Server Testing Configuration (per VM)
- Windows Server 2012 R2
- Storage Footprint: 600GB allocated, 500GB used
- SQL Server 2014
- Database Size: 1,500 scale
-
- Virtual Client Load: 15,000
- RAM Buffer: 48GB
- Test Length: 3 hours
-
- 2.5 hours preconditioning
- 30 minutes sample period
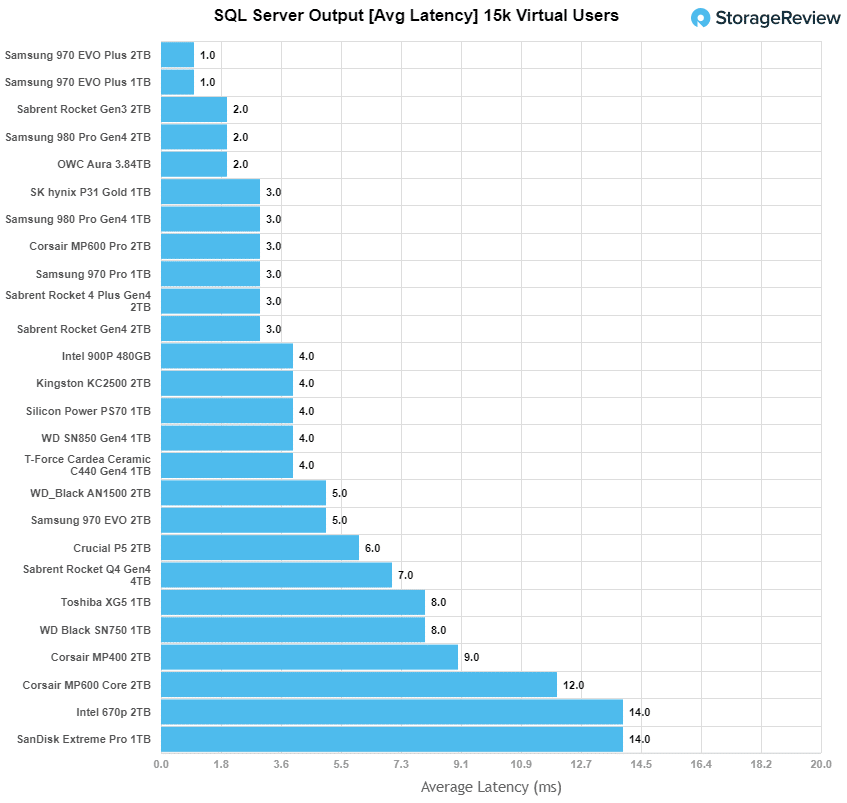
Looking at SQL Server average latency, the Intel 670p had an average latency of 14ms putting it near the bottom of the pack tested.
VDBench Workload Analysis
When it comes to benchmarking storage devices, application testing is best, and synthetic testing comes in second place. While not a perfect representation of actual workloads, synthetic tests do help to baseline storage devices with a repeatability factor that makes it easy to do apples-to-apples comparison between competing solutions. These workloads offer a range of different testing profiles ranging from “four corners” tests, common database transfer size tests, to trace captures from different VDI environments.
All of these tests leverage the common vdBench workload generator, with a scripting engine to automate and capture results over a large compute testing cluster. This allows us to repeat the same workloads across a wide range of storage devices, including flash arrays and individual storage devices. Our testing process for QLC SSDs starts with a secure erase, then we partition the drive to 1% of the drive capacity to simulate how the drive might respond to smaller application workloads. This is different from full entropy tests which use 100% of the drive and take them into steady state. As a result, these figures will reflect higher-sustained write speeds.
Profiles:
- 4K Random Read: 100% Read, 128 threads, 0-120% iorate
- 4K Random Write: 100% Write, 64 threads, 0-120% iorate
- 64K Sequential Read: 100% Read, 16 threads, 0-120% iorate
- 64K Sequential Write: 100% Write, 8 threads, 0-120% iorate
Comparables for this review:
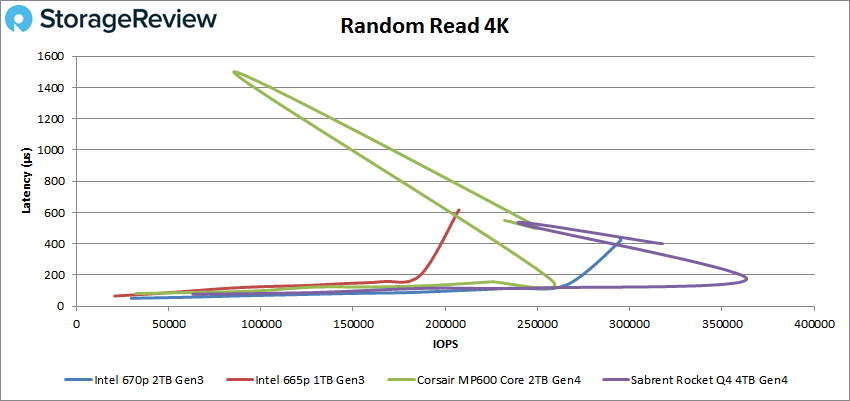
In 4K random read, the Intel SSD 670p took second overall with a peak of 295,132 IOPS and a latency of 421µs. This is quite a jump over the 660p (nearly 90K IOPS) and was able to even able to beat out a Gen4 QLC SSD in the MP 600 Core.
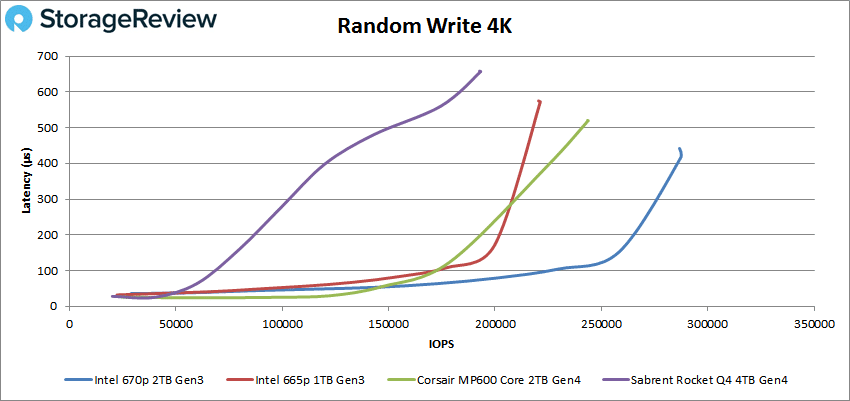
4K random write had the 670p really shine taking the top spot with a peak of about 289K IOPS and a latency of 415µs before seeing a small drop off.
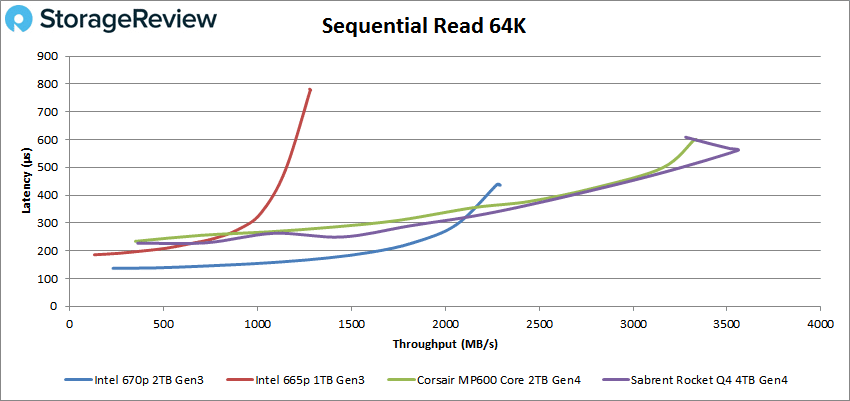
Switching over to 64K sequential workloads, in read the 670p dropped behind the Gen4 drives with a peak of 36,684 IOPS or 2.3GB/s with a latency of 436µs. 1GB/s faster than the 665p, though the Gen4 drives are able to push out much faster speeds.
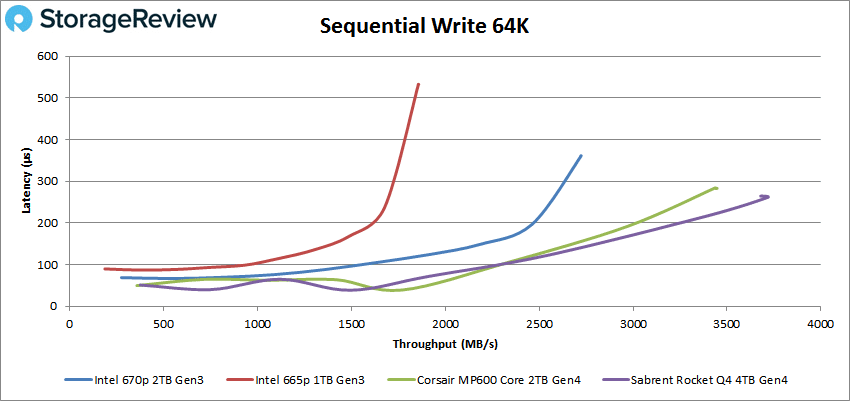
64K sequential write saw the 670p in third once more with a peak of 43,538 IOPS or 2.7GB/s with a latency of 361µs.
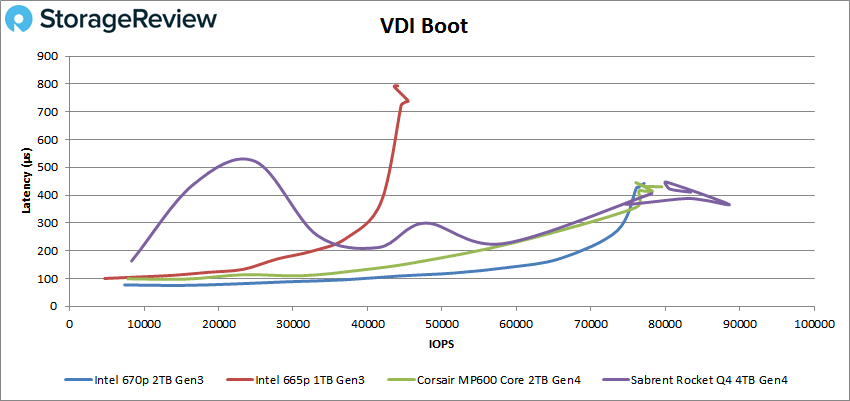
Next, we looked at our VDI benchmarks, which are designed to tax the drives even further. These tests include Boot, Initial Login, and Monday Login. Looking at the Boot test, the Intel SSD 670p came in third with a peak of 77,182 IOPS and a latency of 442µs.
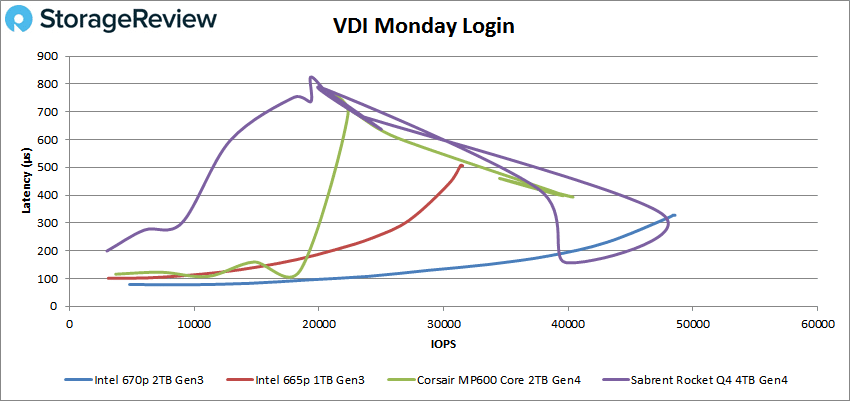
VDI Monday Login saw the 670p take the top spot narrowly beating out the Sabrent with a peak of 48,568 IOPS and a latency of 328µs.
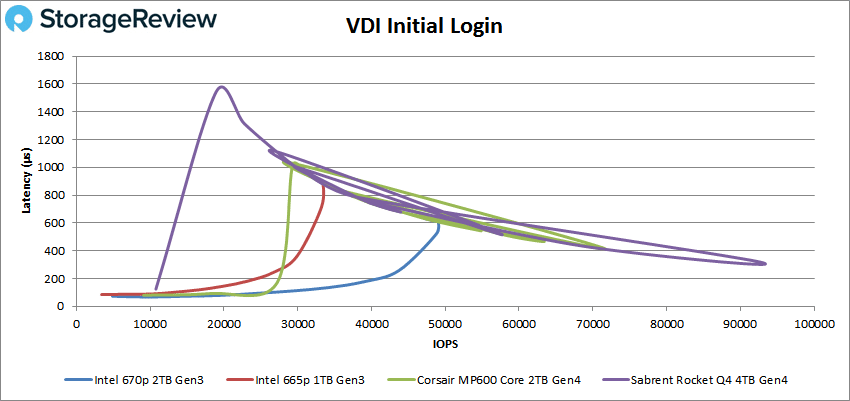
Finally, with our VDI Initial Login, the Intel 670p slipped back down to third with a peak of about 49K IOPS and a latency of 608µs before dropping off some.
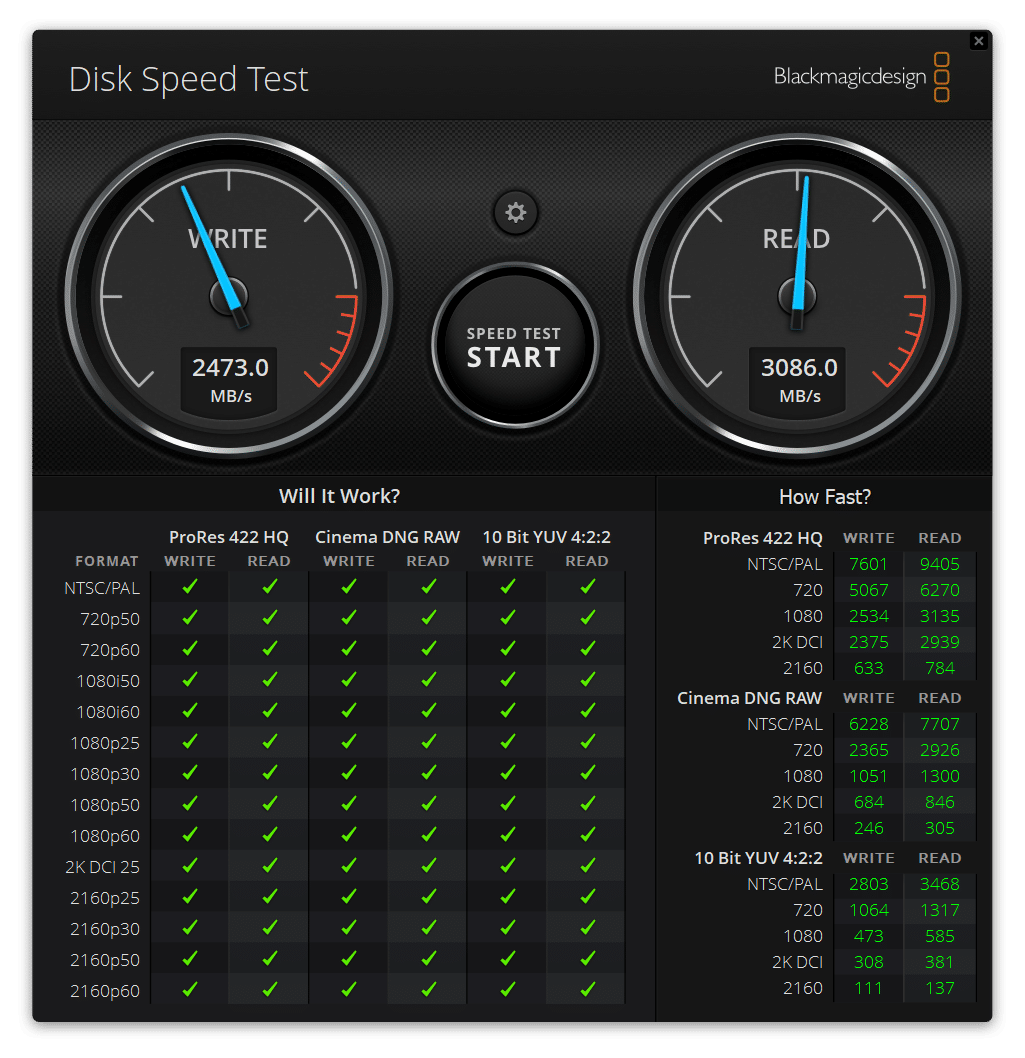
BlackMagic
To further test the Intel SSD 670p, we ran the Blackmagic Disk Speed Test on the Lenovo ThinkStation P620.
Here we saw the Intel 670p hit a read speed of 3.09GB/s read and 2.47GB/s write. This doesn’t quite hit its quoted read speed.
| Blackmagic Disk Speed | ||
| Drive | Read | Write |
| Intel 670p | 3.1GB/s | 2.5GB/s |
| Intel 665p | 1.9GB/s | 1.7GB/s |
| Corsair MP600 Core 2TB Gen4 | 3.9GB/s | 3.4GB/s |
| Sabrent Rocket Q4 4TB Gen4 | 3.9GB/s | 3.7GB/s |
Conclusion
Intel has expanded its QLC SSD line again with the Intel SSD 670p. This M.2 SSD leverages 144-Layer QLC NAND and an improved dynamic cache for the promise of even better performance. Intel quotes a top speed of 3.5GB/s with a throughput of up to 340K IOPS. The drive comes in capacities up to 2TB while still retaining the single-sided build of the previous models. The 670p is an everyday use case SSD and small enough to be placed in thin notebooks.
For performance, we ran our Application Workload Analysis in the form of SQL Server latency, our VDBench Workloads, and Blackmagic. For SQL Server latency the 670p hit 14ms putting it at the bottom of our pack. In VDBench we compared the drive to its predecessor, the Intel 665p, as well as two Gen4 QLC drives. Here it was able to hit peaks of 295K IOPS for 4K read, 289K IOPS in 4K write (top spot), 2.3GB/s in 64K read, and 2.7GB/s (hitting its quoted speed) in 64K write. In our VDI workloads, the 670p peaked at 77K IOPS in Boot, 49K IOPS (top spot) in Monday Login, and 49K in Initial Login. For Blackmagic the 670p hit 3.1GB/s read and 2.5GB/s write.
Overall, the Intel SSD 670p performs well for a QLC, PCIe Gen3 drive. It was able to hit its quoted write speeds and was able to outperform some of the Gen4 drives at times, with pretty composed behavior. It is priced about the same as the Gen4 Corsair QLC drive, or TLC Gen3 drives, putting the 670p at a big price premium at launch, relative to top-end performance.
We expect to see pricing normalize after release though, which it will need for this drive to gain any retail traction. As it stands, paying the same for a drive that doesn’t perform better than the same capacity TLC drive doesn’t make much sense to us, making us pass on recommending it until the price comes down substantively.


 Amazon