

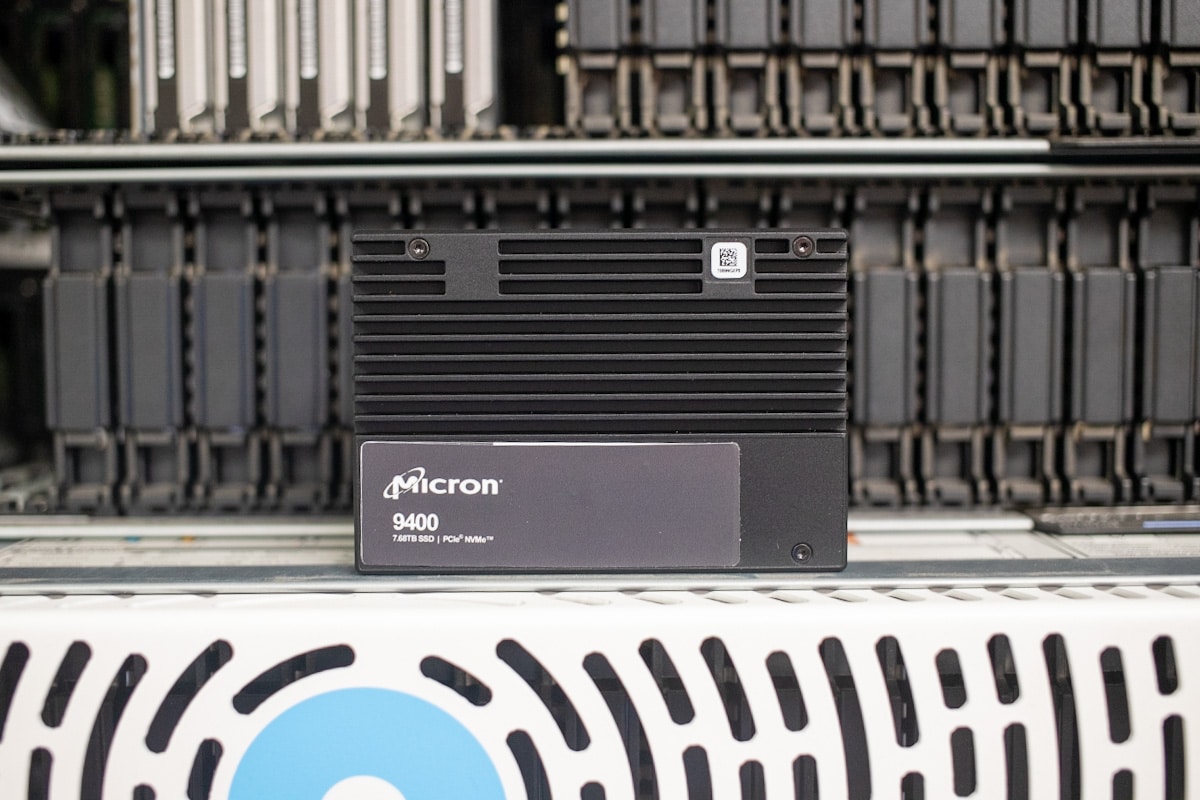
Micron Technology has released the Micron 9400 NVMe enterprise SSD which boasts a storage capacity of up to 30.72TB with TLC NAND. It’s a PCIe Gen4 data center U.3 drive, and provides consistently low latency at all capacity points. Its high capacity doubles Micron’s previous TLC SSD, meaning enterprises can store the same amount of data in half as many servers. Or customers can keep just as many servers and more than double their data footprint.
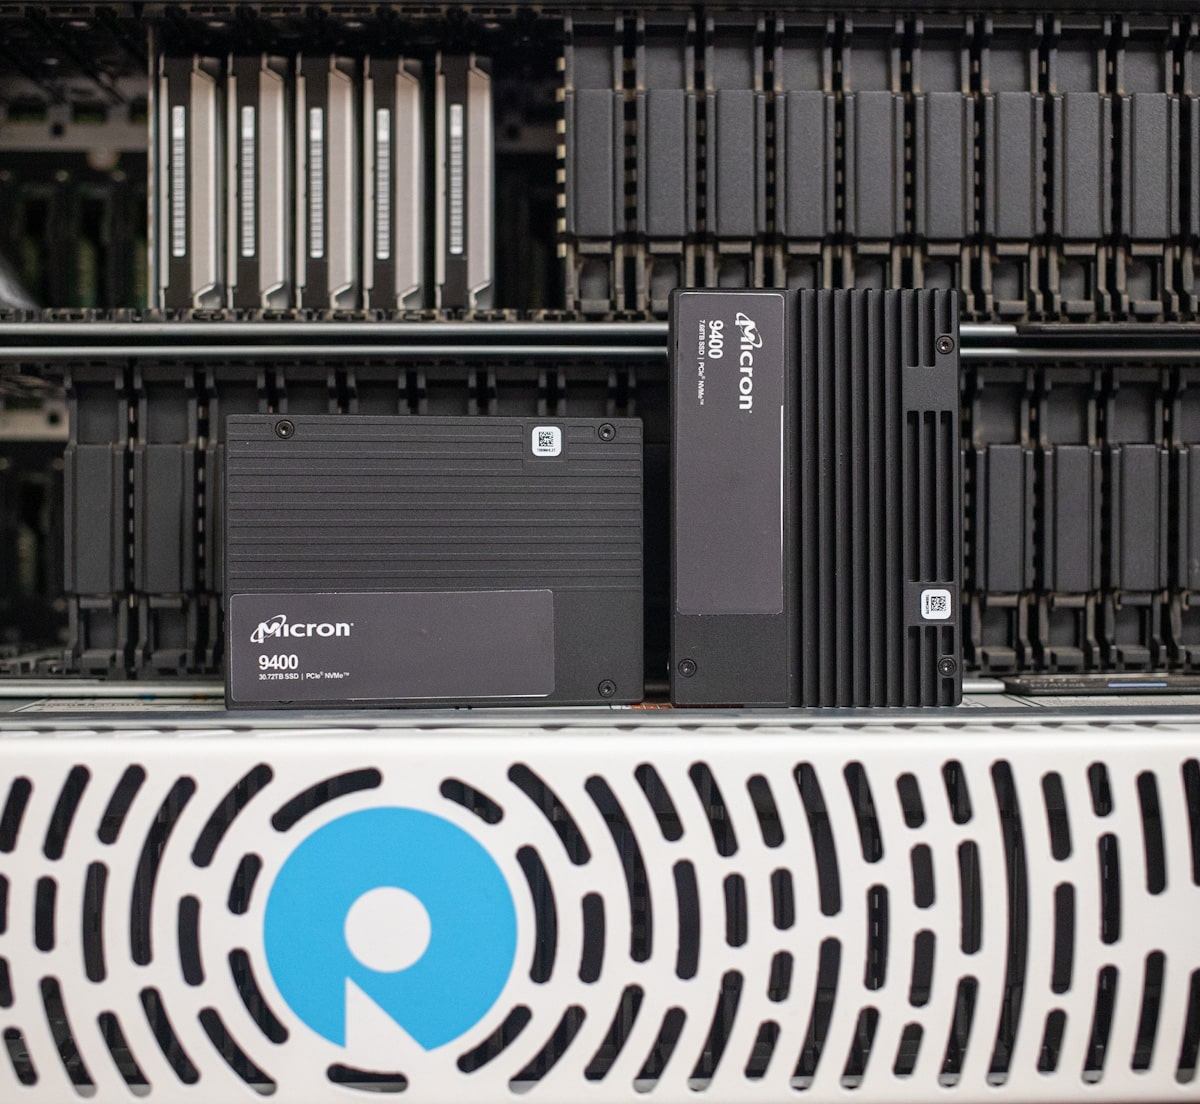
A standard 2U server with 24 bays can now support nearly 3/4 of a petabyte in a single system. This was certainly possible before, but that’s with QLC flash. Micron’s been able to put together the 9400 with TLC NAND, meaning the performance profile should be the star, especially in scenarios with heavier write activity. That said, these will cost more than the QLC alternative, so it’s important to fit the drive to the workload.
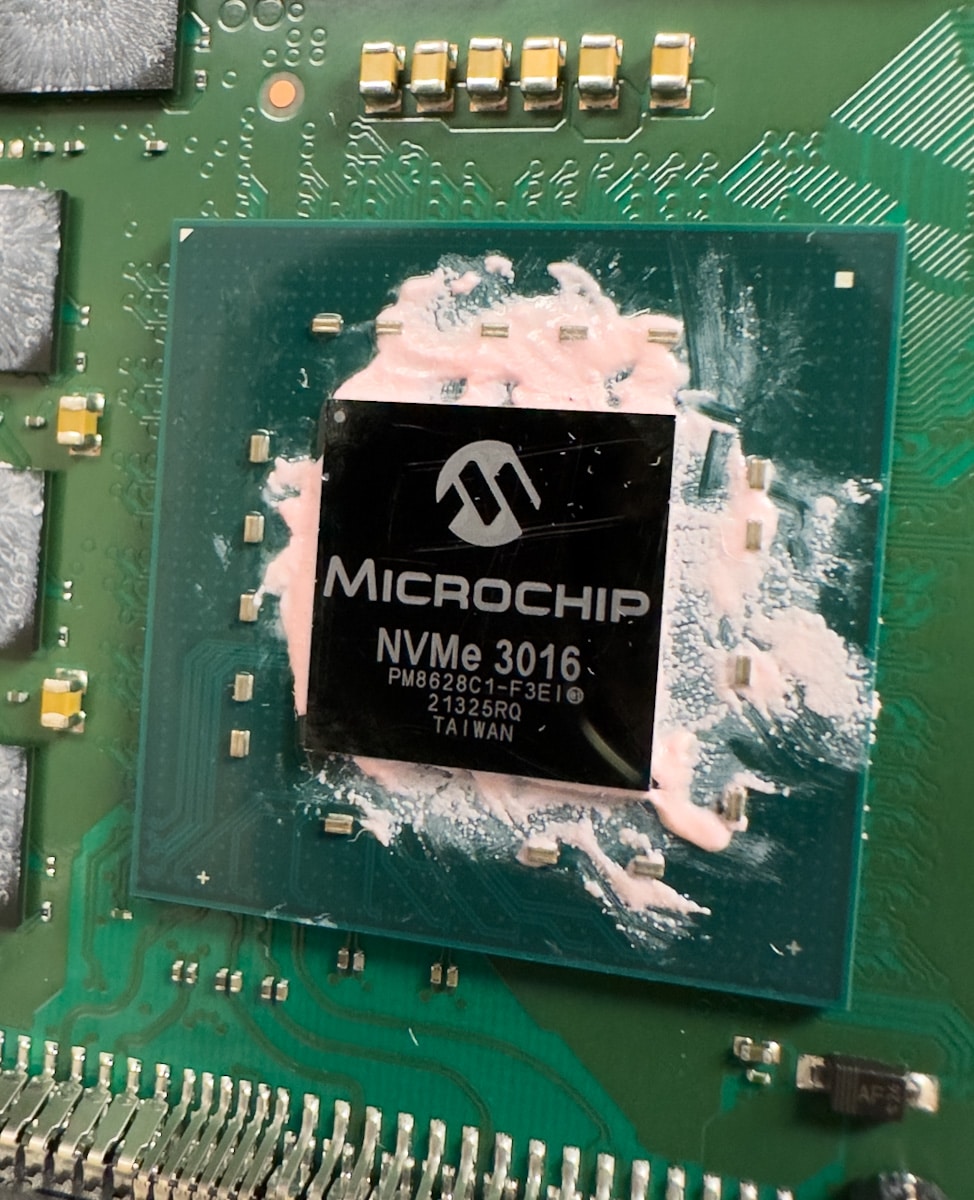
Speaking of performance, the Micron 9400 also offers impressive spec sheet data, delivering 1.6 million IOPS for 100% 4K random reads and over a million IOPS in mixed workloads. At its heart is a Microchip NVMe 3016 controller. It’s also designed for real-world applications, with testing showing superior performance in scenarios such as the RocksDB storage database and the Aerospike Database.

Another side benefit of these large capacity SSDs is around environmental impact. Because the power consumed isn’t a lot different, larger SSDs can provide more efficiency throughout the system. According to Micron, the 9400 SSDs are “77% better IOPS per watt” which reduces power consumption and therefore operational expenses, carbon footprint, and environmental impact.
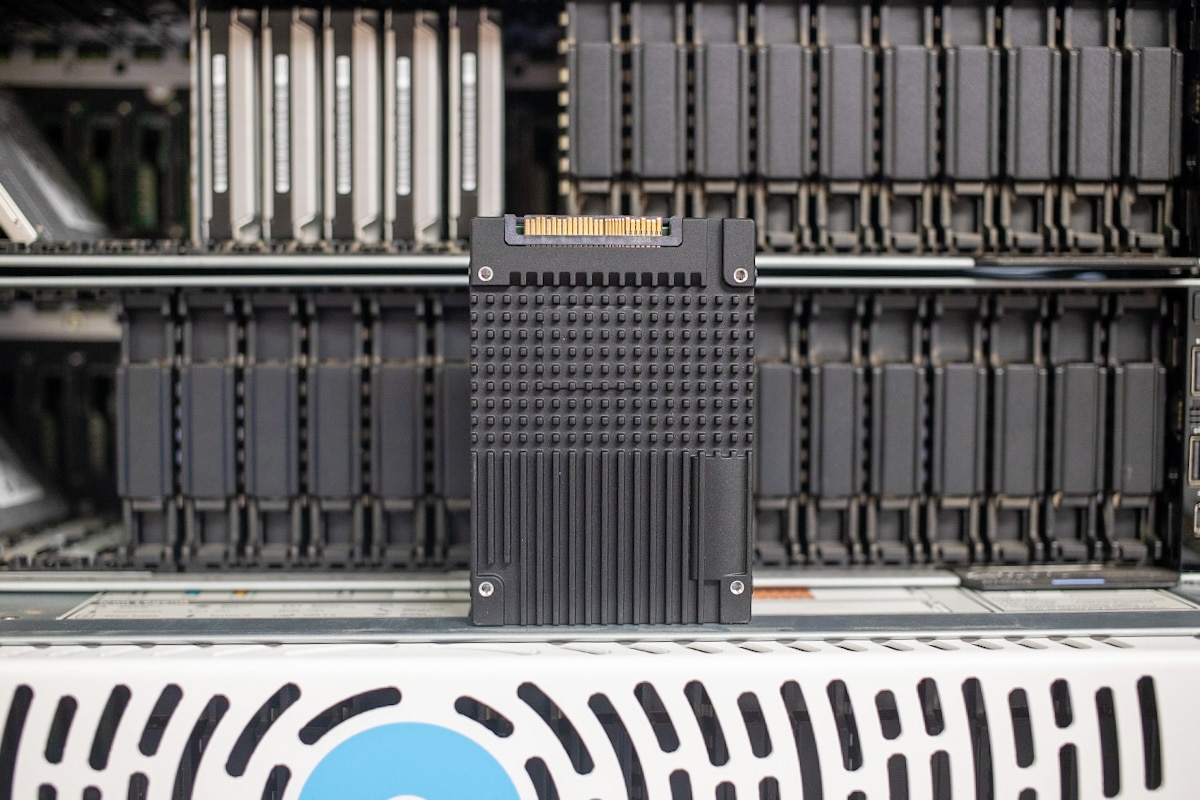
The Micron 9400 is available in a U.3 form factor in a range of capacities. Micron further differentiates between their PRO line which is single drive write per day and the Max line, which trades capacity for a higher 3 DWPD endurance.
Micron 9400 Pro SSD Specifications
| U.2/U.3
|
Micron 9400 PRO
Read-Intensive, 1 Drive Write per Day |
Micron 9400 MAX
Mixed-Use, 3 Drive Writes per Day |
|||||
| Capacity | 7.68TB | 15.36TB | 30.72TB | 6.40TB | 12.80TB | 25.60TB | |
| Performance 4K random / 128K sequential |
Seq. Read
(MB/s) |
7,000 | 7,000 | 7,000 | 7,000 | 7,000 | 7,000 |
| Seq. Write
(MB/s) |
7,000 | 7,000 | 7,000 | 7,000 | 7,000 | 7,000 | |
| Rand. Read
(IOPS) |
1,600,000 | 1,600,000 | 1,500,000 | 1,600,000 | 1,600,000 | 1,500,000 | |
| Rand. Write
(IOPS) |
300,000 | 300,000 | 300,000 | 600,000 | 600,000 | 550,000 | |
| 70/30 Rand. Read/Write
(IOPS) |
770,000 | 780,000 | 770,000 | 930,000 | 940,000 | 900,000 | |
| Latency (typical, µs) |
69 (read)
10 (write) |
69 (read)
10 (write) |
69 (read)
10 (write) |
69 (read)
10 (write) |
69 (read)
10 (write) |
69 (read)
10 (write) |
|
| Endurance (total bytes written in TB) | 4K Rand. | 14,016 | 28,032 | 56,064 | 35,040 | 70,080 | 140,160 |
| 128K Seq. | 58,300 | 104,500 | 201,200 | 74,200 | 143,100 | 282,600 | |
| Basic Attributes | Interface | PCIe Gen4 1×4 NVMe (v1.4) | |||||
| NAND | Micron 176-layer 3D TLC NAND | ||||||
| Reliability | MTTF | 2 million device hours | |||||
| UBER | <1 sector per 1017 bits read | ||||||
| Warranty | 5 years | ||||||
Micron 9400 Pro SSD Performance
Testing Background and Comparables
The StorageReview Enterprise Test Lab provides a flexible architecture for conducting benchmarks of enterprise storage devices in an environment comparable to what administrators encounter in real deployments. The Enterprise Test Lab incorporates a variety of servers, networking, power conditioning, and other network infrastructure that allows our staff to establish real-world conditions to accurately gauge performance during our reviews.
We incorporate these details about the lab environment and protocols into reviews so that IT professionals and those responsible for storage acquisition can understand the conditions under which we have achieved the following results. None of our reviews are paid for or overseen by the manufacturer of the equipment we are testing. Additional details about the StorageReview Enterprise Test Lab and an overview of its networking capabilities are available on those respective pages.
Comparables:
Testbed
Our PCIe Gen4 Enterprise SSD reviews leverage a Lenovo ThinkSystem SR635 for application tests and synthetic benchmarks. The ThinkSystem SR635 is a well-equipped single-CPU AMD platform, offering CPU power well in excess of what’s needed to stress high-performance local storage. Synthetic tests don’t require a lot of CPU resources but still leverage the same Lenovo platform. In both cases, the intent is to showcase local storage in the best light possible that aligns with storage vendor maximum drive specs.
PCIe Gen4 Synthetic and Application Platform (Lenovo ThinkSystem SR635)
- 1 x AMD 7742 (2.25GHz x 64 Cores)
- 8 x 64GB DDR4-3200MHz ECC DRAM
- CentOS 7.7 1908
- ESXi 6.7u3
SQL Server Performance
Each SQL Server VM is configured with two vDisks: 100GB volume for boot and a 500GB volume for the database and log files. From a system resource perspective, we configured each VM with 8 vCPUs, 64GB of DRAM and leveraged the LSI Logic SAS SCSI controller. While our Sysbench workloads tested previously saturated the platform in both storage I/O and capacity, the SQL test is looking for latency performance.
This test uses SQL Server 2014 running on Windows Server 2012 R2 guest VMs and is stressed by Quest’s Benchmark Factory for Databases. StorageReview’s Microsoft SQL Server OLTP testing protocol employs the current draft of the Transaction Processing Performance Council’s Benchmark C (TPC-C), an online transaction-processing benchmark that simulates the activities found in complex application environments. The TPC-C benchmark comes closer than synthetic performance benchmarks to gauging the performance strengths and bottlenecks of storage infrastructure in database environments. Each instance of our SQL Server VM for this review uses a 333GB (1,500 scale) SQL Server database and measures the transactional performance and latency under a load of 15,000 virtual users.
SQL Server Testing Configuration (per VM)
- Windows Server 2012 R2
- Storage Footprint: 600GB allocated, 500GB used
- SQL Server 2014
-
- Database Size: 1,500 scale
-
- Virtual Client Load: 15,000
-
- RAM Buffer: 48GB
- Test Length: 3 hours
-
- 2.5 hours preconditioning
-
- 30 minutes sample period
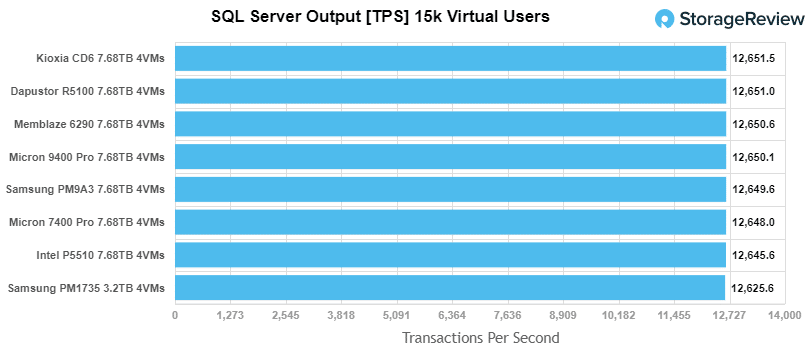
For our SQL Server transactional benchmark, the Micron 9400 Pro placed in the middle of the pack with a solid 12,650.1 TPS.
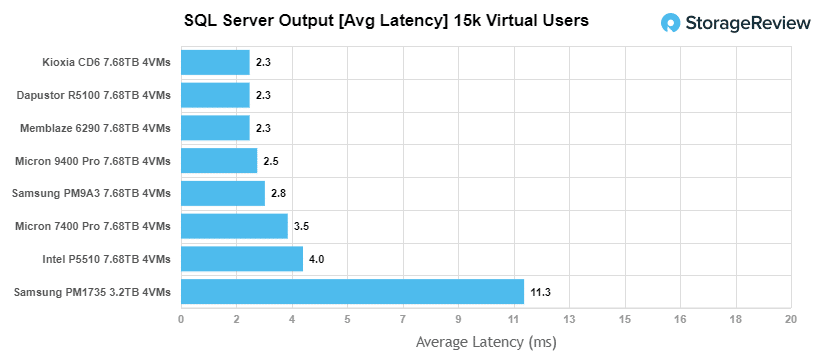
With SQL Server average latency, the 9400 Pro posted an average latency of 2.5ms, which is towards the upper middle of the pack.
Sysbench Performance
The next application benchmark consists of a Percona MySQL OLTP database measured via SysBench. This test measures average TPS (Transactions Per Second), average latency, and average 99th percentile latency as well.
Each Sysbench VM is configured with three vDisks: one for boot (~92GB), one with the pre-built database (~447GB), and the third for the database under test (270GB). From a system resource perspective, we configured each VM with 8 vCPUs, 60GB of DRAM and leveraged the LSI Logic SAS SCSI controller.
Sysbench Testing Configuration (per VM)
- CentOS 6.3 64-bit
- Percona XtraDB 5.5.30-rel30.1
-
- Database Tables: 100
-
- Database Size: 10,000,000
-
- Database Threads: 32
-
- RAM Buffer: 24GB
- Test Length: 3 hours
-
- 2 hours preconditioning 32 threads
-
- 1 hour 32 threads
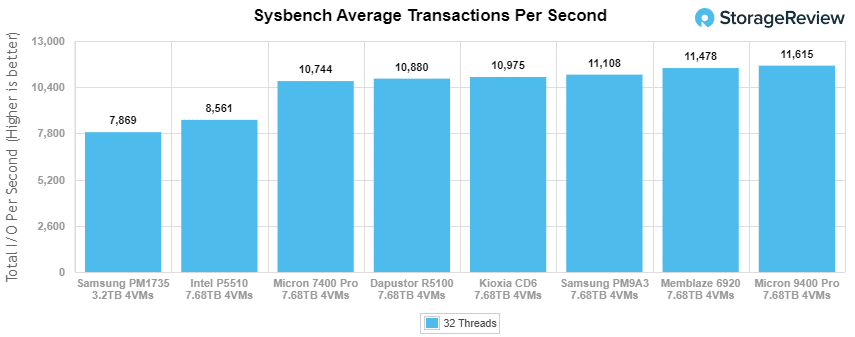
Looking at our Sysbench transactional benchmark, the Micron 9400 Pro was the best-performing drive with 11,615 TPS.
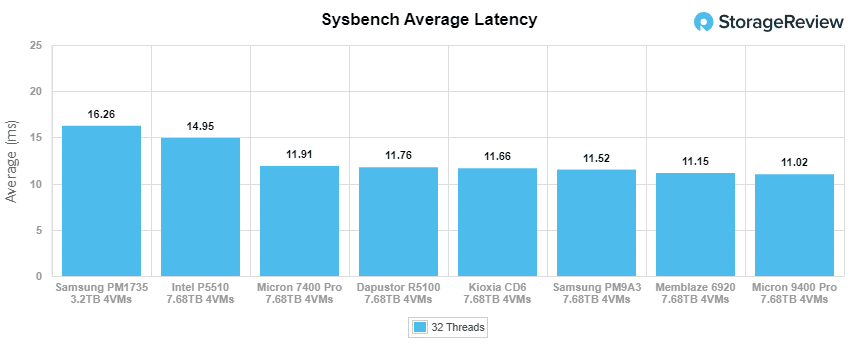
With Sysbench average latency, the 9400 Pro posted 11.02ms, which again took top spot among the tested drives.
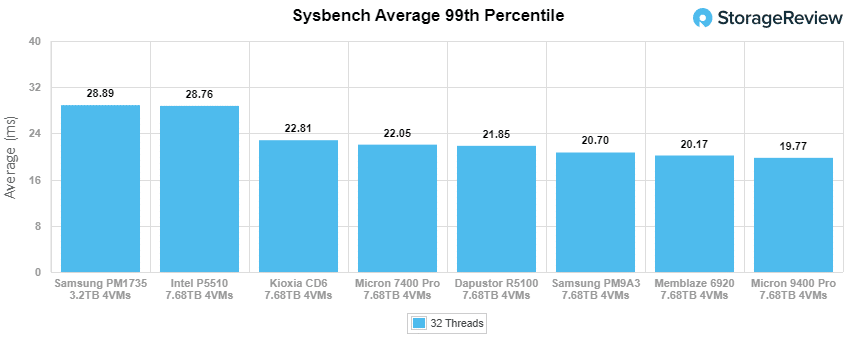
For our worst-case scenario latency (99th percentile) the Micron 9400 Pro placed first with just 19.77ms.
VDBench Workload Analysis
When it comes to benchmarking storage devices, application testing is best, and synthetic testing comes in second place. While not a perfect representation of actual workloads, synthetic tests do help to baseline storage devices with a repeatability factor that makes it easy to do apples-to-apples comparisons between competing solutions. These workloads offer a range of different testing profiles ranging from “four corners” tests, common database transfer size tests, to trace captures from different VDI environments.
All of these tests leverage the common vdBench workload generator, with a scripting engine to automate and capture results over a large compute testing cluster. This allows us to repeat the same workloads across a wide range of storage devices, including flash arrays and individual storage devices. Our testing process for these benchmarks fills the entire drive surface with data, and then partitions a drive section equal to 25% of the drive capacity to simulate how the drive might respond to application workloads. This is different from full entropy tests which use 100% of the drive and takes them into a steady state. As a result, these figures will reflect higher-sustained write speeds.
Profiles:
- 4K Random Read: 100% Read, 128 threads, 0-120% iorate
- 4K Random Write: 100% Write, 128 threads, 0-120% iorate
- 16K Sequential Read: 100% Read, 32 threads, 0-120% iorate
- 16K Sequential Write: 100% Write, 16 threads, 0-120% iorate
- 64K Sequential Read: 100% Read, 32 threads, 0-120% iorate
- 64K Sequential Write: 100% Write, 16 threads, 0-120% iorate
- 4K, 8K, and 16K 70R/30W Random Mix, 64 threads, 0-120% iorate
- Synthetic Database: SQL and Oracle
- VDI Full Clone and Linked Clone Traces
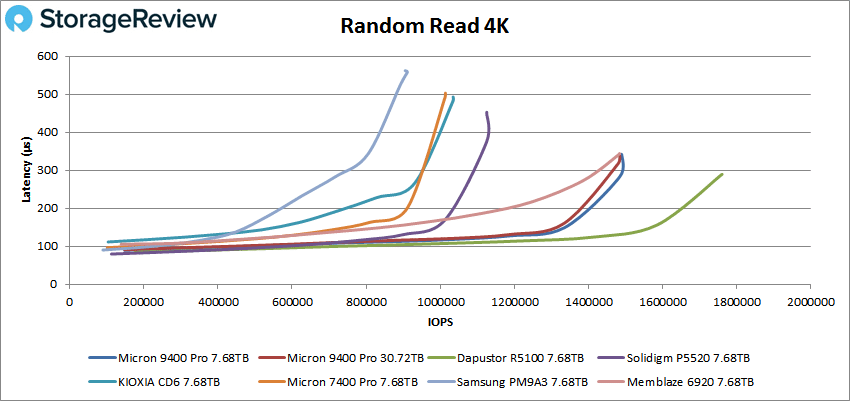
In our first VDBench Workload Analysis, random 4K read, the Micron 9400 had a solid peak performance of 1.49 million IOPS at a latency of 343µs for the 7.68TB model (the 30.72TB model was just slightly behind with 1.48 million IOPS). This was good enough for 2nd place, though still well back of the Daptustor drive.
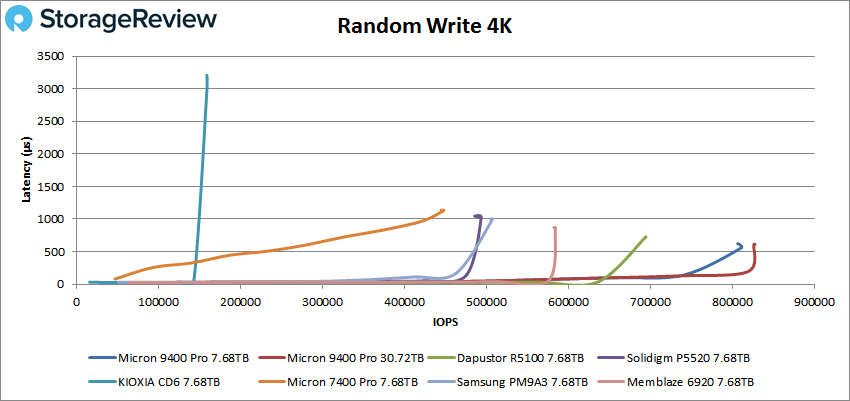
In 4K random write, the 9400 had an impressive performance, with a peak of 828K IOPS with a latency of 611µs (30.72TB) while the 7.68 model wasn’t far behind with 811K IOPS.
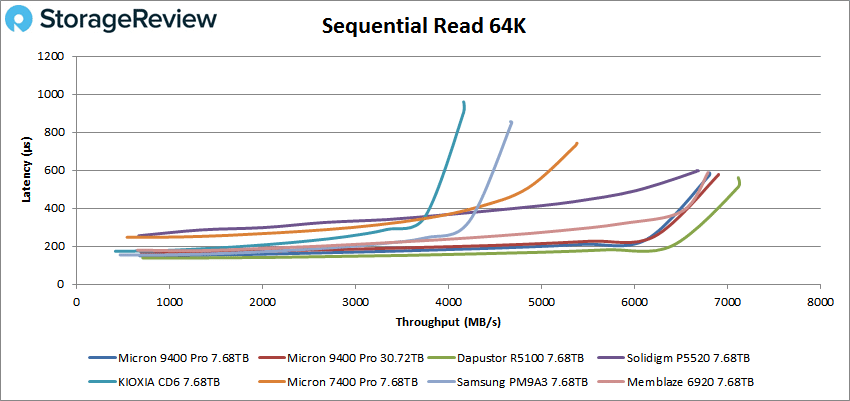
Switching over to 64k sequential workloads, the 9400 fell back to second place (behind the Dapustor drive again) in 64K write, peaking at 6.9GB/s (110K IOPS) with a latency of 576.3µs. The small capacity model was again not far behind with 6.8GB/s.
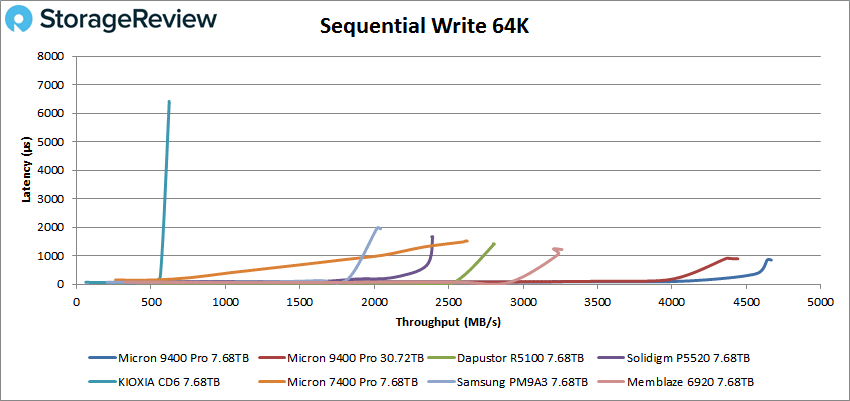
In writes, the 9400 was by far the best-performing drive, with the 7.68GB model posting an impressive 4.67GB/s write (75K IOPS) at 848µs in latency and the 30.72TB model hitting 4.44GB/s (71K IOPS). The next best performing drive was the Memblaze 6920, which posted 3.26GB/s write.
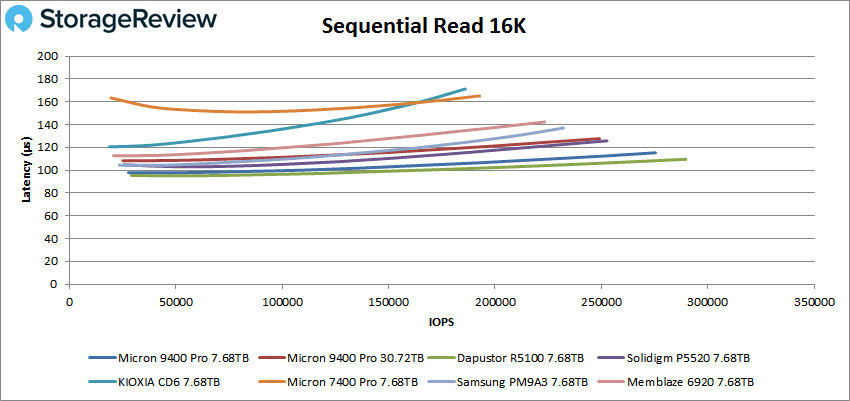
Next up is our 16K sequential performance, where the new Micron drive continued to perform well. In reads, the best performing capacity was the 7.68TB model, which posted 4.3GB/s (275K IOPS) 113µs in latency.
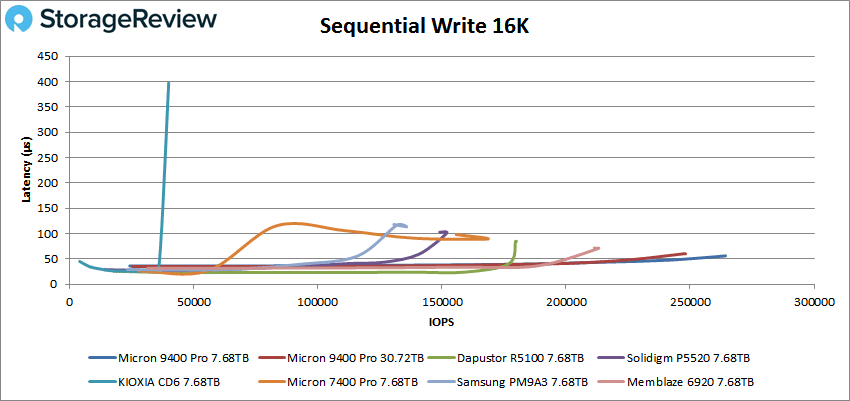
In writes, the new Micron drives once again pulled away from the pack, peaking at 4.13GB/s (264K IOPS) with 56µs in latency (30.72TB) and 3.88GB/s (248K IOPS) at 60µs (7.68TB)
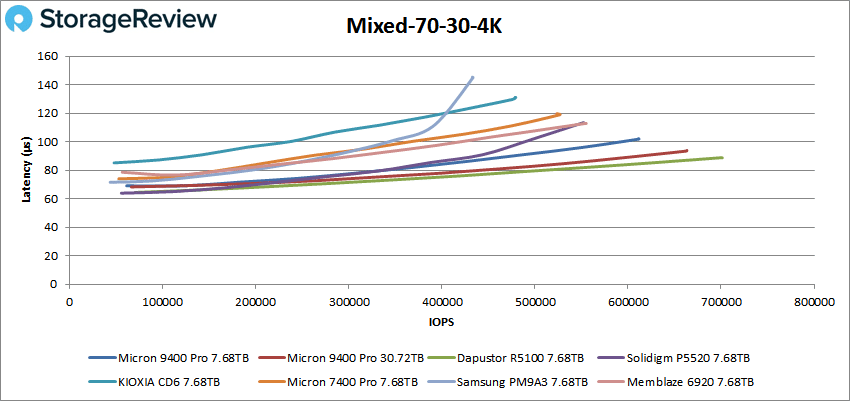
In our mixed 70/30 4k profile (70% read, 30% write), the 9400 had another impressive showing, trailing just the Dapustor drive. The top-performing capacity here was the 30.72TB, which posted a peak of 663K IOPS at 93.5µs in latency.
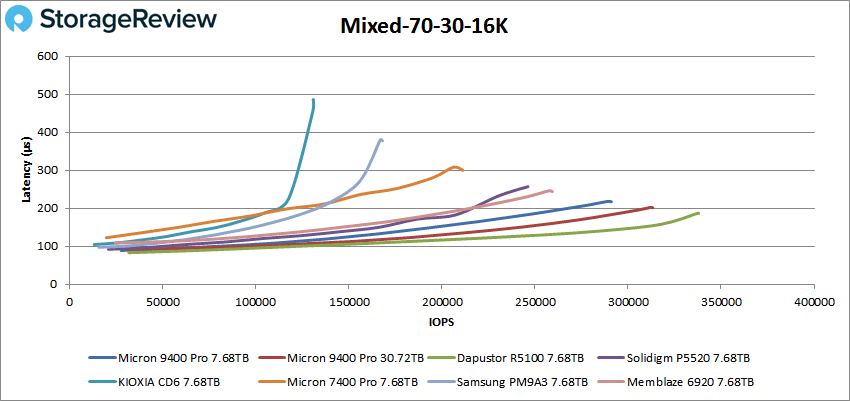
Results were more or less the same in our mixed 70/30 16k profile, as the 30.72TB 9400 again showed great numbers, peaking at 313K IOPS with 201.4µs in latency. The 7.68TB capacity wasn’t far behind.
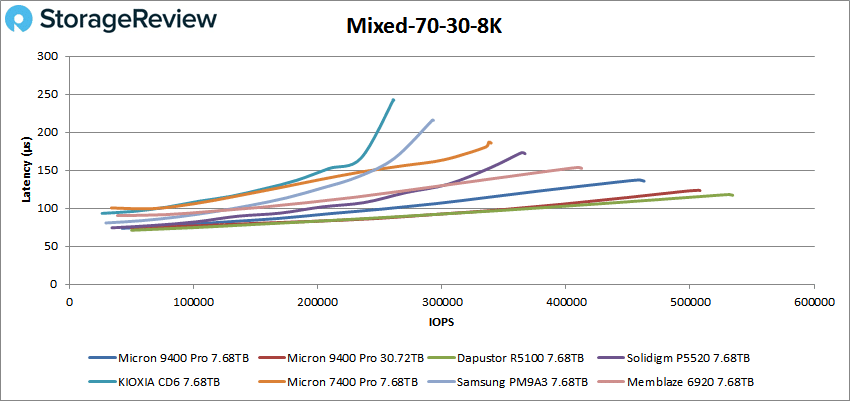
In our last mixed profile (70/30 8k), the 30.72TB Micron 9400 peaked at a solid 508K IOPS with a latency of 123.3µs while the 7.68TB topped out at 463K IOPS with 135.6µs.
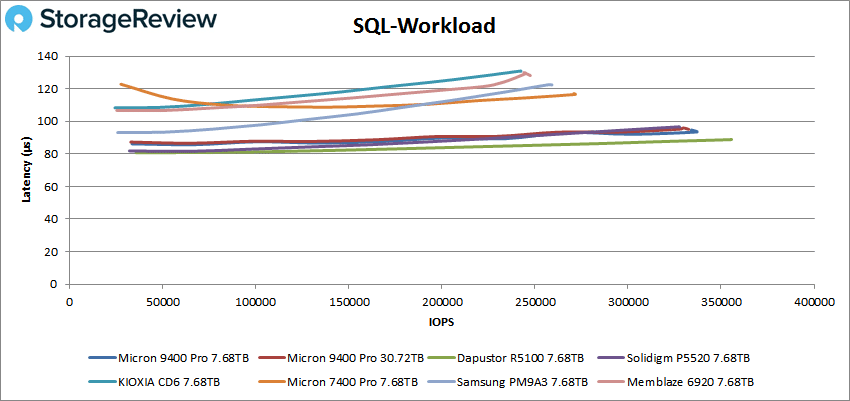
Our next set of tests is our SQL workloads: SQL, SQL 90-10, and SQL 80-20, all of which showed the Micron drive near the top of the leaderboard. Starting with SQL, the 9400 posted a peak performance of 337K IOPS with a latency of just 93.5µs (7.68TB) and 333K IOPS with a latency of 95.1µs (30.72TB).
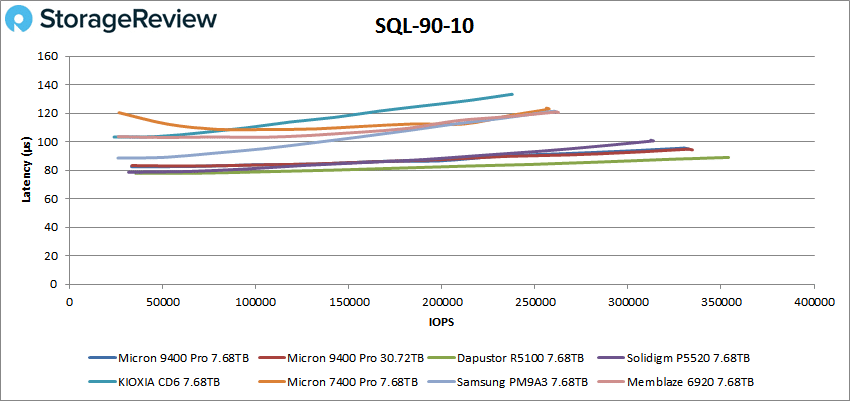
In SQL 90-10, the performance of both capacities was virtually identical, with the 30.72TB model showing slightly better results: peaking at 334K IOPS with 94.3µs, right behind the Dapustor again.
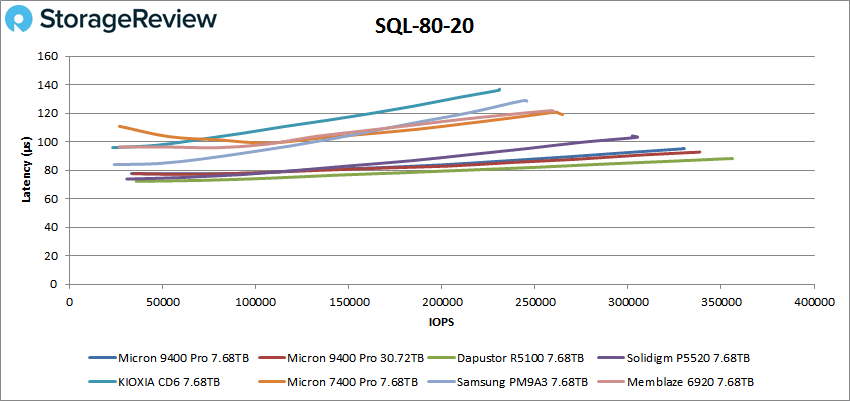
With SQL 80-20, the 30.72TB Micron 9400 peaked (and pulled away slightly) with an impressive 339K IOPS at a latency of 92.8µs, again placing second.
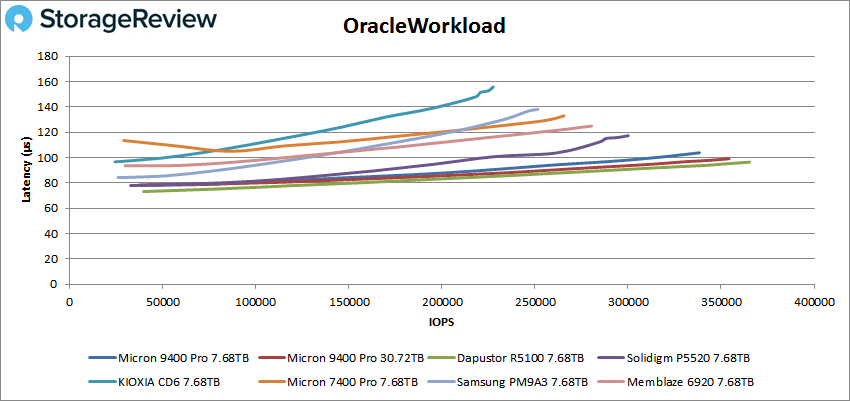
Next up are our Oracle workloads: Oracle, Oracle 90-10, and Oracle 80-20. As with the SQL benchmarks, the Micron 9400 continued to take second and third place. Starting with the general Oracle workload, the 30.72TB had a peak performance of 354K IOPS at 99.1µs, while the small capacity hit 338K IOPS at 103.8µs.
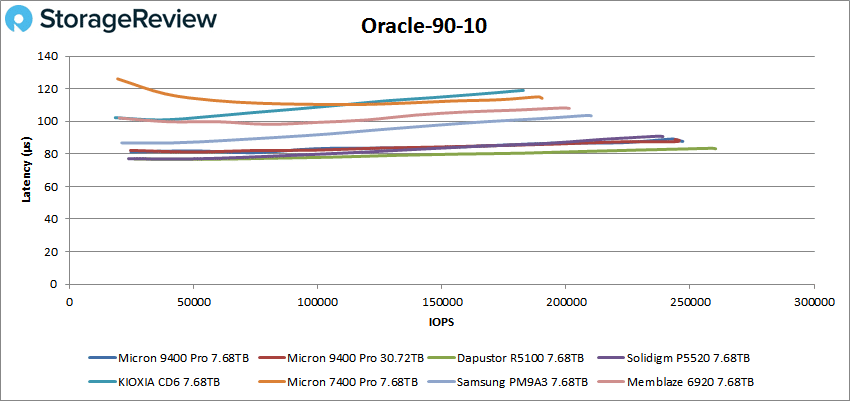
Looking at Oracle 90-10, the 9400 posted a peak performance of 246K IOPS at 88.3µs (30.72TB) and 247K IOPS at 87.7µs (7.68TB).
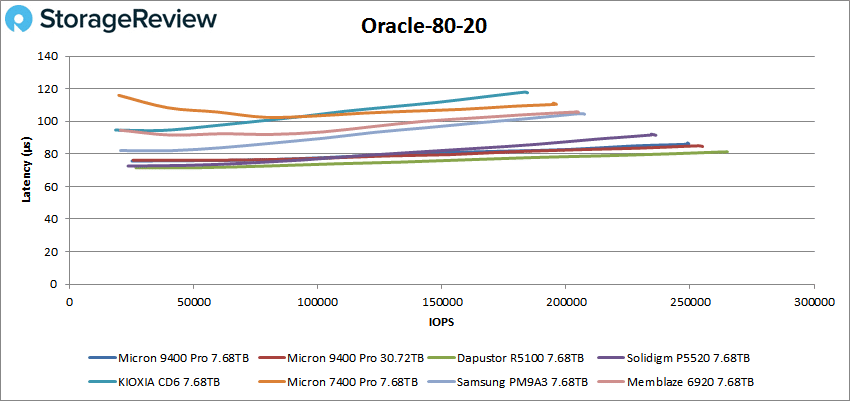
Next up is Oracle 80-20, where the 30.72TB 9400 peaked at 255K IOPS at 84.6µs trailing just the Dapustor drive.
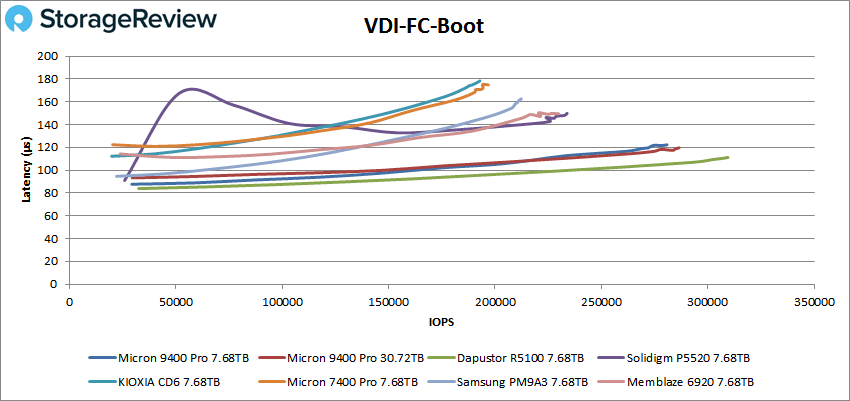
Next, we switched over to our VDI clone test, Full and Linked, where the 9400 continued its great performance. For VDI Full Clone (FC) Boot, the 30.72TB recorded the best performance of the two capacities, peaking at 286K IOPS with a latency of 119.7µs.
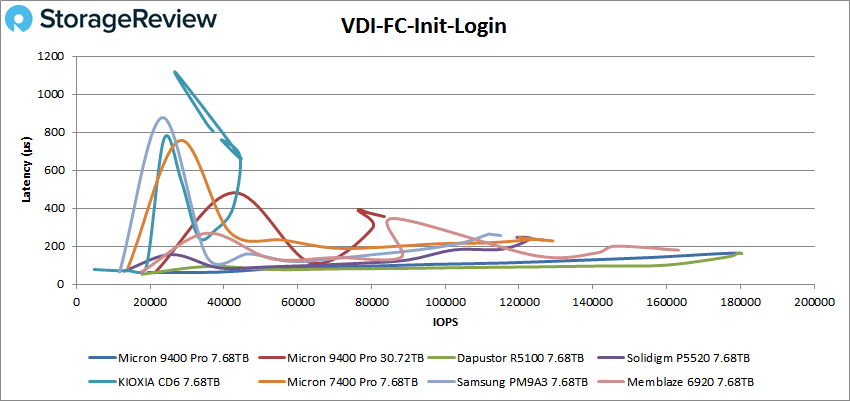
While the larger capacity fell back in the pack for the first time during VDI FC Initial Login, the 7.68TB model was the best-performing drive alongside the Dapustor. Here, it peaked at 180K IOPS with a latency of 162.8µs.
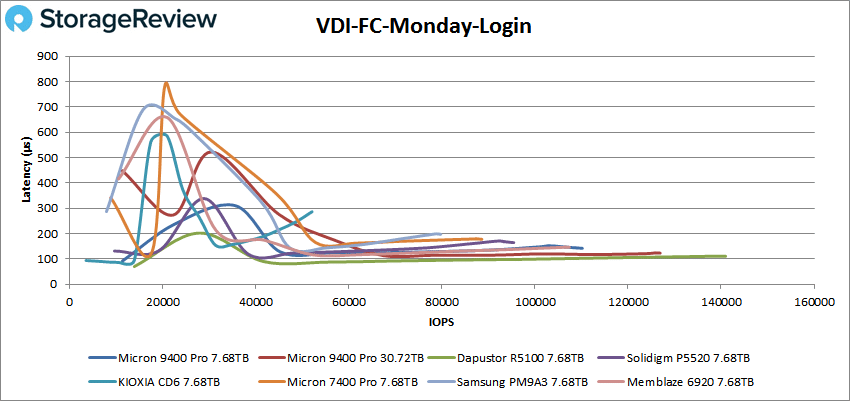
With VDI FC Monday Login, the Micron 9400 30.72TB moved back to second place, posting 127K IOPS at a latency of 110.5µs.
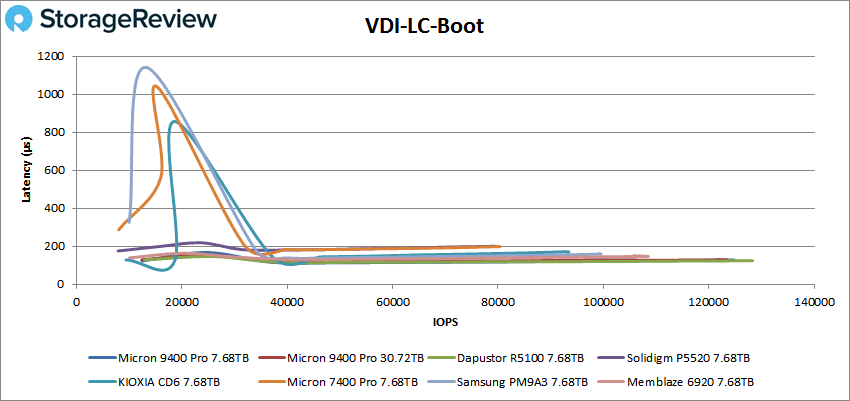
For VDI Linked Clone (LC) Boot, the 9400 showed similar performance for both capacities, with the 7.68TB model with slightly better results: it peaked at 127K IOPS with 123.3µs.
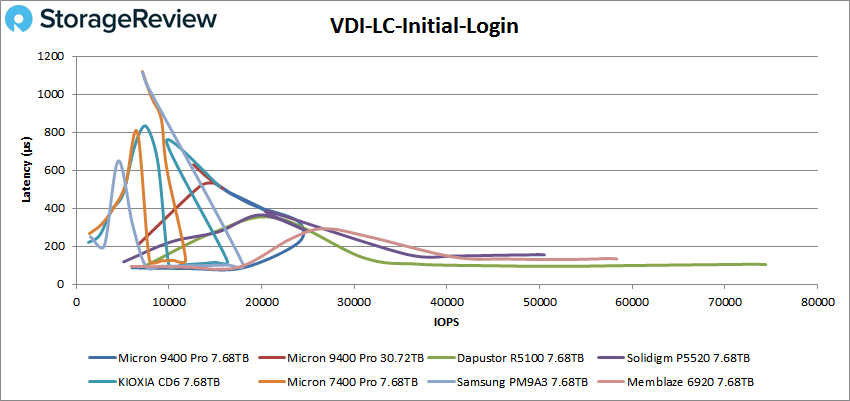
In VDI LC Initial Login, the 9400 showed instability for the first time, falling behind the leaders. Here, the 7.68TB model peaked at 24K IOPS with ~250µs before taking a pretty big hit in performance. The larger capacity fared worse, peaking at just under 16K IOPS with a latency of 500µs before also taking a hit in performance.
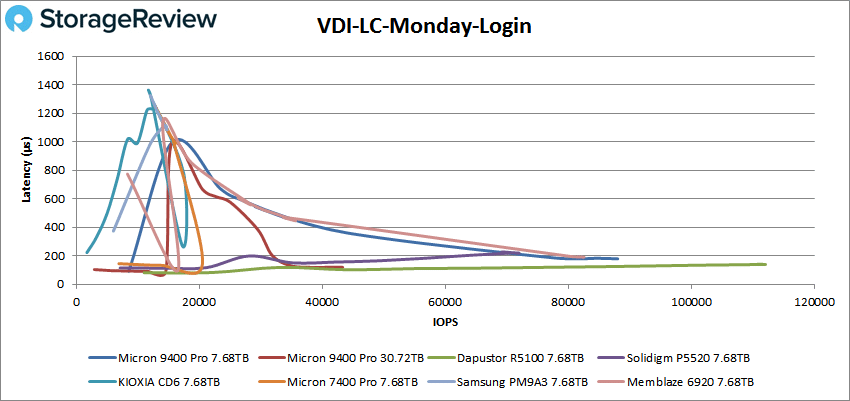
For VDI LC Monday Login, the 7.68TB model was by far the best of the two capacities, peaking at 88K IOPS with a latency of 178µs. This placed it 2nd overall.
Final Thoughts
The Micron 9400 Pro is a performance-driven data center U.3 SSD that features TLC NAND, PCIe Gen4 interface, consistent low latency, and models up to 30.72TB. This capacity potential allows enterprises to store the same amount of data in half as many servers (compared to Micron’s 7450 top capacity), or to keep the same number of servers while more than doubling their storage pool. Moreover, because power consumption is similar to previous generations, the larger-capacity Micron 9400 Pro models provide more efficiency per IOP throughout a data center.
In terms of performance, the Micron 9400 shows some impressive numbers, including 1.6 million IOPS for 100% 4K random reads and over a million IOPS in mixed workloads. After we put it through our gauntlet of tests, it certainly did not disappoint, as it often found itself at the top of the leaderboard.
Performance highlights include (indicating just the top capacity model for each test): up to 1.49 million IOPS in 4K random read (7.68TB), 828K IOPS in 4K random write (30.72TB), 6.9GB/s in 64K sequential read (30.72TB), and 4.67GB/s in 64K sequential write (7.68TB). In general, both capacities performed very similarly.
In our SQL tests, the 9400 Pro hit 337K IOPS in the SQL workload, 334K IOPS in SQL 90-10 and 339K IOPS in SQL 80-20. For Oracle, we saw 354K IOPS in the Oracle workload, 247K IOPS for Oracle 90-10, and 255K IOPS for Oracle 80-20 (all top SQL and Oracle results were from the 30.72TB capacity with the exception of the Oracle 90-10 test).
Finally, our VDI Full and Linked clone showed highlights include: For VDI Full Clone (FC) Boot, the 30.72TB recorded 286K IOPS while initial login peaked at 180K IOPS for the 7.68TB model. With VDI FC Monday Login, the Micron 9400 30.72TB posted 127K IOPS. Moving on to VDI Linked Clone (all 7.68TB results), boot peaked at 127K for the 7.68TB model, while hitting 24K IOPS for initial login (it’s only flop of the performance section). For VDI LC Monday Login, the 7.68TB model hit 88K IOPS.
Overall, the Micron 9400 Pro had an impressive overall showing and comes in a massive 30.72TB capacity with TLC NAND. The drives are a great choice for real-world applications and did well overall in our testing. This line only comes in U.3, so Micron opted to not include EDSFF this time around. That probably doesn’t matter a lot in a Gen4 product though, as traditional server slots are going to be predominantly U.2/U.3 until E3.S takes over in Gen5 servers in the coming months. What may be the last Gen4 enterprise drive from the company is very strong though and worthy of consideration, especially at that 30.72TB capacity should your organization have such a need.


 Amazon