

Phison’s new PS5028-E28 (“E28”) controller is the company’s second-generation PCIe Gen5 client SSD platform, designed to extract every last bit of performance from the 32 GT/s x4 interface. Built on a 6nm process, the E28 pairs KIOXIA BiCS8 NAND (up to 2,400 MT/s per channel) with a three-core architecture that features two dedicated Phison CoX processors handling flash management and QoS.
The sample we have is a preview model. Phison shipped us a reference-design drive running late-beta firmware that is “close to production.” Based on experience, early firmware drives already run within a few percent of their final speeds; however, we can still expect a slight boost once Phison fine-tunes the garbage collection and thermal throttling settings. Phison’s goal is to give us something concrete to test while they finalize and tweak everything. As such, we’re treating this article as a first look rather than a complete verdict.
Phison PS5028-E28 Potential Performance and Power Efficiency
Phison is quoting some impressive peak speeds of 14.9 GB/s read and 14 GB/s write, with random performance reaching up to 2.6 million read IOPS and 3.0 million write IOPS. Capacities will span 1TB, 2TB, and 4TB in the familiar single-sided M.2 2280 form factor, and the controller supports the full NVMe 2.0 feature set, plus power-state granularity down to an L1.2 idle state of under 5mW.
Last year’s Gen4 E26 achieved peak read speeds of approximately 12GB/s, write speeds of 11GB/s, and 1.5 million to 2.0 million IOPS on a 12nm process. Phison’s move to Gen5 via a 6nm process, wider channel parallelism, and revamped power-state logic enables the E28 to deliver roughly 25-30% higher sequential speeds and up to 50% better random I/O performance, while also reducing both active and idle power consumption. According to Phison’s internal benchmarks, the E28 outperforms the SM2508 in power efficiency, which could be crucial for thermally constrained environments such as compact desktops or laptops.
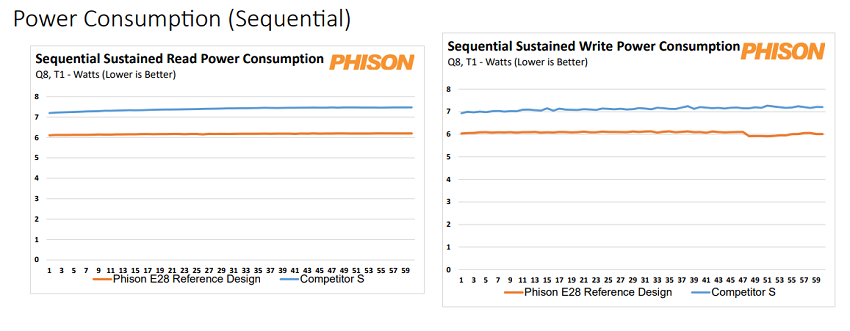
While we didn’t independently validate these numbers in our power testing, Phison has shared internal data comparing their E28 reference design against what they label as “Competitor S” (possibly SMI’s SM2508). According to Phison’s charts, the E28 draws measurably less power during both sequential and random workloads. For instance, in sequential sustained reads and writes at QD8/T1, Phison reports power consumption advantages of roughly 1 watt over the competing controller.
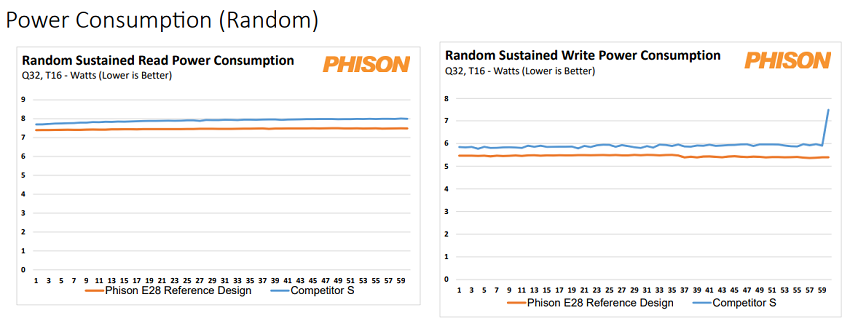
 Similar margins are also observed in random QD32/T16 workloads, with the E28 maintaining lower wattage across the board. Phison aims to close the efficiency gap that formed during the SM2508’s rise, and based on their numbers, they appear to be making meaningful progress.
Client notebooks stand to benefit from these improvements in power efficiency. Phison states that approximately half of all laptops shipping this year will feature a Gen5-capable slot, despite most OEMs still utilizing Gen4 drives to manage costs and thermal management. Because the E28’s idle power is specified at under 5mW in L1.2, it finally looks possible to drop a true 14GB/s drive into mobile workstations without straining the battery.
Phision E28 Reference-design Build
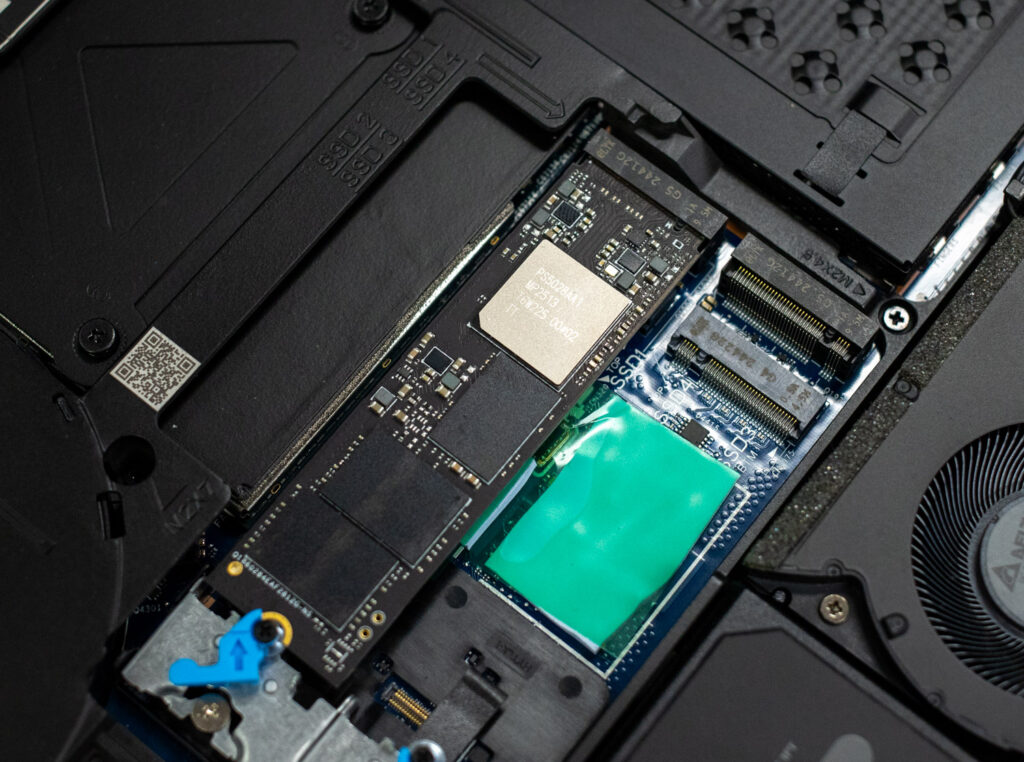
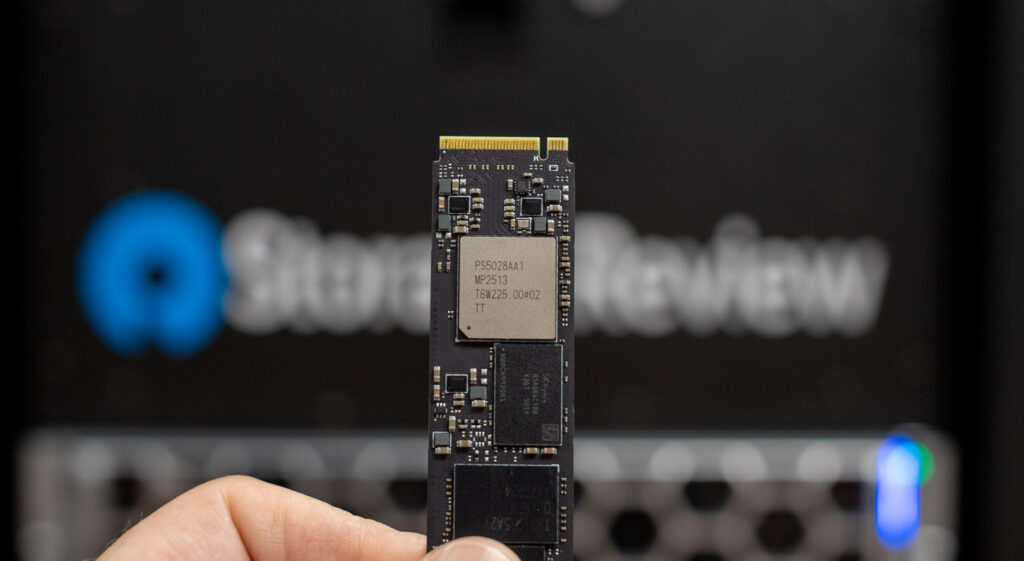
Overall, the E28 features a typical high-performance Gen5 SSD build, optimized for bandwidth and thermal efficiency. As you can see below, a Gen5 controller built on a 6nm node is paired with a single SK hynix DRAM module (H5AG46C8Y8R), which is crucial for maintaining consistent performance under load, particularly with high-capacity or random-heavy workloads.
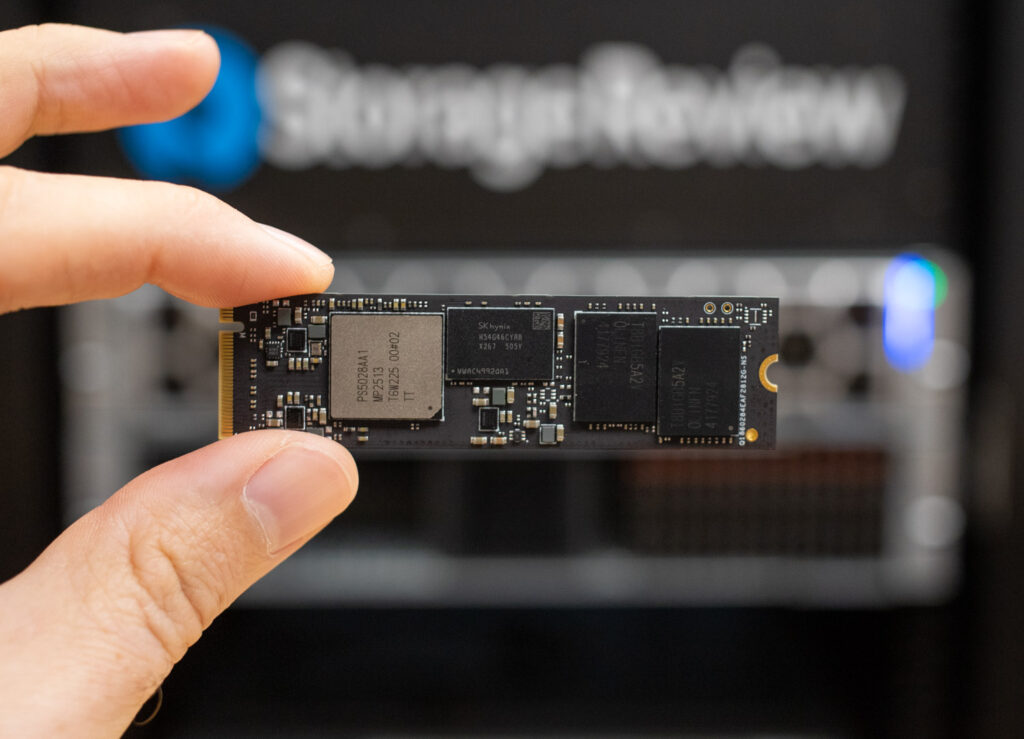
Next to the DRAM are two NAND flash packages labeled ‘TBi08G1BSA2’, each containing a 1TB KIOXIA BiCS8 TLC NAND die, for a total of 2TB. These chips are capable of running at speeds up to 2400 MT/s. The single-sided PCB layout makes the drive a good fit for space-constrained systems, such as laptops and compact desktops. Phison has also indicated that upcoming designs will support LPDDR5, which will help further reduce power consumption. This layout also benefits thermal management by allowing more effective passive or active cooling solutions.
Phision E28 Family
Phison is also positioning the E28 as a family of controllers rather than a single client part. Alongside the consumer drive we’re testing, an E28 DC variant is in development for enterprise workloads, while an E28 AI model will integrate on-board inferencing hooks for Phison’s aiDAPTIV+ framework. This is similar to the way E26 added the E26-DC and eventually powered a few AI accelerator cards; however, the E28’s higher ceiling should give system builders more headroom for sustained, mixed-IO scenarios.
With all of that said, we’ll now put the E28 through our full suite of real-world benchmarks to see how it performs.
Phison PS5028-E28 “E28” Pre-Release Specifications
| Specification | Detail |
| Capacities* | 1TB (1,000GB), 2TB (2,000GB), 4TB (4,000GB) |
| Form factor | M.2 2280-S3-M – single-sided module |
| Controller & Process | Phison PS5028-E28 (6 nm, 3-core + 2 CoX coprocessors) |
| NAND Flash | KIOXIA BiCS8 TLC; Toggle 5.2 @ 2400 MT/s; up to 2 × BGA308 packages (32 CE) |
| Interface / Protocol | PCIe 5.0 ×4, NVMe 2.0 (back-compatible with Gen4/3/2/1) |
| Sequential Performance |
|
| Random Performance (4 KB, QD 128) |
|
| Reliability | MTBF 1.5 M hours | UBER < 1 × 10¹⁶ |
| Operating Temperature | 0 °C – 70 °C (drive) | –40 °C – 85 °C (storage) |
| Power Management | PS0–PS4, APST, ASPM, PCIe L1.2 Idle (L1.2) < 5 mW | Active draw – TBD |
| Data-Integrity Features | LDPC + RAID ECC, SRAM ECC, SmartRefresh, End-to-End path protection |
| Security | TCG Pyrite 1.0, NVMe sanitize, signed firmware update |
| Other Features | Dynamic wear-leveling, bad-block management, SMART, TRIM, thermal throttling |
Phison PS5028-E28 Performance
Comparables
Before diving into the benchmarks, here’s a list of comparable Gen5 drives tested alongside a 2TB Phison PS5028-E28 (E28) reference design, along with a few Gen4 SSDs:
- PNY CS2150
- Lexar Professional NM1090 PRO
- SK hynix Platinum P51
- Kingston FURY Renegade G5
- SanDisk WD_BLACK SN8100
- Crucial T705
- Crucial P510
- Samsung 9100 Pro
- Samsung 990 Pro (PCIe Gen4)
- WD SN850X (PCIe Gen4)
We subjected these drives to various tests to evaluate their real-world and synthetic performance. This includes LLM load times to measure how quickly they handle large AI models, DirectStorage tests to assess how fast they load game assets and process in-game data, and Blackmagic Design tests to evaluate read and write speeds for high-resolution video editing. We’ll also run PCMark 10 to gauge overall system responsiveness, 3DMark Storage to test gaming performance, and FIO tests to measure peak sequential and random read/write speeds under heavy workloads.
Here’s the high-performance test rig we used for benchmarking:
- CPU: AMD Ryzen 7 9800X3D
- Motherboard: Asus ROG Crosshair X870E Hero
- RAM: G.SKILL Trident Z5 Royal Series DDR5-6000 (2x16GB)
- GPU: NVIDIA GeForce RTX 4090
- OS: Windows 11 Pro, Ubuntu 24.10 Desktop
Peak Synthetic Performance
The FIO test is a flexible and powerful benchmarking tool used to measure the performance of storage devices, including SSDs and HDDs. It evaluates metrics such as bandwidth, IOPS (Input/Output Operations Per Second), and latency under different workloads, like sequential and random read/write operations. This test helps to assess the peak performance of storage systems, making it useful for comparing different devices or configurations. We measured the peak burst performance for this test, limiting the workload to a 10GB footprint on both SSDs.
Overall, the Phison E28 reference SSD delivers impressive performance results in our FIO synthetic tests, particularly when it comes to random workloads. While its sequential throughput hits a strong 14,000MB/s for both reads and writes (slightly behind the top performers like the SN8100 and Renegade G5), it stands out in 4K random operations. Here, it achieved 2.559 million IOPS in random reads, with an impressive 3.288 million IOPS in random writes, the latter easily surpassing all competitors. Latency stays competitive across the board, especially under write-heavy loads, where it actually drops below its read latency. Overall, this reference sample suggests that Phison’s next-generation controller will be a significant enhancement to any SSD once it reaches the retail market.
| FIO Test (higher MB/s/IOPS is better) | Sequential 128K Read (1T/64Q) | Sequential 128K Write (1T/64Q) | Random 4K Read (16T/32Q) | Random 4K Write (16T/32Q) |
| SanDisk SN8100 | 15,000 MB/s (0.56ms avg latency) | 14,100 MB/s (0.59ms avg latency) | 2.312M IOPS (0.22ms avg latency) | 2.144M IOPS (0.24ms avg latency) |
| Kingston FURY Renegade G5 | 14,600 MB/s (0.57ms avg latency) | 14,100 MB/s (0.59ms avg latency) | 2.028M IOPS (0.25ms avg latency) | 2.028M IOPS (0.25ms avg latency) |
| Samsung 9100 Pro | 14,600 MB/s (0.57ms avg latency) | 13,300 MB/s (0.63ms avg latency) | 2.734M IOPS (0.18ms avg latency) | 2.734M IOPS (0.19ms avg latency) |
| SK hynix Platinum P51 | 14,500 MB/s (0.58ms avg latency) | 13,500 MB/s (0.62ms avg latency) | 2.369M IOPS (0.22ms avg latency) | 2.669M IOPS (0.19ms avg latency) |
| Crucial T705 | 14,400 MB/s (0.58ms avg latency) | 12,300 MB/s (0.68ms avg latency) | 1.585M IOPS (0.32ms avg latency) | 2.703M IOPS (0.19ms avg latency) |
| Phison PS5028-E28 | 14,000 MB/s (0.60ms avg latency) | 14,000 MB/s (0.57ms avg latency) | 2.559M IOPS (0.32ms avg latency) | 3.288M IOPS (0.32ms avg latency) |
| Lexar Professional NM1090 PRO | 13,800GB/s (0.61ms avg latency) | 13,600 MB/s (0.62ms avg latency) | 2.073M IOPS (0.32ms avg latency) | 2.215M IOPS (0.23ms avg latency) |
| PNY CS2150 | 10,400GB/s (0.80ms avg latency) | 8,801MB/s (0.95ms avg latency) | 1.379M IOPS (0.371ms avg latency) | 1.623 IOPS (0.32ms avg latency) |
| Crucial P510 | 8,835 MiB/s (0.90 ms avg latency) | 9,961 MB/s (0.80 ms avg latency) | 1.163M IOPS (0.44ms avg latency) | 1.196M IOPS (0.51ms avg latency) |
| Samsung 990 Pro | 7,483 MB/s (1.12ms avg latency) | 7,197 MB/s (1.16ms avg latency) | 1.400M IOPS (0.36ms avg latency) | 1.403M IOPS (0.36ms avg latency) |
| WD SN850X 2TB | 6,632 MB/s (0.76ms avg latency) | 7,235 MB/s (0.92ms avg latency) | 1.2M IOPS (0.43ms avg latency) | 825K IOPS (0.62ms avg latency) |
Average LLM Load Time
The Average LLM Load Time test evaluated the load times of three different LLMs: DeepSeek R1 7B, Meta Llama 3.2 11B, and DeepSeek R1 32B. Each model was tested 10 times, and the average load time was calculated. This test measures the drive’s ability to load large language models (LLMs) into memory quickly. LLM load times are critical for AI-related tasks, especially for real-time inference and extensive dataset processing. Faster loading enables the model to process data quickly, thereby improving AI responsiveness and reducing waiting time.
Here, the Phison E28 holds its own among the top-tier performers. Loading DeepSeek R1 7B took just 2.57 seconds on average, with Meta Llama 3.2 11B following at 3.64 seconds, and the largest model, DeepSeek R1 32B, completing in 4.34 seconds. While it wasn’t the fastest overall (that title goes to the SK hynix P51 and SN8100), the E28 lands in the upper tier. These results indicate that the E28’s ability can certainly handle AI-heavy tasks without lag.
| Average LLM Load Time (lower is better) | DeepSeek R1 7B | Meta Llama 3.2 11B Vision | DeepSeek R1 32B |
| SK hynix Platinum P51 | 2.5481s | 3.5809s | 4.1790s |
| SanDisk SN8100 | 2.5702s | 3.5856s | 4.2870s |
| Phison PS5028-E28 | 2.5730s | 3.6380s | 4.3407s |
| Samsung 9100 Pro 4TB | 2.6173s | 3.6017s | 4.3735s |
| PNY CS2150 | 2.8107s | 3.6820s | 4.8962s |
| Crucial T705 2TB | 2.8758s | 3.6312s | 5.1080s |
| Samsung 990 Pro 2TB | 2.8758s | 3.6312s | 5.1080s |
| Crucial P510 1TB | 2.8817s | 3.6631s | 5.0594s |
| WD SN850X 2TB | 3.0082s | 3.6543s | 5.4844s |
| Kingston FURY Renegade G5 | 3.1843s | 4.8009s | 4.6523s |
| Lexar Professional NM1090 PRO | 3.2135s | 4.9504s | 7.2108s |
3DMark Direct Storage
The 3DMark DirectStorage Feature Test evaluates how Microsoft’s DirectStorage optimizes game asset loading on PCIe SSDs. By reducing CPU overhead and improving data transfer speeds, DirectStorage enhances loading times, especially when paired with GDeflate compression and Windows 11’s BypassIO. This test isolates storage performance to highlight the potential bandwidth improvements when DirectStorage is enabled.
Here, the Phison E28 reference SSD demonstrates strong and consistent throughput across all categories. With 26.22GB/s for compressed asset transfers (GDeflate), it closely trails the SK hynix P51 and matches other top-tier drives like the SN8100. Its performance remains solid, even under uncompressed transfers, posting 10.89GB/s with DirectStorage enabled and 7.46GB/s with it disabled. GDeflate decompression throughput was particularly strong at 65.58GB/s, which means the E28 is well-equipped to handle future gaming workloads and streaming-intensive titles. Ultimately, though, the top few drives have very narrow margins.
| 3DMark Direct Storage, (GB/s, higher is better) | Storage to VRAM (GDeflate Compression) | Storage to VRAM (DirectStorage on, Uncompressed) | Storage to VRAM (DirectStorage off, Uncompressed) | Storage to RAM (DirectStorage on, Uncompressed) | Storage to RAM (DirectStorage off, Uncompressed) | GDeflate Decompression Bandwidth |
| SK hynix Platinum P51 | 26.32 | 11.20 | 7.75 | 12.85 | 9.46 | 64.68 |
| Phison PS5028-E28 | 26.22 | 10.89 | 7.46 | 11.15 | 9.86 | 65.58 |
| SanDisk SN8100 | 26.11 | 12.94 | 7.63 | 12.94 | 9.78 | 64.51 |
| Crucial T705 2TB | 25.75 | 10.71 | 8.79 | 12.03 | 8.83 | 66.36 |
| Lexar Professional NM1090 PRO | 24.03 | 11.23 | 7.57 | 12.18 | 8.72 | 63.15 |
| Samsung 9100 Pro 4TB | 23.77 | 11.26 | 8.92 | 11.62 | 9.48 | 66.61 |
| Kingston FURY Renegade G5 | 23.29 | 10.03 | 7.44 | 11.81 | 9.63 | 65.79 |
| PNY CS2150 | 19.49 | 8.60 | 6.98 | 9.22 | 7.70 | 62.43 |
| WD SN850X 2TB | 15.28 | 11.11 | 8.93 | 6.78 | 6.27 | 64.96 |
| Samsung 990 Pro 2TB | 14.18 | 11.28 | 8.84 | 6.57 | 6.20 | 65.71 |
| Crucial P510 1TB | 19.63 | 8.33 | 6.92 | 9.06 | 7.49 | 66.22 |
Blackmagic Disk Speed Test
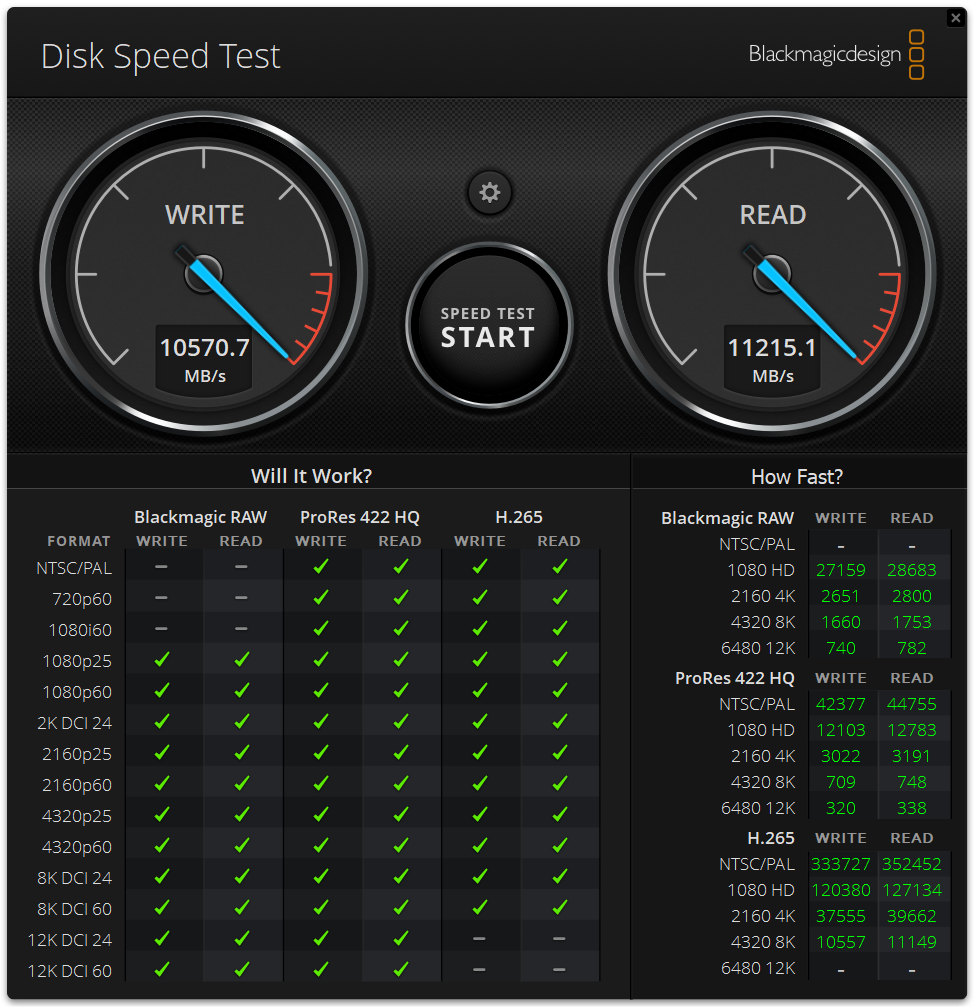
The Blackmagic Disk Speed Test benchmarks a drive’s read and write speeds, estimating its performance, especially for video editing tasks. It helps users ensure their storage is fast enough for high-resolution content, like 4K or 8K video.
The Phison E28 reference SSD landed at the top of the chart, posting 11,216MB/s read and 10,571MB/s write speeds. This marks a clear lead in reads over its closest competitors, including the SanDisk SN8100 and Kingston Fury Renegade G5. These results indicate that the controller is already well-optimized for high-bandwidth video workloads, such as 4K/8K video editing or raw footage playback.
Here’s our current Blackmagic disk speed leaderboard:
| Blackmagic Disk Speed (MB/s, higher is better) | Read MB/s | Write MB/s |
| Phison PS5028-E28 | 11,216.1 | 10,570.7 |
| SanDisk SN8100 | 10,005.2 | 10,581.0 |
| Kingston FURY Renegade G5 | 9,665.0 | 10,831.0 |
| Samsung 9100 Pro 4TB | 9,542.3 | 9,907.9 |
| SK hynix Platinum P51 | 9,241.0 | 9,109.0 |
| Lexar Professional NM1090 PRO | 9,149.2 | 10,466.6 |
| Crucial T705 2TB | 8,464.2 | 10,256.4 |
| Crucial P510 1TB | 7,853.9 | 7,939.6 |
| PNY CS2150 | 6,625.5 | 7,299.5 |
| WD SN850X 2TB | 5,862.6 | 5,894.8 |
| Samsung 990 Pro 2TB | 5,769.5 | 5,842.9 |
PCMark10 Storage
PCMark 10 Storage Benchmarks evaluate real-world storage performance using application-based traces. They test system and data drives, measuring bandwidth, access times, and consistency under load. These benchmarks offer practical insights beyond synthetic tests, enabling users to compare modern storage solutions effectively.
The Phison PS5028-E28 reference SSD took the top spot again with an impressive score of 9,347, outpacing every other drive in our comparison pool. Backed by a bandwidth of 1,333MB/s and a very low 16µs average access time, the E28 demonstrates strong responsiveness in real-world application workloads. This bodes well for the controller’s future in upcoming Gen5 consumer and OEM SSDs.
| PCMark 10 Data Drive (higher is better) | Overall Score |
| Phison PS5028-E28 | 9,347 |
| Crucial T705 2TB | 8,783 |
| SK hynix Platinum P51 | 8,665 |
| SanDisk SN8100 | 8,644 |
| Lexar Professional NM1090 PRO | 8,247 |
| Kingston FURY Renegade G5 | 8,062 |
| Samsung 9100 Pro 4TB | 7,552 |
| Samsung 990 Pro 2TB | 7,173 |
| Crucial P310 2TB | 6,436 |
| PNY CS2150 | 6,070 |
| WD SN850X 2TB | 4,988 |
3DMark Storage
The 3DMark Storage Benchmark tests your SSD’s gaming performance by measuring tasks like loading games, saving progress, installing game files, and recording gameplay. It evaluates how well your storage handles real-world gaming activities and supports the latest storage technologies for accurate performance insights.
The Phison PS5028-E28 performed exceptionally well, achieving a score of 5,879, which was second only to the SanDisk SN8100. This places the E28 comfortably ahead of several high-end Gen5 contenders by several hundred points. The E28’s strong showing here indicates it’s well-suited for gaming workloads, particularly those that take advantage of Microsoft’s DirectStorage technology.
| 3DMark Storage benchmark (higher is better) | Overall Score |
| SanDisk SN8100 | 6,047 |
| Phison PS5028-E28 | 5,879 |
| Kingston FURY Renegade G5 | 5,670 |
| Crucial T705 2TB | 5,100 |
| SK hynix Platinum P51 | 5,082 |
| Lexar Professional NM1090 PRO | 4,828 |
| Samsung 9100 Pro 4TB | 4,779 |
| Crucial P510 1TB | 4,148 |
| PNY CS2150 | 4,193 |
| Samsung 990 Pro 2TB | 4,128 |
| WD SN850X 2TB | 3,962 |
| Crucial P310 2TB | 3,848 |
GPU Direct Storage
One of the tests we conducted on this testbench was the Magnum IO GPU Direct Storage (GDS) test. GDS is a feature developed by NVIDIA that allows GPUs to bypass the CPU when accessing data stored on NVMe drives or other high-speed storage devices. Instead of routing data through the CPU and system memory, GDS enables direct communication between the GPU and the storage device, significantly reducing latency and improving data throughput.
How GPU Direct Storage Works
Traditionally, when a GPU processes data stored on an NVMe drive, the data must first travel through the CPU and system memory before reaching the GPU. This process introduces bottlenecks, as the CPU becomes a middleman, adding latency and consuming valuable system resources. GPU Direct Storage eliminates this inefficiency by enabling the GPU to access data directly from the storage device via the PCIe bus. This direct path reduces the overhead associated with data movement, allowing faster and more efficient data transfers.
AI workloads, especially those involving deep learning, are highly data-intensive. Training large neural networks requires processing terabytes of data, and any delay in data transfer can lead to underutilized GPUs and longer training times. GPU Direct Storage addresses this challenge by ensuring that data is delivered to the GPU as quickly as possible, minimizing idle time and maximizing computational efficiency.
In addition, GDS is particularly beneficial for workloads that involve streaming large datasets, such as video processing, natural language processing, or real-time inference. By reducing the reliance on the CPU, GDS accelerates data movement and frees up CPU resources for other tasks, further enhancing overall system performance.
Results
In our GPU Direct Storage (GDS) benchmark, the Phison PS5028-E28 reference drive turned in very competitive results. At a 16K block size with a queue depth of 128, it achieves 3.7 GiB/s read and 2.4 GiB/s write speeds, matching the best drives in this segment, such as the Kingston Renegade G5. Latency is also solid at 0.519 ms for reads and 0.824 ms for writes, translating to 245.1K and 154.7K IOPS, respectively.
At the 128K block level, the E28 maintains a strong position, achieving 5.9 GiB/s in both reads and writes, with latencies just above 2.6 ms, which yield ~48,000 IOPS. These results place it in line with top-tier Gen5 drives, such as the SanDisk SN8100 and Kingston G5, but with slightly better write latency than most.
Performance remains impressive even at the demanding 1M block size, where the E28 achieves 6.4 GiB/s reads and 6.2 GiB/s writes. Latency in this tier hovers near 20 ms, with IOPS at 6.5K and 6.4K, again among the highest in the class. Overall, the E28 not only matches the leaders in throughput but also excels in maintaining low latency and high IOPS across various block sizes, making it a solid choice for GDS-enabled systems that prioritize speed and consistency.
Here’s a full run-down:
| GDSIO Chart (16K,128K,1M Block Size Averages) | (16K Block Size 128 IO Depth) Average Read | (16K Block Size 128 IO Depth) Average Write | (128K Block Size 128 IO Depth) Average Read | (128K Block Size 128 IO Depth) Average Write | (1M Block Size 128 IO Depth) Average Read | (1M Block Size 128 IO Depth) Average Write |
| Phison PS5028-E28 | 3.7 GiB/s (0.519ms) IOPS: 245.1K |
2.4 GiB/s (0.824ms) IOPS: 154.7K | 5.9 GiB/s (2.647ms) IOPS: 48.2K | 5.9 GiB/s (2.650ms) IOPS: 48.31K |
6.4 GiB/s (19.650ms) IOPS: 6.5K |
6.2 GiB/s (20.033ms) IOPS: 6.4K |
| Kingston FURY Renegade G5 | 3.7 GiB/s (0.526ms) IOPS: 242.1K | 2.4 GiB/s (0.824ms) IOPS: 154.7K | 5.9 GiB/s (2.704ms) IOPS: 48.5K | 5.8 GiB/s (0.564ms) IOPS: 47.3K | 6.5 GiB/s (19.356ms) IOPS: 6.6K | 6.3 GiB/s (19.690ms) IOPS: 6.5K |
| Lexar Professional NM1090 PRO | 3.6 GiB/s (0.533ms) IOPS: 238.7K | 2.3 GiB/s (0.845ms) IOPS: 150.8K | 5.9 GiB/s (2.639ms) IOPS: 48.4K | 4.2 GiB/s (3.714ms) IOPS: 34.4K | 6.5 GiB/s (19.274ms) IOPS: 6.6K | 6.2 GiB/s (20.127ms) IOPS: 6.4K |
| SanDisk SN8100 | 3.4 GiB/s (0.564ms) IOPS: 225.9K | 2.1 GiB/s (0.907ms) IOPS: 140.6K | 5.9 GiB/s (2.626ms) IOPS: 48.7K | 5.8 GiB/s (2.668ms) IOPS: 47.9K | 6.5 GiB/s (19.264ms) IOPS: 6.6K | 5.9 GiB/s (21.063ms) IOPS: 6.1K |
| Samsung 9100 Pro 4TB | 3.4 GiB/s (0.565ms) IOPS: 226.4K | 2.3 GiB/s (0.839ms) IOPS: 161.7K | 5.2 GiB/s (3.001ms) IOPS: 44.9K | 5.9 GiB/s (2.662ms) IOPS: 47.3K | 6.3 GiB/s (19.877ms) IOPS: 6.4K | 6.1 GiB/s (20.579ms) IOPS: 6.2K |
| Crucial T705 2TB | 3.3 GiB/s (0.587ms) IOPS: 217.0K | 2.3 GiB/s (0.836ms) IOPS: 152.6K | 5.5 GiB/s (2.863ms) IOPS: 44.7K | 5.6 GiB/s (2.799ms) IOPS: 45.7K | 6.0 GiB/s (20.738ms) IOPS: 6.2K | 6.0 GiB/s (20.855ms) IOPS: 6.1K |
| SK hynix Platinum P51 | 3.1 GiB/s (0.634ms) IOPS: 200.9K | 1.5 GiB/s (1.314ms) IOPS: 97.2K | 5.6 GiB/s (2.781ms) IOPS: 46.0K | 3.9 GiB/s (4.014ms) IOPS: 31.9K | 6.2 GiB/s (20.126ms) IOPS: 6.4K | 4.2 GiB/s (29.576ms) IOPS: 4.3K |
| Samsung 990 Pro 2TB | 2.7 GiB/s (0.731ms) IOPS: 174.4K | 2.2 GiB/s (0.903ms) IOPS: 141.2K | 4.0 GiB/s (3.944ms) IOPS: 32.4K | 4.1 GiB/s (3.849ms) IOPS: 33.2K | 3.9 GiB/s (32.415ms) IOPS: 3.9K | 4.2 GiB/s (29.520ms) IOPS: 4.3K |
| PNY CS2150 | 2.5 GiB/s (0.779ms) IOPS: 163.5K | 1.8 GiB/s 1.107ms) IOPS: 115.3K | 4.5 GiB/s (3.473ms) IOPS: 36.8K | 4.7 GiB/s (3.357ms) IOPS: 38.1K | 4.6 GiB/s (27.157ms) IOPS: 174.4K | 4.9 GiB/s (25.682ms) IOPS: 5.0K |
| Crucial P510 | 2.3 GiB/s (0.837ms) IOPS: 152.2K | 2.3 GiB/s (0.842ms) IOPS: 151.5K | 4.5 GiB/s (3.450ms) IOPS: 37.1K | 4.8 GiB/s (3.262ms) IOPS: 39.2K | 4.8 GiB/s (26.2181ms) IOPS: 4.9K | 5.0 GiB/s (25.121ms) IOPS: 5.1K |
| WD SN850X | 2.3 GiB/s (0.736ms) IOPS: 173.2K | 2.0 GiB/s (0.989ms) IOPS: 129.0K | 4.1 GiB/s (3.878ms) IOPS: 33.3K | 4.0 GiB/s (3.958ms) IOPS: 33.0K | 4.4 GiB/s (30.501ms) IOPS: 4.5K | 4.1 GiB/s (30.782ms) IOPS: 4.2K |
Conclusion
The Phison PS5028-E28 is a confident entry into the Gen5 SSD controller arena, targeting workloads that demand low latency and high throughput, such as video editing, AI inference, or high-performance gaming. Throughout our extensive testing, the E28-powered SSD consistently maintained performance parity with, or even exceeded, that of top-tier Gen5 drives, particularly in sequential and 4K random workloads. It’s random write IOPS that hit an unmatched 3.29 million, and its read latency often outperforms competitors like the SN8100 and Renegade G5, showcasing just how much tuning Phison has done under the hood.
Of course, we tested a reference drive running pre-release firmware, so we expect a few final tweaks before hitting retail shelves (which may result in even better performance). However, even now, the E28 proves itself to be a worthy successor to the E26 and a legitimate rival to Silicon Motion’s SM2508. With excellent consistency across block sizes, fast load times in LLM and DirectStorage workloads, and support for upcoming AI-centric variants, the E28 gives Phison the platform it needs to stay competitive through the next phase of Gen5 storage adoption.
This controller also appears to be very power-efficient, which is a critical factor in mobile and thermally limited environments. While we didn’t independently verify Phison’s internal power data, the claimed savings of up to a watt during demanding workloads suggest a meaningful advancement over earlier Gen5 designs. Combined with its low idle draw (<5mW in L1.2), the E28 is shaping up to be a rare high-performance option that won’t throttle or overheat in thinner systems. Nonetheless, we’re eager to see how this controller performs once it starts shipping inside fully optimized, retail SSDs.


 Amazon