

A few months ago, we started our $800 TrueNAS build competition. In a nutshell, Brian, Ben, Kevin took $800 and built their own NAS system leveraging TrueNAS CORE as an OS. Thanks to Western Digital, the guys didn’t have to worry about storage, WD provided a bevy of SSD and HDD options for the guys to choose from. We wanted to see what our team could do building each different system and how they compare to each other. They spent the money, talked trash, and got their systems tested, let’s find out how they did.
As a setup for those who haven’t been following, we did a video on our little competition that can be found embedded here or on our YouTube page:
Budget TrueNAS CORE Systems
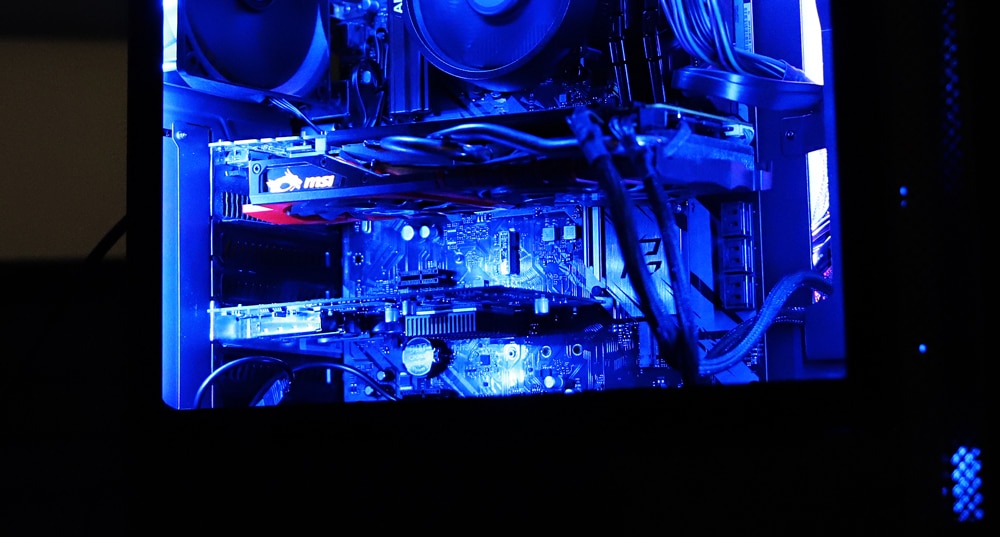
Ben the Intern’s build was probably the most DIY of the lot. He went to the Cincinnati Computer Cooperative and MicroCenter and bought all the parts separately and assembled them himself. His parts included an OCZ GSX600 PSU, an ASRock B550 motherboard, G.Skill Ripjaws V 64GB (2 x 32GB) DDR4-3600 RAM, a Ryzen 5 3600, a Chelsio 111-00603+A0, and a Lian Li Liancool 205 PC case. With the few extra dollars, he had leftover he threw some LED strips on his build.
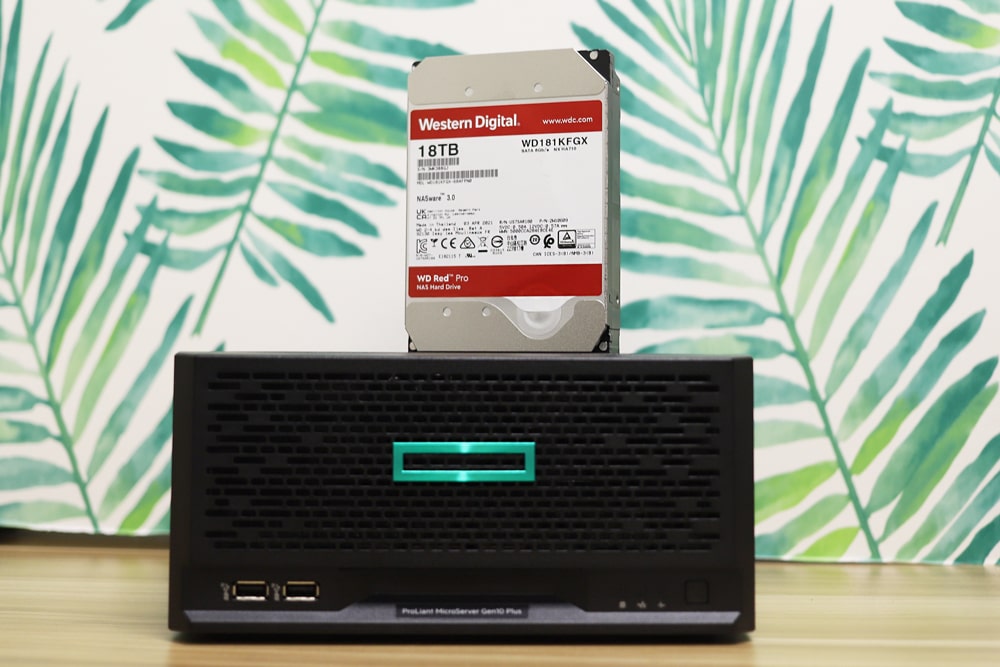
Kevin leveraged the HPE MicroServer Gen10 Plus with its Xeon processor and ECC memory. Kevin also added a 100GbE Mellanox ConnectX-5 card to get a leg up on the other builds, while also making it easier to configure networking on. While the other builds use a dual-port NIC, Kevin only needs to configure one 100GbE interface.
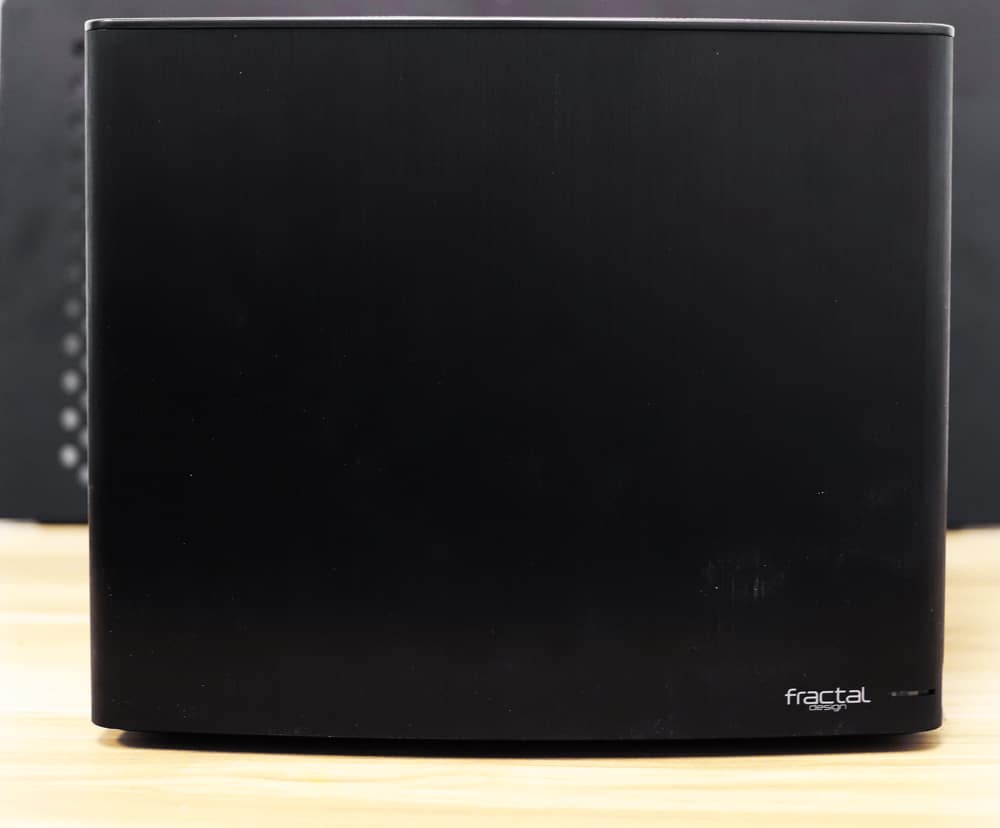
Brian’s build is somewhere in between the other two. He started with the Supermicro M11SDV-8CT-LN4F board giving him an AMD EPYC 3201 SoC processor and four 1GbE ports that took a huge bite out of the budget. For RAM Brain leveraged two SK hynix PC4-2400T-RD1-11 DDR4 ECC 8GB DRAM modules. He also installed a Thermaltake 500W PSU and 10GbE card. All of this was put inside a Fractal Design Node 304 enclosure. While the 10GbE card Brian found at a fantastic price, it ultimately wouldn’t recognize or function with the TrueNAS software, so he had to revert to a spare lab Emulex NIC. The used DRAM from China also was an issue and had to be replaced.
Budget TrueNAS CORE System – Performance
Let’s get to the real reason everyone is here: which of the three is best? In addition to our three DIY builds, we also have a TrueNAS Mini that we’re incidentally giving away. The iXsystem build is using RAIDZ2 since it was supplied with 5 HDDs. The iXsystems TrueNAS Mini X+ platform offers the best blend of chassis size and drive support. It supports five 3.5″ HDDs and even has two 2.5″ bays for SSDs. So why not test it as a baseline? Simple, the Mini X+ is tuned for maximum data resiliency, not performance. The other three were tuned to be the fastest in this showdown, though that comes with a handful of risks. If iXsystems wanted to beat our competitors, it could flat out crush them with a build.
A quick word on RAID configurations: TrueNAS supports several depending on the build. Since we used radically different builds there will be different RAID configurations. Ben and Kevin’s builds use RAIDZ across four SSDs, and Brian’s build uses Mirror across four HDDs.
We looked only at the SMB fileshare protocol for this showdown. One interesting element to mention is just how much importance goes into the motherboard and chassis configuration. Ben’s desktop platform that arguably looks the coolest, only has two 3.5″ drive bays and is also the largest case by far.
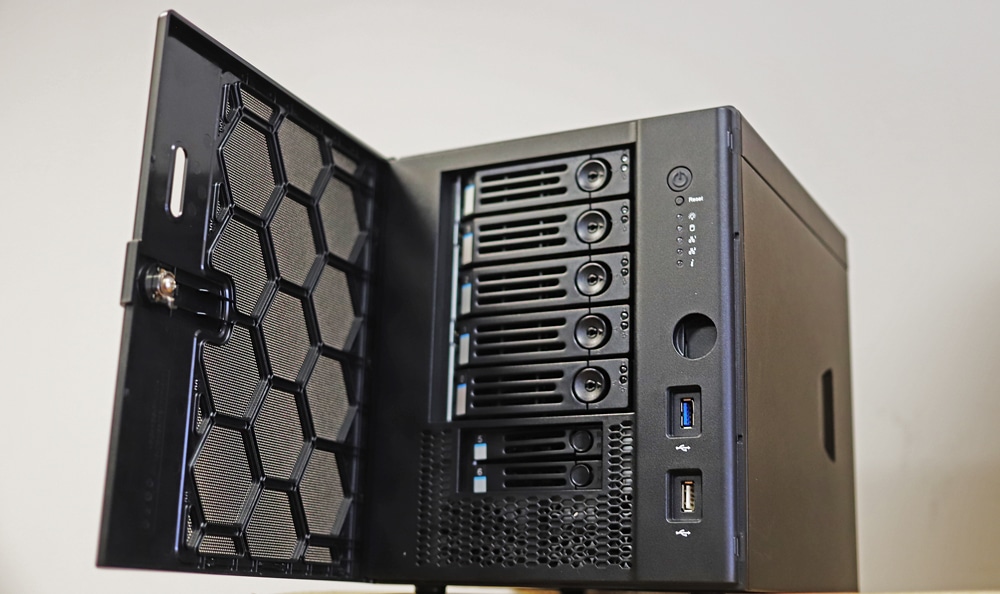
Brian’s case supports up to six 3.5″ drive bays with attention to cooling, but his motherboard only has four onboard SATA ports. Kevin’s HPE Microserver build as a stock build has four bays and four ports, but that is just how the platform is designed.
Storage is a bit different in different models as well. In Brian’s build, there were four 10TB WD Red HDDs, sadly the M.2 NVMe port didn’t exactly work as intended. Both Ben and Kevin’s builds leveraged four 4TB WD Red SSDs.
It’s important to note in the performance section that RAID configuration has a huge role in how performance is measured, beyond just the drive selection itself. RAIDZ will have less overhead than RAIDZ2, and Mirror will have even less overhead than RAIDZ. With that said the RAID setup has to take into consideration what the ultimate end application is, how much capacity you need and how failure-resistant you want your build. In the end, these results are not geared to show which NAS is faster, but instead how TrueNAS configurations perform across similar builds, some using the same drives, in different RAID configurations.
Enterprise Synthetic Workload Analysis
Our enterprise shared storage and hard drive benchmark process preconditions each drive into steady-state with the same workload the device will be tested with under a heavy load of 16 threads with an outstanding queue of 16 per thread, and then tested in set intervals in multiple thread/queue depth profiles to show performance under light and heavy usage. Since NAS solutions reach their rated performance level very quickly, we only graph out the main sections of each test.
Preconditioning and Primary Steady-State Tests:
- Throughput (Read+Write IOPS Aggregate)
- Average Latency (Read+Write Latency Averaged Together)
- Max Latency (Peak Read or Write Latency)
- Latency Standard Deviation (Read+Write Standard Deviation Averaged Together)
Our Enterprise Synthetic Workload Analysis includes four profiles based on real-world tasks. These profiles have been developed to make it easier to compare to our past benchmarks as well as widely-published values such as max 4k read and write speed and 8k 70/30, which is commonly used for enterprise drives.
- 4K
-
- 100% Read or 100% Write
- 100% 4K
- 8K 70/30
- 70% Read, 30% Write
- 100% 8K
- 8K (Sequential)
- 100% Read or 100% Write
- 100% 8K
- 128K (Sequential)
- 100% Read or 100% Write
- 100% 128K
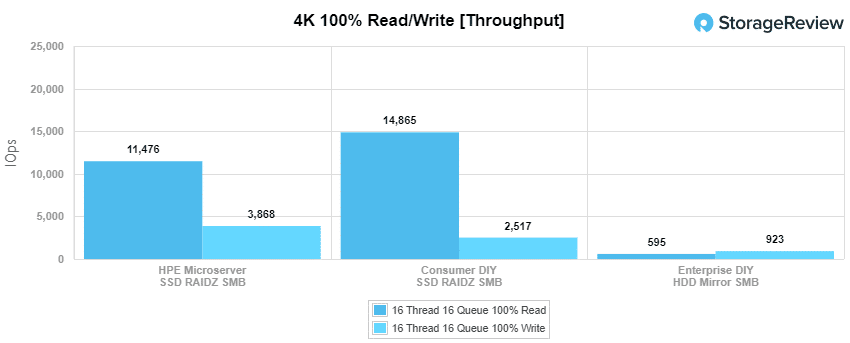
First up is our 4K read/write throughput test. For read, the top performer was Ben’s with 14,865 IOPS. Kevin came in second with 11,476. Brian hit third with 595 IOPS. For write, Kevin took the top spot with 3,868 IOPS. Ben landed second with 2,517 IOPS. Brian stayed in third with 923 IOPS.
Much of this comes down to the RAID type deployed, although, with Kevin’s Microserver versus Ben’s DIY build, the IOPS difference plays into the speed of the CPU in each build.
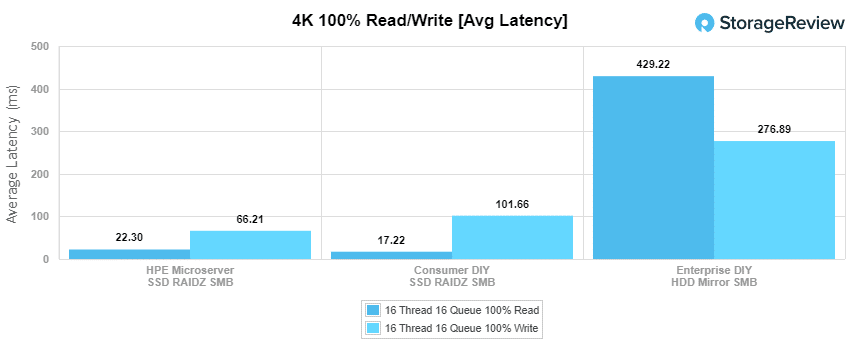
Next up is 4K average latency. Here we see the same placement as the above. In read, Ben wins with 17.2ms, Kevin takes second with 22.31ms, and Brian trails well behind with 429.2ms. Switching to write, Kevin snagged the top spot with 66.21ms, Ben took second with 101.66ms, and Brian was a bit closer with 276.89ms in third.
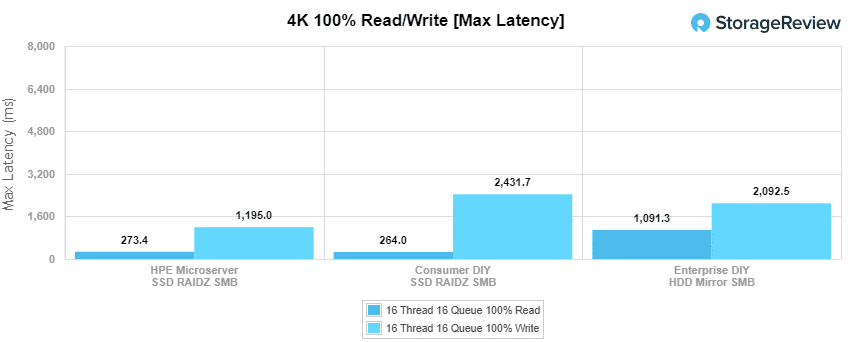
4K max latency saw a bit of a shakeup in placing. For read, Ben took the top spot with 263.96ms, Kevin was right behind him with 273.44ms, and Brian was in third with 1,091.3ms. For write, Kevin took first with 1,195ms, Brian took second for a change with 2,092.5ms, and Ben slid down to third with 2,431.7ms.
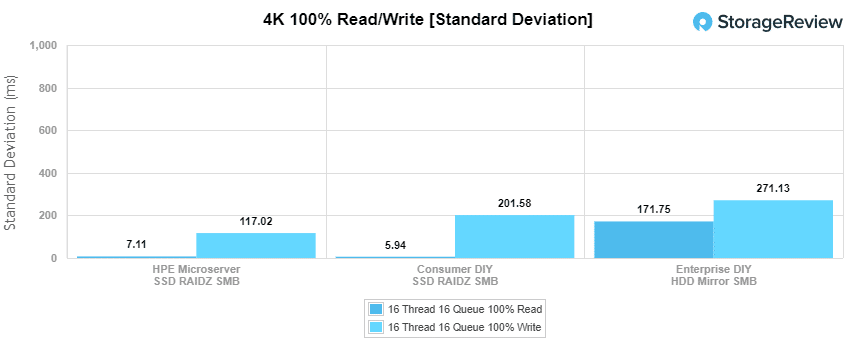
Our last 4K test is standard deviation. For read, Ben took first with 5.94ms, Kevin was close behind with 7.11ms, and Brian was way behind Kevin with 171.75ms. With writes Kevin had the top spot with 117.02, Ben wasn’t too far behind with 201.58ms, and Brian wasn’t too far behind that with 271.13ms.
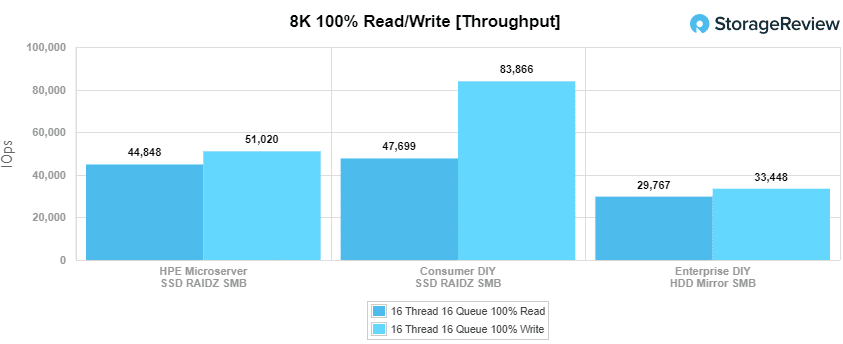
Our next benchmark measures 100% 8K sequential throughput with a 16T16Q load in 100% read and 100% write operations. Ben’s build took the lead in read with 47,699 IOPP, Kevin was close behind with 44,848 IOPS, and Brian had 29,767 IOPS. For write, Ben again took the top spot with 83,866 IOPS, Kevin stayed in second with 51,020 IOPS, and Brian maintained third with 33,448 IOPS.
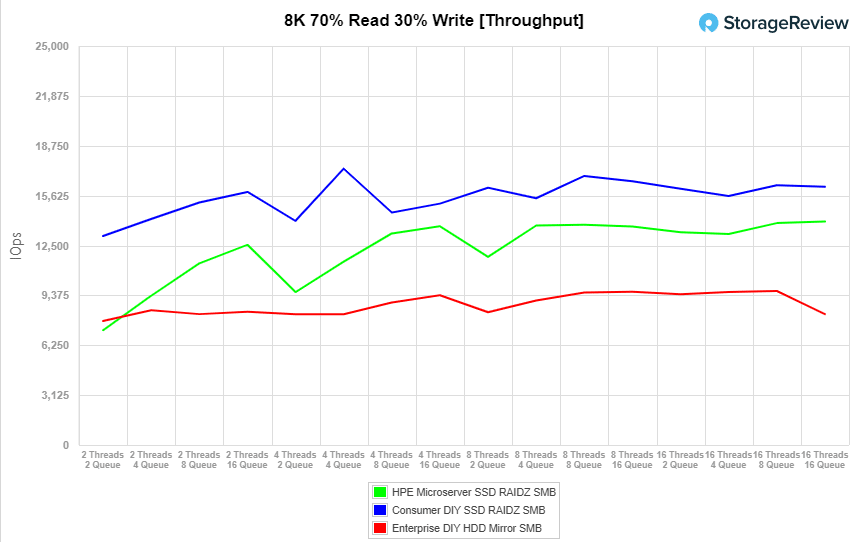
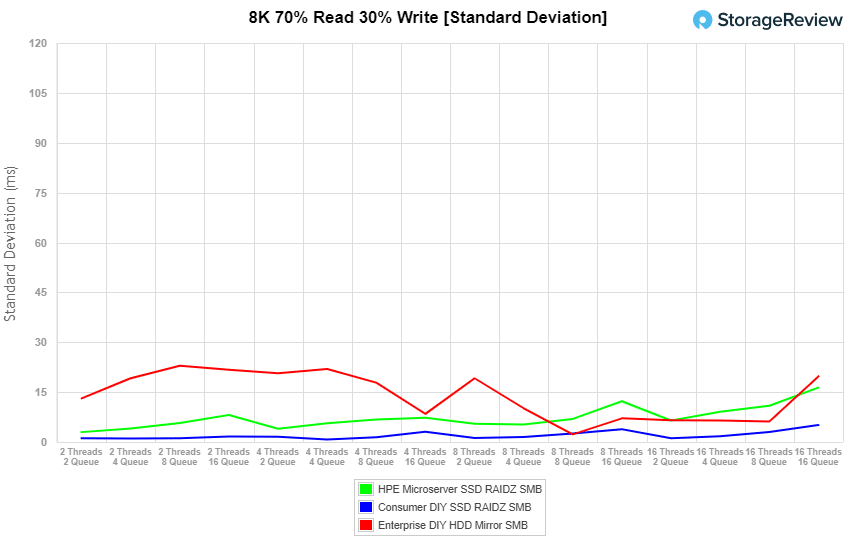
Compared to the fixed 16 thread, 16 queue max workload we performed in the 100% 4K write test, our mixed workload profiles scale the performance across a wide range of thread/queue combinations. In these tests, we span workload intensity from 2 thread/2 queue up to 16 thread/16 queue. Drive type and RAID configuration plays a huge role here. Added parity to support drive failure has a hit to performance. With throughput, Ben started off the highest and took the highest peak throughout with 17,317 IOPS though his build dropped off some near the end. While Brian’s build started off higher than Kevin’s, Kevin was able to surpass him for second.
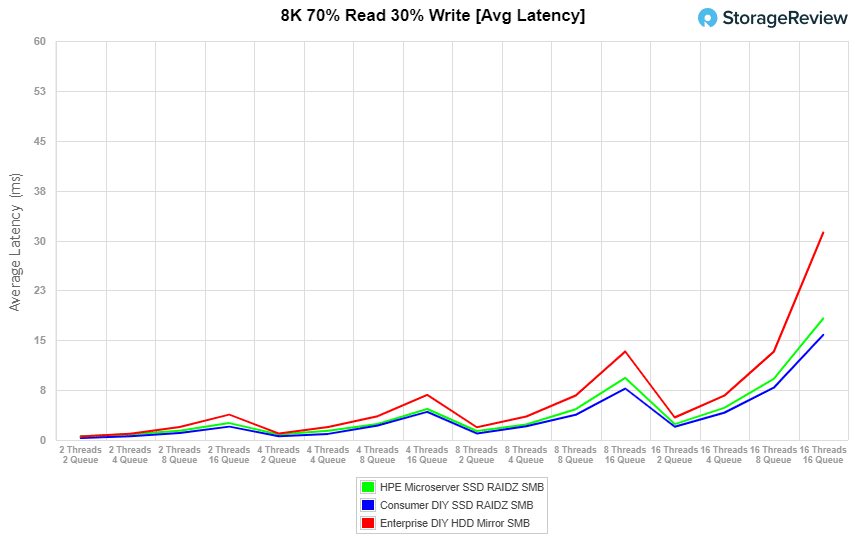
With average latency, all three StorageReview builds started with sub-millisecond latency. While they ran fairly close you can see Ben’s build gradually pull ahead of Kevin’s and both theirs pull away from Brain’s build. Ben’s ended with 15.8ms, Kevin with 18.3ms, and Brian with 31.2ms.
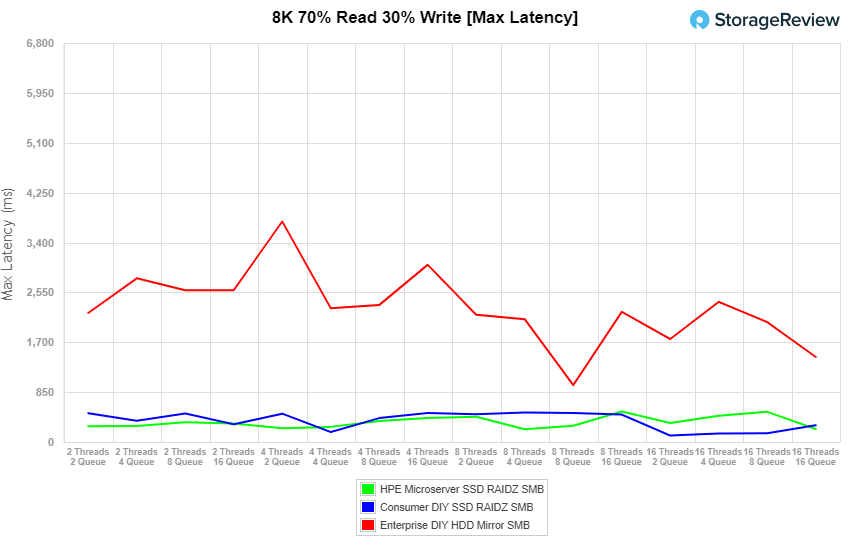
For max latency, Kevin’s started off the best and he and Ben traded first place back and forth. In the end, Kevin’s build had 221ms, and Ben’s had 285ms. Brian was well behind in third throughout.
Standard deviation clearly showed Ben’s build ahead throughout. Kevin’s had about 3 times the latency and Brian had about 4 times.
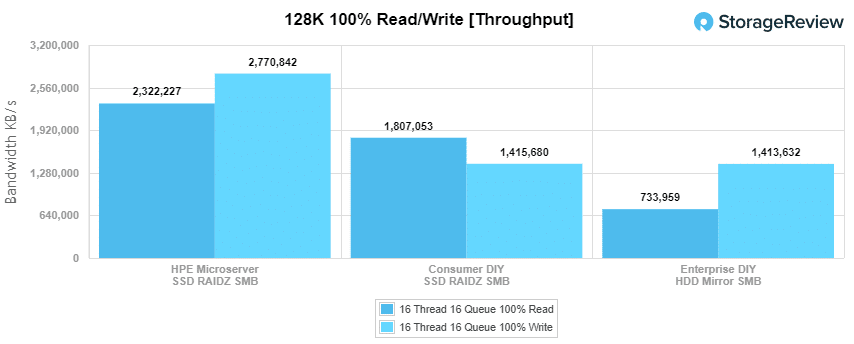
The last Enterprise Synthetic Workload benchmark is our 128K test, which is a large-block sequential test that shows the highest sequential transfer speed for a device. In read, Kevin took the top spot with 2.32GB/s, Ben was right behind him with 1.81GB/s, and Brian’s build must have missed the starting pistol with 734MB/s. In write Kevin once again took the top spot with 2.77GB/s, Ben and Brian were nearly tied with 1.42GB/s and 1.41GB/s respectively.
Picking the Right Configuration for Your Needs…
So who won? It really depends on what you place the most value on for your deployment. The fastest build in regards for I/O performance had only two drive bays and a consumer CPU/RAM. With ZFS you really want enterprise components like ECC memory to make use of the advanced data integrity stack, so it’s pretty much disqualified from all but non-production deployments.
Next, we look at Brian’s build which gets much closer to what you need from a hardware side and increased drive bays on the chassis, but the motherboard only supports four hard drives. It was also filled to the brim with excess cables from the power supply. As it turns out the call to go to eBay for used NIC and DRAM was a bad one and the overall system stability was clearly a step and a half into the “shifty” and/or “janky” categories.
For the DIY crowd, it really came down to Kevin’s build using an off-the-shelf Microserver. The Microserver has a smaller footprint and lower entry price. There are also all the enterprise components and things like iLo for out-of-band management. The system does cap out on storage though, with just 4-bays and they’re all SATA, so no high-speed goodies. Even so, it offers the path of least resistance when it comes to rolling a DIY budget TrueNAS CORE system.
Maybe a TrueNAS Mini?
Where does the TrueNAS Mini X+ fit into this? For performance, it doesn’t. The particular build we have is for data resiliency. However, the Mini X+ has several nice features such as 10GbE onboard. The Mini + also has, without question, the most storage capacity support and flexibility, with a total of 7 drive bays.
Aside from ranking the DIY systems in terms of performance, this contest also paints a neat picture of what one can do within the TrueNAS CORE OS and a limited budget (setting aside we got storage from WD as part of this work). Getting an off-the-shelf unit is always the safest bet for small companies that need reassurances (support) from vendors though. Clearly, some of our builds suffered a tad when going the DIY route.
The value of a turn-key system can’t be stressed enough if this is for a production use case. The iXsystems Mini + does have a higher price, but it supports 3 additional disks than the DIY platforms and had no question of component driver support. Of course, there’s enterprise support for the hardware and software as well, something none of the DIY builds could provide. In the end, it just depends on what you want. TrueNAS CORE is flexible enough to handle just about any hardware.
Thanks to iXsystems, we’re giving away the TrueNAS Mini, more detail on how to register here.
Get the highlights in our performance highlights video below.
TrueNAS Resources


 Amazon