

SK hynix brought their first end-user SSD to the US market about a year ago. The Gold P31 offered one of the best performance to cost ratios we had seen. As such, it has been our go-to recommendation for the mainstream SSD category for the last year. The only thing is, the drive only came in 500GB and 1TB capacities. Two weeks ago SK hynix rectified this issue and dropped the Gold P31 2TB. We’ve had the SSD in our test lab, hoping the performance profile is similar, if not a little better, than the 1TB drive we reviewed previously.
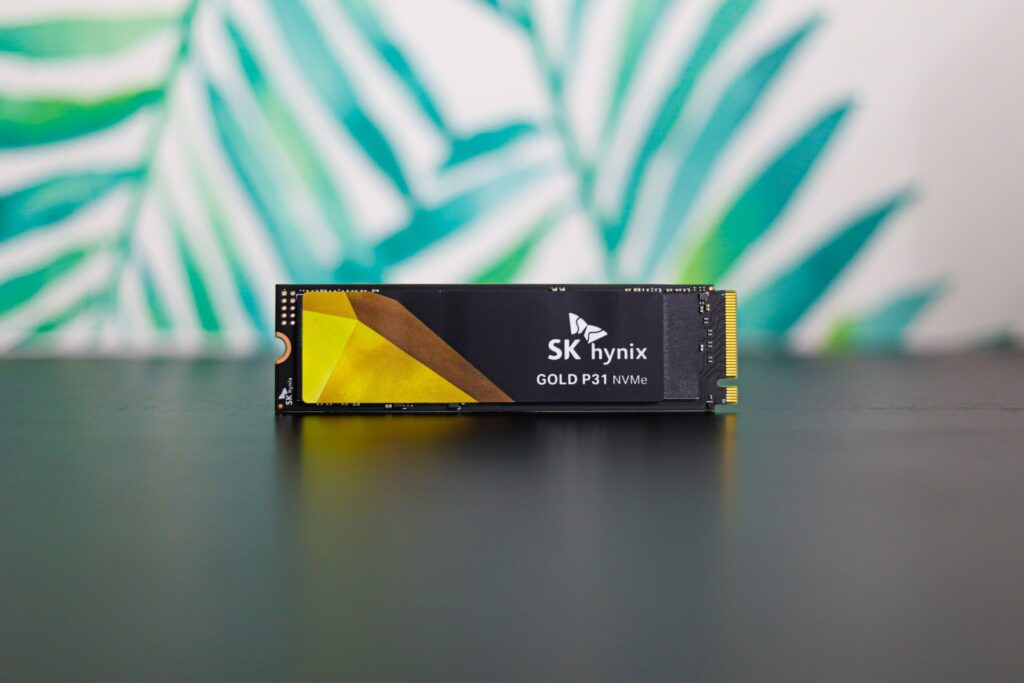
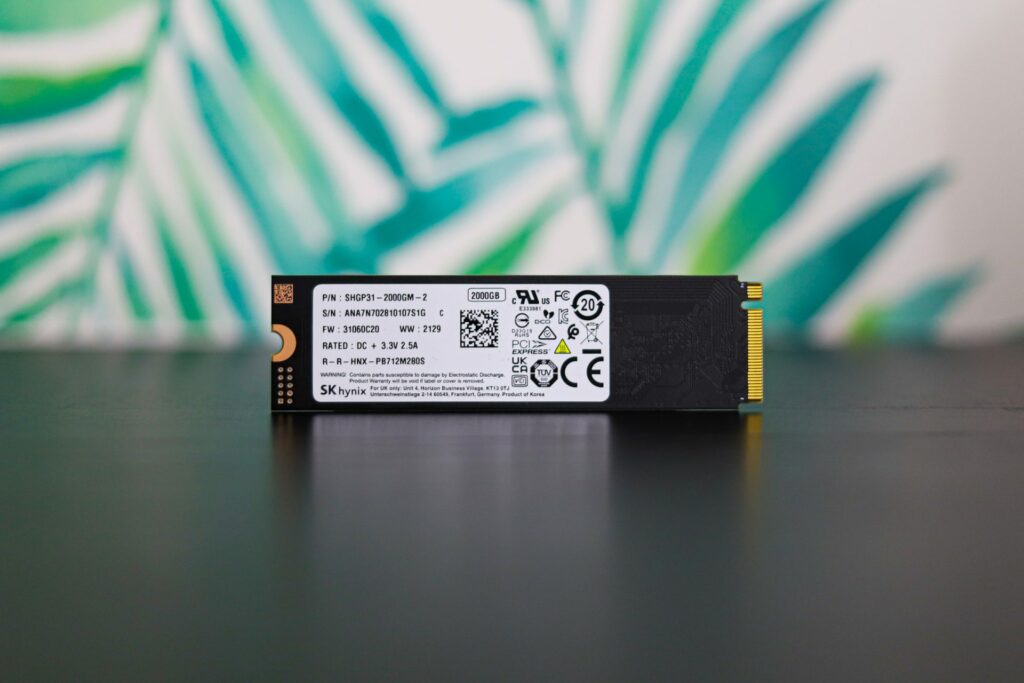
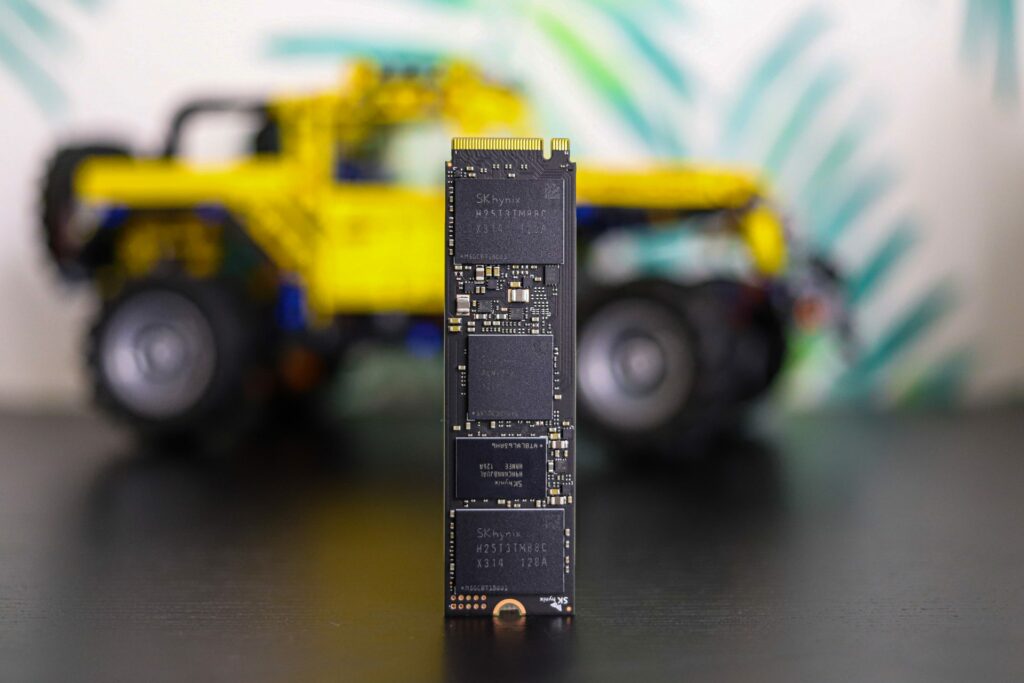
Aside from the capacity bump, nothing else really changed with this drive. As a reminder, the P31 Gold is an M.2 PCIe Gen3 SSD, delivered in the common 2280 form factor. The 128-layer NAND and controller are in-house, making this one of the few vertically integrated SSDs on the market. The SSD comes with a 5-year warranty and an endurance rating of 1,200 TBW.
The pricing has remained stable on the P31 Gold, the 500GB version still retails at $75 and the 1TB at $135, the same as their launch. The new 2TB capacity retails at $280, though at the moment Amazon offers a $15 off coupon.
SK hynix Gold P31 2TB Specifications
| Model name | Gold P31 |
| SSD capacity | 2TB/1TB/500GB |
| Product Type | Internal SSD |
| Interface | PCIe NVMe Gen 3 |
| Form Factor | M.2 (2280) |
| NAND Type | 128-layer NAND |
| Controller | SK hynix Cepheus Controller |
| Sequential Read | up to 3,500MB/s |
| Sequential Write | up to 3,200MB/s |
| Warranty | 5 years |
| TBW | 750TBW (1TB), 1,200TBW (2TB) |
SK hynix Gold P31 2TB Performance
SQL Server Performance
Each SQL Server VM is configured with two vDisks: 100GB volume for boot and a 500GB volume for the database and log files. From a system resource perspective, we configured each VM with 16 vCPUs, 64GB of DRAM and leveraged the LSI Logic SAS SCSI controller. While our Sysbench workloads tested previously saturated the platform in both storage I/O and capacity, the SQL test is looking for latency performance.
This test uses SQL Server 2014 running on Windows Server 2012 R2 guest VMs and is stressed by Quest’s Benchmark Factory for Databases. StorageReview’s Microsoft SQL Server OLTP testing protocol employs the current draft of the Transaction Processing Performance Council’s Benchmark C (TPC-C), an online transaction-processing benchmark that simulates the activities found in complex application environments.
The TPC-C benchmark comes closer than synthetic performance benchmarks to gauging the performance strengths and bottlenecks of storage infrastructure in database environments. Each instance of our SQL Server VM for this review uses a 333GB (1,500 scale) SQL Server database and measures the transactional performance and latency under a load of 15,000 virtual users.
SQL Server Testing Configuration (per VM)
- Windows Server 2012 R2
- Storage Footprint: 600GB allocated, 500GB used
- SQL Server 2014
- Database Size: 1,500 scale
-
- Virtual Client Load: 15,000
- RAM Buffer: 48GB
- Test Length: 3 hours
- 5 hours preconditioning
- 30 minutes sample period
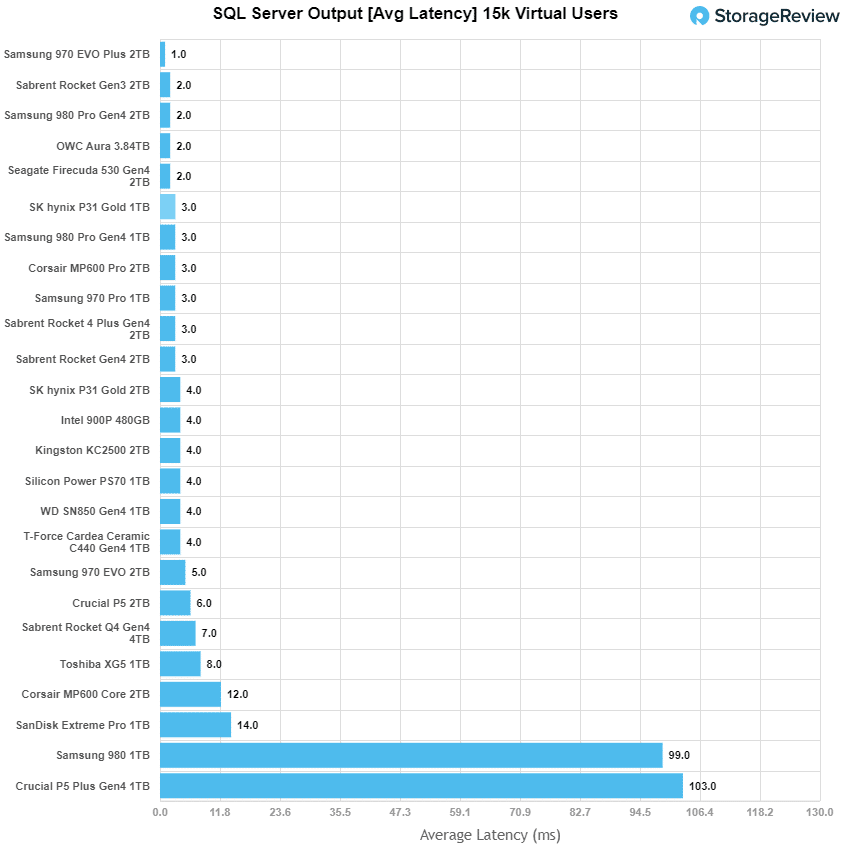
Looking at SQL Server average latency, the SK hynix Gold P31 had an average latency of 4ms, which placed it in the middle part of the leaderboard (and a bit slower than the 1TB model).
Houdini by SideFX
The Houdini test is specifically designed to evaluate storage performance as it relates to CGI rendering. The testbed for this application is a variant of the core Dell PowerEdge R740xd server type we use in the lab with dual Intel 6130 CPUs and 64GB DRAM. In this case, we installed Ubuntu Desktop (ubuntu-16.04.3-desktop-amd64) running bare metal. The output of the benchmark is measured in seconds to complete, with fewer being better.
The Maelstrom demo represents a section of the rendering pipeline that highlights the performance capabilities of storage by demonstrating its ability to effectively use the swap file as a form of extended memory. The test does not write out the result data or process the points in order to isolate the wall-time effect of the latency impact to the underlying storage component. The test itself is composed of five phases, three of which we run as part of the benchmark, which is as follows:
- Loads packed points from disk. This is the time to read from the disk. This is single-threaded, which may limit overall throughput.
- Unpacks the points into a single flat array in order to allow them to be processed. If the points do not have a dependency on other points, the working set could be adjusted to stay in-core. This step is multi-threaded.
- (Not Run) Processes the points.
- Repacks them into bucketed blocks suitable for storing back to disk. This step is multi-threaded.
- (Not Run) Writes the bucketed blocks back out to disk.
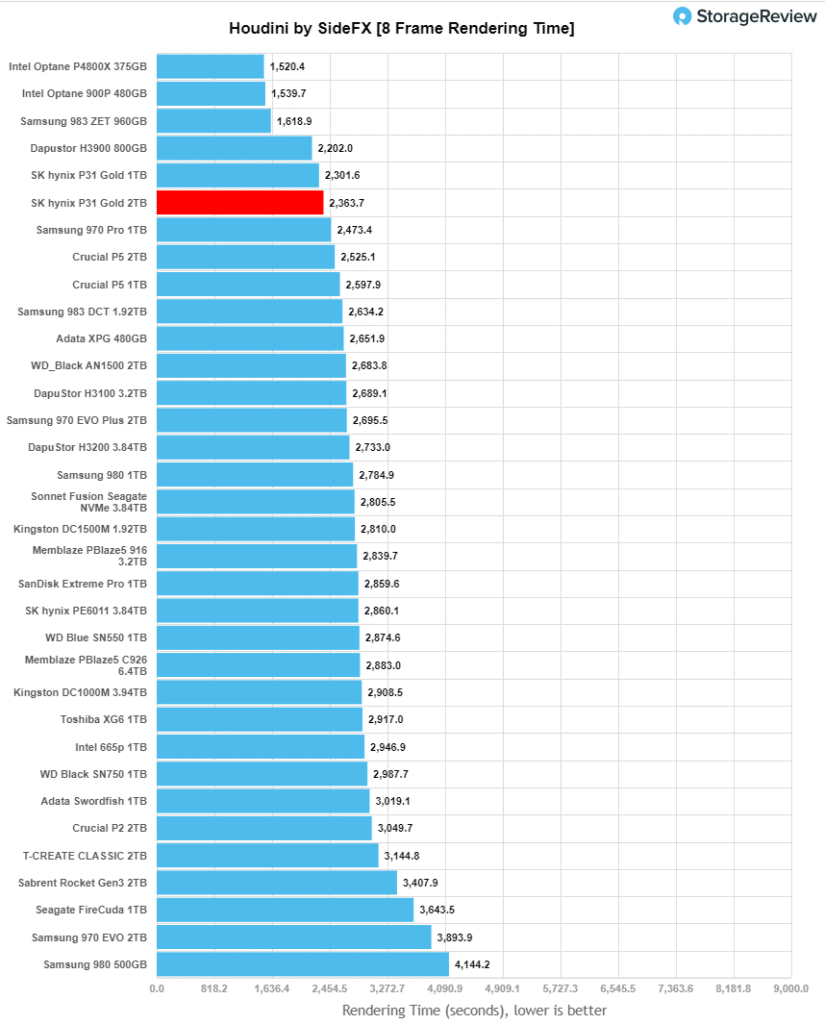
Here, we see the SK Hynix Gold P31 (2TB) hit 2,363.7 seconds, which places it near top of the leaderboard, trailing the 1TB model.
VDBench Workload Analysis
When it comes to benchmarking storage devices, application testing is best, and synthetic testing comes in second place. While not a perfect representation of actual workloads, synthetic tests do help to baseline storage devices with a repeatability factor that makes it easy to do apples-to-apples comparison between competing solutions. These workloads offer a range of different testing profiles ranging from “four corners” tests, common database transfer size tests, to trace captures from different VDI environments.
All of these tests leverage the common vdBench workload generator, with a scripting engine to automate and capture results over a large compute testing cluster. This allows us to repeat the same workloads across a wide range of storage devices, including flash arrays and individual storage devices. Our testing process for these benchmarks fills the entire drive surface with data, then partitions a drive section equal to 5% of the drive capacity to simulate how the drive might respond to application workloads. This is different than full entropy tests which use 100% of the drive and take them into a steady state. As a result, these figures will reflect higher-sustained write speeds.
Profiles:
- 4K Random Read: 100% Read, 128 threads, 0-120% iorate
- 4K Random Write: 100% Write, 64 threads, 0-120% iorate
- 64K Sequential Read: 100% Read, 16 threads, 0-120% iorate
- 64K Sequential Write: 100% Write, 8 threads, 0-120% iorate
Comparables
- Sabrent Rocket Gen3 2TB
- SK Hynix Gold P31 1TB
- WD Black 1TB
- Samsung 970 EVO Plus 1TB
- Crucial P5 2TB
- Samsung 980 Pro 1TB
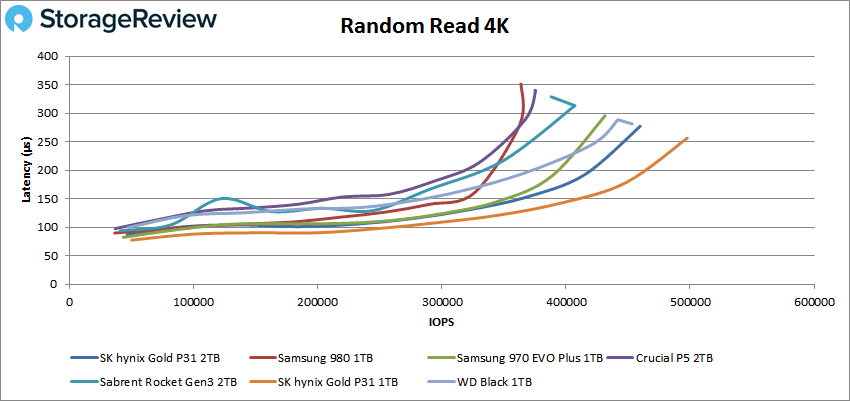
In 4K random read, the SK Hynix Gold P31 (2TB) boasted a peak performance of 459,744 IOPS and a latency of 277.1µs, trailing just the 1TB model (which will be an occurring trend in all of the remaining tests).
For 4K write, the Gold P31 (2TB) showed results in the middle of the leaderboard (though well back of the leader) with a peak of 151,610 IOPS with a latency of 843.2µs.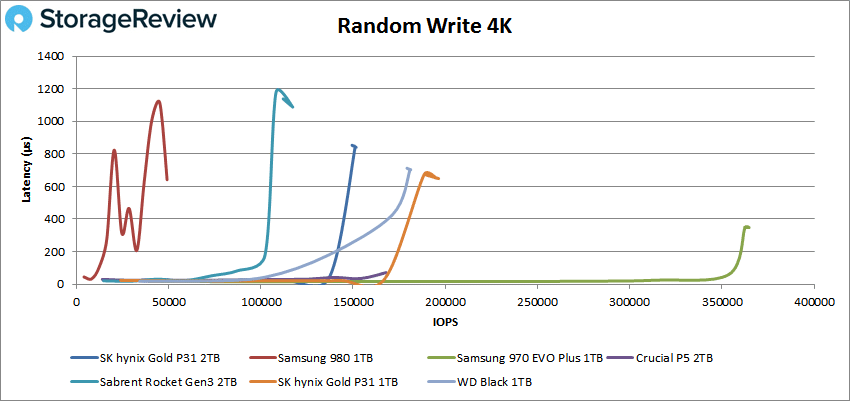
Switching to sequential workloads we look at our 64K tests. In read, the Gold P31 (2TB) Plus recorded 39,576 IOPS or 2.47GB/s with a latency of 401.6µs, again trailing just the 1TB model.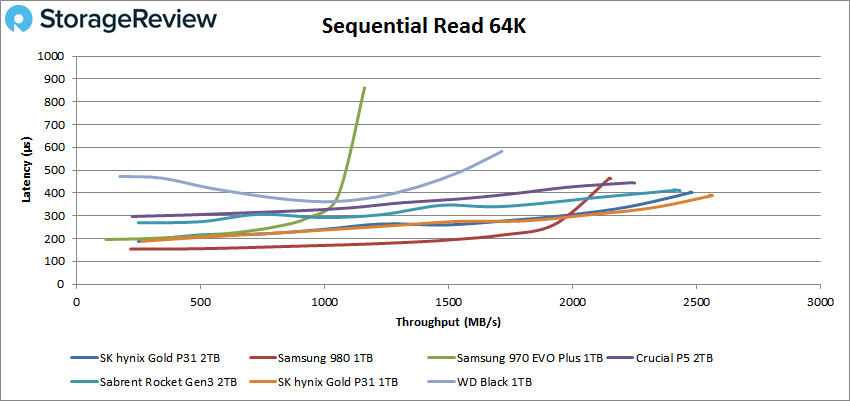
In 64K writes, the Gold P31 (2TB) placed 4th, posting a peak score of 17,522 IOPS or 1.10GB/s at a latency of 905.4µs.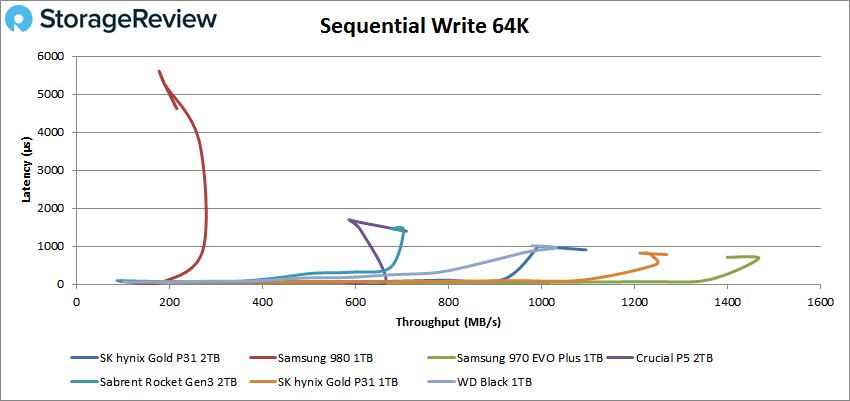
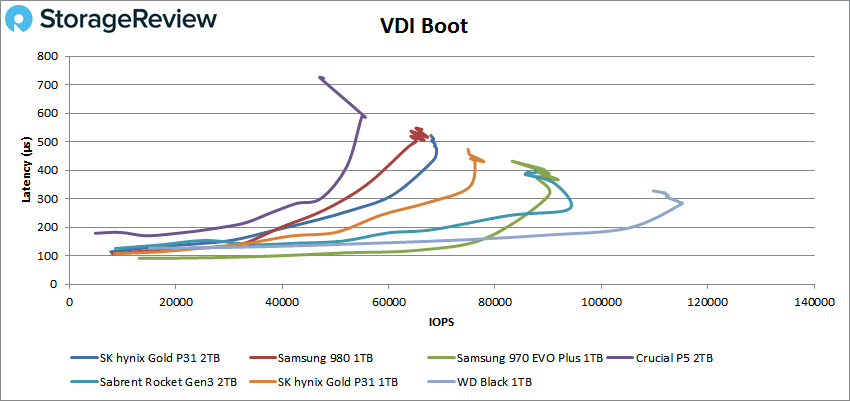
Next, we looked at our VDI benchmarks, which are designed to tax the drives even further. These tests include Boot, Initial Login, and Monday Login. Starting with Boot, the Gold P31 (2TB) had a peak of 67,353 IOPS with a latency of 515.5µs, placing it in the lower-middle part of the leaderboard.
In VDI Initial Login, the Gold P31 (2TB) placed 3rd with a peak of 42,200 IOPS and a latency of 707.7µs before it had a slight spike in performance at the end.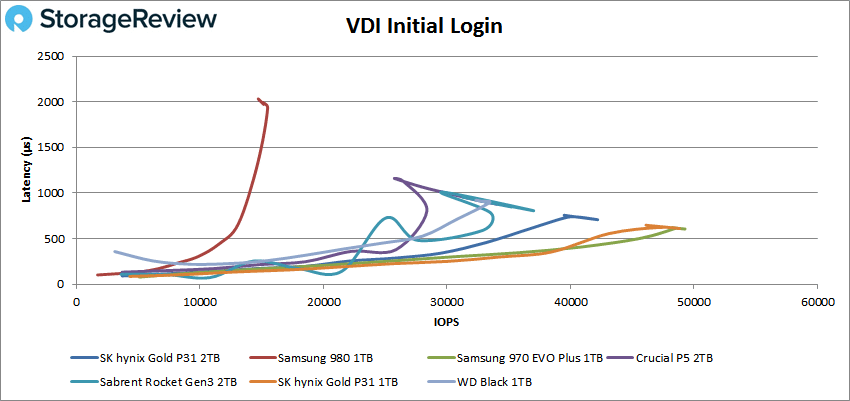
Finally, VDI Monday Login saw the Gold P31 (2TB) peak at 32,946 IOPS with a latency of 487.6µs for middle of the pack results.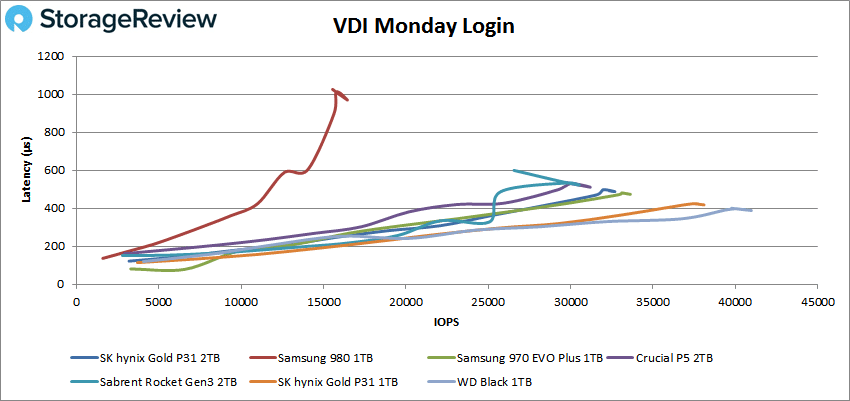
Conclusion

Not everyone needs the latest and greatest Gen4 SSD for their rigs. Mainstream users are plenty happy with any SSD in their system for most use cases. That said, it’s important to buy quality, whenever possible, so your workflow is less likely to be disrupted with a failed drive. The P31 gold 2TB SSD is a vertically integrated solution, which means SK hynix owns the entire thing. This typically leads to drives that are well-supported for a long time.
In addition to being reliable, we do also want to see a good cost/performance profile out of mainstream SSDs. The P31 Gold 1TB drive was excellent at that when we reviewed it about a year ago, making it our favorite entry-SSD. The newly launched 2TB capacity shifts the math a little, as it’s not quite as peppy as the 1TB version.
The P31 Gold 2TB is still a strong SSD, but just not as much as the smaller capacities. This one has much more price competition for the 2TB drive as well. So your buying decision for a 2TB mainstream SSD gets a little more cloudy, meaning the decision will probably just come down to price. With something like the EVO 970 Plus also sitting at $280 today and performing better, the SK hynix drive probably needs to be closer to $250 for us to give it a more strong recommendation.


 Amazon