

Earlier this year, Corsair released the MP600 Pro, their leading high-performance SSD at the time. It sat alongside the MP600 Core, which is an entry-SSD that uses QLC NAND. Now, just a few months later, Corsair is back with an even better enthusiast SSD offering. The MP600 Pro XT takes SSD performance up a notch, thanks to the Phison E18 controller, new NAND payload, and improved firmware. The drive comes in two flavors. The standard comes with an aggressive heat sink, while the MP600 Pro XT Hydro X comes with a liquid cooling rig.
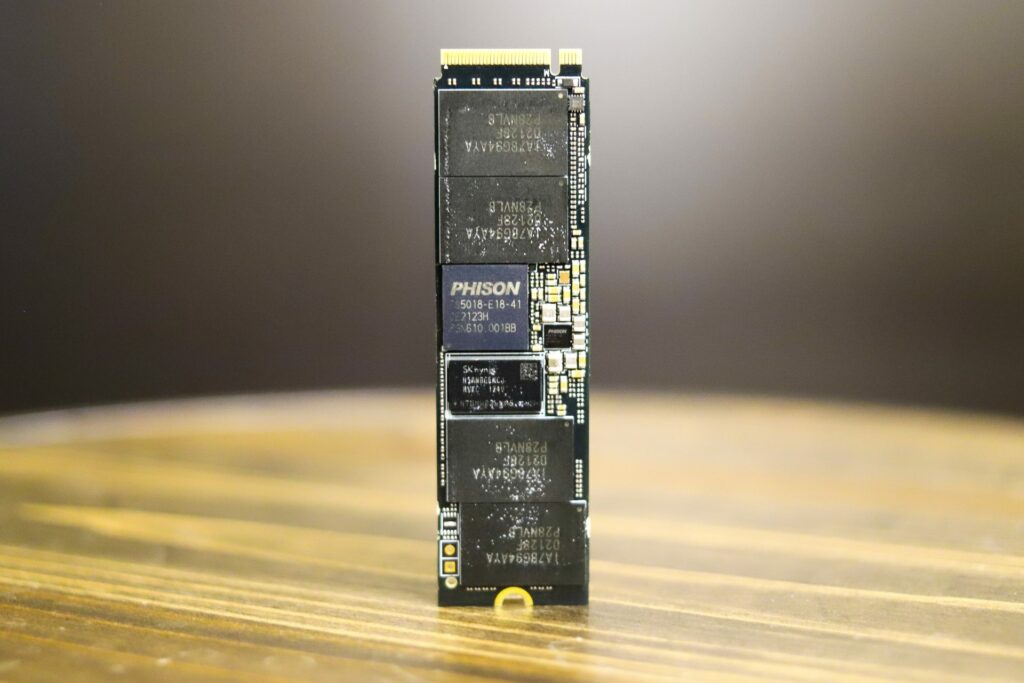
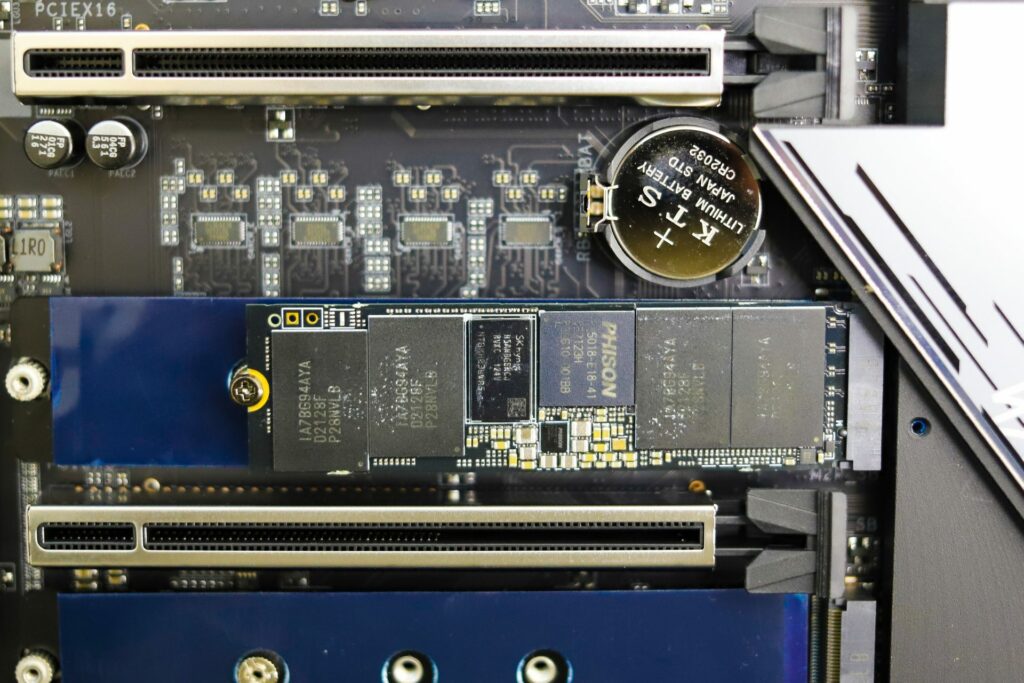
With either version, the specs and performance highlights are the same. The MP600 Pro XT leverages Micron B47R TLC NAND paired with a DRAM Cache of 2048MB (1024MB on the 1TB model). The drive is a standard M.2 2280 gum stick, compatible with any modern gaming board or laptop with serviceable drive bays.
As noted, Corsair is back with Phison again, this time with the latest-generation PS5018-E18 controller. The E18, combined with the Micron NAND, is becoming a very popular choice for those that do not have a vertically integrated solution. Based on what we’ve seen, it’s in fact the best choice on the market right now. We first got a glimpse of the potential on Phison’s reference design board. And recently we’ve seen the first packaged drive to bring the solution to the market in the FireCuda 530.
Even though there will be many drives to leverage the Phison design, there’s still some wiggle room for each vendor to differentiate, like tuning for thermals and performance. Or by catering to specific audiences, like gamers, who may be down with liquid cooling or the aesthetic of a chunky heat spreader. Someone else may opt for blinky lights to make the difference, but at the end of the day, performance will be a key driver.
On that front, Corsair specs the MP600 Pro XT to deliver up to 7,100MB/s sequential read and up to 6,800MB/s sequential write speeds at the top end. 4KB random reads top at 1 million IOPS read and 1.2 million IOPS write. These numbers are for the 2TB and 4TB capacities, which both the standard and liquid drives come in. The standard drive is also available in a 1TB capacity, which offers a little lower performance on the sequential writes (5,800MB/s) and 4KM random read (900,000 IOPS).
Turning to endurance and reliability, the MP600 Pro XT offers 3,000 TBW, 1,400TBW, and 700TBW, as we slide down from 4TB to 2TB to 1TB. All capacities offer a 1,600,000 hour MTBF. Phison also provides several features like SmartFlush to ensure data in flight is protected during an unexpected power loss.
The endurance figures are a bit strange. They are significantly down from what Seagate offers, on the nearly identical FireCuda 530. By way of comparison, Seagate’s spec is 1.8M hours MTBF, just a little more than Corsair. But the more interesting element is the endurance difference. The 2TB FireCuda is rated for 2,550TBW, which is almost double the Corsair spec. This gap holds for the 1TB card as well. We’re guessing marketing screwed this up, as there’s no other logical reason for the numbers to be this far off.
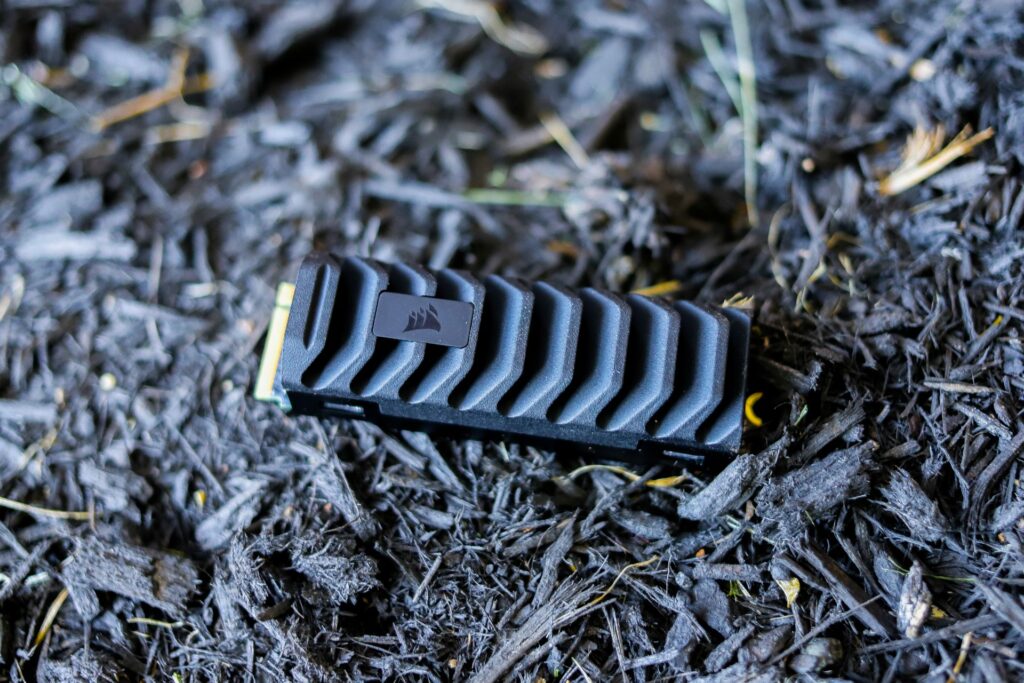
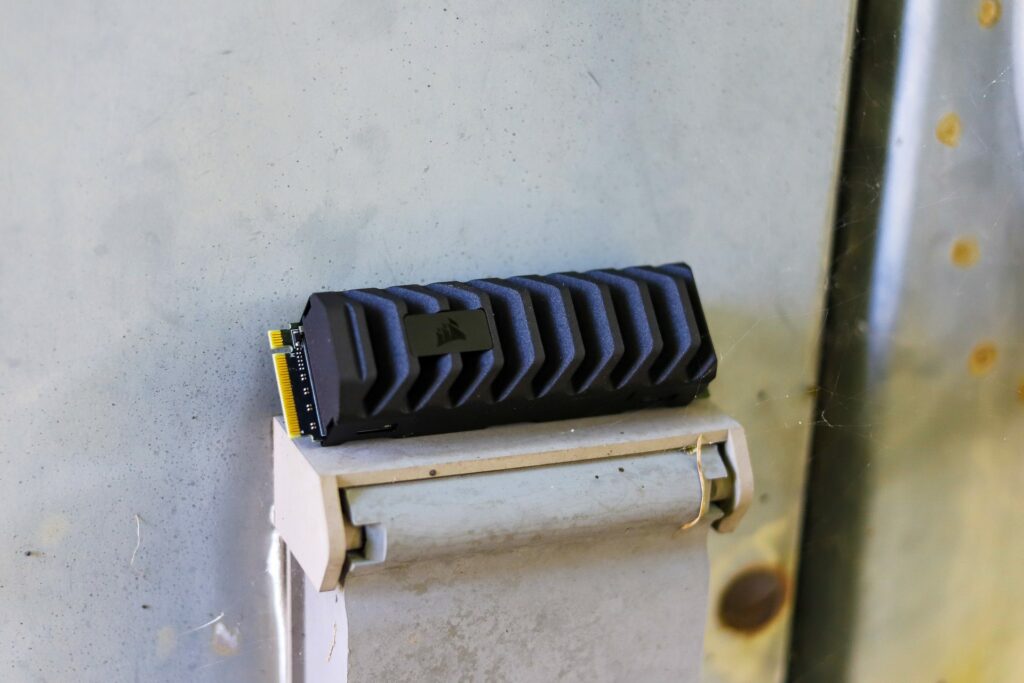
We’ve mentioned the heat sinks a few times. The standard one looks great, but it is also easy to remove. Obviously, it won’t fit in even the largest portable workstation. Most gaming boards offer integrated heat sinks now for the SSDs, so it’s kind of a dealer’s choice in terms of using the included one from Corsair, or whatever solution your motherboard offers.
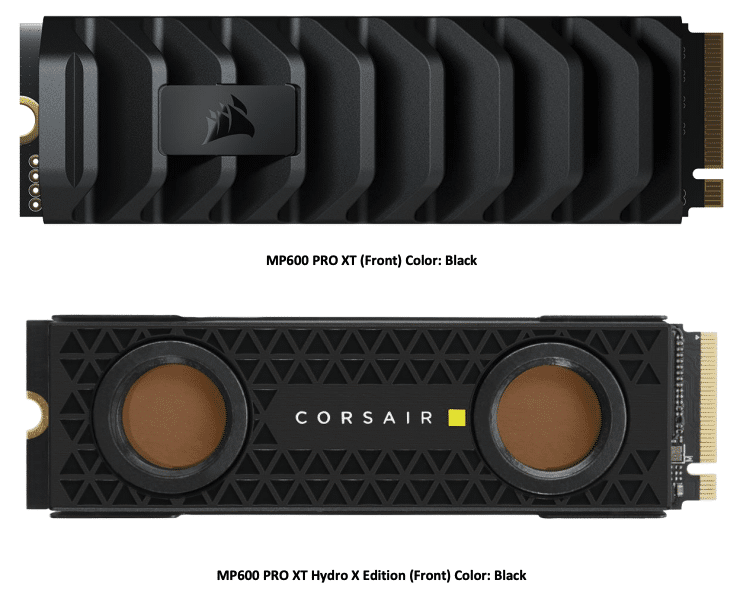
The really neat offering is the liquid-cooled design. The Hydro X offers a copper interior water block that can be attached to a cooling loop to prevent thermal throttling. We haven’t tested this, but the solution definitely looks cool and should add several FPS to your gaming experience as a result.
One last thing, Corsair offers the SSD Toolbox for drive monitoring, secure erase, and firmware updates. We’re not going to spend a lot of time on this tool in this review. The bottom line is that the tool is functional for these features, but the design borders on offensive. Yes, it works, as will a ’73 Nova if you need to get to the grocery store. But gadzooks, it’s disturbingly ugly. Corsair really needs to spend a few bucks and hire a UI guy to freshen up this toolbox.
At the time of this review, the Corsair MP600 Pro XT carries a street price of $210, $415, and $1,025 for the 1TB, 2TB, and 4TB respectively. The water-cooled Hydro X version has a modest premium, coming in at $440 and $1,035 for the 2TB and 4TB capacities. Our review is of the 2TB standard-issue model.
Corsair MP600 Pro XT Specifications
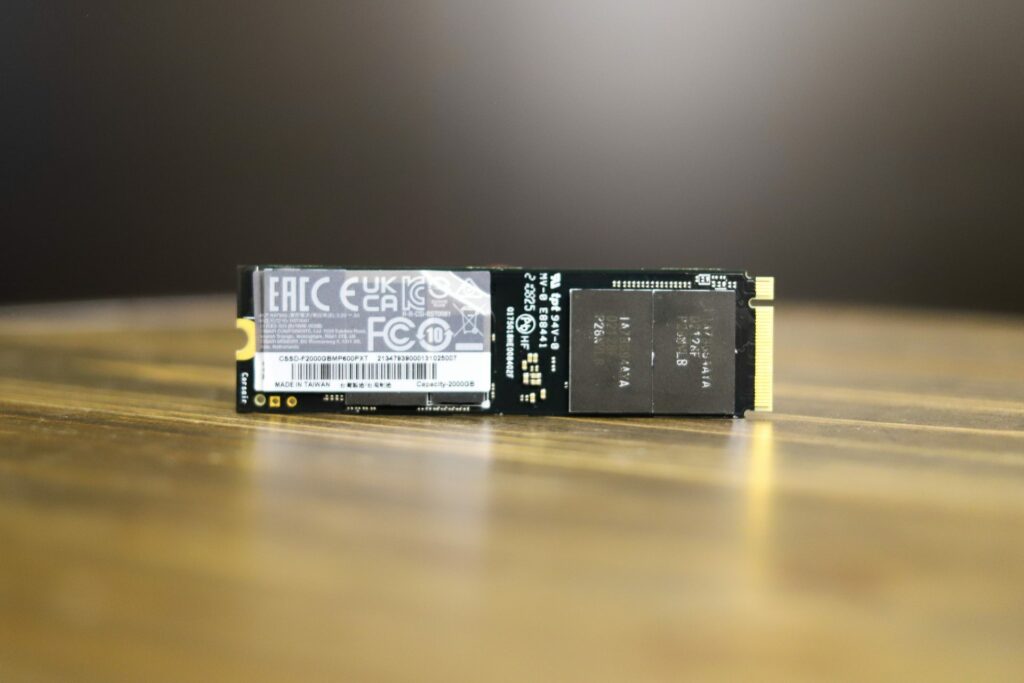
| Model | CSSD-F2000GBMP600PXT |
| Interface | PCIe 4.0 NVMe x4 NVMe 1.4 |
| Capacity | 1TB, 2TB, 4TB |
| NAND | 3D TLC NAND |
| Performance | Read/Write: up to 7,100 / 6,800 MB/s
Read/Write: up to 1.2M IOPS 4K Write / 1M IOPS Read |
| MTBF | 1,600,000 hours |
| Temperatures | Operation: 0˚C ~ 70˚C
Storage: -40˚C ~ 85˚C |
| Weight | 0.066lbs |
| Dimensions | 80mm x 23mm x 19mm |
| Endurance | 1400 TBW |
| Warranty | 5-year limited warranty |
Corsair MP600 Pro XT Performance
Testbed
As we migrate into testing newer NVME Gen4 SSDs, it required a platform shift in our lab to support the newer interface. Lenovo has been out in the front of the pack with PCIe Gen4 support, including up to the front-mount U.2 bays, while others still only offer edge-card support. In our Gen4 reviews, we leverage the Lenovo ThinkSystem SR635 server, equipped with an AMD 7742 CPU and 512GB of 3200Mhz DDR4 memory.
NVMe SSDs are tested natively through an M.2 to PCIe adapter card in the edge-card slot, while U.2 drives are loaded in the front. The methodology used better reflects end-user workflow with the consistency, scalability, and flexibility testing within virtualized server offers. A large focus is put on drive latency across the entire load range of the drive, not just at the smallest QD1 (Queue-Depth 1) levels. We do this because many of the common consumer benchmarks don’t adequately capture end-user workload profiles.
SQL Server Performance
Each SQL Server VM is configured with two vDisks: 100GB volume for boot and
a 500GB volume for the database and log files. From a system resource perspective, we configured each VM with 16 vCPUs, 64GB of DRAM and leveraged the LSI Logic SAS SCSI controller. While our Sysbench workloads tested previously saturated the platform in both storage I/O and capacity, the SQL test is looking for latency performance.
This test uses SQL Server 2014 running on Windows Server 2012 R2 guest VMs and is stressed by Quest’s Benchmark Factory for Databases. StorageReview’s Microsoft SQL Server OLTP testing protocol employs the current draft of the Transaction Processing Performance Council’s Benchmark C (TPC-C), an online transaction-processing benchmark that simulates the activities found in complex application environments.
The TPC-C benchmark comes closer than synthetic performance benchmarks to gauging the performance strengths and bottlenecks of storage infrastructure in database environments. Each instance of our SQL Server VM for this review uses a 333GB (1,500 scale) SQL Server database and measures the transactional performance and latency under a load of 15,000 virtual users.
- SQL Server Testing Configuration (per VM)
- Windows Server 2012 R2
- Storage Footprint: 600GB allocated, 500GB used
- SQL Server 2014
- Database size: 1,500 scale
- Virtual Client Load: 15,000
- RAM Buffer: 48GB
- Test Length: 3 hours
- 2.5 hours preconditioning
- 30 minutes sample-period
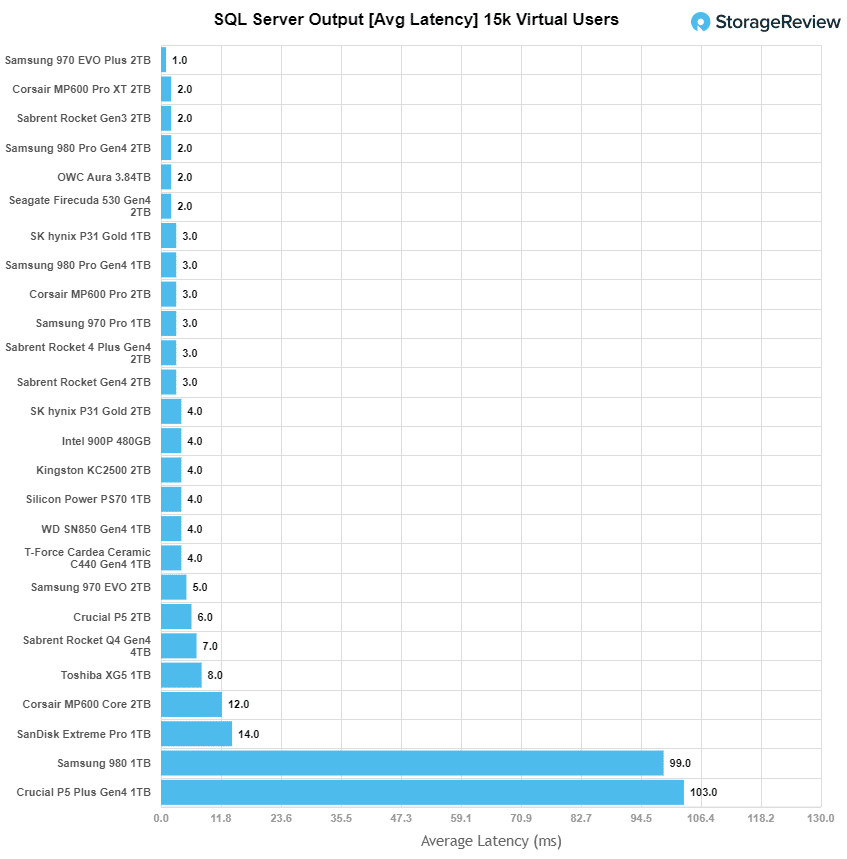
Looking at SQL Server average latency, the Corsair MP600 Pro XT had an average latency of 2ms, which matches the result we saw from the Seagate FireCuda 530. These two E18-powered SSDs are only beaten by the Samsung 970 EVO Plus.
VDBench Workload Analysis
When it comes to benchmarking storage devices, application testing is best, and synthetic testing comes in second place. While not a perfect representation of actual workloads, synthetic tests do help to baseline storage devices with a repeatability factor that makes it easy to do apples-to-apples comparison between competing solutions. These workloads offer a range of different testing profiles ranging from “four corners” tests, common database transfer size tests, to trace captures from different VDI environments.
All of these tests leverage the common vdBench workload generator, with a scripting engine to automate and capture results over a large compute testing cluster. This allows us to repeat the same workloads across a wide range of storage devices, including flash arrays and individual storage devices. Our testing process for these benchmarks fills the entire drive surface with data, then partitions a drive section equal to 5% of the drive capacity to simulate how the drive might respond to
application workloads. This is different than full entropy tests which use 100% of the drive and take them into a steady state. As a result, these figures will reflect higher-sustained write speeds.
Profiles:
- 4K Random Read: 100% Read, 128 threads, 0-120% iorate
- 4K Random Write: 100% Write, 64 threads, 0-120% iorate
- 64K Sequential Read: 100% Read, 16 threads, 0-120% iorate
- 64K Sequential Write: 100% Write, 8 threads, 0-120% iorate
Comparables for this review:
- Phison PS5018-E18
- Samsung 980 Pro 1TB
- Samsung 980 Pro 2TB
- XPG GAMMIX S70 SSD
- Sabrent Rocket 4 Plus
- Seagate FireCuda 530 2TB
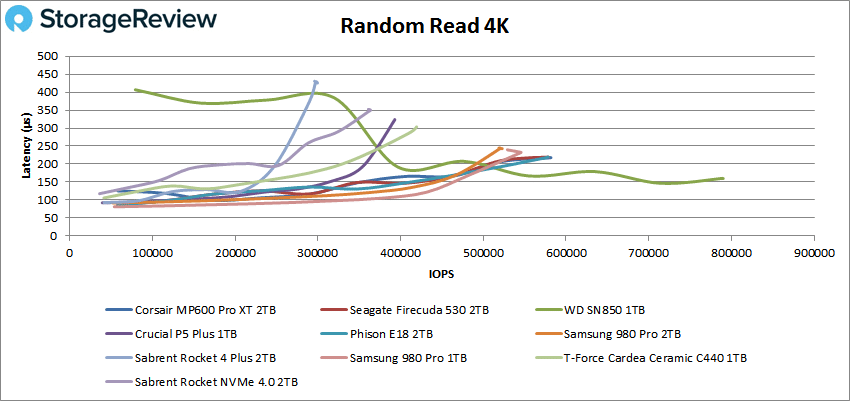
The Corsair MP600 Pro XT did quite well in 4K random read, staying lock-step with the Seagate FireCuda 530. The XT started off at 58k IOPS at 0.125ms, and ended up peaking out in 581k IOPS at 0.218ms of latency.
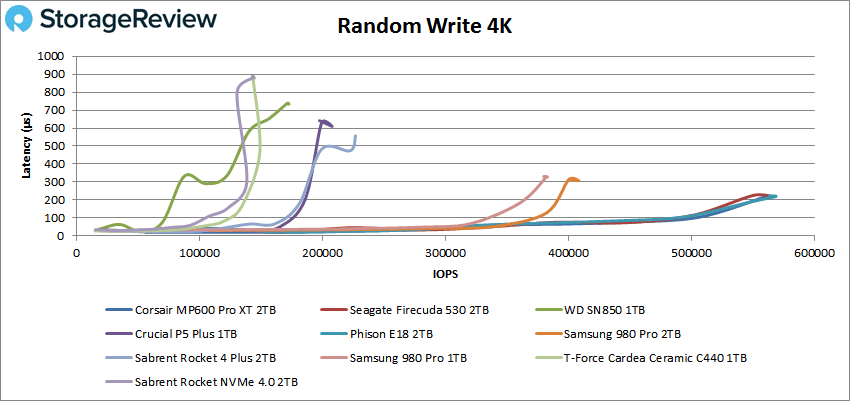
The Corsair MP600 Pro XT and the two other E18-SSDs dominated the Random Write 4K test. The XT started with 56k IOPS at 0.021ms of latency and peaked with an impressive 562k IOPS at 0.222ms of latency.
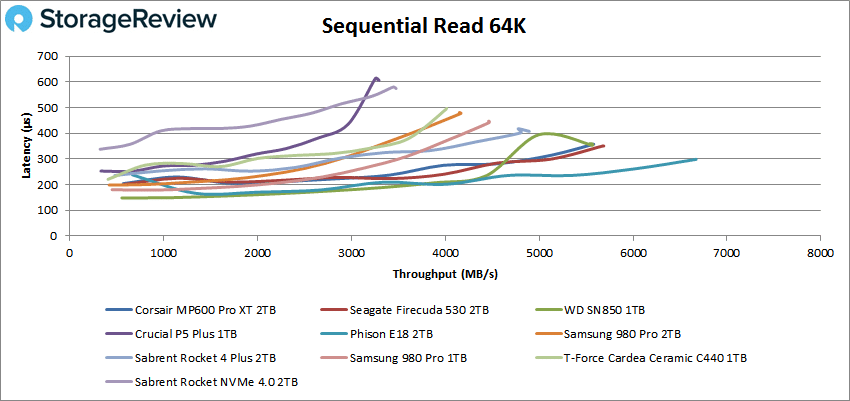
In 64K sequential read, the Corsair MP600 Pro XT came in alongside the Seagate FireCuda 530, although behind where we saw the pre-production E18 sample max out. Compared to the other production drives the new E18-drives were at the top of the pack. We measured sequential bandwidth ranging from 569MB/s at 0.204ms of latency, peaking out at 5.58GB/s at 0.357ms.
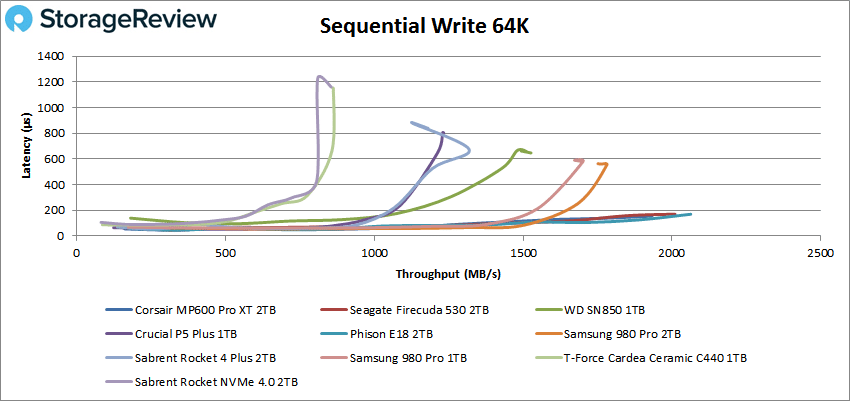
In our 64K sequential write test, the Corsair MP600 Pro XT was another strong performer, measuring from 323MB/s at 0.047ms of latency up to 1.932GB/s at 0.155ms of latency as the drive reached full saturation.
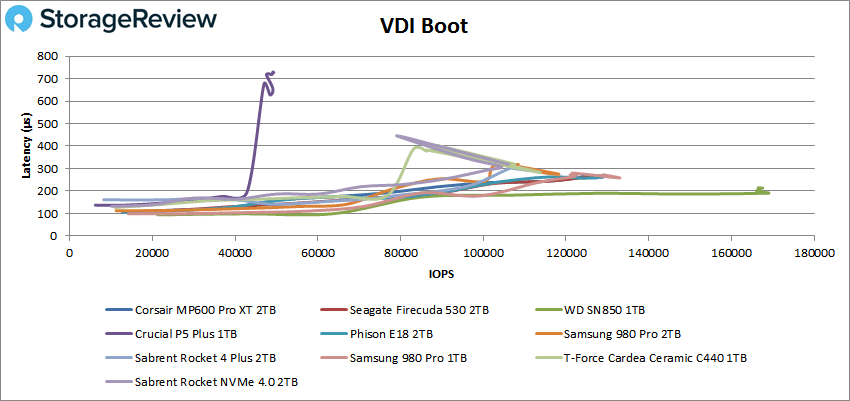
In the VDI Boot workload, the Corsair MP600 Pro XT performed well, coming in grouped second only to the WD SN850 that dominated this test. The XT measured 12.8k IOPS at 0.106ms ramping up to 12.8k IOPS at 0.268ms at its peak.
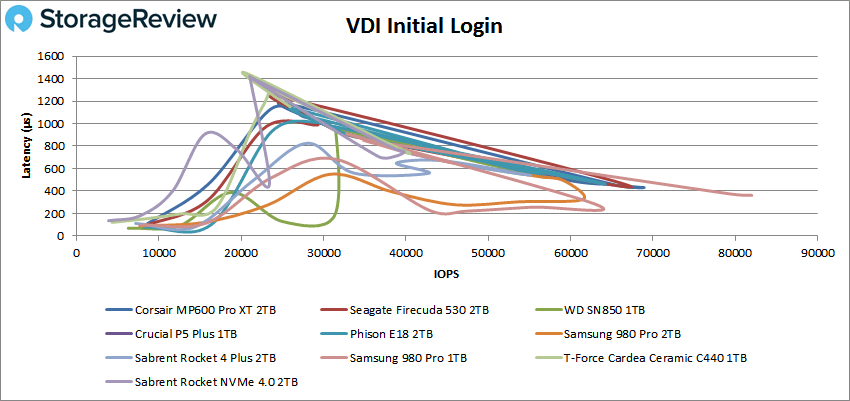
In our VDI Initial Login workload, we measured 7,974 IOPS at 0.081ms and topped out at 68.9k IOPS at 0.431ms. Similar to other consumer drives in this test, at full saturation performance scaled back with latency towards the end of our test.
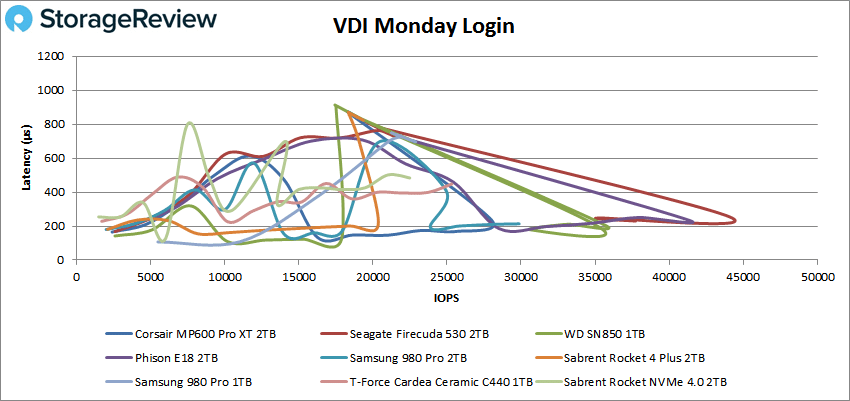
The Corsair MP600 Pro XT measured 2.4k IOPS at 0.165ms starting out and then peaked at 28k IOPS at 0.236ms. Similar to the other consumer drives in this test it falls back in performance under full saturation.
Conclusion
The Corsair MP600 Pro XT is based on the Phison E18 controller and Micron NAND combination. That’s good too, as this combo gives SSD vendors without their own controller tech a fighting chance. Corsair offers the drive in 1TB, 2TB, and 4TB capacities with the standard heat sink. If you want to go with liquid cooling, they offer the Hydro X model in 2TB and 4TB capacities. All of the drives are NVMe Gen4, offering the best possible performance.
In terms of performance, the Corsair MP600 Pro XT performed quite well in our tests. It ran in lock-step with the Seagate FireCuda 530, which shares roughly the same specifications. The only variable in this mix comes down to firmware optimizations, which we did see subtle differences between each of the two drives in our tests.
The pre-production E18 sample peaked a bit higher in certain areas but since it’s not a shipping product it’s hard to compare. For a consumer looking at a top-of-the-line Gen4 M.2 SSD though, the XT is a compelling offering. With highlights such as 581k read 4K read IOPS, 562k random write IOPS, 5.58GB/s sequential read, and 1.932GB/s sequential write, the XT was at or near the top of the charts.
The odd problem with this drive is in the endurance spec, well that and their awful toolbox software. Against the Seagate drive with the same NAND/controller combo, Corsair only offers a TBW spec of 1,400 on the 2TB drive. Seagate’s spec is 2,550 TBW, which is really quite startling. We’re guessing this is a mistake that Corsair will sort out. So setting that aside, at current pricing this looks to be a great combination. Corsair desperately needs to fix their software, but to be fair, most people won’t use that anyway. We feel pretty good about recommending the MP600 Pro XT for enthusiasts that want to get the most out of their storage.


 Amazon