

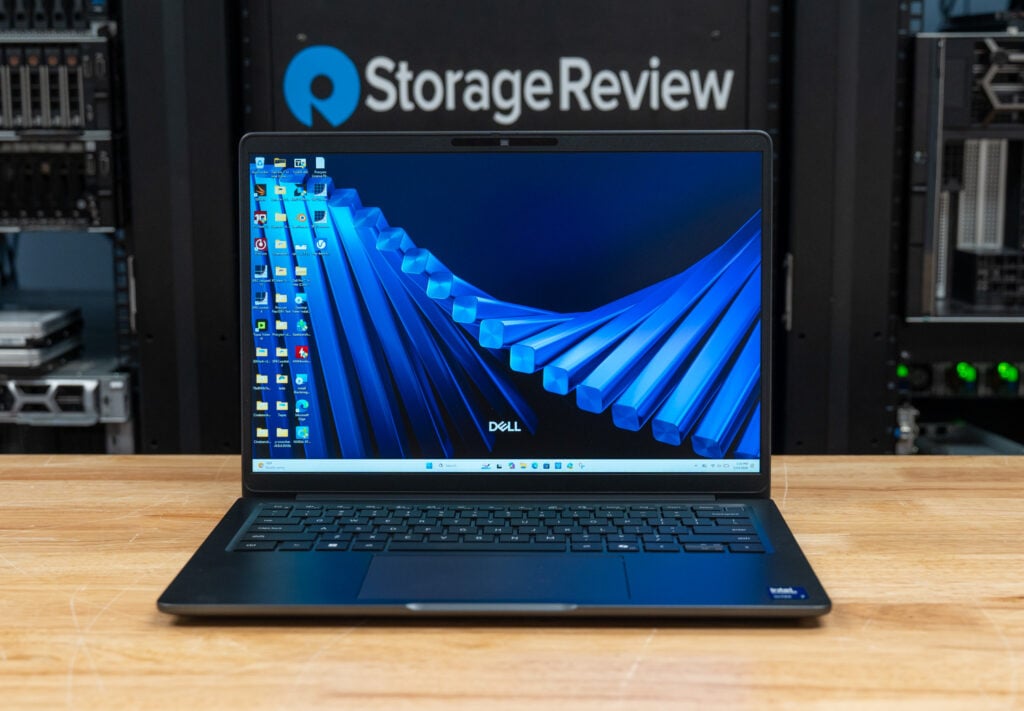
At 2.80 pounds and 16.45 millimeters at its thickest point, the Dell Pro 7 14 Intel is one of the thinnest laptops Dell has put in its commercial Pro line, up to 17 percent slimmer than the 14-inch clamshell generation it replaces. The shell pairs an aluminum top cover and palm rest with a magnesium bottom door, and inside Dell fits a Series 3 Intel Core Ultra 7 366H with Intel vPro, a 16-core chip with a 50 TOPS NPU, alongside 64GB of LPDDR5x-8533 memory and a 1 TB PCIe Gen5 SSD. It is also the most expensive machine in this four-laptop test group at $5,600 as configured, a Dell.com single-unit price that fleet buyers will typically negotiate down.
This laptop posted the best overall PCMark 10 score in the group at 8,438, took the top Digital Content Creation subscore, ran for 26 hours and 18 minutes in our Modern Office battery test, and its SK hynix Gen5 SSD led 3DMark Storage with a score of 3,259 and read at nearly 8.4 GB/s. It recorded the lowest sustained multi-core results of the four in Cinebench and 7-Zip, and its integrated Intel Graphics finished behind the Radeon 890M in the Dell Pro 7 14 AMD and Dell Pro 5 16 AMD across most SPECviewperf viewsets. The sharpest comparison comes from within the family: the nominally lower-tier Pro 5 14 Intel carries a higher-tier Core Ultra X7 368H and Arc B390 graphics for $108 less, and it wins most of the GPU and AI tests.
The case for the Pro 7 14 Intel rests on everything wrapped around those numbers. Intel vPro brings AMT out-of-band management, Hardware Shield, and Threat Detection Technology, layered under Dell SafeBIOS, quantum-resistant BIOS verification, and Trusted Device, with 36 months of ProSupport Next Business Day Onsite service and durability testing beyond standard MIL-STD requirements. Executives and mobile professionals who count grams and unplugged hours more than render minutes are the target audience, and this review examines whether the lightest Pro earns its premium over its siblings.
Design and Build
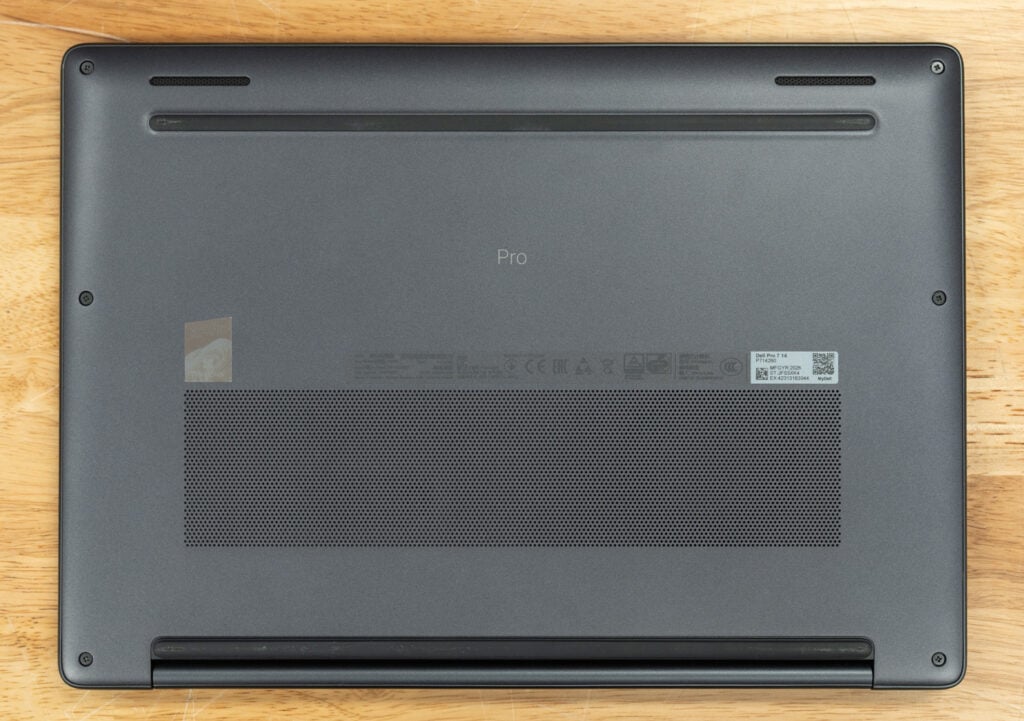
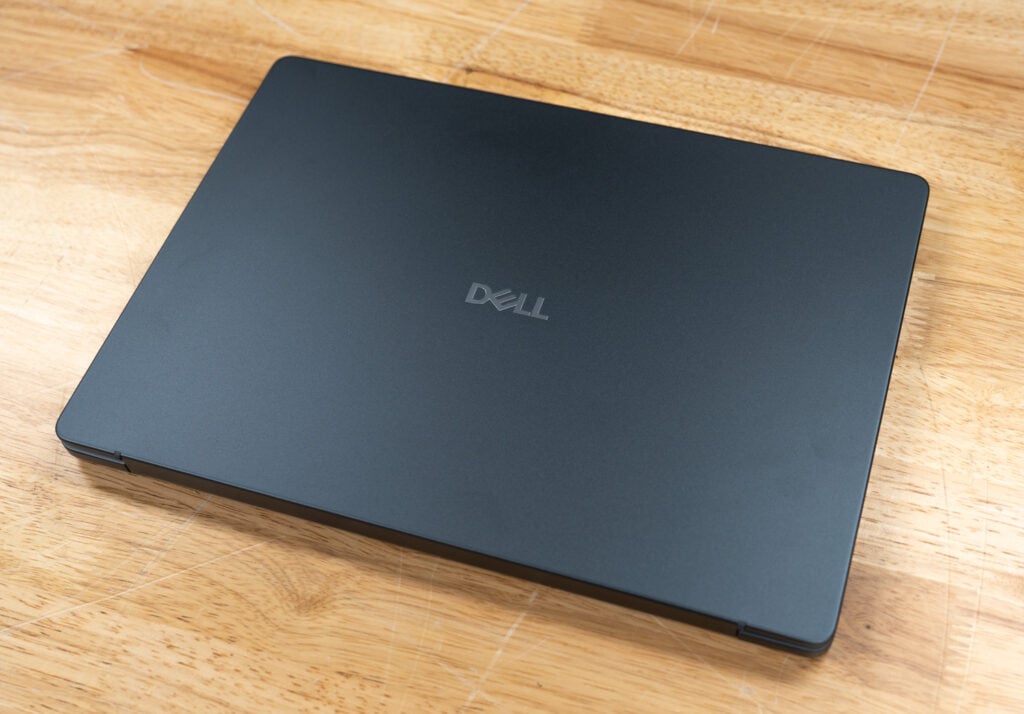
The Dell Pro 7 14 Intel uses the same compact chassis as the AMD model, pairing an aluminum top cover and palm rest with a lightweight magnesium bottom door. Dell calls it the thinnest 14-inch notebook in its current Pro lineup, measuring 10.3 mm at the front and up to 16.45 mm at its thickest point. It is also up to 17% thinner than the previous 14-inch clamshell generation.
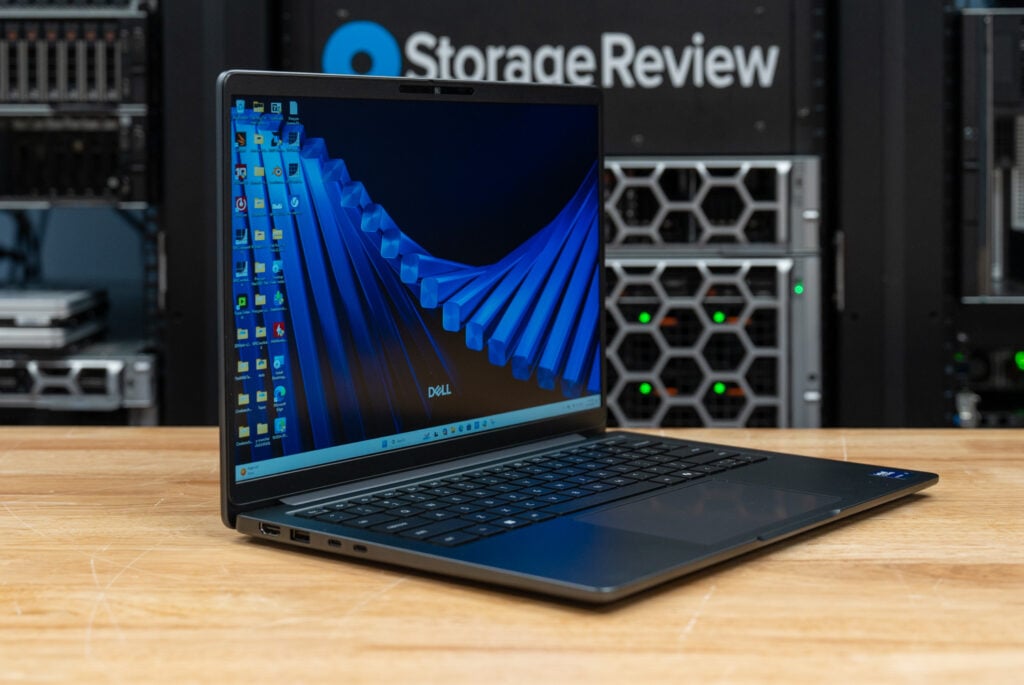
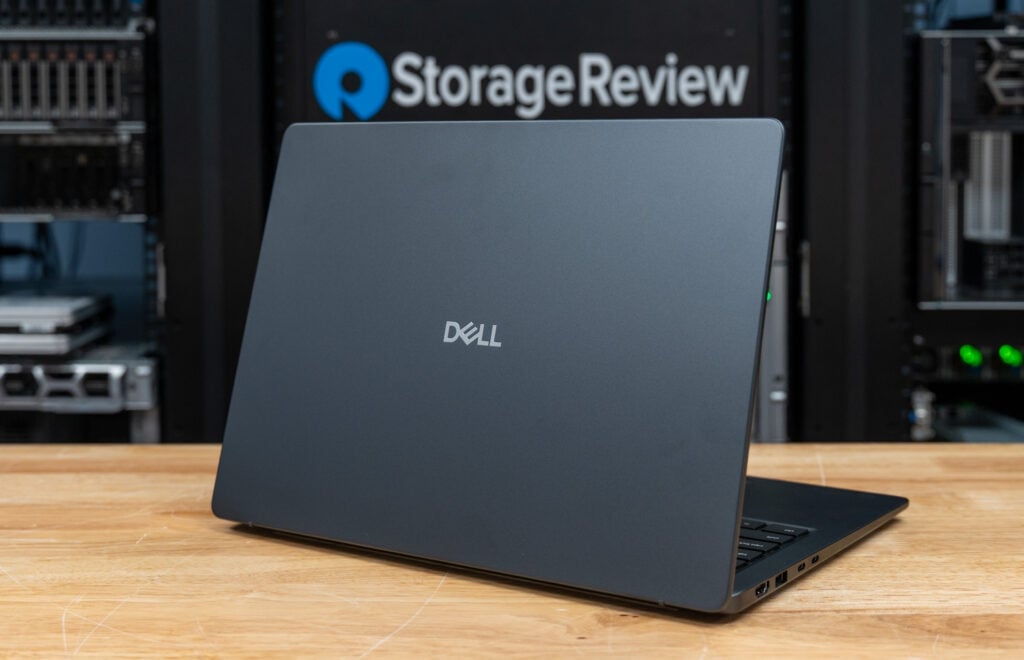
The dark gray finish and simple shape fit the business focus, but the metal construction keeps it from feeling flimsy. Dell says the chassis has been tested beyond standard MIL-STD requirements, which is useful for a system likely to spend much of its time being carried between offices, meeting rooms, and airports.
Display and Input
Our review unit has a 14-inch WUXGA display with a 1920 x 1200 resolution and a taller 16:10 aspect ratio. The non-touch panel supports a variable refresh rate from 1 to 120 Hz, reaches 500 nits, covers 100% of the sRGB color space, and uses an anti-glare finish. It is also one of Dell’s super-low-power panels, which likely helped the system last 26 hours and 18 minutes in our PCMark 10 Modern Office battery test shown below.
Dell includes ComfortView Plus to reduce blue-light output without applying the heavy yellow tint associated with some software filters. Text and interface elements remain sharp at this resolution, while the 120 Hz maximum refresh rate makes scrolling and general navigation feel smoother than on a standard 60 Hz business display.
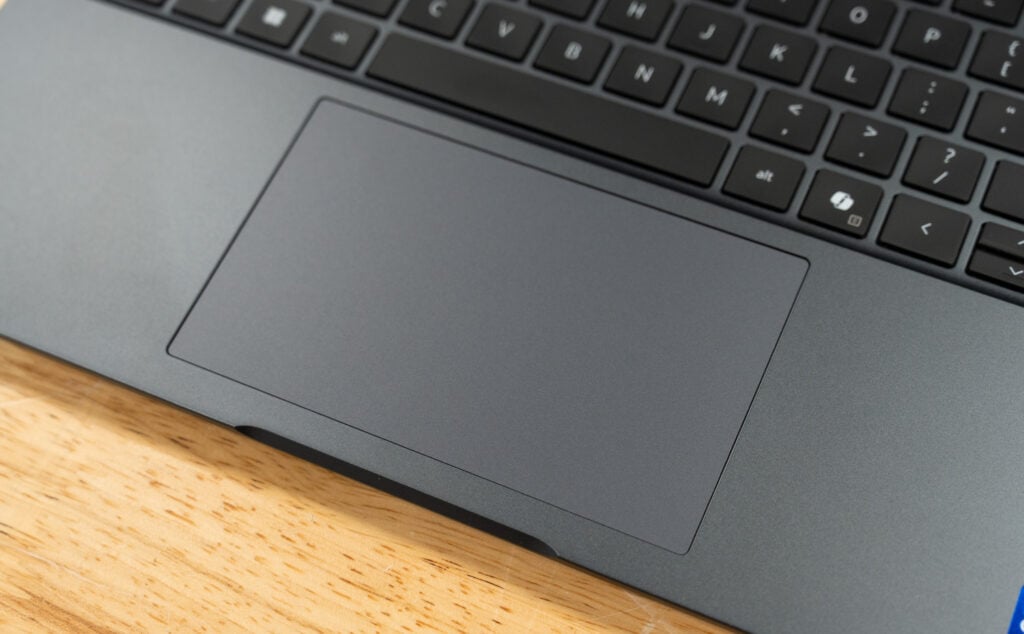
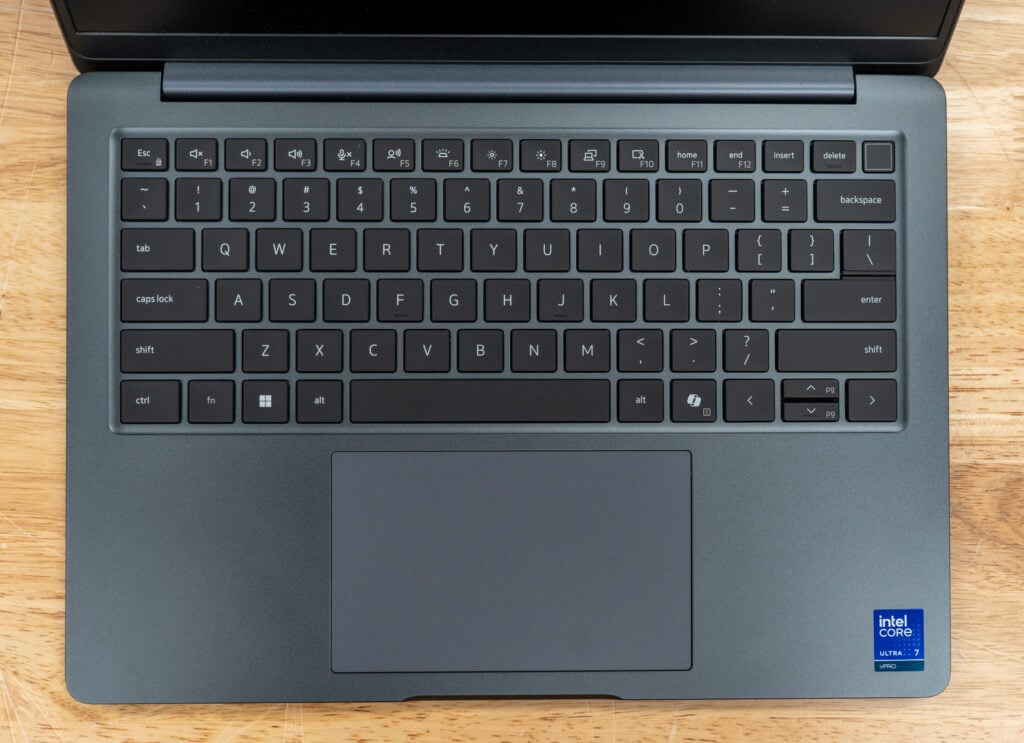
The Mini-LED backlit keyboard is spill-resistant and includes a dedicated AI key. The layout uses the available width well, with full-sized primary keys and no numeric keypad taking up space on the right. A large, precision touchpad sits below it, providing enough space for multi-finger gestures.
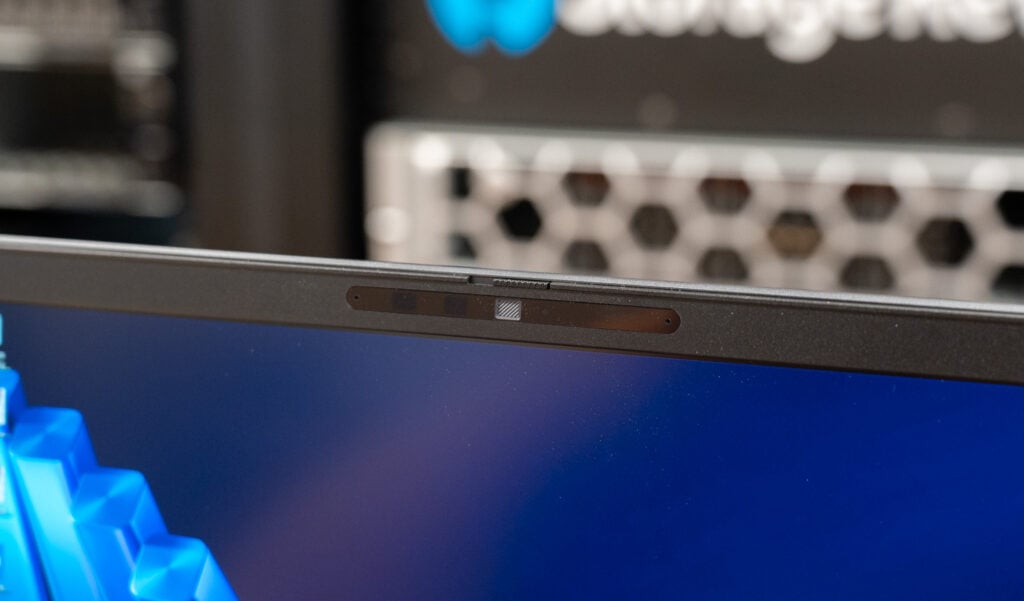
Above the display is an 8MP RGB HDR and infrared camera capable of recording at 1440p and 30 frames per second. It supports Windows Hello facial recognition, presence detection, and temporal noise reduction, and includes a physical shutter for privacy.
Ports and Connectivity
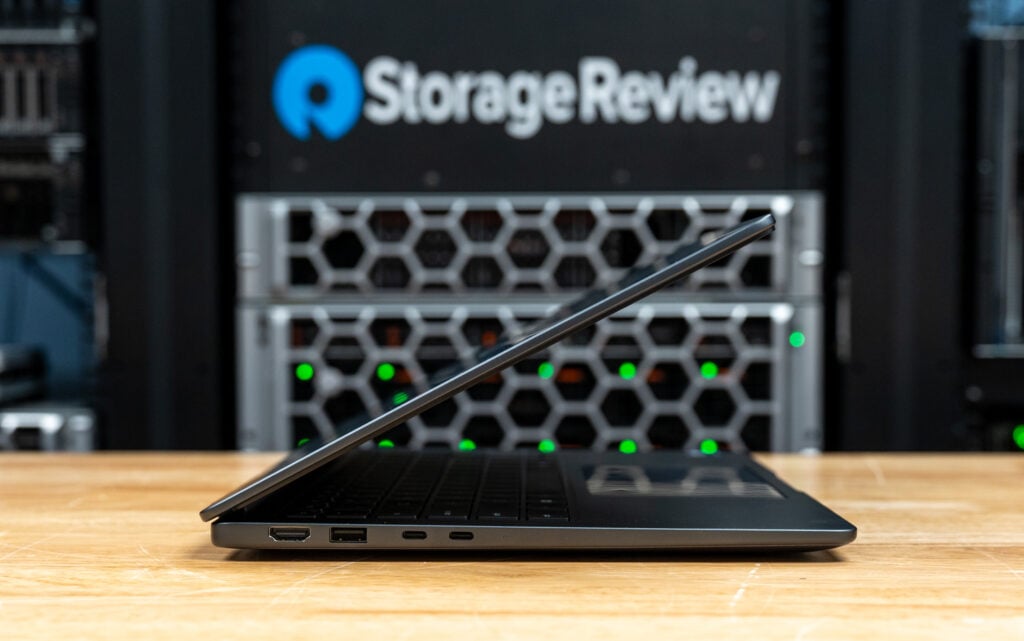
Port selection is good for a laptop this thin. The left side has two Thunderbolt 4 Type-C ports supporting USB4 at up to 40Gbps, DisplayPort 2.1, and Power Delivery. HDMI 2.1 and a USB 3.2 Gen 1 Type-A port with PowerShare are also located on this side.
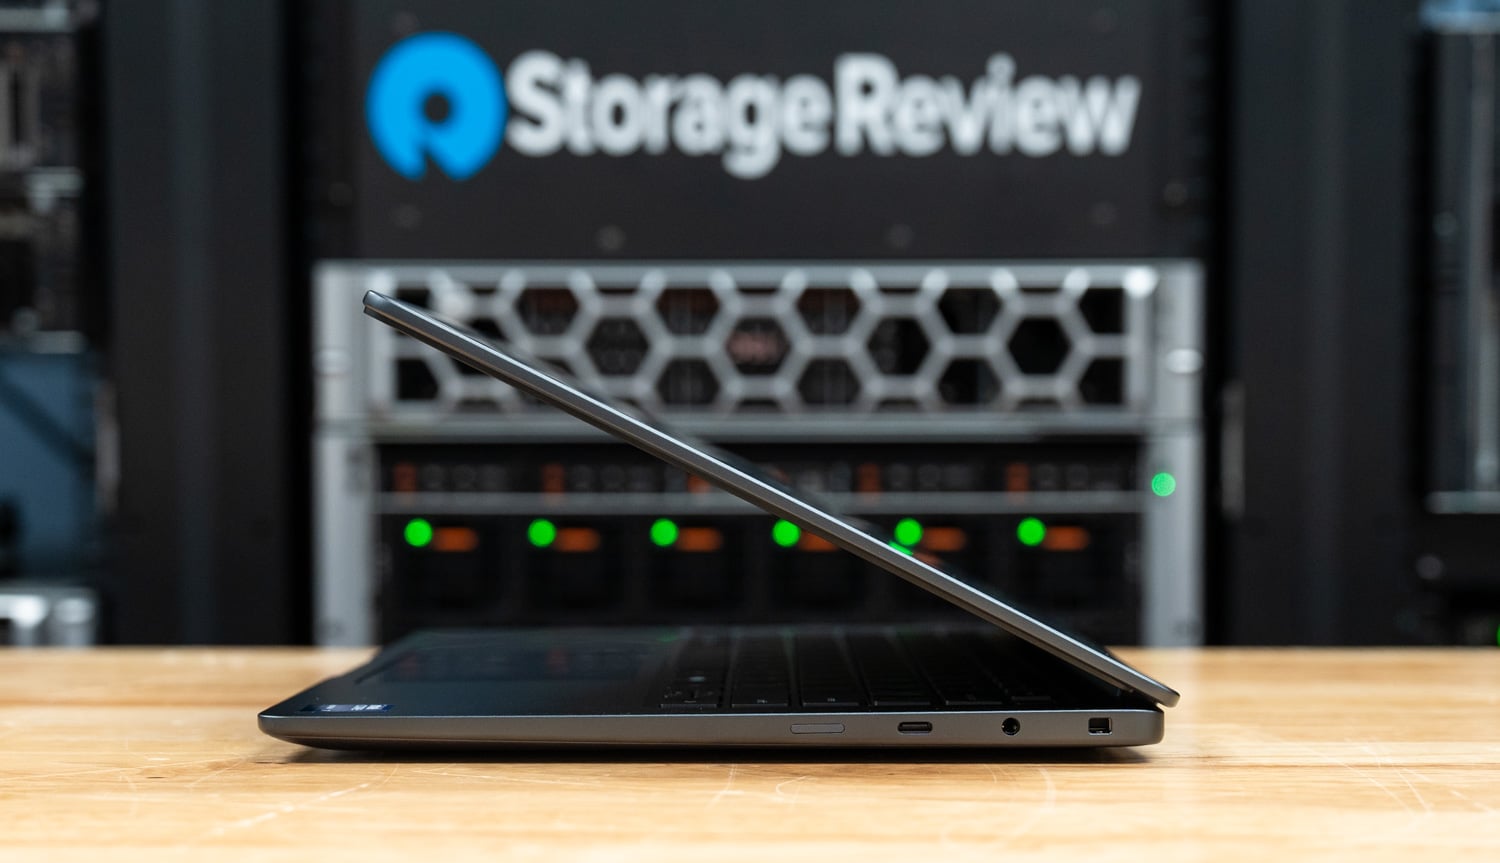
Our configuration adds a third USB Type-C port on the right. This connection supports USB 3.2 Gen 2×2 at up to 20Gbps, DisplayPort 1.4, and Power Delivery. Dell offers it as an alternative to a second USB Type-A port with PowerShare, so the exact layout depends on the selected configuration. The right side also includes the headset jack, wedge-shaped security slot, and an optional nano-SIM tray, while an optional smart-card reader slot is located on the left on supported configurations.
Wireless connectivity is provided by an Intel Wi-Fi 7 BE211 2×2 adapter, qualified against Bluetooth Core 6.0. The laptop charges through USB-C using the included 65W adapter, which can be connected to either side. Its 70Wh battery supports ExpressCharge and ExpressCharge Boost, though Dell notes both fast-charging modes require at least a 100W adapter, so the bundled 65W unit charges at standard speed.
Security and Manageability
The main difference between this system and the otherwise similar Pro 7 14 AMD is Intel vPro. Intel Active Management Technology provides out-of-band access that can allow IT staff to diagnose, configure, and support a system even when its operating system is unavailable. That can be particularly valuable for companies managing laptops across multiple offices or supporting employees working remotely.
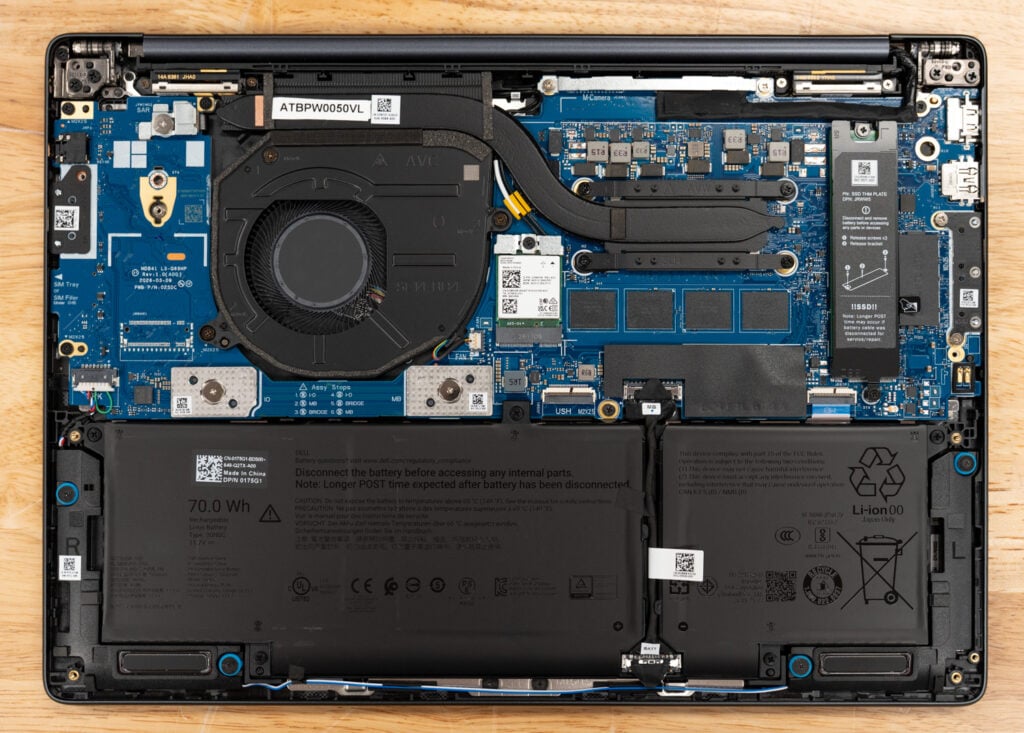
Intel Hardware Shield adds protections below the operating system, while Threat Detection Technology can help security software identify certain attacks. Intel’s Stable IT Platform Program also provides businesses with a more predictable hardware and driver platform for large-scale deployments.
Dell adds its own security and management features through SafeBIOS, Trusted Device, and quantum-resistant BIOS verification. Our configuration includes a fingerprint reader integrated into the power button, an infrared camera for Windows Hello, a physical camera shutter, and TPM 2.0 certified to FIPS 140-3 requirements.
Dell Management Portal can work with Microsoft Intune to manage Dell-specific settings from an existing cloud-management environment. Our review configuration also includes 36 months of ProSupport with Next Business Day Onsite service following remote diagnosis.
Dell Pro 7 14 (Intel) Specifications
| Specification | Dell Pro 7 14 (P714260) |
|---|---|
| Platform Overview | |
| Processor | Series 3 Intel Core Ultra 7 366H with Intel vPro 16 cores, up to 4.8 GHz 50 TOPS NPU (Copilot+ PC) |
| Graphics | Intel Graphics (integrated, 4 Xe cores) |
| Operating System | Windows 11 Pro (Copilot+ PC) |
| Memory and Storage | |
| Memory | 64 GB LPDDR5x-8533, dual-channel, onboard |
| Storage | 1 TB Performance SSD, PCIe Gen5, SED Ready (SK hynix PCB01) |
| Display and Camera | |
| Display | 14″ WUXGA (1920 x 1200), non-touch, VRR 1 to 120 Hz 500 nits, 100% sRGB, ComfortView Plus, anti-glare, super-low-power |
| Camera | 8 MP RGB HDR + IR, 1440p at 30 fps Presence Detection, Temporal Noise Reduction, Camera Shutter |
| Connectivity and Input | |
| Wireless | Intel Wi-Fi 7 BE211, 2×2, Bluetooth Core 6.0 |
| Keyboard | Mini-LED backlit, AI hotkey, spill resistant, US English |
| Ports | 2x Thunderbolt 4/USB4 (40Gbps) Type-C with Power Delivery and DisplayPort 2.1 1x USB 3.2 Gen 2×2 (20Gbps) Type-C with Power Delivery and DisplayPort 1.4 (as configured; alternative is a second USB 3.2 Gen 1 Type-A with PowerShare) 1x USB 3.2 Gen 1 Type-A with PowerShare 1x HDMI 2.1 1x global headset port 1x wedge-shaped lock slot Optional nano-SIM tray and smart-card reader slot |
| Security and Manageability | |
| Security | Fingerprint reader in power button (Windows Hello) TPM 2.0 FIPS 140-3 / TCG Certified Quantum-resistant BIOS verification, camera shutter |
| Manageability | Intel vPro (AMT, Hardware Shield, TDT, SIPP) Dell SafeBIOS, Trusted Device, Dell Management Portal, Intune |
| Power and Physical | |
| Battery | 3-cell, 70 Wh, ExpressCharge / ExpressCharge Boost |
| Power Adapter | 65 W USB-C |
| Chassis | Aluminum top cover and palmrest, magnesium bottom cover From 2.80 lb; 10.3 to 16.45 mm thick |
| Certifications, Warranty and Pricing | |
| Certifications | ENERGY STAR, EPEAT Gold with Climate+, TCO Certified Tested beyond standard MIL-STD requirements |
| Service | Dell ProSupport, Next Business Day Onsite, 36 months |
| Base Price | $2,359 |
| Price as Tested | $5,600 (Dell.com single-unit, no discount) |
Performance
To see how the Dell Pro 7 14 Intel fits within Dell’s current commercial lineup, we tested it alongside the Pro 5 14 Intel and both AMD configurations. All four laptops ran our standard power profile across general productivity, CPU rendering, GPU compute, professional visualization, storage, AI, and battery workloads.
Although the two Intel laptops are built on the same Series 3 Core Ultra platform, they are not equals: the Pro 7 14’s Core Ultra 7 366H and standard Intel Graphics give up ground to the Pro 5 14’s higher-tier X7 368H and Arc B390 in most GPU and AI tests. Comparisons with the AMD pair split by workload, with the Intel machines ahead in Blender GPU rendering and AI text generation, while the Radeon 890M systems lead most SPECviewperf CAD viewsets.
Test Systems
| Specification | Dell Pro 5 16 (AMD) | Dell Pro 7 14 (AMD) | Dell Pro 7 14 (Intel) | Dell Pro 5 14 (Intel) |
|---|---|---|---|---|
| CPU | Ryzen AI 9 HX PRO 470 (12C/24T) | Ryzen AI 9 HX PRO 470 (12C/24T) | Core Ultra 7 366H (16C) | Core Ultra X7 368H (16C) |
| GPU | Radeon 890M | Radeon 890M | Intel Graphics | Intel Arc B390 |
| Memory | 64 GB DDR5-5600 | 64 GB LPDDR5x-8533 | 64 GB LPDDR5x-8533 | 64 GB LPCAMM2-8533 |
| Storage | SanDisk PC SN5100S 1 TB | Samsung BM9C1a 1 TB | SK hynix PCB01 1 TB | SK hynix PCB01 1 TB |
| Display | 16″ WQXGA | 14″ WUXGA | 14″ WUXGA | 14″ WUXGA |
| Price as Tested | $4,648 | $5,377 | $5,600 | $5,492 |
UL Procyon: AI Computer Vision
The Procyon AI Computer Vision Benchmark measures AI inference performance across CPUs, GPUs, and dedicated accelerators using a range of state-of-the-art neural networks. It evaluates tasks such as image classification, object detection, segmentation, and super-resolution using models including MobileNet V3, Inception V4, YOLO V3, DeepLab V3, Real ESRGAN, and ResNet 50. Tests are run on multiple inference engines, including NVIDIA TensorRT, Intel OpenVINO, Qualcomm SNPE, Microsoft Windows ML, and Apple Core ML, providing a broad view of hardware and software efficiency. Results are reported for float- and integer-optimized models, providing a consistent, practical measure of machine vision performance for professional workloads.
The Dell Pro 7 14 Intel performed much better on the CPU side of the AI Computer Vision benchmark, with an overall score of 121 that led the group by a narrow margin. It also posted the fastest results in DeepLab V3 and YOLO V3, though the Pro 5 14 Intel was quicker in MobileNet V3, ResNet 50, Inception V4, and REAL-ESRGAN. GPU performance was less competitive, with an overall score of 205, placing it behind both Radeon 890M systems and well below the Pro 5 14 Intel’s score of 398. The Pro 7 14 Intel did lead the AMD laptops in several individual GPU workloads, but its slow REAL-ESRGAN result of 1,309.49 ms pulled down the overall score.
| CPU Results (average time in ms) | Dell Pro 5 16 (AMD Ryzen AI 9 HX PRO 470 12C) | Dell Pro 7 14 (AMD Ryzen AI 9 HX PRO 470 12C) | Dell Pro 7 14 (Intel Core Ultra 7 366H 16C) | Dell Pro 5 14 (Intel Core Ultra X7 368H 16C) |
|---|---|---|---|---|
| AI Computer Vision Overall Score | 91 | 77 | 121 | 119 |
| MobileNet V3 | 1.57 ms | 1.79 ms | 1.24 ms | 1.09 ms |
| ResNet 50 | 13.64 ms | 16.46 ms | 11.57 ms | 10.11 ms |
| Inception V4 | 40.43 ms | 51.10 ms | 34.01 ms | 29.77 ms |
| DeepLab V3 | 69.73 ms | 74.74 ms | 37.98 ms | 50.18 ms |
| YOLO V3 | 99.38 ms | 122.35 ms | 81.22 ms | 112.64 ms |
| REAL-ESRGAN | 4,504.35 ms | 5,383.21 ms | 3,163.45 ms | 2,884.51 ms |
| GPU Results (average time in ms) | Dell Pro 5 16 (AMD Ryzen AI 9 HX PRO 470 12C) | Dell Pro 7 14 (AMD Ryzen AI 9 HX PRO 470 12C) | Dell Pro 7 14 (Intel Core Ultra 7 366H 16C) | Dell Pro 5 14 (Intel Core Ultra X7 368H 16C) |
|---|---|---|---|---|
| AI Computer Vision Overall Score | 214 | 243 | 205 | 398 |
| MobileNet V3 | 1.56 ms | 1.17 ms | 1.04 ms | 0.84 ms |
| ResNet 50 | 8.76 ms | 7.93 ms | 6.52 ms | 2.94 ms |
| Inception V4 | 22.46 ms | 20.06 ms | 20.72 ms | 8.38 ms |
| DeepLab V3 | 38.40 ms | 34.04 ms | 26.53 ms | 17.54 ms |
| YOLO V3 | 23.56 ms | 21.92 ms | 43.07 ms | 19.14 ms |
| REAL-ESRGAN | 570.35 ms | 536.81 ms | 1,309.49 ms | 562.87 ms |
UL Procyon: AI Text Generation
The Procyon AI Text Generation Benchmark streamlines LLM performance testing by providing a concise, consistent evaluation method. It enables repeated testing across multiple LLM models while minimizing the complexity of large models and the number of variables. Developed with AI hardware leaders, it optimizes the use of local AI accelerators to deliver more reliable, efficient performance assessments.
The Dell Pro 7 14 Intel finished comfortably ahead of both AMD systems across all four AI Text Generation workloads, with scores of 689 on Phi, 525 on Mistral, 509 on Llama3, and 530 on Llama2. It also produced lower time-to-first-token results and higher token-generation rates throughout the test. The Pro 5 14 Intel was faster across all workloads, with its higher-tier processor leading by about 21% in Llama2 and 39% in Llama3. That said, the Pro 7 14 Intel provided a noticeable improvement over the AMD models for local LLM workloads.
| UL Procyon: AI Text Generation | Dell Pro 5 16 (AMD Ryzen AI 9 HX PRO 470 12C) | Dell Pro 7 14 (AMD Ryzen AI 9 HX PRO 470 12C) | Dell Pro 7 14 (Intel Core Ultra 7 366H 16C) | Dell Pro 5 14 (Intel Core Ultra X7 368H 16C) |
|---|---|---|---|---|
| Phi | ||||
| Phi Overall Score | 371 | 427 | 689 | 904 |
| Phi Output Time To First Token | 5.052 s | 4.286 s | 1.843 s | 1.158 s |
| Phi Output Tokens Per Second | 27.163 tokens/s | 30.492 tokens/s | 34.172 tokens/s | 36.952 tokens/s |
| Phi Overall Duration | 135.343 s | 118.697 s | 92.273 s | 81.304 s |
| Mistral | ||||
| Mistral Overall Score | 346 | 389 | 525 | 716 |
| Mistral Output Time To First Token | 6.929 s | 6.060 s | 3.778 s | 2.195 s |
| Mistral Output Tokens Per Second | 18.174 tokens/s | 20.125 tokens/s | 22.843 tokens/s | 24.724 tokens/s |
| Mistral Overall Duration | 196.185 s | 176.220 s | 143.831 s | 123.773 s |
| Llama3 | ||||
| Llama3 Overall Score | 306 | 345 | 509 | 708 |
| Llama3 Output Time To First Token | 6.518 s | 5.707 s | 2.992 s | 1.657 s |
| Llama3 Output Tokens Per Second | 15.050 tokens/s | 16.725 tokens/s | 19.104 tokens/s | 20.421 tokens/s |
| Llama3 Overall Duration | 224.176 s | 199.931 s | 161.290 s | 142.814 s |
| Llama2 | ||||
| Llama2 Overall Score | 329 | 367 | 530 | 641 |
| Llama2 Output Time To First Token | 11.089 s | 10.307 s | 5.412 s | 4.082 s |
| Llama2 Output Tokens Per Second | 8.878 tokens/s | 10.260 tokens/s | 11.230 tokens/s | 12.397 tokens/s |
| Llama2 Overall Duration | 381.464 s | 334.648 s | 278.109 s | 245.572 s |
UL Procyon: AI Image Generation
The Procyon AI Image Generation Benchmark provides a consistent and accurate method for measuring AI inference performance across a range of hardware, from low-power NPUs to high-end GPUs. It includes three tests: Stable Diffusion XL (FP16) for high-end GPUs, Stable Diffusion 1.5 (FP16) for moderately powerful GPUs, and Stable Diffusion 1.5 (INT8) for low-power devices. The benchmark uses the optimal inference engine for each system, ensuring fair and comparable results.
The Dell Pro 7 14 Intel was placed near the two AMD systems in the Stable Diffusion 1.5 tests, scoring 258 in FP16 and 3,575 in INT8. Those results were only slightly ahead of or behind the AMD laptops, with image-generation times separated by about a second or less in both workloads. It pulled further ahead in Stable Diffusion XL, where its score of 268 was about 51% higher than the Pro 7 14 AMD’s 177, and its 139.410-second image-generation time was considerably faster. The Pro 5 14 Intel still led every test by a wide margin, making the difference between the two Intel graphics configurations especially noticeable here.
| UL Procyon: AI Image Generation | Dell Pro 5 16 (AMD Ryzen AI 9 HX PRO 470 12C) | Dell Pro 7 14 (AMD Ryzen AI 9 HX PRO 470 12C) | Dell Pro 7 14 (Intel Core Ultra 7 366H 16C) | Dell Pro 5 14 (Intel Core Ultra X7 368H 16C) |
|---|---|---|---|---|
| Stable Diffusion 1.5 (FP16) | ||||
| Stable Diffusion 1.5 (FP16) – Overall Score | 255 | 247 | 258 | 635 |
| Stable Diffusion 1.5 (FP16) – Overall Time | 391.577 s | 404.455 s | 386.614 s | 157.296 s |
| Stable Diffusion 1.5 (FP16) – Image Generation Speed | 24.474 s/image | 25.278 s/image | 24.163 s/image | 9.831 s/image |
| Stable Diffusion 1.5 (INT8) | ||||
| Stable Diffusion 1.5 (INT8) – Overall Score | 3,598 | 3,521 | 3,575 | 7,693 |
| Stable Diffusion 1.5 (INT8) – Overall Time | 69.478 s | 70.985 s | 69.911 s | 32.495 s |
| Stable Diffusion 1.5 (INT8) – Image Generation Speed | 8.685 s/image | 8.873 s/image | 8.739 s/image | 4.062 s/image |
| Stable Diffusion XL (FP16) | ||||
| Stable Diffusion XL (FP16) – Overall Score | 173 | 177 | 268 | 646 |
| Stable Diffusion XL (FP16) – Overall Time | 3,448.478 s | 3,379.388 s | 2,230.563 s | 928.747 s |
| Stable Diffusion XL (FP16) – Image Generation Speed | 215.530 s/image | 211.212 s/image | 139.410 s/image | 58.047 s/image |
PCMark 10
PCMark 10 measures general system performance across everyday work such as web browsing, video conferencing, spreadsheets, writing, photo editing, and rendering. Higher scores are better.
The Dell Pro 7 14 Intel posted the highest overall PCMark 10 score of the group at 8,438, placing it about 2% ahead of both AMD systems and 6% ahead of the Pro 5 14 Intel. It also led the Essentials test with 10,981 and took first place in Digital Content Creation with 10,610, holding an 8% advantage over the next-fastest system. Its Productivity score of 13,992 was slightly behind the AMD laptops, but the overall result shows that it delivers excellent responsiveness across common office and content-creation tasks.
| PCMark 10 (higher is better) | Dell Pro 5 16 (AMD Ryzen AI 9 HX PRO 470 12C) | Dell Pro 7 14 (AMD Ryzen AI 9 HX PRO 470 12C) | Dell Pro 7 14 (Intel Core Ultra 7 366H 16C) | Dell Pro 5 14 (Intel Core Ultra X7 368H 16C) |
|---|---|---|---|---|
| Overall | 8,268 | 8,237 | 8,438 | 7,945 |
| Essentials | 10,870 | 10,783 | 10,981 | 10,751 |
| Productivity | 14,322 | 14,366 | 13,992 | 13,821 |
| Digital Content Creation | 9,852 | 9,792 | 10,610 | 9,158 |
Geekbench 6
Geekbench 6 measures processor performance using a mix of common tasks, with separate scores for single-core and multi-core workloads. Higher scores are better.
The Dell Pro 7 14 Intel scored 2,862 in Geekbench 6 single-core, placing it last in the group but only about 4% behind the leading Pro 5 16 AMD. Its multi-core score of 16,787 was far more competitive, finishing within 1% of the Pro 5 14 Intel and around 14% ahead of both AMD systems. This was one of the stronger multi-core results for the Pro 7 14 Intel, showing that its Core Ultra 7 366H can perform well in shorter, mixed workloads, even though it falls behind in longer, sustained tests.
| Geekbench 6 (higher is better) | Dell Pro 5 16 (AMD Ryzen AI 9 HX PRO 470 12C) | Dell Pro 7 14 (AMD Ryzen AI 9 HX PRO 470 12C) | Dell Pro 7 14 (Intel Core Ultra 7 366H 16C) | Dell Pro 5 14 (Intel Core Ultra X7 368H 16C) |
|---|---|---|---|---|
| Single-Core | 2,989 | 2,888 | 2,862 | 2,968 |
| Multi-Core | 14,348 | 14,768 | 16,787 | 16,874 |
Cinebench R23 and 2024
Cinebench measures how quickly the processor can render a complex scene, with separate tests for single-core and multi-core performance. Higher scores are better.
The Dell Pro 7 14 Intel delivered strong single-core performance in Cinebench R23, leading the group with a score of 2,043, but its multi-core score of 14,640 was the lowest of the four systems. The same pattern carried over to Cinebench 2024, where its single-core score of 116 was competitive, but its multi-core score of 683 placed it well behind the other laptops. The Pro 5 14 Intel finished about 16% ahead in R23 multi-core and 18% ahead in Cinebench 2024 multi-core, while the larger Pro 5 16 AMD extended those leads to 28% and 54%, respectively.
| Cinebench (higher is better) | Dell Pro 5 16 (AMD Ryzen AI 9 HX PRO 470 12C) | Dell Pro 7 14 (AMD Ryzen AI 9 HX PRO 470 12C) | Dell Pro 7 14 (Intel Core Ultra 7 366H 16C) | Dell Pro 5 14 (Intel Core Ultra X7 368H 16C) |
|---|---|---|---|---|
| R23 Single-Core | 2,029 | 1,946 | 2,043 | 2,010 |
| R23 Multi-Core | 18,764 | 15,173 | 14,640 | 16,915 |
| 2024 Single-Core | 119 | 105 | 116 | 122 |
| 2024 Multi-Core | 1,055 | 847 | 683 | 807 |
7-Zip Compression
The 7-Zip benchmark measures how quickly the processor can compress and decompress data using multiple threads. Higher GIPS scores are better.
The Dell Pro 7 14 Intel recorded a total rating of 81.2 GIPS in the 7-Zip benchmark, placing it last among the four systems. It trailed the Pro 5 14 Intel by about 9%, the Pro 7 14 AMD by 10%, and the larger Pro 5 16 AMD by 22%. The result follows the same trend seen in Cinebench, with the thin chassis limiting the Core Ultra 7 366H during workloads that keep all of its cores busy for an extended period.
| 7-Zip (higher is better) | Dell Pro 5 16 (AMD Ryzen AI 9 HX PRO 470 12C) | Dell Pro 7 14 (AMD Ryzen AI 9 HX PRO 470 12C) | Dell Pro 7 14 (Intel Core Ultra 7 366H 16C) | Dell Pro 5 14 (Intel Core Ultra X7 368H 16C) |
|---|---|---|---|---|
| Total Rating (GIPS) | 103.9 | 90.2 | 81.2 | 89.4 |
y-cruncher
y-cruncher measures how quickly the processor can calculate large numbers of Pi digits, placing a heavy load on the CPU and memory. Results are measured in seconds, so lower times are better.
The Dell Pro 7 14 Intel was the slowest system across all three y-cruncher workloads, completing the 1-billion-digit calculation in 34.775 seconds, the 2.5-billion-digit test in 104.586 seconds, and the 5-billion-digit test in 240.554 seconds. The Pro 5 14 Intel was around 15% faster throughout, while the two Ryzen systems extended their advantage as the workload increased. At 5 billion digits, the Pro 5 16 AMD completed the calculation roughly 32% faster, which shows the difference between the Pro 7 14’s portable design and the larger AMD system’s sustained CPU performance.
| y-cruncher — seconds (lower is better) | Dell Pro 5 16 (AMD Ryzen AI 9 HX PRO 470 12C) | Dell Pro 7 14 (AMD Ryzen AI 9 HX PRO 470 12C) | Dell Pro 7 14 (Intel Core Ultra 7 366H 16C) | Dell Pro 5 14 (Intel Core Ultra X7 368H 16C) |
|---|---|---|---|---|
| 1 Billion | 25.160 | 25.199 | 34.775 | 29.405 |
| 2.5 Billion | 73.320 | 79.393 | 104.586 | 90.719 |
| 5 Billion | 163.768 | 177.776 | 240.554 | 204.685 |
Blender 5.1.1 (GPU)
The Blender benchmark measures GPU rendering performance using three different 3D scenes: Monster, Junkshop, and Classroom. Results are reported in samples per minute, so higher scores are better.
The Dell Pro 7 14 Intel performed well in Blender compared with the Radeon 890M systems, reaching 253.6 samples per minute in Monster, 189.3 in Junkshop, and 153.0 in Classroom. Those results placed it around 45% to 80% ahead of the Pro 7 14 AMD, depending on the scene. The Pro 5 14 Intel’s Arc B390 was considerably faster still, leading the Pro 7 14 Intel by 45% in Monster, 65% in Junkshop, and 60% in Classroom. This gives the Pro 7 14 Intel a solid advantage over the AMD laptops for Blender GPU rendering, though it cannot match the higher-tier Intel graphics configuration.
| Blender 5.1.1 GPU — samples/min (higher is better) | Dell Pro 5 16 (AMD Ryzen AI 9 HX PRO 470 12C) | Dell Pro 7 14 (AMD Ryzen AI 9 HX PRO 470 12C) | Dell Pro 7 14 (Intel Core Ultra 7 366H 16C) | Dell Pro 5 14 (Intel Core Ultra X7 368H 16C) |
|---|---|---|---|---|
| Monster | 129.8 | 140.9 | 253.6 | 366.6 |
| Junkshop | 103.1 | 122.0 | 189.3 | 312.6 |
| Classroom | 91.1 | 105.6 | 153.0 | 244.4 |
V-Ray and LuxMark
LuxMark measures GPU compute performance by rendering complex scenes through OpenCL, while V-Ray GPU measures how quickly the graphics processor can render a scene using the V-Ray engine. Higher scores are better.
The Dell Pro 7 14 Intel produced mixed results in V-Ray and LuxMark. Its LuxMark Hall score of 2,168 was the best outside the Pro 5 14 Intel and narrowly ahead of both AMD systems, but its Food score of 880 placed it last. The same was true in V-Ray, where its result of 775 vpaths was slightly behind the Pro 7 14 AMD and around 16% below the Pro 5 14 Intel. Overall, its standard Intel Graphics provided enough compute performance to compete with the Radeon 890M in some workloads, but results varied considerably by application.
| GPU Compute (higher is better) | Dell Pro 5 16 (AMD Ryzen AI 9 HX PRO 470 12C) | Dell Pro 7 14 (AMD Ryzen AI 9 HX PRO 470 12C) | Dell Pro 7 14 (Intel Core Ultra 7 366H 16C) | Dell Pro 5 14 (Intel Core Ultra X7 368H 16C) |
|---|---|---|---|---|
| LuxMark — Hall | 2,125 | 2,042 | 2,168 | 3,287 |
| LuxMark — Food | 982 | 1,050 | 880 | 1,585 |
| V-Ray GPU (vpaths) | 861 | 784 | 775 | 919 |
SPECviewperf 15
SPECviewperf 15 measures graphics performance using viewsets derived from professional applications in CAD, 3D modeling, rendering, engineering, and medical visualization. Higher scores are better, although performance can vary considerably between applications and graphics architectures.
The Dell Pro 7 14 Intel struggled throughout SPECviewperf 15, posting the lowest result in most of the professional visualization viewsets. The largest gaps appeared in CAD-focused tests such as CATIA, Creo, Energy, Siemens NX, and SolidWorks, where the Radeon 890M systems were often several times faster. It was more competitive in Enscape, Maya, and Unreal Engine, but the Pro 5 14 Intel also finished well ahead in those tests. These results make the Pro 7 14 Intel not a great fit for users who regularly work in CAD, engineering, or other GPU-heavy professional applications.
| SPECviewperf 15 (higher is better) | Dell Pro 5 16 (AMD Ryzen AI 9 HX PRO 470 12C) | Dell Pro 7 14 (AMD Ryzen AI 9 HX PRO 470 12C) | Dell Pro 7 14 (Intel Core Ultra 7 366H 16C) | Dell Pro 5 14 (Intel Core Ultra X7 368H 16C) |
|---|---|---|---|---|
| 3dsmax-08 | 23.21 | 24.69 | 9.58 | 20.21 |
| blender-01 | 19.89 | 20.85 | 9.11 | 21.19 |
| catia-07 | 20.16 | 21.21 | 5.27 | 10.27 |
| creo-04 | 44.27 | 45.70 | 18.27 | 32.53 |
| energy-04 | 25.39 | 25.08 | 3.68 | 10.78 |
| enscape-01 | 8.02 | 8.29 | 6.22 | 14.28 |
| maya-07 | 48.67 | 53.64 | 49.54 | 82.42 |
| medical-04 | 65.45 | 60.50 | 9.91 | 22.96 |
| snx-05 | 51.67 | 51.84 | 37.74 | 46.22 |
| solidworks-08 | 33.12 | 32.02 | 11.86 | 23.60 |
| unreal_engine-01 | 26.61 | 26.29 | 21.36 | 38.77 |
SPECworkstation 4
SPECworkstation 4 measures workstation performance across CPU, graphics, storage, AI, product design, engineering, financial services, and other professional workloads. Higher scores are better, while DNF means the system did not complete every workload required for that category.
The Dell Pro 7 14 Intel produced a more balanced set of results in SPECworkstation 4, scoring 1.08 in the CPU subsystem and 1.68 in storage, finishing close to or ahead of most of the group. Graphics was its weakest area at 0.82, well behind both Radeon 890M systems and roughly half the score of the Pro 5 14 Intel. It also placed last in AI and Machine Learning, Energy, and Life Sciences, and tied the Pro 5 14 at the bottom of Financial Services, though it was the only system in the group to complete the Media and Entertainment workload, posting a 1.16 there. The strong storage score helped, but weaker graphics performance limited it across many broader workstation workloads.
| SPECworkstation 4 (higher is better) | Dell Pro 5 16 (AMD Ryzen AI 9 HX PRO 470 12C) | Dell Pro 7 14 (AMD Ryzen AI 9 HX PRO 470 12C) | Dell Pro 7 14 (Intel Core Ultra 7 366H 16C) | Dell Pro 5 14 (Intel Core Ultra X7 368H 16C) |
|---|---|---|---|---|
| CPU (subsystem) | 1.09 | 1.00 | 1.08 | 1.19 |
| Graphics (subsystem) | 2.36 | 2.41 | 0.82 | 1.68 |
| Storage (subsystem) | 0.89 | 0.55 | 1.68 | 1.76 |
| AI & Machine Learning | 1.37 | 1.29 | 1.18 | 1.36 |
| Energy | 1.24 | 1.13 | 0.90 | 1.18 |
| Financial Services | 0.98 | 0.88 | 0.78 | 0.78 |
| Life Sciences | 1.34 | 1.08 | 1.04 | 1.34 |
| Media & Entertainment | DNF | DNF | 1.16 | DNF |
| Product Design | 1.34 | 1.18 | 1.41 | 1.64 |
| Productivity & Development | 0.78 | 0.72 | 1.04 | 1.10 |
Storage Performance
3DMark Storage measures how an SSD performs during gaming-related tasks such as loading games, installing software, saving progress, and moving game files. Blackmagic Disk Speed Test measures an SSD’s sequential read and write speeds using large media files.
The SK hynix PCB01 in the Dell Pro 7 14 Intel delivered some of the strongest storage results in the group, leading 3DMark Storage with a score of 3,259. It also reached 8,398.6 MB/s read and 8,934.5 MB/s write in the Blackmagic Disk Speed Test, giving it the fastest write result and placing it just behind the Pro 5 14 Intel in sequential reads. Compared with the Pro 7 14 AMD, the Intel model was more than three times faster in 3DMark Storage and more than doubled its sequential write speed.
| Storage (higher is better) | Dell Pro 5 16 (AMD Ryzen AI 9 HX PRO 470 12C) | Dell Pro 7 14 (AMD Ryzen AI 9 HX PRO 470 12C) | Dell Pro 7 14 (Intel Core Ultra 7 366H 16C) | Dell Pro 5 14 (Intel Core Ultra X7 368H 16C) |
|---|---|---|---|---|
| 3DMark Storage (score) | 2,477 | 894 | 3,259 | 3,144 |
| Blackmagic Disk — Read (MB/s) | 4,758.0 | 3,103.4 | 8,398.6 | 8,609.6 |
| Blackmagic Disk — Write (MB/s) | 5,166.5 | 4,034.3 | 8,934.5 | 8,747.3 |
Battery Life
The PCMark 10 Modern Office battery test repeatedly runs common office tasks until the battery reaches the test’s cutoff point. Longer runtimes are better.
The Dell Pro 7 14 Intel lasted 26 hours and 18 minutes in the PCMark 10 Modern Office battery test, only 30 minutes behind the Pro 5 14 Intel and nearly seven hours longer than the Pro 7 14 AMD. It also outlasted the larger Pro 5 16 AMD by almost 11 hours. This was one of the best results in the review and a major advantage for anyone who regularly works away from a power outlet.
| Battery — PCMark 10 Modern Office (higher is better) | Dell Pro 5 16 (AMD Ryzen AI 9 HX PRO 470 12C) | Dell Pro 7 14 (AMD Ryzen AI 9 HX PRO 470 12C) | Dell Pro 7 14 (Intel Core Ultra 7 366H 16C) | Dell Pro 5 14 (Intel Core Ultra X7 368H 16C) |
|---|---|---|---|---|
| Runtime | 15h 22m | 19h 28m | 26h 18m | 26h 48m |
Conclusion
The Dell Pro 7 14 Intel is the laptop Dell built for the road, and judged on those terms, it delivers. It shares the thinnest chassis in Dell’s commercial line with its AMD twin at 2.80 pounds and 16.45 mm, ran 26 hours and 18 minutes in PCMark 10 Modern Office, nearly seven hours longer than that twin, and posted the best overall PCMark 10 score of the group at 8,438 with the top Digital Content Creation subscore. Its Gen5 SSD led 3DMark Storage at 3,259 and read at nearly 8.4GB/s, and Intel vPro brings AMT out-of-band access, Hardware Shield, Threat Detection Technology, and SIPP, a management depth the AMD pair cannot match, though the Pro 5 14 shares it. For a workday of documents, browsers, video calls, and airports, this is the strongest machine in the group.
Sustained performance is the main trade-off, with the thin chassis and Core Ultra 7 366H yielding the lowest multi-core scores among the four systems in Cinebench and 7-Zip. Its integrated Intel Graphics also fell well behind the Radeon 890M systems in most SPECviewperf CAD tests. The Pro 5 14 Intel makes the comparison even harder, since it costs $108 less as configured while offering the higher-tier Core Ultra X7 368H and Arc B390 graphics, giving it a large advantage in most GPU and local AI workloads. The Pro 5 16 AMD is also $952 less and is the stronger option for long CPU-heavy workloads, though it is larger, heavier, and lasts considerably less time on battery.
That leaves the Pro 7 14 Intel best suited to fleets that rank mobility, endurance, and manageability ahead of performance per dollar. Buyers who flip those priorities have better answers one shelf over: the Pro 5 14 Intel for GPU and AI work at $108 less, or the Pro 5 16 AMD for sustained CPU throughput at $952 less. For the executive who lives out of a bag and an IT team that has to manage that laptop from three time zones away, this is the one to pick.
Product Page: Dell Pro 7 14
Leaderboard: The Dell Pro 7 14 Intel is our Best Overall Business Laptop on the Best Business Laptops leaderboard.


 Amazon