

Dell sent us four Pro laptops this cycle, covering two sizes, two product tiers, and both AMD and Intel platforms. The two Pro 5 models approach the business-laptop formula from different directions: the Pro 5 16 AMD uses a larger chassis, replaceable DDR5 memory, and the Ryzen AI 9 HX PRO 470, while the compact Pro 5 14 Intel combines a Core Ultra X7 368H with fast LPCAMM2 memory and Arc B390 graphics. Dell then moves up to the thinner Pro 7 14 chassis with a choice of Intel or AMD processors. The AMD model reviewed here features the same 12-core, 24-thread Ryzen chip and 55 TOPS NPU as the Pro 5 16, but pairs it with 64GB of LPDDR5x-8533 memory, Radeon 890M graphics, a 1TB SSD, and a 14-inch WUXGA display.
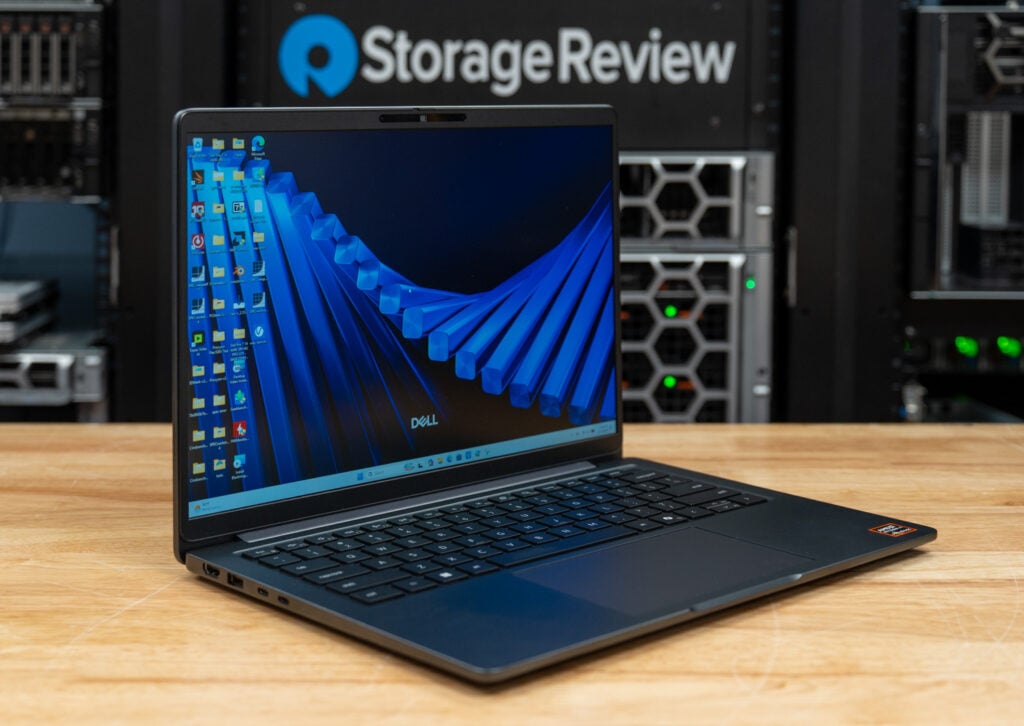
Putting the same processor into two very different laptops gives us a useful look at how chassis size and memory choice affect performance. The Pro 7 14’s faster memory gives the Radeon 890M and local AI workloads an advantage over the Pro 5 16’s DDR5-5600, allowing the smaller laptop to lead the Blender tests, the AI Computer Vision GPU test, and all four AI text-generation workloads. Longer all-core workloads favor the larger Pro 5 16, which finishes Cinebench R23 multi-core 24% ahead with the same processor. Battery life reached 19 hours and 28 minutes, several hours beyond the Pro 5 16 but well short of the two Intel 14-inch systems. Our unit also had the slowest SSD of the four, with its Samsung BM9C1a trailing the Gen5 drives in the Intel laptops by a wide margin.
Beyond those performance differences, the Pro 7 14 AMD is built primarily for businesses deploying and managing a fleet of notebooks. AMD PRO provides DASH and AIM-T management features, while Dell adds SafeBIOS, SafeID, quantum-resistant BIOS verification, and 36 months of ProSupport Next Business Day Onsite service. Our configuration carries a $5,377 single-unit price on Dell.com, although volume buyers will typically pay less. Its $729 premium over the Pro 5 16 buys a thinner and lighter design, much faster memory, stronger integrated graphics, and better AI text-generation performance than the larger AMD model.
Design and Build
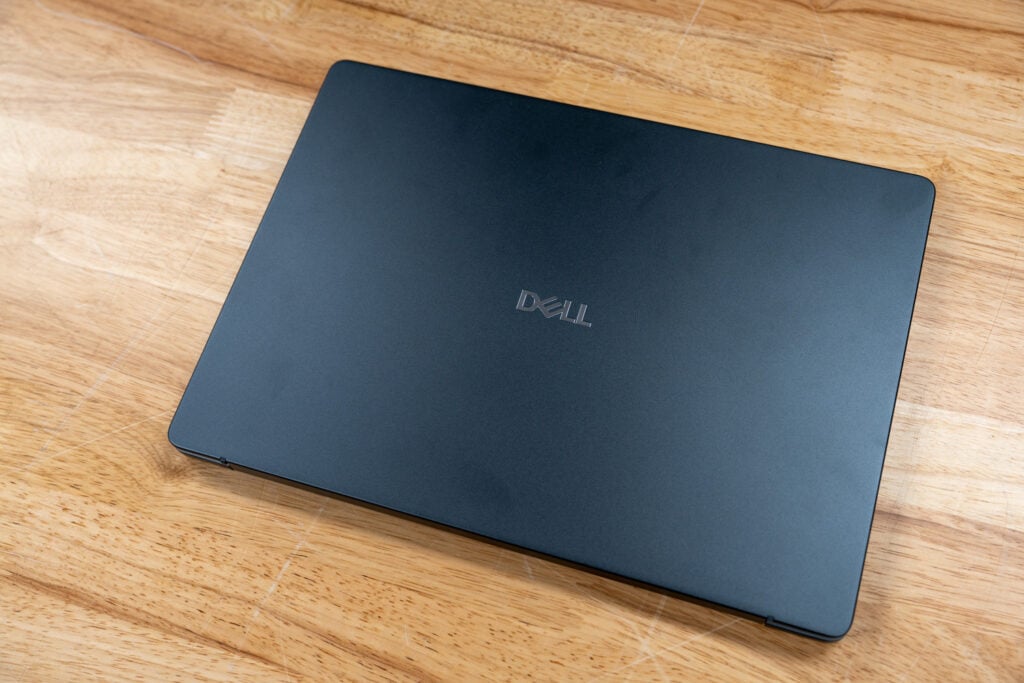
The Dell Pro 7 14 uses a compact, dark gray chassis that looks appropriate for a business laptop without feeling plain. At 315.5 × 226 mm, it takes up little space in a bag. The front measures 10.3 mm thick and the maximum thickness reaches 16.45 mm. Dell lists a starting weight of 2.80 pounds, though the final weight varies by configuration. The lid and palmrest have a smooth finish, and the magnesium bottom door keeps the system light while giving the chassis a solid feel.
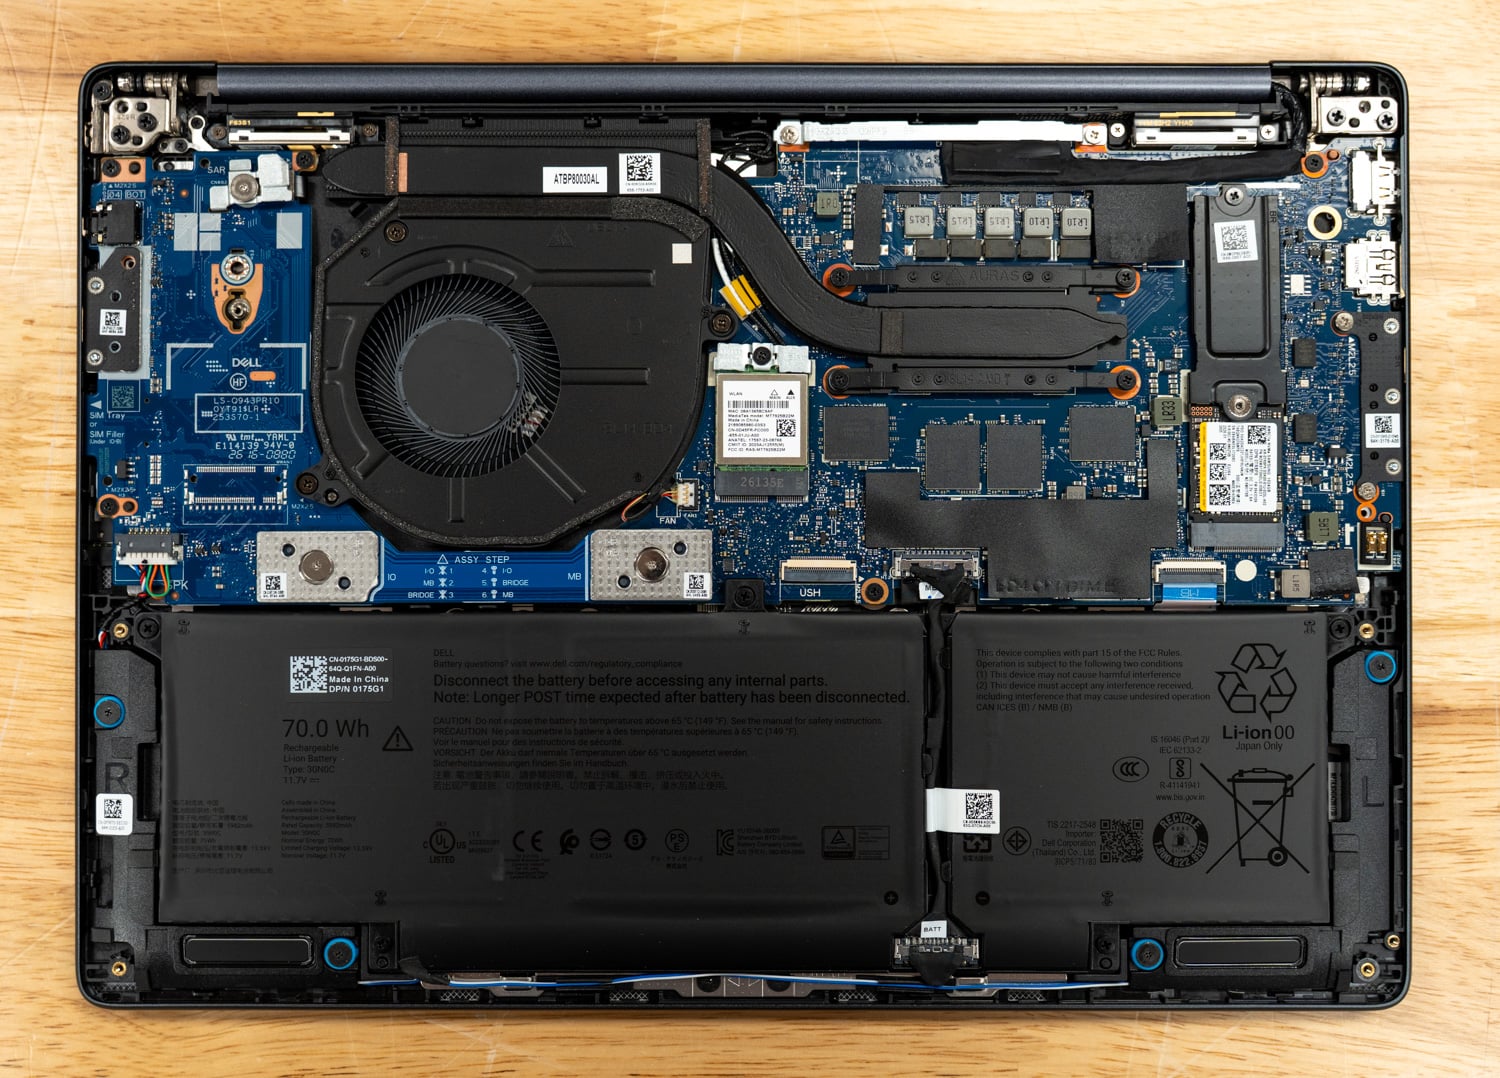
 Removing the bottom panel exposes a single cooling fan, the heat-pipe assembly, wireless card, M.2 SSD, and the large 70Wh battery. The LPDDR5x memory is soldered to the motherboard and cannot be upgraded, but the SSD, wireless card, and battery are accessible for service or replacement. Dell also uses modular components in several areas, making common repairs less involved than on many thin systems. The customer-replaceable battery is especially useful for companies planning to keep these laptops deployed for several years.
Display and Input
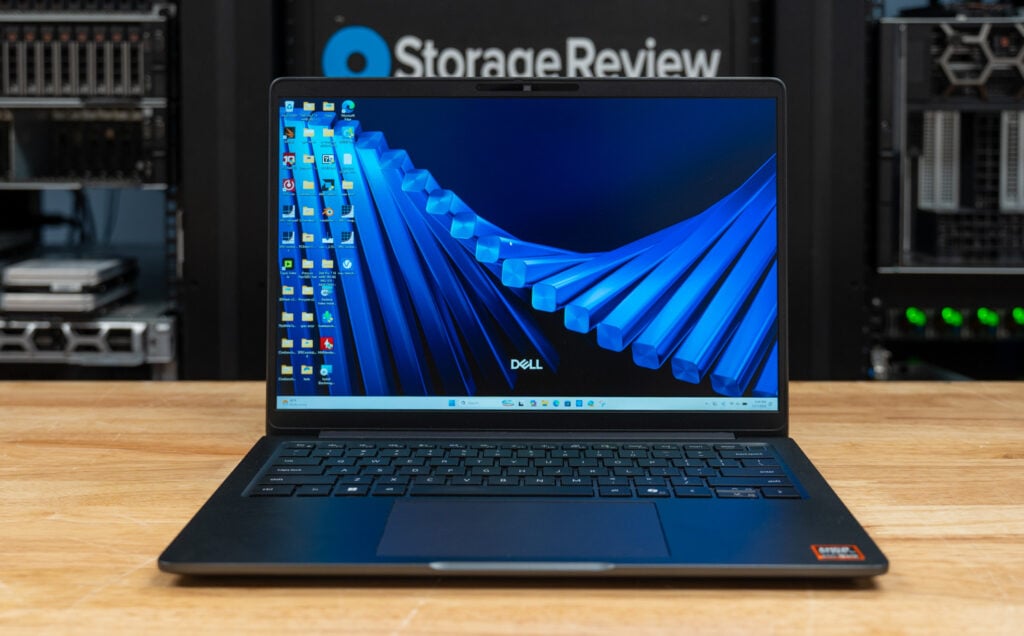
The 14-inch WUXGA display in our review build has a 1920 x 1200 resolution, giving it a taller 16:10 aspect ratio that provides more vertical space for documents, spreadsheets, and web pages. It is a non-touch panel with variable refresh rate support, 500-nit brightness, full sRGB coverage, an anti-glare finish, and Dell’s ComfortView Plus (Low Blue Light) certification. The super-low-power panel also helps battery life. Our unit lasted 19 hours and 28 minutes in the PCMark 10 Modern Office test.
Dell pairs the display with an 8MP infrared camera that supports Windows Hello facial recognition, presence detection, temporal noise reduction, and a physical camera shutter. The Mini-LED backlit keyboard uses the available width well, with full-sized primary keys and a familiar layout that does not require much adjustment. There is no numeric keypad on this 14-inch model, but the centered keyboard and large precision touchpad leave plenty of room for everyday work. The display bezels are reasonably narrow along the sides, although the camera hardware requires a slightly thicker section along the top.
Ports and Connectivity
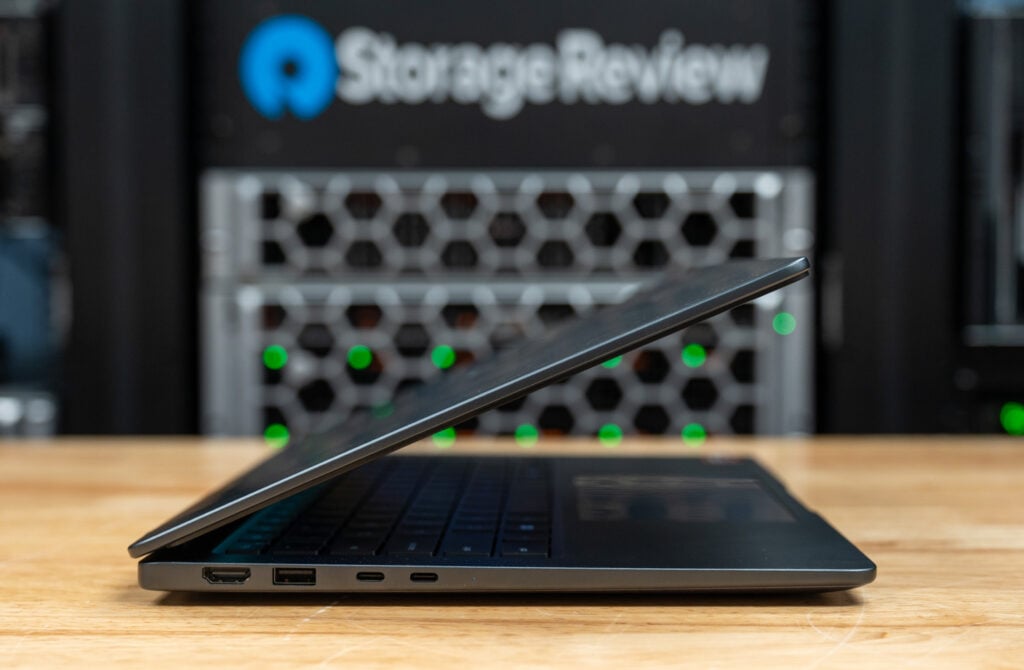
Port selection is good for a laptop this thin, with our review build including three USB Type-C connections. The left side has two Thunderbolt 4 ports with USB4, DisplayPort 2.1, and Power Delivery, plus HDMI 2.1 and a USB 3.2 Gen 1 Type-A port. The right side adds a third USB Type-C port with USB 3.2 Gen2x2 (20 Gbps), DisplayPort 1.4, and Power Delivery, along with a headset jack and wedge-shaped security slot. Dell offers that third Type-C connection as an alternative to a second USB Type-A port with PowerShare, so the exact layout depends on the configuration.
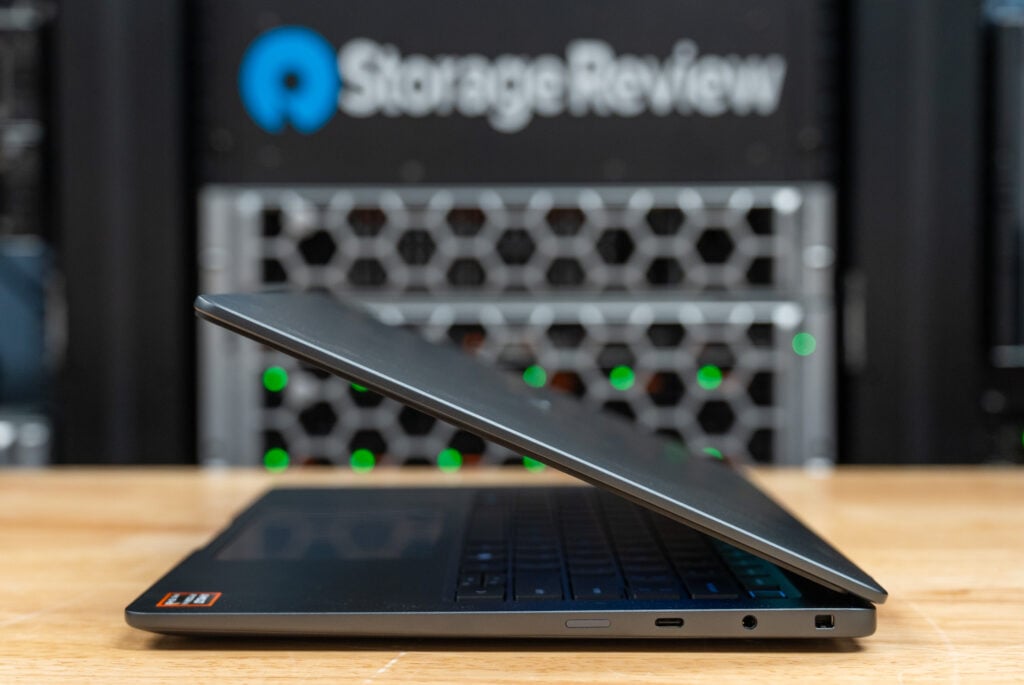
It also includes MediaTek Wi-Fi 7 MT7925 and Bluetooth for wireless connections. Charging is done via USB-C using the included 65W adapter, which can be connected on either side of the laptop. The 70Wh battery supports ExpressCharge and ExpressCharge Boost when paired with a 100W adapter, which Dell offers as an option. With the included 65W adapter, standard charging applies.
Security and Manageability
The Dell Pro 7 14 is built for managed business environments, and much of its value comes from features not shown in benchmark charts. AMD PRO manageability includes DASH and AMD Integrated Management Technology, or AIM-T, giving IT departments tools to monitor, configure, and support systems remotely. Dell Management Portal can also work alongside Microsoft Intune, allowing administrators to manage Dell-specific settings through an existing cloud-based device-management setup.
Dell adds several layers of hardware and firmware protection through SafeBIOS, SafeID, and Trusted Device. SafeBIOS monitors BIOS settings and detects unexpected changes, while SafeID keeps credentials in dedicated hardware away from the operating system. Quantum-resistant BIOS verification protects firmware updates against current and emerging cryptographic threats. Our review build also has a fingerprint reader, and the infrared camera provides another Windows Hello sign-in option.
Our configuration comes with Dell ProSupport and next-business-day onsite service for 36 months following remote diagnosis. If Dell determines that hardware needs to be replaced, a technician can be sent to the customer’s location, reducing the time an employee is left without their primary laptop.
Dell Pro 7 14 (AMD) Specifications
| Specification | Dell Pro 7 14 (P714265) |
|---|---|
| Platform Overview | |
| Processor | AMD Ryzen AI 9 HX PRO 470 12 cores / 24 threads, up to 5.2 GHz 55 TOPS NPU (Copilot+ PC) |
| Graphics | AMD Radeon 890M (integrated) |
| Operating System | Windows 11 Pro (Copilot+ PC) |
| Memory and Storage | |
| Memory | 64 GB LPDDR5x-8533, dual-channel, onboard |
| Storage | 1 TB SSD (Samsung BM9C1a) |
| Display and Camera | |
| Display | 14″ WUXGA (1920 x 1200), non-touch, VRR 500 nits, 100% sRGB, anti-glare, Low Blue Light, super-low-power |
| Camera | 8 MP + IR (Windows Hello) |
| Connectivity and Input | |
| Wireless | MediaTek Wi-Fi 7 MT7925, Bluetooth |
| Keyboard | English (US) Mini-LED backlit |
| Ports | 2x Thunderbolt 4 (USB4, DisplayPort 2.1, Power Delivery); 1x USB-C 3.2 Gen 2×2 (DisplayPort 1.4, Power Delivery); 1x USB 3.2 Gen 1 Type-A; HDMI 2.1; headset jack; wedge-shaped lock slot. Configurations without the third USB-C port include a second USB Type-A port with PowerShare instead. |
| Security and Manageability | |
| Security | Fingerprint reader Dell SafeBIOS, SafeID, Trusted Device Quantum-resistant BIOS verification |
| Manageability | AMD PRO manageability, AMD DASH, AMD Integrated Management Technology Dell Management Portal, Microsoft Intune |
| Power and Physical | |
| Battery | 3-cell, 70 Wh, Long Life Cycle, ExpressCharge / ExpressCharge Boost |
| Power Adapter | 65 W USB-C |
| Chassis | Aluminum (Top Cover, Palmrest), Lightweight Magnesium (Bottom Cover) |
| Weight / Dimensions | From 2.80 lb; 315.5 x 226 mm; 10.3 to 16.45 mm thick. |
| Warranty and Pricing | |
| Service | Dell ProSupport, Next Business Day Onsite, 36 months |
| Base Price | $2,279 |
| Price as Tested | $5,377 (Dell.com single-unit, no discount) |
Performance Testing
To see how the Dell Pro 7 14 AMD compares with Dell’s current commercial lineup, we tested it alongside the larger Pro 5 16 AMD and both 14-inch Intel models. All four laptops were tested using our standard power profile across general productivity, CPU rendering, GPU compute, professional visualization, storage, AI, and battery workloads.
The Pro 7 14 and Pro 5 16 use the same Ryzen AI 9 HX PRO 470 and Radeon 890M, but the smaller model has faster LPDDR5x-8533 memory, giving it an advantage in several integrated graphics, memory-heavy, and AI tests. Its thinner chassis limits sustained multi-core work, giving the Pro 5 16 more room. Comparisons with the Intel laptops vary by application. AMD performs better across many SPECviewperf CAD viewsets, while Intel’s Arc graphics lead in Blender GPU rendering.
Test Systems
| Specification | Dell Pro 5 16 (AMD) | Dell Pro 7 14 (AMD) | Dell Pro 7 14 (Intel) | Dell Pro 5 14 (Intel) |
|---|---|---|---|---|
| CPU | Ryzen AI 9 HX PRO 470 (12C/24T) | Ryzen AI 9 HX PRO 470 (12C/24T) | Core Ultra 7 366H (16C) | Core Ultra X7 368H (16C) |
| GPU | Radeon 890M | Radeon 890M | Intel Graphics | Intel Arc B390 |
| Memory | 64 GB DDR5-5600 | 64 GB LPDDR5x-8533 | 64 GB LPDDR5x-8533 | 64 GB LPCAMM2-8533 |
| Storage | SanDisk PC SN5100S 1 TB | Samsung BM9C1a 1 TB | SK hynix PCB01 1 TB | SK hynix PCB01 1 TB |
| Display | 16″ WQXGA | 14″ WUXGA | 14″ WUXGA | 14″ WUXGA |
| Price as Tested | $4,648 | $5,377 | $5,600 | $5,492 |
UL Procyon: AI Computer Vision
The Procyon AI Computer Vision Benchmark measures AI inference performance across CPUs, GPUs, and dedicated accelerators using a range of state-of-the-art neural networks. It evaluates tasks such as image classification, object detection, segmentation, and super-resolution using models including MobileNet V3, Inception V4, YOLO V3, DeepLab V3, Real ESRGAN, and ResNet 50. Tests are run on multiple inference engines, including NVIDIA TensorRT, Intel OpenVINO, Qualcomm SNPE, Microsoft Windows ML, and Apple Core ML, providing a broad view of hardware and software efficiency. Results are reported for float- and integer-optimized models, providing a consistent, practical measure of machine vision performance for professional workloads.
The Dell Pro 7 14 AMD scored 243 overall in the UL Procyon AI Computer Vision GPU benchmark, making it the second-fastest system in the comparison. It outperformed the Dell Pro 5 16 AMD’s score of 214 by roughly 14% and held an 18.5% lead over the Dell Pro 7 14 Intel, which posted 205. The only system ahead was the Dell Pro 5 14 Intel at 398, a substantial 64% advantage. Despite not taking the top position, the Pro 7 14 AMD demonstrated a strong showing for an ultraportable business notebook, particularly given its balanced performance across the suite’s diverse machine vision workloads.
On the CPU side, the Dell Pro 7 14 AMD recorded an overall score of 77, trailing the Dell Pro 5 16 AMD’s 91 and both Intel configurations, which scored 121 and 119, respectively. This placed the system approximately 15% behind the larger AMD notebook and roughly 36% behind the leading Intel Pro 7 14. While Intel’s software optimizations continue to provide an advantage in CPU-based inference, AMD’s GPU-accelerated results in the Pro 7 14 paint a much more competitive picture, highlighting the importance of leveraging modern AI accelerators for professional computer vision applications.
| CPU Results (average time in ms) | Dell Pro 5 16 (AMD Ryzen AI 9 HX PRO 470 12C) | Dell Pro 7 14 (AMD Ryzen AI 9 HX PRO 470 12C) | Dell Pro 7 14 (Intel Core Ultra 7 366H 16C) | Dell Pro 5 14 (Intel Core Ultra X7 368H 16C) |
|---|---|---|---|---|
| AI Computer Vision Overall Score | 91 | 77 | 121 | 119 |
| MobileNet V3 | 1.57 ms | 1.79 ms | 1.24 ms | 1.09 ms |
| ResNet 50 | 13.64 ms | 16.46 ms | 11.57 ms | 10.11 ms |
| Inception V4 | 40.43 ms | 51.10 ms | 34.01 ms | 29.77 ms |
| DeepLab V3 | 69.73 ms | 74.74 ms | 37.98 ms | 50.18 ms |
| YOLO V3 | 99.38 ms | 122.35 ms | 81.22 ms | 112.64 ms |
| REAL-ESRGAN | 4,504.35 ms | 5,383.21ms | 3,163.45 ms | 2,884.51 ms |
| GPU Results (average time in ms) | Dell Pro 5 16 (AMD Ryzen AI 9 HX PRO 470 12C) | Dell Pro 7 14 (AMD Ryzen AI 9 HX PRO 470 12C) | Dell Pro 7 14 (Intel Core Ultra 7 366H 16C) | Dell Pro 5 14 (Intel Core Ultra X7 368H 16C) |
|---|---|---|---|---|
| AI Computer Vision Overall Score | 214 | 243 | 205 | 398 |
| MobileNet V3 | 1.56 ms | 1.17 ms | 1.04 ms | 0.84 ms |
| ResNet 50 | 8.76 ms | 7.93 ms | 6.52 ms | 2.94 ms |
| Inception V4 | 22.46 ms | 20.06 ms | 20.72 ms | 8.38 ms |
| DeepLab V3 | 38.40 ms | 34.04 ms | 26.53 ms | 17.54 ms |
| YOLO V3 | 23.56 ms | 21.92 ms | 43.07 ms | 19.14 ms |
| REAL-ESRGAN | 570.35 ms | 536.81 ms | 1,309.49 ms | 562.87 ms |
UL Procyon: AI Text Generation
The Procyon AI Text Generation Benchmark streamlines LLM performance testing by providing a concise, consistent evaluation method. It enables repeated testing across multiple LLM models while minimizing the complexity of large models and the number of variables. Developed with AI hardware leaders, it optimizes the use of local AI accelerators to deliver more reliable, efficient performance assessments.
The Dell Pro 7 14 AMD consistently improved upon the larger Dell Pro 5 16 AMD across all UL Procyon AI Text Generation workloads, highlighting the benefits of its tuning and implementation of the Ryzen AI 9 HX PRO 470 platform. In the Phi test, the Pro 7 14 AMD achieved an overall score of 427, a 15% improvement over the Pro 5 16’s 371. Similar gains were observed in Mistral (389 versus 346, +12%), Llama3 (345 versus 306, +13%), and Llama2 (367 versus 329, +12%). It also delivered lower time-to-first-token metrics and higher token generation rates across the board, making it the stronger of the two AMD-based systems for local LLM inference.
Compared to its Intel counterparts, however, the Dell Pro 7 14 AMD trailed in every workload. The Intel-based Dell Pro 7 14 posted scores of 689, 525, 509, and 530 in Phi, Mistral, Llama3, and Llama2, respectively, representing advantages ranging from 35% to 61% over the AMD model. The Dell Pro 5 14 widened the gap further, leading the group with scores of 904 in Phi, 716 in Mistral, 708 in Llama3, and 641 in Llama2. Intel’s systems also substantially reduced time-to-first-token, with the Pro 5 14 reaching just 1.158 seconds in Phi compared to 4.286 seconds on the Pro 7 14 AMD, while simultaneously delivering higher sustained token throughput.
| UL Procyon: AI Text Generation | Dell Pro 5 16 (AMD Ryzen AI 9 HX PRO 470 12C) | Dell Pro 7 14 (AMD Ryzen AI 9 HX PRO 470 12C) | Dell Pro 7 14 (Intel Core Ultra 7 366H 16C) | Dell Pro 5 14 (Intel Core Ultra X7 368H 16C) |
|---|---|---|---|---|
| Phi | ||||
| Phi Overall Score | 371 | 427 | 689 | 904 |
| Phi Output Time To First Token | 5.052 s | 4.286 s | 1.843 s | 1.158 s |
| Phi Output Tokens Per Second | 27.163 tokens/s | 30.492 tokens/s | 34.172 tokens/s | 36.952 tokens/s |
| Phi Overall Duration | 135.343 s | 118 s | 92.273 s | 81.304 s |
| Mistral | ||||
| Mistral Overall Score | 346 | 389 | 525 | 716 |
| Mistral Output Time To First Token | 6.929 s | 6.060 s | 3.778 s | 2.195 s |
| Mistral Output Tokens Per Second | 18.174 tokens/s | 20.125 tokens/s | 22.843 tokens/s | 24.724 tokens/s |
| Mistral Overall Duration | 196.185 s | 176 s | 143.831 s | 123.773 s |
| Llama3 | ||||
| Llama3 Overall Score | 306 | 345 | 509 | 708 |
| Llama3 Output Time To First Token | 6.518 s | 5.707s | 2.992 s | 1.657 s |
| Llama3 Output Tokens Per Second | 15.050 tokens/s | 16.725 tokens/s | 19.104 tokens/s | 20.421 tokens/s |
| Llama3 Overall Duration | 224.176 s | 199 s | 161.290 s | 142.814 s |
| Llama2 | ||||
| Llama2 Overall Score | 329 | 367 | 530 | 641 |
| Llama2 Output Time To First Token | 11.089 s | 10.307 s | 5.412 s | 4.082 s |
| Llama2 Output Tokens Per Second | 8.878 tokens/s | 10.260 tokens/s | 11.230 tokens/s | 12.397 tokens/s |
| Llama2 Overall Duration | 381.464 s | 334 s | 278.109 s | 245.572 s |
UL Procyon: AI Image Generation
The Procyon AI Image Generation Benchmark provides a consistent and accurate method for measuring AI inference performance across a range of hardware, from low-power NPUs to high-end GPUs. It includes three tests: Stable Diffusion XL (FP16) for high-end GPUs, Stable Diffusion 1.5 (FP16) for moderately powerful GPUs, and Stable Diffusion 1.5 (INT8) for low-power devices. The benchmark uses the optimal inference engine for each system, ensuring fair and comparable results.
The Dell Pro 7 14 AMD delivered largely middle-of-the-pack results in the UL Procyon AI Image Generation benchmark, though it remained highly competitive with the other non-leading systems. In Stable Diffusion 1.5 (FP16), it posted an overall score of 247 with an image generation speed of 25.3 seconds per image, placing it about 4% behind the Dell Pro 7 14 Intel (258) and roughly 3% behind the Dell Pro 5 16 AMD (255). The Dell Pro 5 14 was the clear outlier, however, producing a score of 635 and generating images approximately 2.6 times faster at 9.8 seconds per image.
Stable Diffusion 1.5 (INT8) told a similar story. The Dell Pro 7 14 AMD scored 3,521, essentially tying the Dell Pro 5 16 AMD (3,598) and Dell Pro 7 14 Intel (3,575), with less than a 3% spread separating the three systems. Image generation speeds were nearly identical as well, ranging from 8.69 to 8.87 seconds per image. Once again, the Dell Pro 5 14 established a substantial lead, posting a score of 7,693 and cutting generation times to just 4.06 seconds per image, more than twice as fast as the rest of the field.
| UL Procyon: AI Image Generation | Dell Pro 5 16 (AMD Ryzen AI 9 HX PRO 470 12C) | Dell Pro 7 14 (AMD Ryzen AI 9 HX PRO 470 12C) | Dell Pro 7 14 (Intel Core Ultra 7 366H 16C) | Dell Pro 5 14 (Intel Core Ultra X7 368H 16C) |
|---|---|---|---|---|
| Stable Diffusion 1.5 (FP16) | ||||
| Stable Diffusion 1.5 (FP16) – Overall Score | 255 | 247 | 258 | 635 |
| Stable Diffusion 1.5 (FP16) – Overall Time | 391.577 s | 404.455 s | 386.614 s | 157.296 s |
| Stable Diffusion 1.5 (FP16) – Image Generation Speed | 24.474 s/image | 25.278 s/image | 24.163 s/image | 9.831 s/image |
| Stable Diffusion 1.5 (INT8) | ||||
| Stable Diffusion 1.5 (INT8) – Overall Score | 3,598 | 3,521 | 3,575 | 7,693 |
| Stable Diffusion 1.5 (INT8) – Overall Time | 69.478 s | 70.985 s | 69.911 s | 32.495 s |
| Stable Diffusion 1.5 (INT8) – Image Generation Speed | 8.685 s/image | 8.873 s/image | 8.739 s/image | 4.062 s/image |
| Stable Diffusion XL (FP16) | ||||
| Stable Diffusion XL (FP16) – Overall Score | 173 | 177 | 268 | 646 |
| Stable Diffusion XL (FP16) – Overall Time | 3,448.478 s | 3,379.388 s | 2,230.563 s | 928.747 s |
| Stable Diffusion XL (FP16) – Image Generation Speed | 215.530 s/image | 211.212 s/image | 139.410 s/image | 58.047 s/image |
PCMark 10
PCMark 10 measures general system performance across everyday work such as web browsing, video conferencing, spreadsheets, writing, photo editing, and rendering. Higher scores are better.
The Dell Pro 7 14 AMD scored 8,237 overall in PCMark 10, putting it within 2.5% of the Pro 7 14 Intel’s leading score of 8,438. The four laptops were close in Essentials, where the AMD model scored 10,783, but it moved into first place in Productivity with 14,366. Digital Content Creation reached 9,792, only 60 points behind the larger Pro 5 16 but 818 points behind the Pro 7 14 Intel. For common office work, the Pro 7 14 AMD performed much like the other Dell models and had the best Productivity result of the group.
| PCMark 10 (higher is better) | Dell Pro 5 16 (AMD Ryzen AI 9 HX PRO 470 12C) | Dell Pro 7 14 (AMD Ryzen AI 9 HX PRO 470 12C) | Dell Pro 7 14 (Intel Core Ultra 7 366H 16C) | Dell Pro 5 14 (Intel Core Ultra X7 368H 16C) |
|---|---|---|---|---|
| Overall | 8,268 | 8,237 | 8,438 | 7,945 |
| Essentials | 10,870 | 10,783 | 10,981 | 10,751 |
| Productivity | 14,322 | 14,366 | 13,992 | 13,821 |
| Digital Content Creation | 9,852 | 9,792 | 10,610 | 9,158 |
Geekbench 6
Geekbench 6 measures processor performance using a mix of common tasks, with separate scores for single-core and multi-core workloads. Higher scores are better.
The Dell Pro 7 14 AMD scored 2,888 in Geekbench 6 single-core, keeping it within a relatively narrow range of 127 points across all four laptops. Its multi-core score of 14,768 was 420 points higher than the larger Pro 5 16, despite both systems using the Ryzen AI 9 HX PRO 470. The two 16-core Intel models were faster in this portion of the test, scoring just under 17,000, but the Pro 7 14 AMD still performed well for a thin 14-inch laptop.
| Geekbench 6 (higher is better) | Dell Pro 5 16 (AMD Ryzen AI 9 HX PRO 470 12C) | Dell Pro 7 14 (AMD Ryzen AI 9 HX PRO 470 12C) | Dell Pro 7 14 (Intel Core Ultra 7 366H 16C) | Dell Pro 5 14 (Intel Core Ultra X7 368H 16C) |
|---|---|---|---|---|
| Single-Core | 2,989 | 2,888 | 2,862 | 2,968 |
| Multi-Core | 14,348 | 14,768 | 16,787 | 16,874 |
Cinebench R23 and 2024
Cinebench measures how quickly the processor can render a complex scene, with separate tests for single-core and multi-core performance. Higher scores are better.
The Dell Pro 7 14 AMD scored 1,946 in Cinebench R23 single-core and 15,173 in multi-core, while the larger Pro 5 16 finished about 24% ahead in the multi-core test. Since both laptops use the same Ryzen AI 9 HX PRO 470, the additional thermal room available in the 16-inch model likely contributed to its higher score. Cinebench 2024 followed a similar pattern, with the Pro 7 14 AMD scoring 105 in single-core and 847 in multi-core, compared with 119 and 1,055 for the Pro 5 16. Even with that difference, its 2024 multi-core result beat both Intel laptops.
| Cinebench (higher is better) | Dell Pro 5 16 (AMD Ryzen AI 9 HX PRO 470 12C) | Dell Pro 7 14 (AMD Ryzen AI 9 HX PRO 470 12C) | Dell Pro 7 14 (Intel Core Ultra 7 366H 16C) | Dell Pro 5 14 (Intel Core Ultra X7 368H 16C) |
|---|---|---|---|---|
| R23 Single-Core | 2,029 | 1,946 | 2,043 | 2,010 |
| R23 Multi-Core | 18,764 | 15,173 | 14,640 | 16,915 |
| 2024 Single-Core | 119 | 105 | 116 | 122 |
| 2024 Multi-Core | 1,055 | 847 | 683 | 807 |
7-Zip Compression
The 7-Zip benchmark measures how quickly the processor can compress and decompress data using multiple threads. Higher GIPS scores are better.
The Dell Pro 7 14 AMD recorded 90.2 GIPS in 7-Zip, placing second behind the Pro 5 16 at 103.9 GIPS. It narrowly passed the Pro 5 14 Intel’s 89.4 GIPS and finished 9 GIPS ahead of the Pro 7 14 Intel. The larger AMD laptop had an advantage during sustained compression, but the Pro 7 14 still produced the best result among the three 14-inch systems.
| 7-Zip (higher is better) | Dell Pro 5 16 (AMD Ryzen AI 9 HX PRO 470 12C) | Dell Pro 7 14 (AMD Ryzen AI 9 HX PRO 470 12C) | Dell Pro 7 14 (Intel Core Ultra 7 366H 16C) | Dell Pro 5 14 (Intel Core Ultra X7 368H 16C) |
|---|---|---|---|---|
| Total Rating (GIPS) | 103.9 | 90.2 | 81.2 | 89.4 |
y-cruncher
y-cruncher measures how quickly the processor can calculate large numbers of Pi digits, placing a heavy load on the CPU and memory. Results are measured in seconds, so lower times are better.
The Dell Pro 7 14 AMD completed the 1-billion-digit y-cruncher test in 25.199 seconds, only 0.039 seconds behind the Pro 5 16. The larger AMD model gained more distance as the calculation increased, finishing the 2.5-billion test in 73.320 seconds compared with 79.393 seconds for the Pro 7 14. At 5 billion digits, the Pro 7 14 took 177.776 seconds, about 14 seconds longer than the Pro 5 16 but roughly 27 seconds faster than either Intel system.
| y-cruncher — seconds (lower is better) | Dell Pro 5 16 (AMD Ryzen AI 9 HX PRO 470 12C) | Dell Pro 7 14 (AMD Ryzen AI 9 HX PRO 470 12C) | Dell Pro 7 14 (Intel Core Ultra 7 366H 16C) | Dell Pro 5 14 (Intel Core Ultra X7 368H 16C) |
|---|---|---|---|---|
| 1 Billion | 25.160 | 25.199 | 34.775 | 29.405 |
| 2.5 Billion | 73.320 | 79.393 | 104.586 | 90.719 |
| 5 Billion | 163.768 | 177.776 | 240.554 | 204.685 |
Blender 5.1.1 (GPU)
The Blender benchmark measures GPU rendering performance using three different 3D scenes: Monster, Junkshop, and Classroom. Results are reported in samples per minute, so higher scores are better.
The Radeon 890M in the Dell Pro 7 14 AMD reached 140.9 samples per minute in Monster, 122.0 in Junkshop, and 105.6 in Classroom. Those results were 9% to 18% faster than the Pro 5 16, even though both laptops use the same integrated GPU. The Pro 7 14’s faster LPDDR5x-8533 memory likely helped here, since the Radeon 890M shares system memory. Both Intel laptops were much faster in Blender, however, with the Arc B390-equipped Pro 5 14 leading all three scenes.
| Blender 5.1.1 GPU — samples/min (higher is better) | Dell Pro 5 16 (AMD Ryzen AI 9 HX PRO 470 12C) | Dell Pro 7 14 (AMD Ryzen AI 9 HX PRO 470 12C) | Dell Pro 7 14 (Intel Core Ultra 7 366H 16C) | Dell Pro 5 14 (Intel Core Ultra X7 368H 16C) |
|---|---|---|---|---|
| Monster | 129.8 | 140.9 | 253.6 | 366.6 |
| Junkshop | 103.1 | 122.0 | 189.3 | 312.6 |
| Classroom | 91.1 | 105.6 | 153.0 | 244.4 |
V-Ray and LuxMark
LuxMark measures GPU compute performance by rendering complex scenes through OpenCL, while V-Ray GPU measures how quickly the graphics processor can render a scene using the V-Ray engine. Higher scores are better.
The Dell Pro 7 14 AMD scored 2,042 in LuxMark Hall, 1,050 in LuxMark Food, and 784 vpaths in V-Ray GPU. LuxMark Hall placed it slightly behind the Pro 5 16 and Pro 7 14 Intel, while its Food result beat both of those systems and trailed only the Arc B390-equipped Pro 5 14. V-Ray was close across the group, although the Pro 7 14 AMD finished ahead of only the Pro 7 14 Intel. The Radeon 890M performed reasonably well in these tests, but the Arc B390 had a large advantage in both LuxMark scenes.
| GPU Compute (higher is better) | Dell Pro 5 16 (AMD Ryzen AI 9 HX PRO 470 12C) | Dell Pro 7 14 (AMD Ryzen AI 9 HX PRO 470 12C) | Dell Pro 7 14 (Intel Core Ultra 7 366H 16C) | Dell Pro 5 14 (Intel Core Ultra X7 368H 16C) |
|---|---|---|---|---|
| LuxMark — Hall | 2,125 | 2,042 | 2,168 | 3,287 |
| LuxMark — Food | 982 | 1,050 | 880 | 1,585 |
| V-Ray GPU (vpaths) | 861 | 784 | 775 | 919 |
SPECviewperf 15
SPECviewperf 15 measures graphics performance using viewsets based on professional applications for CAD, 3D modeling, rendering, engineering, and medical visualization. Higher scores are better, although performance can vary considerably between applications and graphics architectures.
The Dell Pro 7 14 AMD performed particularly well in the CAD-focused portions of SPECviewperf 15, leading the group in 3ds Max (24.69), CATIA (21.21), Creo (45.70), and Siemens NX (51.84). It also led the two AMD systems in Enscape (8.29) and Maya (53.64), although the Arc B390-equipped Pro 5 14 posted the highest scores in both tests at 14.28 and 82.42. The Pro 5 14 Intel also led Blender (21.19) and Unreal Engine (38.77). The Pro 7 14 AMD remained close to the Pro 5 16 in Energy (25.08), Medical (60.50), and SolidWorks (32.02), while both Radeon 890M systems were much faster than the Pro 7 14 Intel across the engineering viewsets.
| SPECviewperf 15 (higher is better) | Dell Pro 5 16 (AMD Ryzen AI 9 HX PRO 470 12C) | Dell Pro 7 14 (AMD Ryzen AI 9 HX PRO 470 12C) | Dell Pro 7 14 (Intel Core Ultra 7 366H 16C) | Dell Pro 5 14 (Intel Core Ultra X7 368H 16C) |
|---|---|---|---|---|
| 3dsmax-08 | 23.21 | 24.69 | 9.58 | 20.21 |
| blender-01 | 19.89 | 20.85 | 9.11 | 21.19 |
| catia-07 | 20.16 | 21.21 | 5.27 | 10.27 |
| creo-04 | 44.27 | 45.70 | 18.27 | 32.53 |
| energy-04 | 25.39 | 25.08 | 3.68 | 10.78 |
| enscape-01 | 8.02 | 8.29 | 6.22 | 14.28 |
| maya-07 | 48.67 | 53.64 | 49.54 | 82.42 |
| medical-04 | 65.45 | 60.50 | 9.91 | 22.96 |
| snx-05 | 51.67 | 51.84 | 37.74 | 46.22 |
| solidworks-08 | 33.12 | 32.02 | 11.86 | 23.60 |
| unreal_engine-01 | 26.61 | 26.29 | 21.36 | 38.77 |
SPECworkstation 4
SPECworkstation 4 measures workstation performance across CPU, graphics, storage, AI, product design, engineering, financial services, and other professional workloads. Higher scores are better, while DNF means the system did not complete every workload required for that category.
The Dell Pro 7 14 AMD led the Graphics subsystem (2.41), narrowly passing the Pro 5 16 and finishing far ahead of both Intel laptops. Its CPU score (1.00) was the lowest of the four, while AI and Machine Learning (1.29), Energy (1.13), Financial Services (0.88), and Life Sciences (1.08) placed it around the middle of the group. Product Design (1.18) and Productivity and Development (0.72) were also behind the other systems. Storage (0.55) was the weakest result, reflecting the slower Samsung SSD in this system, while Media and Entertainment did not finish.
| SPECworkstation 4 (higher is better) | Dell Pro 5 16 (AMD Ryzen AI 9 HX PRO 470 12C) | Dell Pro 7 14 (AMD Ryzen AI 9 HX PRO 470 12C) | Dell Pro 7 14 (Intel Core Ultra 7 366H 16C) | Dell Pro 5 14 (Intel Core Ultra X7 368H 16C) |
|---|---|---|---|---|
| CPU (subsystem) | 1.09 | 1.00 | 1.08 | 1.19 |
| Graphics (subsystem) | 2.36 | 2.41 | 0.82 | 1.68 |
| Storage (subsystem) | 0.89 | 0.55 | 1.68 | 1.76 |
| AI & Machine Learning | 1.37 | 1.29 | 1.18 | 1.36 |
| Energy | 1.24 | 1.13 | 0.90 | 1.18 |
| Financial Services | 0.98 | 0.88 | 0.78 | 0.78 |
| Life Sciences | 1.34 | 1.08 | 1.04 | 1.34 |
| Media & Entertainment | DNF | DNF | 1.16 | DNF |
| Product Design | 1.34 | 1.18 | 1.41 | 1.64 |
| Productivity & Development | 0.78 | 0.72 | 1.04 | 1.10 |
Storage Performance
3DMark Storage measures how an SSD performs during gaming-related tasks such as loading games, installing software, saving progress, and moving game files. Blackmagic Disk Speed Test measures an SSD’s sequential read and write speeds using large media files.
The 1TB Samsung BM9C1a in the Dell Pro 7 14 AMD scored 894 in 3DMark Storage, well behind the other three drives in the comparison. Blackmagic Disk measured 3,103.4MB/s read and 4,034.3MB/s write, compared with more than 8,000MB/s from the SK hynix Gen5 drives installed in both Intel laptops. Much of that gap comes down to the specific SSD in our review build, but Dell’s spec sheet notes that Gen5 SSDs run at Gen4 speed on the AMD version of the Pro 7, so even upgraded configurations will not match the sequential numbers of the Intel units. Either way, storage is one of the weaker areas of this configuration, especially considering its $5,377 price.
| Storage (higher is better) | Dell Pro 5 16 (AMD Ryzen AI 9 HX PRO 470 12C) | Dell Pro 7 14 (AMD Ryzen AI 9 HX PRO 470 12C) | Dell Pro 7 14 (Intel Core Ultra 7 366H 16C) | Dell Pro 5 14 (Intel Core Ultra X7 368H 16C) |
|---|---|---|---|---|
| 3DMark Storage (score) | 2,477 | 894 | 3,259 | 3,144 |
| Blackmagic Disk — Read (MB/s) | 4,758.0 | 3,103.4 | 8,398.6 | 8,609.6 |
| Blackmagic Disk — Write (MB/s) | 5,166.5 | 4,034.3 | 8,934.5 | 8,747.3 |
Battery Life
The PCMark 10 Modern Office battery test repeatedly runs common office tasks until the battery reaches the test’s cutoff point. Longer runtimes are better.
The Dell Pro 7 14 AMD lasted 19 hours and 28 minutes in the PCMark 10 Modern Office battery test, which was run in Balanced mode at 50% display brightness. That was more than four hours longer than the 16-inch Pro 5, but roughly seven hours behind both 14-inch Intel systems. All four laptops use a 70Wh battery, so the comparison also shows the efficiency advantage of the Intel configurations during lighter office workloads. Even with that gap, the Pro 7 14 AMD provided enough runtime for a long day away from an outlet.
| Battery — PCMark 10 Modern Office (higher is better) | Dell Pro 5 16 (AMD Ryzen AI 9 HX PRO 470 12C) | Dell Pro 7 14 (AMD Ryzen AI 9 HX PRO 470 12C) | Dell Pro 7 14 (Intel Core Ultra 7 366H 16C) | Dell Pro 5 14 (Intel Core Ultra X7 368H 16C) |
|---|---|---|---|---|
| Runtime | 15h 22m | 19h 28m | 26h 18m | 26h 48m |
Conclusion
The Dell Pro 7 14 AMD is a decent choice for business users who want a portable 14-inch laptop with excellent integrated graphics and local AI performance. Its Ryzen AI 9 HX PRO 470 and 64GB of LPDDR5x-8533 memory worked especially well together, helping it lead the AMD pair in Blender, several SPECviewperf viewsets, the Procyon AI Computer Vision GPU test, and all four AI text-generation workloads. It also led PCMark 10 Productivity and produced competitive single-core performance, giving it plenty of speed for office work, heavier multitasking, CAD applications, and supported local AI tools.
The smaller chassis does place limits on sustained multi-core performance, with the larger Pro 5 16 finishing Cinebench R23 multi-core about 24% faster despite using the same processor. Our review unit’s Samsung BM9C1a SSD was also the slowest of the four Dell drives, trailing the Gen5 SSDs in the Intel systems by a wide margin. Battery life reached 19 hours and 28 minutes, which is excellent for a full day of work, but the two 14-inch Intel models lasted close to 27 hours. Buyers who prioritize long rendering workloads, faster storage, or maximum battery life have better options among the other three Dell configurations.
Pricing may be the largest concern, since our Pro 7 14 AMD review build costs $5,377 before commercial discounts, which is $729 more than the Pro 5 16. However, that premium pays for a thinner and more portable design, faster memory, stronger integrated graphics, and better AI text-generation performance than its larger AMD counterpart. Dell also backs it with AMD PRO manageability, its commercial security tools, and three years of next-business-day onsite support. For companies that need those features in a compact AMD laptop, the Pro 7 14 has a strong case, but buyers focused mainly on sustained CPU performance will get more for their money from the Pro 5 16.
Product Page: Dell Pro 7 14
Leaderboard: The Dell Pro 7 14 AMD ranks #8 on our Laptop Battery Life Leaderboard and is part of the tested field on our Best Business Laptops leaderboard.



 Amazon