

The Dell Pro Precision 5 14s is a compact mobile workstation built around Intel’s latest professional laptop platform. Our review unit combines a Series 3 Intel Core Ultra X9 388H, a 16-core Panther Lake processor with a 50 TOPS NPU, with Intel Arc Pro B390 graphics, 64GB of LPCAMM2 memory running at 8533 MT/s, and a 1TB Gen5 SED-ready SSD. During testing, this configuration produced the strongest productivity results we have recorded from a 14-inch laptop while lasting nearly a full day on battery.
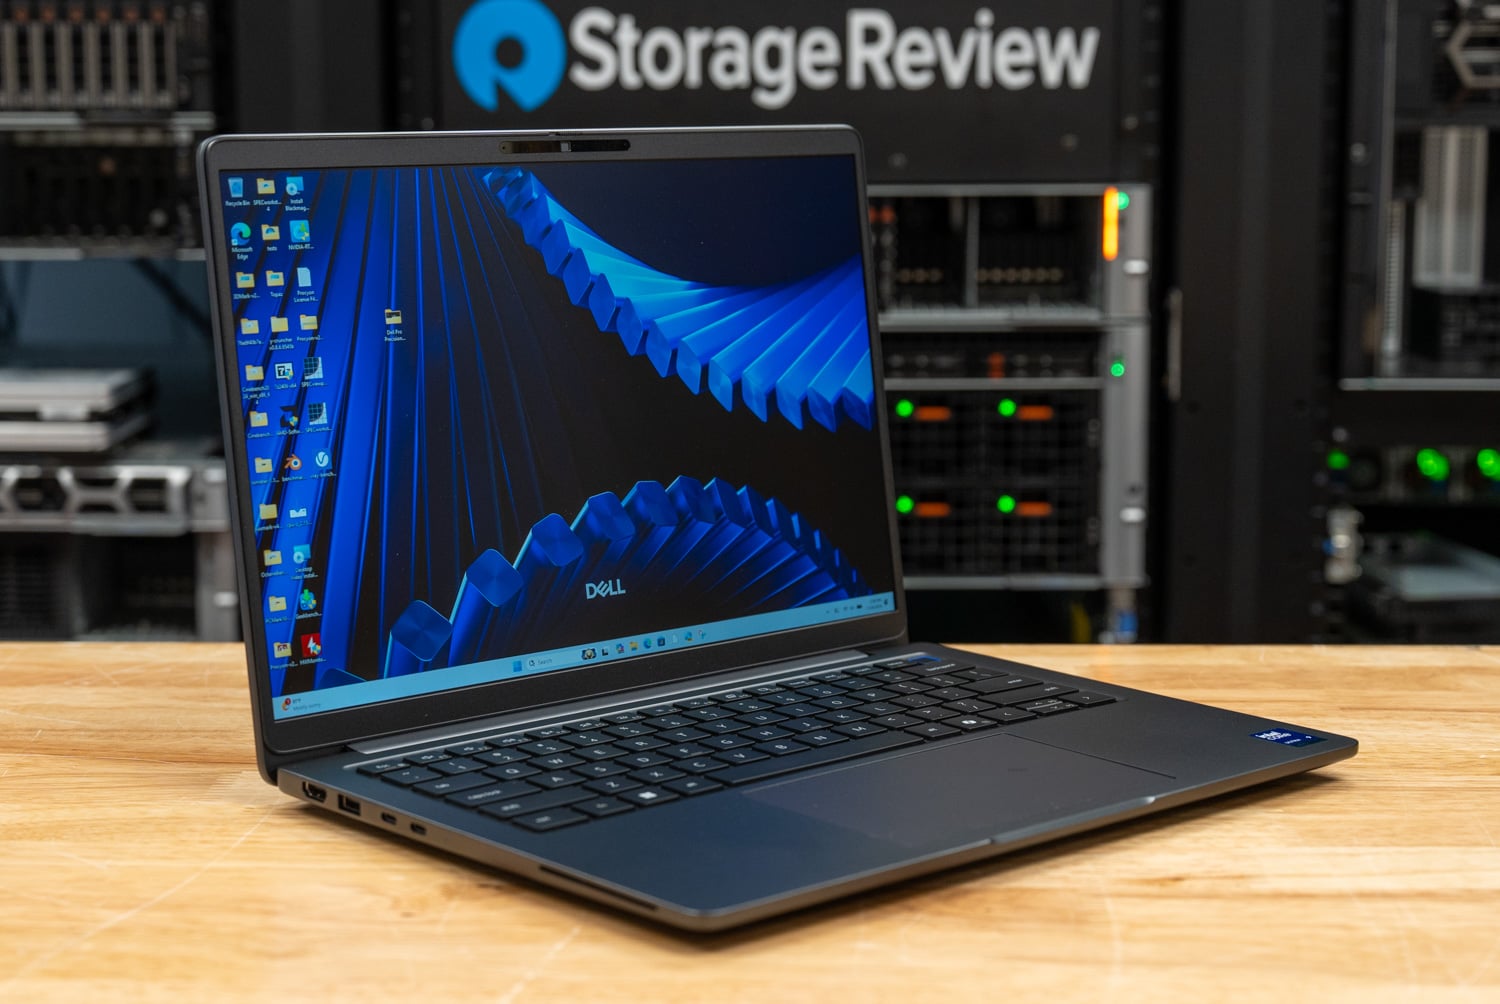
Within Dell’s lineup, the Pro Precision 5 14s adds workstation-focused graphics drivers and enterprise features without moving to a heavier discrete GPU design. It is designed for engineers, developers, analysts, and creators who need certified application support, strong CPU performance, and easier business deployment in a portable system. Dell also offers the same chassis with an AMD Ryzen AI 9 HX PRO 475, giving us a direct platform comparison throughout the review. This size also keeps the portability expected from a 14-inch business laptop: it’s compact, has a decent selection of ports, and features a replaceable LPCAMM2 memory.
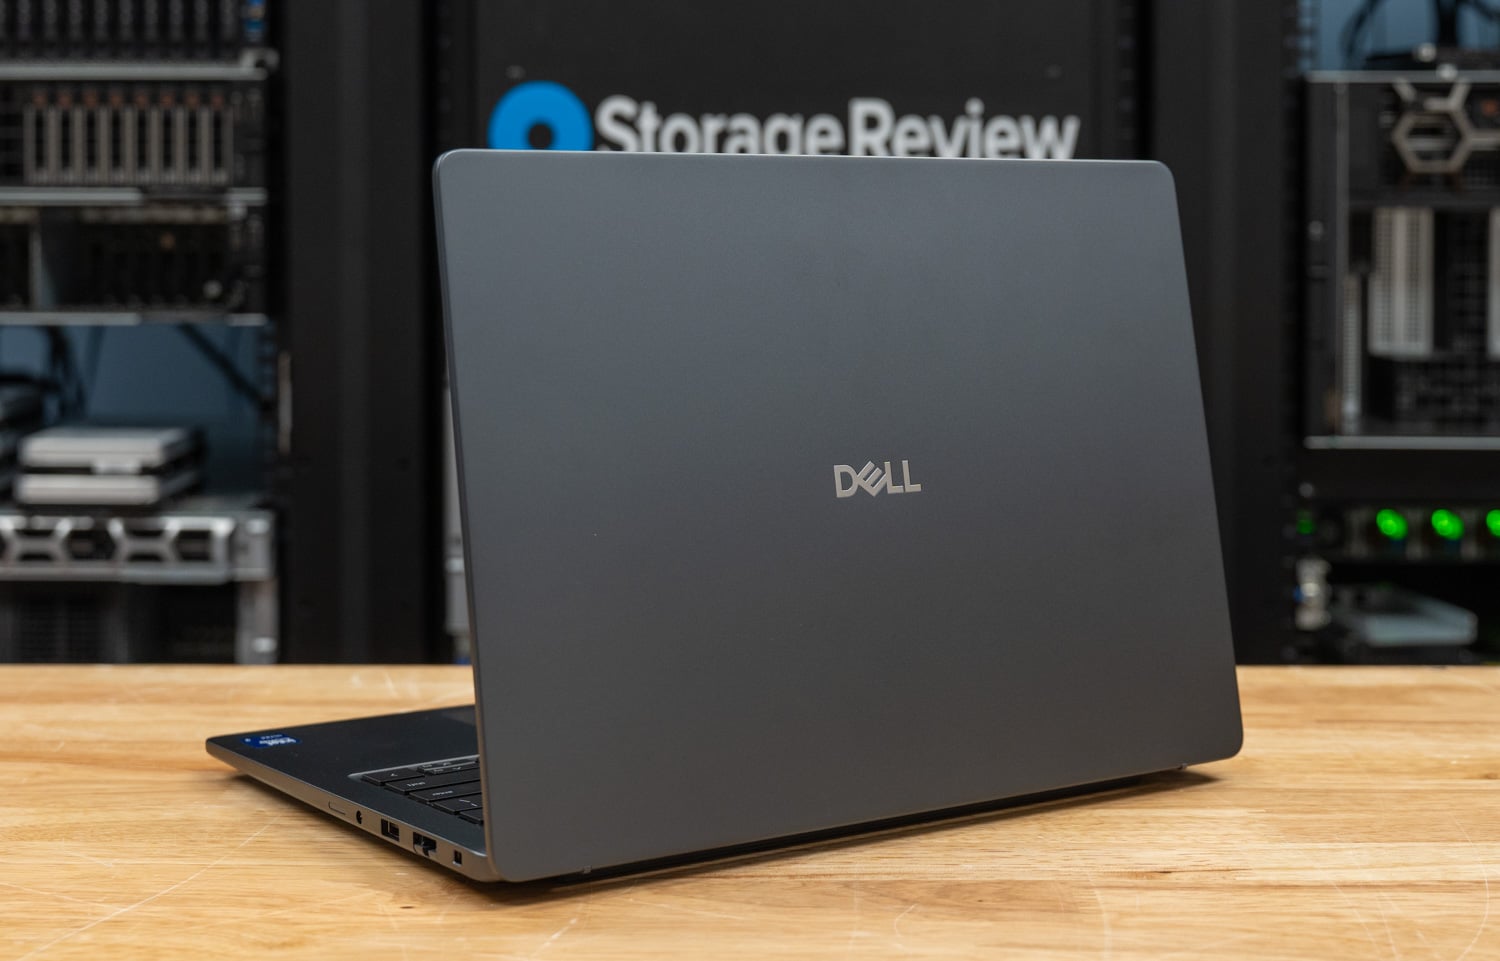
Intel’s Arc Pro B390 is the professional version of the Arc B390 integrated GPU, pairing 12 Xe cores with certified drivers for professional applications. Alongside the Core Ultra X9 388H’s NPU, the system can run local AI workloads across the CPU, GPU, or dedicated 50 TOPS accelerator. Our testing covers all three, along with professional graphics, content creation, storage, and battery performance.
The Dell Pro Precision 5 14s starts at $2,228. Our review configuration prices out at $5,725.11 as a single-unit purchase on Dell.com, with the 16GB to 64GB LPCAMM2 memory jump representing the largest single line item. As with all commercial systems, most business buyers purchase through an account team at volume discounts, so the web price is best viewed as a reference ceiling rather than a typical fleet cost. The system is available now on the Dell Pro Precision 5 Series 14S product page.
Dell Pro Precision 5 14s Specifications
| Specification | Dell Pro Precision 5 14s (PW514260) |
| Processor | Intel Core Ultra X9 388H vPro (Series 3, 16 cores/16 threads, up to 5.1GHz, 18MB cache, 50 TOPS NPU) |
| Graphics | Intel Arc Pro B390 (12 Xe cores, integrated) |
| Memory | 64GB LPCAMM2, 8533 MT/s, dual-channel |
| Storage | 1TB Performance SSD, PCIe Gen5, SED-ready |
| Display | 14-inch FHD+/WUXGA (1920 x 1200), non-touch, 500 nits, IPS, 100% sRGB, anti-glare, low blue light, low power |
| Camera | 8MP HDR RGB + IR with User Presence Detection |
| Wireless | Intel Wi-Fi 7 BE211 |
| Keyboard | English US backlit (mini-LED backlight) |
| Security | Fingerprint reader, smart card reader, NFC, ControlVault 3+, TPM 2.0 |
| Battery | 3-cell, 70Wh Long Lifecycle, ExpressCharge and ExpressCharge Boost |
| Power | 100W USB-C adapter |
| Operating System | Windows 11 Pro (Copilot+ PC) |
| Chassis | Aluminum top cover, palm rest, and bottom cover |
| Systems Management | Intel vPro Enabled |
| Warranty | 36 months Onsite Service after Remote Diagnosis |
| Price | $2,228 starting; $5,725.11 as tested (Dell.com single-unit) |
Build and Design
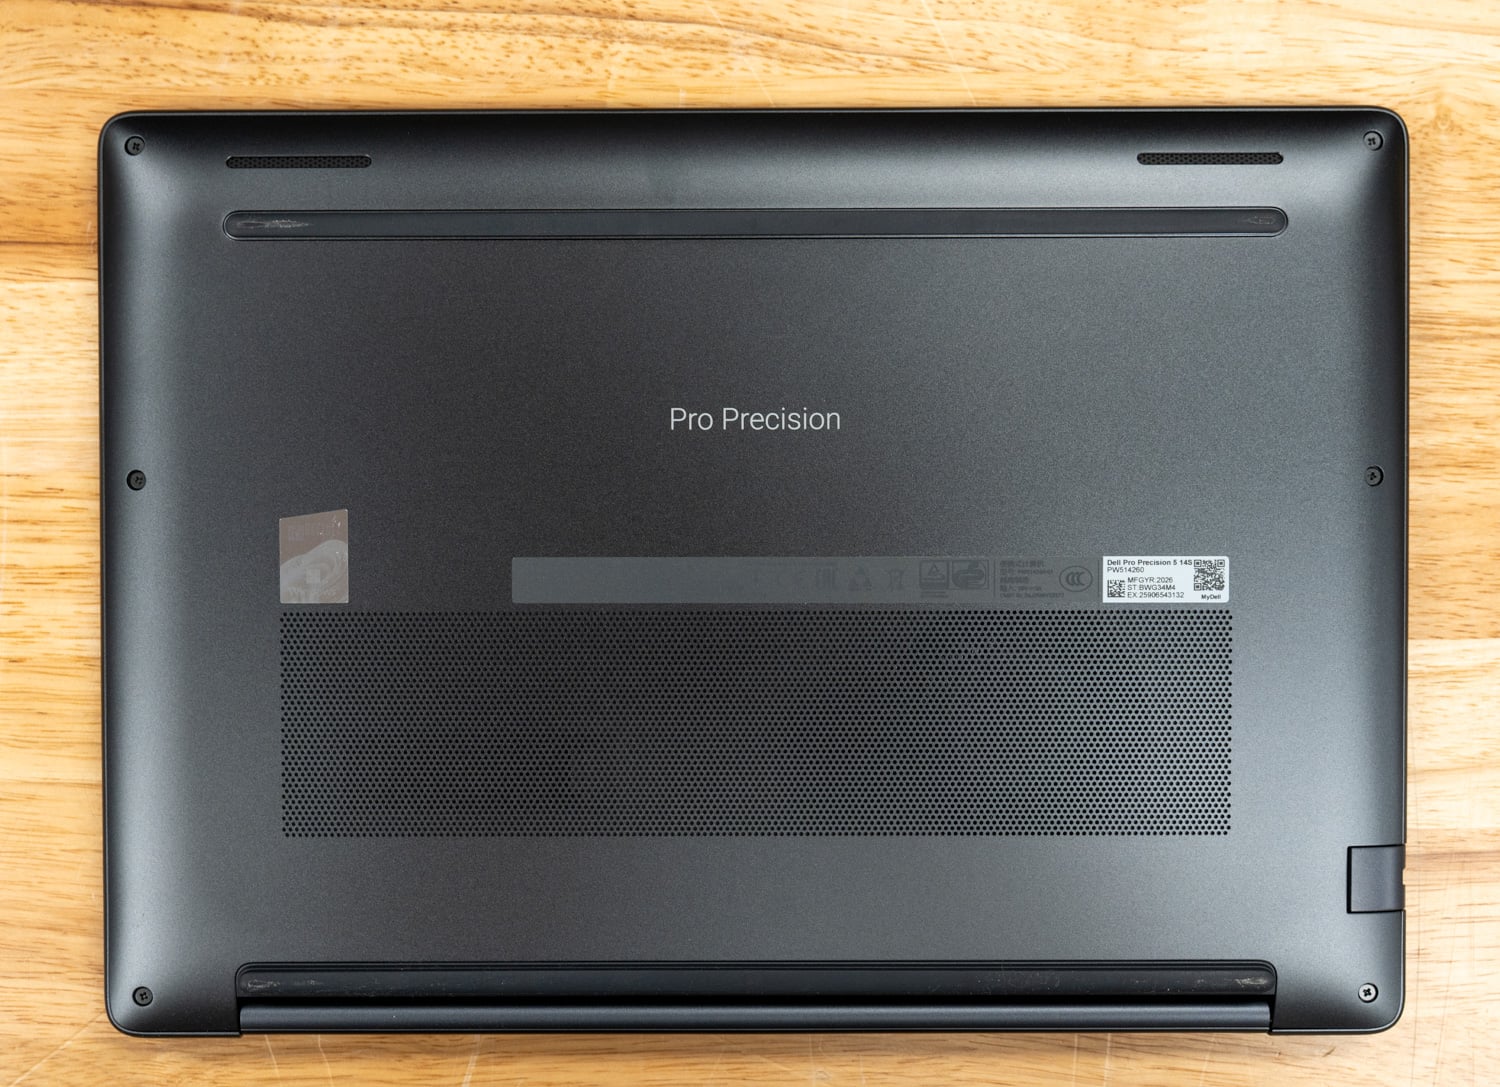
The 5 14s is the thin system. Dell builds two 14-inch machines in this family, and the S gives up internal volume to hit a travel weight. It starts at 3.12 pounds against 3.98 for the standard Pro Precision 5 14, and measures 19.1mm at its thickest point against 23.65mm, in a chassis with effectively the same footprint at 315.5 by 226mm. Losing 0.86 pounds and roughly 4.5mm off a 14-inch workstation is the entire premise of the model, and the compromises it forces are visible once the bottom comes off.
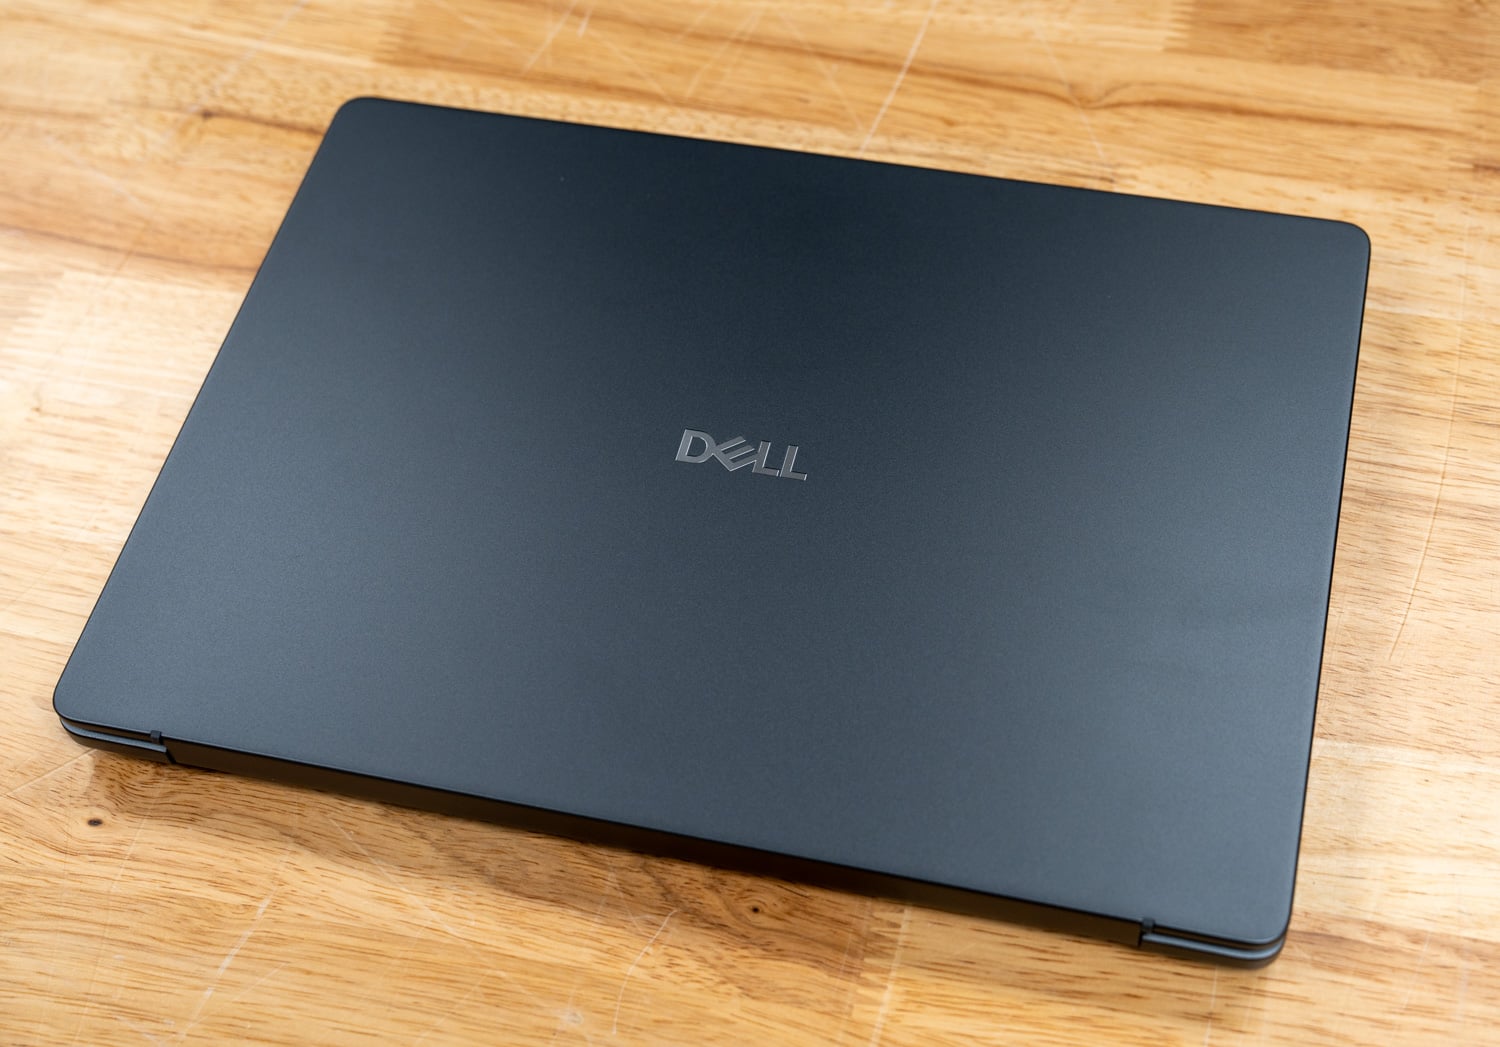
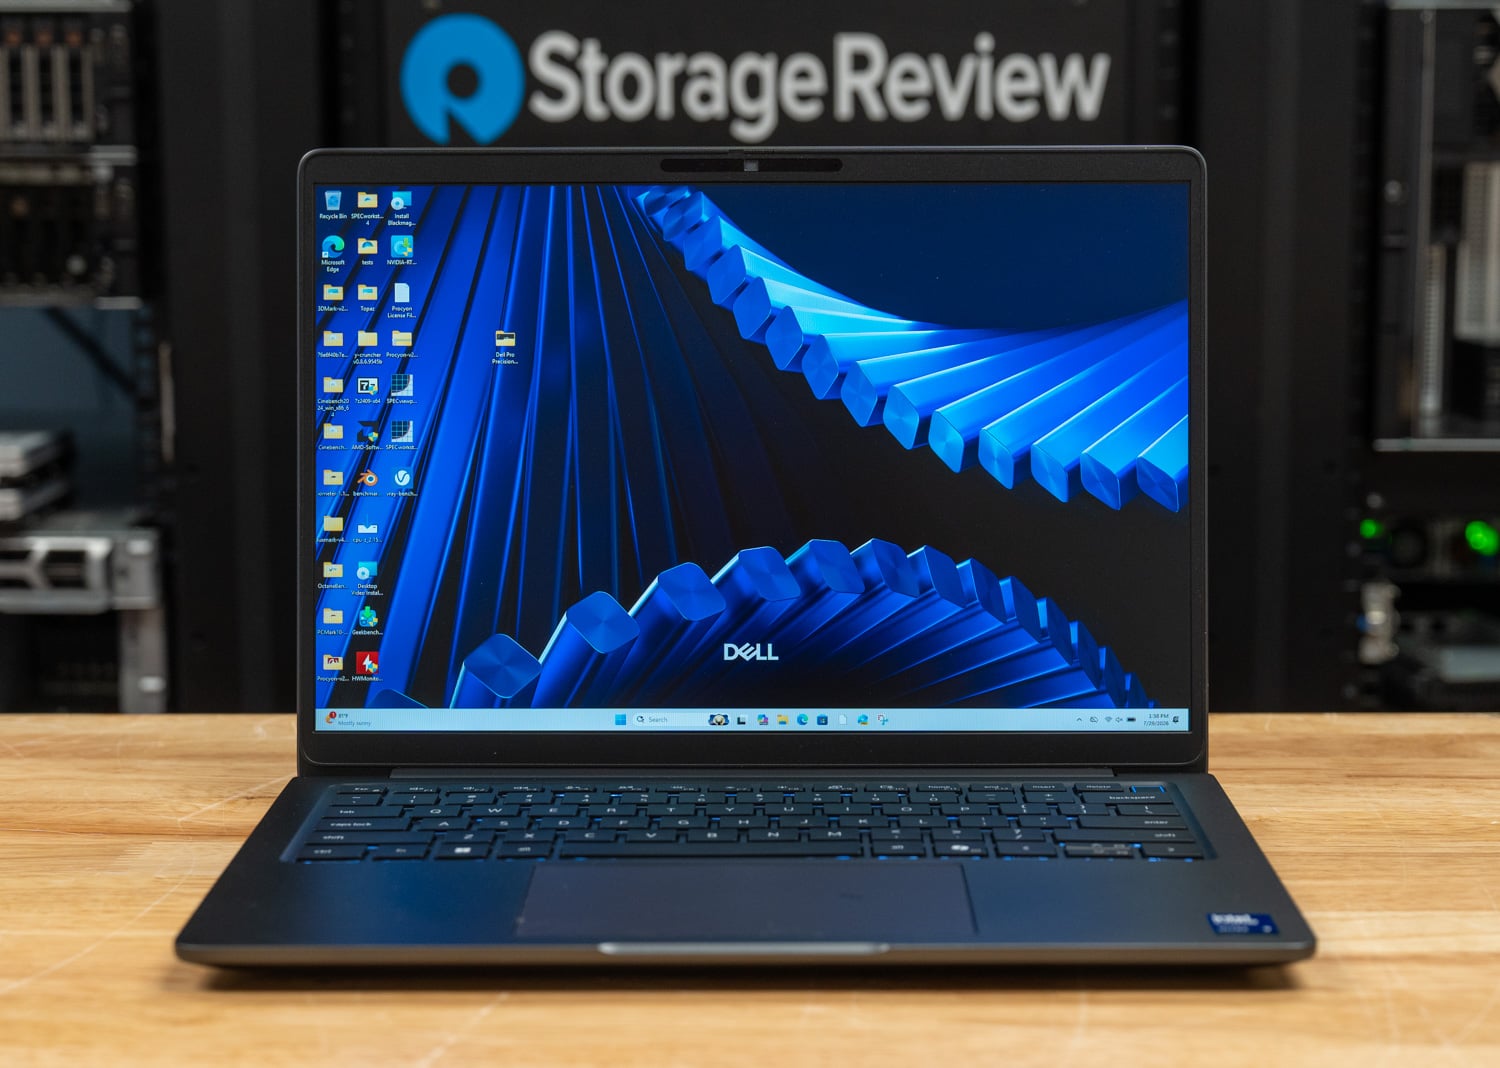
The top cover is aluminum in a dark graphite that reads closer to blue than black under lab light, with a fine matte texture that hides fingerprints far better than the gloss lids Dell used to ship on this line. A mirrored Dell badge sits dead center and is the only marking on the surface. Dell specifies a three-sided aluminum chassis across the top cover, palm rest, and bottom, and states that it uses 50% recycled and 50% low-emissions aluminum. The wedge is pronounced for a machine this thin, tapering from 14.72mm at the hinge to 10.80mm at the front lip. The aluminum top cover provides good rigidity with minimal flex when opening the lid from a far corner. The hinge also provides a consistent, low-effort glide when opening the lid single-handedly.
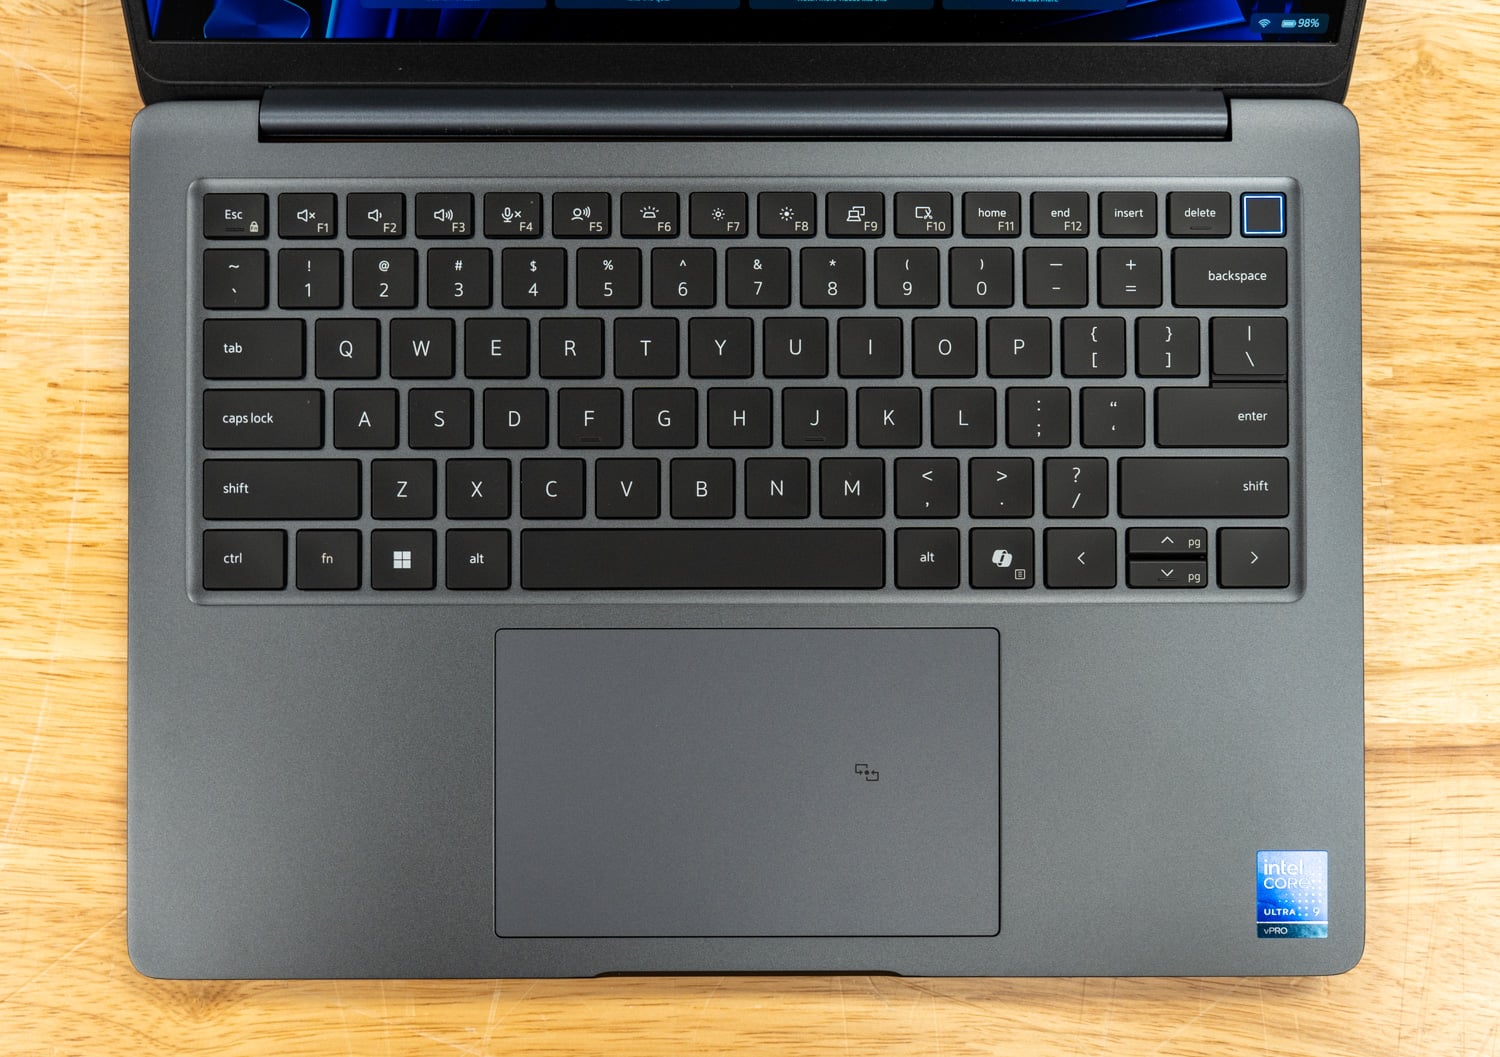
The keyboard is a standard 79-key US layout with no number pad, mini-LED backlighting, and a function row that earns its keys: microphone mute on F4, a presence-detection toggle on F5, keyboard backlight on F6, display switching on F9, and a camera privacy toggle on F10. Dell puts home, end, insert, and delete in a column down the right edge rather than doubling them onto the arrows, which is a sensible call on a keyboard this size. The power button at the top right integrates the fingerprint reader. A Copilot key sits between the right alt and the arrow cluster, and that cluster is the one place the layout gives ground: full-size left and right arrows with half-height up and down keys that double as page up and page down. The keyboard layout is pretty typical of other Dell notebooks in its class, with a noticeable spacing between the keys, compared to others with tightly-neighboring keycaps. The mini-LED backlighting features two brightness levels, and both are respectable but not too bright in low-light environments, and even visible in well-lit environments.
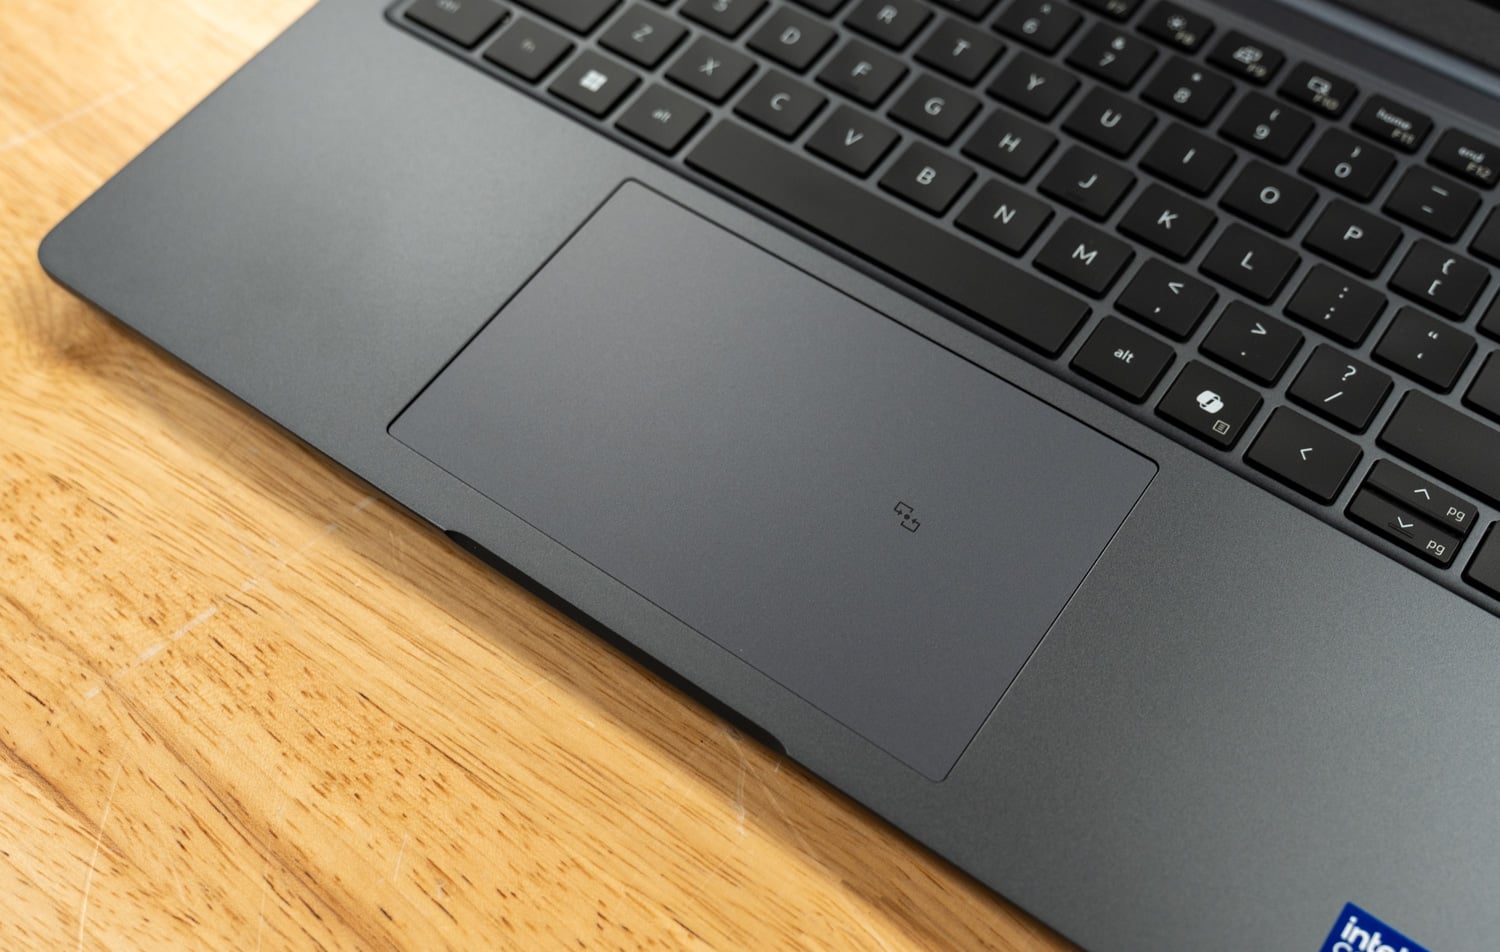
The touchpad is a seamless clickpad, generously sized for a 14-inch deck, featuring a smooth coating for effortless navigation, and utilizes a typical diving board-style click mechanism. There is a tap target printed in the center for the NFC reader Dell builds into the palm rest, which is a good place for it on a machine aimed at badge-in environments.
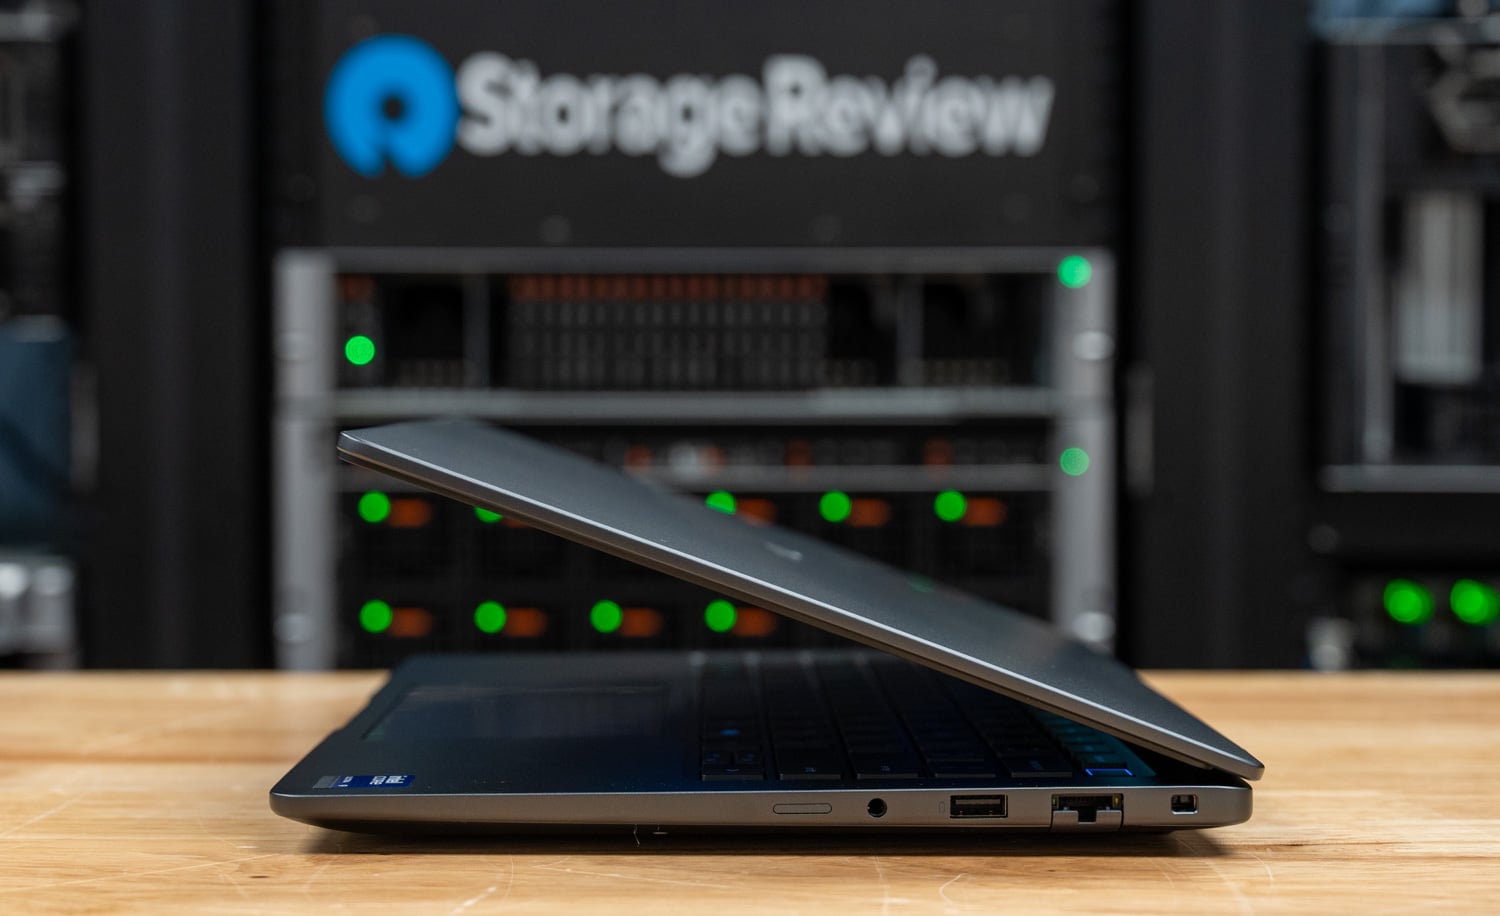
The right edge carries a slim tray at the front, the headset jack, a USB-A port at 5Gbps, gigabit Ethernet, and a wedge lock slot at the rear corner. Beyond the headphone jack, we also see a blank for an optional nano-SIM tray for configurations with WWAN. The RJ45 is the surprise. Dropping a full-height Ethernet jack into a chassis that is 10.8mm at the front is the kind of thing that disappears from consumer machines first, and its presence here says more about the intended buyer than any spec-sheet line does.
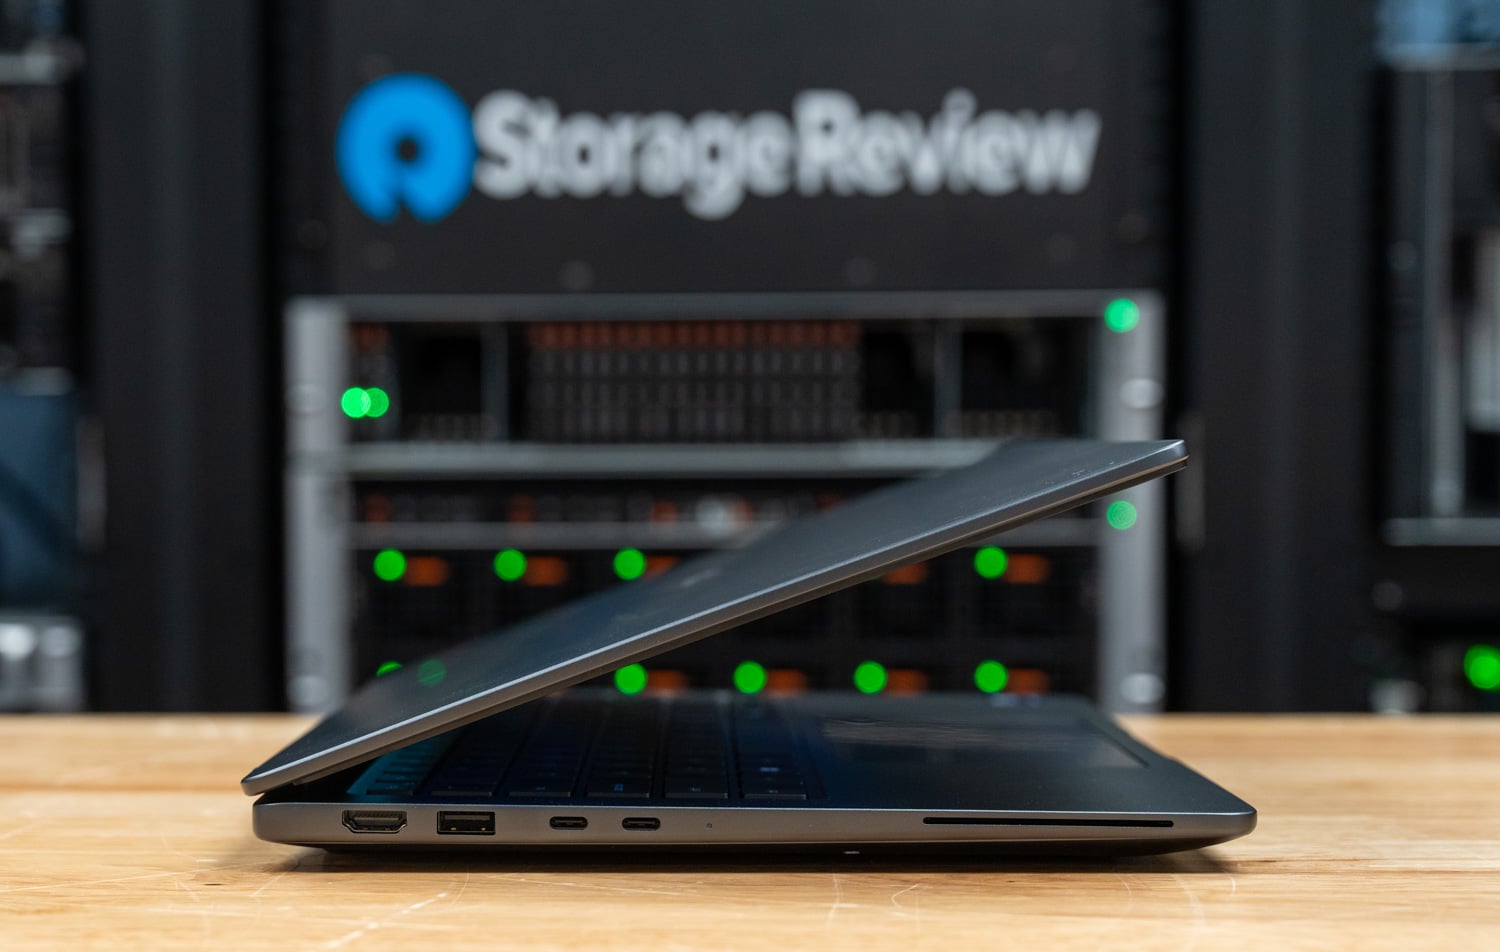
The left edge holds HDMI 2.1, a second 5Gbps USB-A, and two Thunderbolt 4 ports rated at 40Gbps with Power Delivery and DisplayPort, either of which takes the 100W charger. Further back along the palm rest edge is the smart card reader slot. Counting it up, this is a workstation that drives external displays over HDMI or either USB-C port, takes legacy USB-A peripherals on both sides, has wired networking, and reads both smart cards and NFC badges, all without a dock. Very few 3.1-pound machines can say that.
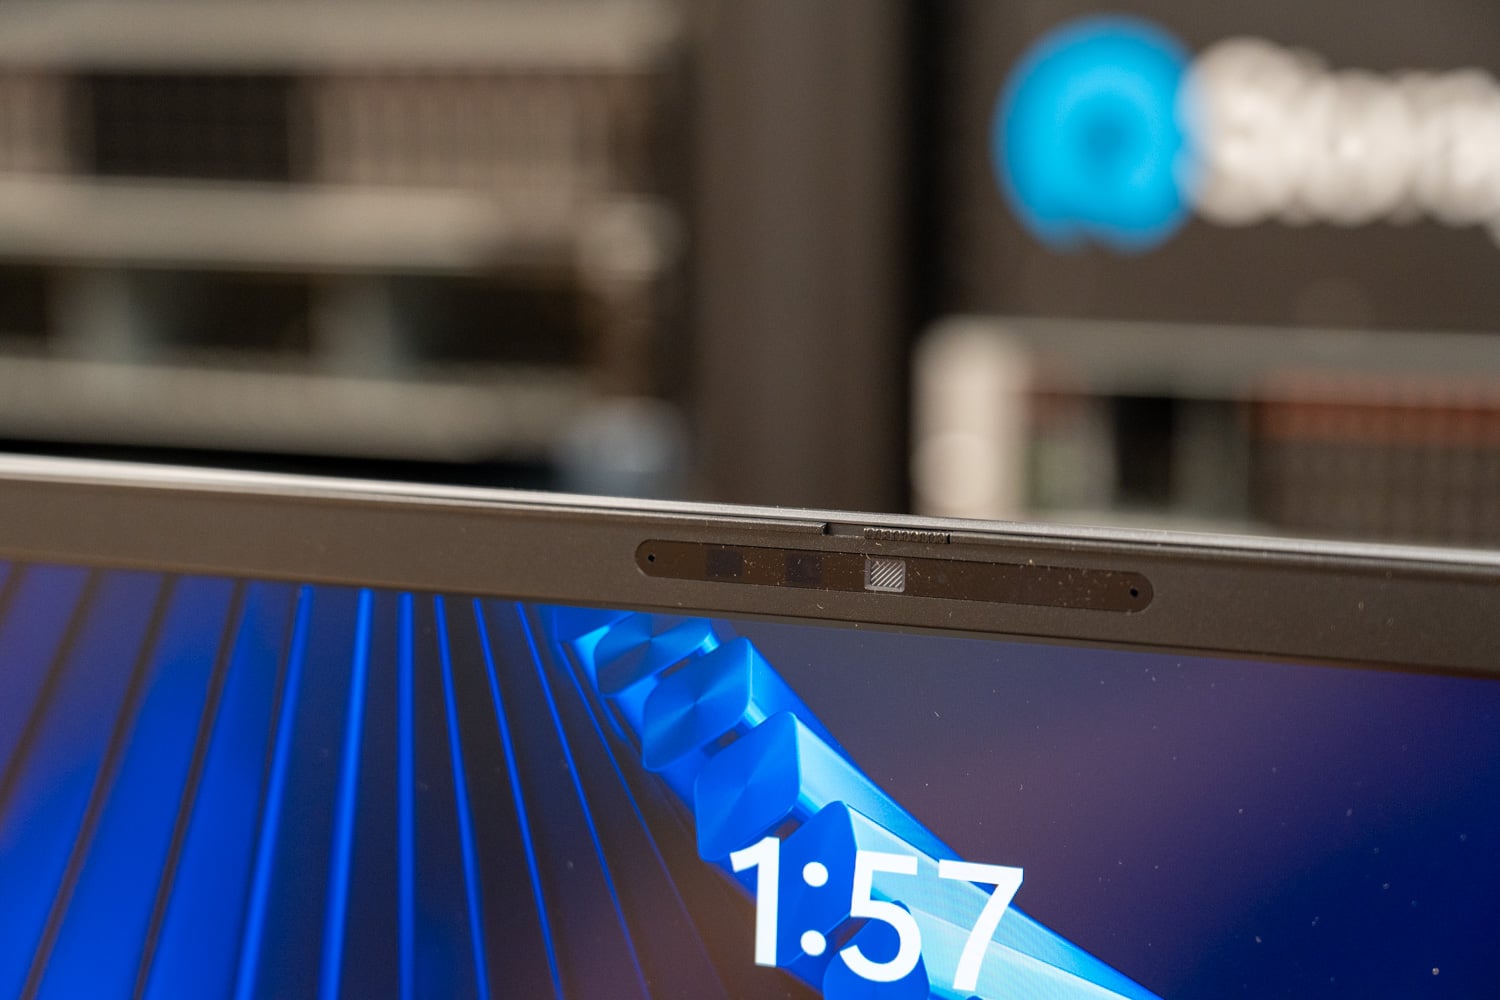
The top bezel is thin without resorting to a notch or a pop-up camera. The 8MP HDR module sits center with IR emitters flanking it for Windows Hello and user presence detection, and a mechanical shutter slides across the lens, visible as the textured tab in the middle of the housing. That is a physical shutter rather than an electronic kill switch, which is what security-minded IT actually wants. Audio comes from stereo speakers driven by Cirrus CS35L63 amplifiers at 2W per channel, with a dual-array microphone alongside the camera. The 8MP webcam produces a more than respectable image for use in conference calls without much grain or light distortion noticeable. The bottom-firing stereo speakers also produce a noticeable stereo effect for how close they are together, and make a pretty full sound, without a lot of distortion or rattle at full volume.
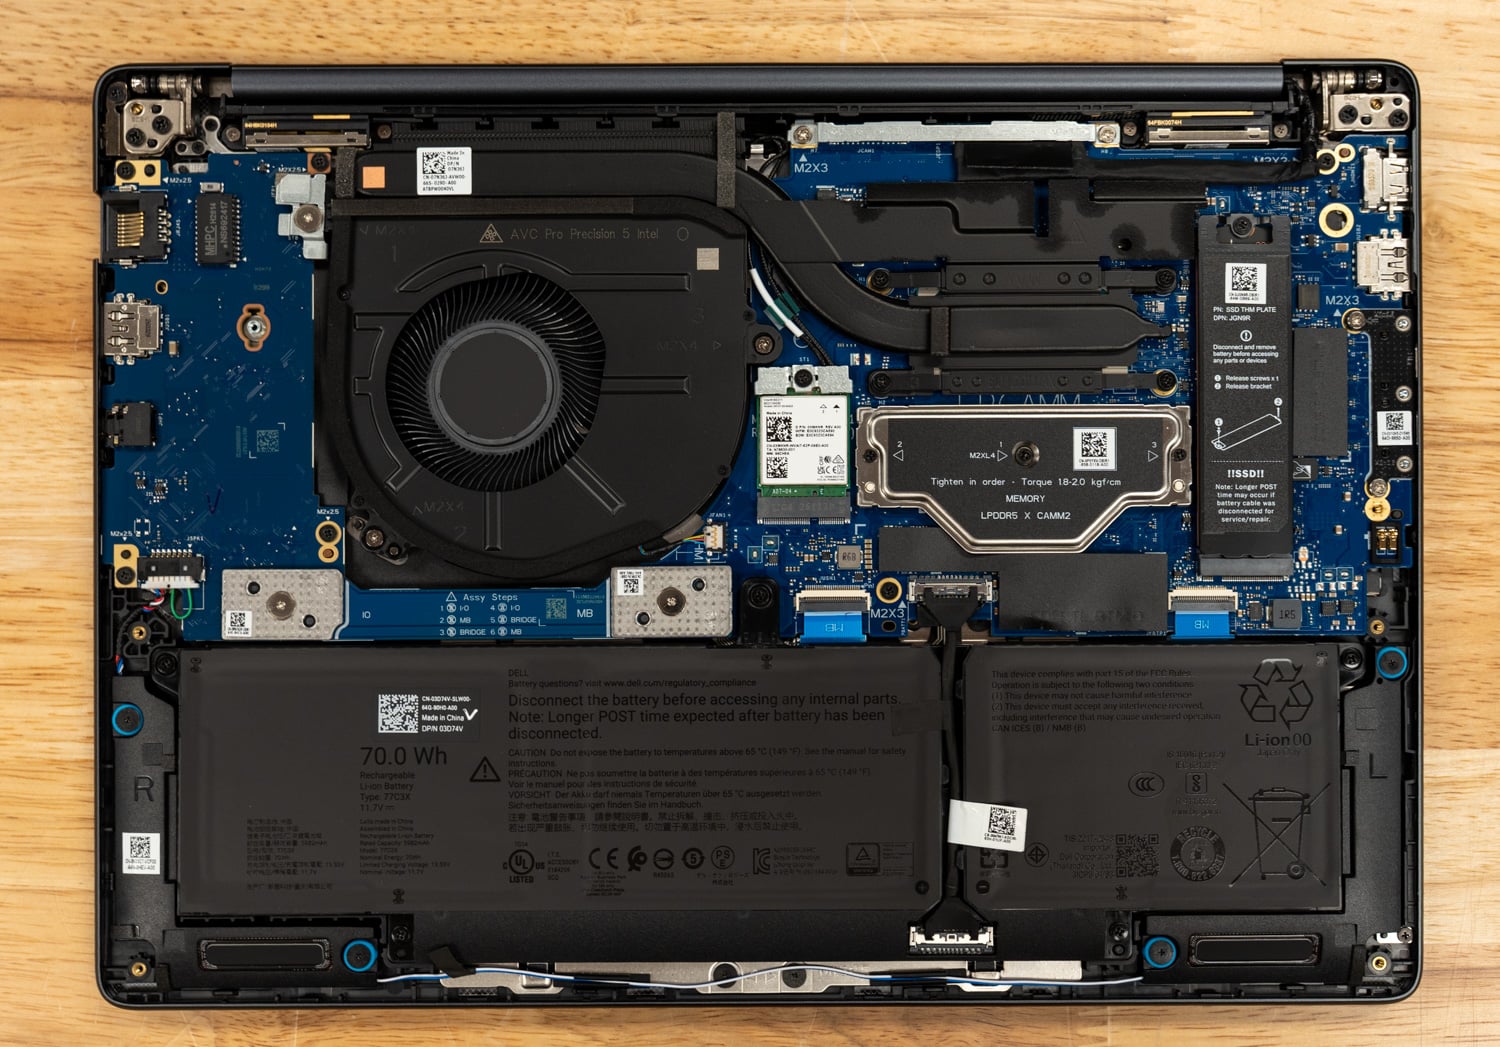
With the bottom cover off, the serviceability claims hold up better than they usually do at this thickness. Memory is an LPDDR5X CAMM2 module under a metal retention plate, not soldered, and Dell prints the tightening order and an 18 to 20 kgf/cm torque spec directly on the shield. That is the single most consequential thing in this photo: a 3.12-pound workstation where a customer can change the RAM is quite rare. The Wi-Fi card is socketed M.2 rather than soldered down; the SSD sits under its own thermal plate on the right, with service instructions silkscreened next to it; and the 70Wh battery, Dell type 77C3X, lifts out with the connector at the center. Cooling is a single AVC blower and one heatpipe, which is the price of the thin chassis and the thing to watch in the sustained load results below.
For a machine built to a weight target, very little has been engineered out. The port selection is fuller than most thin-and-lights twice its class, the security hardware is all present, and the parts a fleet manager expects to replace over three years are the parts that come out first. What the 5 14s trades away is thermal headroom rather than features, and that shows up in the numbers rather than the hands.
Dell Pro Precision 5 14s Performance
Our review unit runs the Core Ultra X9 388H with Arc Pro B390 graphics, 64GB of LPCAMM2 at 8533 MT/s, and a 1TB Gen5 SSD on Windows 11 Pro, with benchmarks tested on the Best Performance power mode. For battery life testing, we configure systems into Balanced power mode and set the screen brightness to 50%.
For comparables, we included the AMD version of the same machine, the Dell Pro Precision 5 14s AMD (Ryzen AI 9 HX PRO 475, Radeon 890M, 64GB LPDDR5x), the standard Dell Pro 5 14 Intel (Core Ultra X7 368H with Arc B390 integrated graphics, 64GB), and the Lenovo ThinkPad P14s Gen 7 (Core Ultra 7 366H, NVIDIA RTX PRO 1000, 64GB), the closest competing 14-inch mobile workstation. The Pro 5 14 predates our adoption of Geekbench 7, Cinebench 2026, and standalone 7-Zip, so it sits out those tables. We also tested the 16-inch Dell Pro Precision 5 16s Intel, which shares this unit’s exact CPU and GPU; its results land within a few percent of the 14s across the suite, so we left it off the tables and call out the handful of places where the bigger chassis makes a substantial difference.
A note on GPU labeling: the three systems in this group without a discrete GPU run V-Ray’s GPU test through the CUDA-compatible engine on their integrated graphics, and V-Ray reports the processor name in its device field. We label those results by the GPU that did the work.
PCMark 10
PCMark 10 measures general system performance across everyday work such as web browsing, video conferencing, spreadsheets, writing, photo editing, and rendering. The overall score is supported by the Essentials, Productivity, and Digital Content Creation subscores, which show where a system’s strengths lie. Higher scores are better.
| PCMark 10 | Dell Pro Precision 5 14s Intel | Dell Pro Precision 5 14s AMD | Dell Pro 5 14 Intel | Lenovo ThinkPad P14s Gen 7 |
| Overall Score | 10,019 | 8,762 | 7,945 | 9,083 |
| Essentials | 12,188 | 11,442 | 10,751 | 10,686 |
| Productivity | 15,827 | 14,272 | 13,821 | 16,501 |
| Digital Content Creation | 14,147 | 11,178 | 9,158 | 11,534 |
The Pro Precision 5 14s posted an overall score of 10,019, the first laptop in our 14-inch group to cross the 10,000 mark. It led every subscore except Productivity, where the ThinkPad P14s Gen 7 edged ahead, and its Digital Content Creation score of 14,147 ran 23% ahead of the P14s and 54% ahead of the standard Pro 5 14.
PCMark 10 Modern Office Battery
The PCMark 10 Modern Office battery test repeatedly runs common office tasks until the battery reaches the test’s cutoff point, in Balanced mode at 50% display brightness. This is a rundown of the whole system rather than a synthetic idle drain, so it tracks closely with what a full day of productivity work does to the battery. Longer runtimes are better.
| Modern Office Battery | Dell Pro Precision 5 14s Intel | Dell Pro Precision 5 14s AMD | Dell Pro 5 14 Intel | Lenovo ThinkPad P14s Gen 7 |
| Runtime (higher is better) | 23 hours 50 minutes | 14 hours 26 minutes | 26 hours 48 minutes | 15 hours 52 minutes |
At 23 hours and 50 minutes, the 5 14s Intel ran more than nine hours past the AMD version of the same chassis and eight hours past the dGPU-equipped ThinkPad. The standard Pro 5 14 remains our overall champion at 26 hours and 48 minutes, helped by its lower-power X7 silicon, but Precision gets remarkably close while carrying much stronger sustained performance. For what it is worth, the 16-inch 5 16s Intel and its larger thermal envelope stretched the same platform to 24 hours and 43 minutes.
Geekbench 6
Geekbench 6 measures processor performance using a mix of common tasks, with separate scores for single-core and multi-core workloads, plus GPU compute scores through OpenCL and Vulkan. Higher scores are better.
| Geekbench 6 | Dell Pro Precision 5 14s Intel (Arc Pro B390) | Dell Pro Precision 5 14s AMD (Radeon 890M) | Dell Pro 5 14 Intel (Arc B390) | Lenovo ThinkPad P14s Gen 7 (RTX PRO 1000) |
| CPU Single-Core | 3,010 | 2,831 | 2,952 | 2,808 |
| CPU Multi-Core | 17,396 | 14,611 | 10,372 | 16,319 |
| GPU OpenCL | 56,745 | 36,322 | 32,458 | 87,537 |
| GPU Vulkan | 55,581 | 49,868 | 43,382 | 73,204 |
The X9 388H took the single-core lead at 3,010 and posted 17,396 multi-core, ahead of every comp, including the ThinkPad. The GPU results are where the Arc Pro B390 separates itself from its non-Pro sibling in the Pro 5 14: 56,745 in OpenCL versus 32,458, a 75% gap between two GPUs with the same core count, reflecting the X9 platform’s higher graphics clocks and the Pro driver stack. The RTX PRO 1000 in the ThinkPad still owns outright GPU compute.
Geekbench 7
Geekbench 7 joins the suite alongside Geekbench 6 as comparison data builds. Its CPU scores are calibrated against a baseline of 2,500, set by the AMD Ryzen 7700, while GPU scores are calibrated against a baseline of 100,000, set by the NVIDIA GeForce RTX 4060. Higher scores are better, and double the score indicates double the performance. Because Geekbench 7 uses new workloads and new baselines, its scores are not comparable to Geekbench 6 results. The Dell Pro 5 14 was tested before we adopted Geekbench 7, so it sits this table out.
| Geekbench 7 | Dell Pro Precision 5 14s Intel (Arc Pro B390) | Dell Pro Precision 5 14s AMD (Radeon 890M) | Lenovo ThinkPad P14s Gen 7 (RTX PRO 1000) |
| CPU Single-Core | 2,702 | 2,571 | 2,533 |
| CPU Multi-Core | 18,788 | 15,514 | 17,651 |
| GPU OpenCL | 54,854 | 31,423 | 75,340 |
| GPU Vulkan | 46,906 | * | 70,067 |
| GPU CUDA | N/A | N/A | 114,469 |
*The AMD unit’s Vulkan run failed workload validation in Geekbench 7 and was assigned a zero score for the affected subtest; we have discarded the result and will update the table when a clean run is available.
The story repeats on the newer suite: the X9 388H leads both CPU metrics in this group, with 18,788 multi-core putting it 6% ahead of the ThinkPad and 21% ahead of the AMD sibling. In GPU compute, the Arc Pro B390 lands at roughly half of Geekbench 7’s RTX 4060 baseline, which is strong territory for integrated graphics but well short of the RTX PRO 1000.
Cinebench R23 and 2024
Cinebench measures how quickly the processor can render a complex photorealistic scene, with separate single-core and multi-core tests. R23 uses the legacy Cinema 4D engine that remains the most widely quoted version, while Cinebench 2024 moves to the Redshift render engine with a rebased score range. Hence, scores are not comparable between the two versions. The GPU test in Cinebench 2024 requires more graphics memory than these integrated platforms expose, so it did not run on the Dell systems. Higher scores are better.
| Cinebench | Dell Pro Precision 5 14s Intel | Dell Pro Precision 5 14s AMD | Dell Pro 5 14 Intel | Lenovo ThinkPad P14s Gen 7 |
| Cinebench R23 | ||||
| Single-Core | 2,137 | 2,028 | 2,010 | 2,056 |
| Multi-Core | 18,466 | 20,884 | 16,915 | 18,546 |
| Cinebench 2024 | ||||
| Single-Core | 125 | 114 | 122 | 123 |
| Multi-Core | 1,106 | 1,089 | 807 | 1,118 |
The AMD unit’s 24-thread Ryzen takes R23 multi-core at 20,884, a workload that has long favored AMD’s thread count, while the X9 388H wins single-core in both versions. In Cinebench 2024, the three current-generation machines bunch within 3% of each other in multi-core, all well clear of the Pro 5 14’s 807.
Cinebench 2026
Cinebench 2026 joins the suite alongside R23 and 2024. It tests CPU and GPU performance using Maxon’s Redshift render engine. It is built on the latest Cinema 4D 2026 code and is designed to show whether a machine is stable under high CPU load, whether a notebook’s cooling can sustain longer render tasks, and how it handles demanding real-world 3D work. Because code and compiler changes accelerated scene rendering, Cinebench 2026 scores use an adjusted range and should not be compared to scores from previous Cinebench versions. Its GPU test supports current NVIDIA and AMD hardware but does not yet run on Intel integrated graphics, so the two Intel Dell systems have no GPU score.
| Cinebench 2026 | Dell Pro Precision 5 14s Intel | Dell Pro Precision 5 14s AMD | Lenovo ThinkPad P14s Gen 7 |
| CPU Single Thread | 513 | 466 | 502 |
| CPU Multiple Threads | 4,513 | 4,230 | 4,492 |
| GPU | N/A | 5,313 | 34,437 |
On the Redshift-based CPU test, the X9 388H again finishes first, though the margin over the ThinkPad is under 1%. The Radeon 890M managed a GPU score of 5,313, and the RTX PRO 1000 shows what a workstation dGPU adds in a supported renderer.
7-Zip Compression
The built-in 7-Zip benchmark measures how quickly the processor can compress and decompress data using multiple threads, run with a 128MB dictionary across ten passes. Decompression tends to scale with thread count while compression leans on memory latency, so the two halves often tell different stories. Higher GIPS scores are better.
| 7-Zip 24.09 (GIPS) | Dell Pro Precision 5 14s Intel | Dell Pro Precision 5 14s AMD | Lenovo ThinkPad P14s Gen 7 |
| Compressing | 92.836 | 89.099 | 90.364 |
| Decompressing | 93.089 | 117.545 | 90.526 |
| Total Rating | 92.963 | 103.322 | 90.445 |
Decompression scales with thread count, which gives the 24-thread AMD unit a total rating of 103.322 GIPS. The Intel unit’s 92.963 edges the ThinkPad, and for reference, the 16-inch 5 16s Intel squeezed out 96.764 GIPS from the same silicon with more thermal room.
y-cruncher
y-cruncher measures how quickly the processor can calculate large numbers of digits of Pi, placing a heavy load on the CPU and memory subsystem. At the same time, the BBP runs extract hexadecimal digits of Pi. Results are in seconds, so lower times are better. The AMD unit could not complete the 5 billion and 10 billion digit runs because its memory reservation for the integrated GPU reduces the available pool below what those sizes require.
| y-cruncher (seconds, lower is better) | Dell Pro Precision 5 14s Intel | Dell Pro Precision 5 14s AMD | Dell Pro 5 14 Intel | Lenovo ThinkPad P14s Gen 7 |
| Pi 1B | 28.404 | 24.648 | 29.405 | 26.685 |
| Pi 2.5B | 83.968 | 71.084 | 90.719 | 76.787 |
| Pi 5B | 190.356 | N/A | 204.685 | 172.994 |
| Pi 10B | 417.224 | N/A | 512.277 | 392.083 |
| Pi BBP 1B | 1.684 | 1.104 | 1.718 | 1.621 |
| Pi BBP 10B | 20.028 | 14.333 | 20.210 | 18.200 |
| Pi BBP 100B | 241.409 | 166.762 | 256.416 | 219.969 |
The AMD unit’s SMT threads give it a clear edge in every run it completed, and the ThinkPad finishes ahead of the review unit at the larger sizes. The Precision still beats the Pro 5 14 across the board, with the gap widening to 19% at 10 billion digits.
Blender
The Blender benchmark measures rendering performance using three different 3D scenes: Monster, Junkshop, and Classroom. Results are reported in samples per minute, so higher scores are better, and we test on both the CPU and GPU. Scores are not comparable across Blender versions, so each version gets its own table. Starting with this review, we are trimming the older Blender releases from the suite and reporting the current 5.1 and 5.2 results; the Pro 5 14 predates Blender 5.2, and the ThinkPad P14s Gen 7 will join these tables once it completes the expanded version sweep.
| Blender 5.1 (samples/min) | Dell Pro Precision 5 14s Intel (Arc Pro B390) | Dell Pro Precision 5 14s AMD (Radeon 890M) | Dell Pro 5 14 Intel (Arc B390) |
| GPU | |||
| Monster | 559.73 | 134.65 | 360.50 |
| Junkshop | 467.52 | 107.84 | 309.81 |
| Classroom | 418.63 | 95.60 | 232.02 |
| CPU | |||
| Monster | 131.04 | 130.35 | 70.12 |
| Junkshop | 97.86 | 100.31 | 52.95 |
| Classroom | 66.98 | 76.40 | 34.97 |
| Blender 5.2 (samples/min) | Dell Pro Precision 5 14s Intel (Arc Pro B390) | Dell Pro Precision 5 14s AMD (Radeon 890M) |
| GPU | ||
| Monster | 567.52 | 124.50 |
| Junkshop | 463.30 | 101.06 |
| Classroom | 417.38 | 82.95 |
| CPU | ||
| Monster | 133.46 | 127.02 |
| Junkshop | 94.27 | 95.84 |
| Classroom | 64.26 | 71.63 |
The Arc Pro B390 rendered Monster at 559.73 samples per minute in Blender 5.1, more than four times the Radeon 890M and 55 percent ahead of the Arc B390 in the Pro 5 14, and the 5.2 results hold the same level. On CPU rendering the Intel and AMD Precision twins trade scenes, with AMD’s extra threads winning Junkshop and Classroom, while the Pro 5 14 falls off sharply in the 5.x releases.
LuxMark
LuxMark measures GPU compute performance by rendering complex scenes through OpenCL, based on LuxCoreRender. We run the Food and Hall scenes on all available OpenCL devices in each system, so the GPU listed in each column header did the rendering. Higher scores are better.
| LuxMark v4 | Dell Pro Precision 5 14s Intel (Arc Pro B390) | Dell Pro Precision 5 14s AMD (Radeon 890M) | Dell Pro 5 14 Intel (Arc B390) | Lenovo ThinkPad P14s Gen 7 (RTX PRO 1000) |
| Hall | 3,494 | 2,077 | 3,287 | 11,342 |
| Food | 1,705 | 1,041 | 1,585 | 4,103 |
The Arc Pro B390 led the integrated pack in both scenes, finishing 68% ahead of the Radeon 890M in Hall. The gap to its non-Pro sibling is modest here, unlike the Geekbench compute results, suggesting LuxCoreRender is less sensitive to the clock and driver differences between the two B390 variants.
V-Ray
Chaos V-Ray measures ray-traced rendering throughput, reported in vpaths, where higher is better. We run the CUDA-compatible engine on every system so results remain comparable to notebooks with only integrated graphics; on systems without a discrete GPU, that path executes on the integrated graphics, even though V-Ray reports the processor name in its device field. On dedicated NVIDIA hardware, we also capture V-Ray’s RTX engine, which engages the card’s ray tracing cores and is reported separately.
| V-Ray GPU (vpaths) | Dell Pro Precision 5 14s Intel (Arc Pro B390) | Dell Pro Precision 5 14s AMD (Radeon 890M) | Dell Pro 5 14 Intel (Arc B390) | Lenovo ThinkPad P14s Gen 7 (RTX PRO 1000) |
| CUDA Engine | 890 | 897 | 919 | 1,568 |
| RTX Engine | N/A | N/A | N/A | 2,589 |
The three integrated platforms cluster within about 3% of each other, an unusually tight grouping given how differently they behave elsewhere, which points to this compatibility path leaning on CPU and memory as much as the GPU. The ThinkPad pulls well clear on either engine.
3DMark CPU Profile
The 3DMark CPU Profile benchmark measures CPU performance at fixed thread counts, from a single thread up to the maximum available, showing how performance scales as more cores are engaged. Higher scores are better.
| 3DMark CPU Profile | Dell Pro Precision 5 14s Intel | Dell Pro Precision 5 14s AMD | Dell Pro 5 14 Intel | Lenovo ThinkPad P14s Gen 7 |
| Max Threads | 10,277 | 8,778 | 10,370 | 10,500 |
| 8 Threads | 6,441 | 6,270 | 6,669 | 6,550 |
| 4 Threads | 4,176 | 4,047 | 4,256 | 4,219 |
| 1 Thread | 1,174 | 1,160 | 1,181 | 1,165 |
The four systems are effectively tied at every thread count except max, where the AMD unit trails; its strength in rendering workloads does not carry over to this physics test. The 16-inch 5 16s Intel posted the group’s best max threads result at 10,748, one of the few places its extra thermal headroom shows up.
3DMark Storage and Blackmagic Disk Speed Test
3DMark Storage measures how an SSD performs during gaming-related tasks such as loading games, installing software, saving progress, and moving game files. Blackmagic Disk Speed Test measures an SSD’s sequential read and write speeds using large media files. Higher is better in both.
| Storage | Dell Pro Precision 5 14s Intel | Dell Pro Precision 5 14s AMD | Dell Pro 5 14 Intel | Lenovo ThinkPad P14s Gen 7 |
| 3DMark Storage | 3,093 | 2,424 | 3,144 | 3,094 |
| Blackmagic Write (MB/s) | 9,000.8 | 4,772.0 | 8,747.3 | 8,262.3 |
| Blackmagic Read (MB/s) | 9,809.2 | 4,900.4 | 8,609.6 | 8,511.5 |
The review unit’s Micron 4600 posted the best sequential numbers in the group, reading at nearly 9.8 GB/s. The AMD twin ships with a Kioxia BG7 in this configuration and lands at roughly half the sequential throughput, a config difference worth noting for video-heavy workflows. Buyers of the 16-inch model should also know its drive tested lower here, with the 5 16s Intel’s SSD reaching 7,660 MB/s writes, and 8,418 MB/s reads and a 3DMark Storage score of 2,804, about 9% behind the 14s.
Blackmagic RAW Speed Test
The Blackmagic RAW Speed Test measures how many frames per second a system can decode Blackmagic RAW video on the CPU and on the GPU. We quote the 8K results at 12:1 compression, and higher is better.
| Blackmagic RAW Speed Test | Dell Pro Precision 5 14s Intel (Arc Pro B390) | Dell Pro Precision 5 14s AMD (Radeon 890M) | Dell Pro 5 14 Intel (Arc B390) | Lenovo ThinkPad P14s Gen 7 (RTX PRO 1000) |
| 8K 12:1 CPU (fps) | 79 | 77 | 76 | 77 |
| 8K 12:1 GPU (fps) | 85 | 49 | 86 | 96 |
Decode is effectively CPU-bound at these settings, with all four systems between 76 and 79 fps on the processor. On the GPU side, the RTX PRO 1000 leads at 96 fps through CUDA, the two B390-class systems decode in the mid-80s over OpenCL, and the Radeon 890M trails at 49 fps.
Topaz Video AI
The Topaz Video AI benchmark measures AI video upscaling and frame-interpolation performance in frames per second across the application’s enhancement models, run here at 1080p input, where higher is better. The Dell Pro 5 14 was not tested with Topaz, and the 16X Slowmo Aion model failed to complete on the review unit, an error we also saw on the 5 16s Intel; both AMD Precision units ran it without issue.
| Topaz Video AI (fps) | Dell Pro Precision 5 14s Intel (Arc Pro B390) | Dell Pro Precision 5 14s AMD (Radeon 890M) | Lenovo ThinkPad P14s Gen 7 (RTX PRO 1000) |
| Artemis 1X / 2X / 4X | 6.22 / 5.28 / 1.89 | 3.75 / 2.24 / 0.79 | 5.17 / 3.19 / 1.12 |
| Iris 1X / 2X / 4X | 5.18 / 3.14 / 0.94 | 4.86 / 2.70 / 0.86 | 5.91 / 3.12 / 1.01 |
| Proteus 1X / 2X / 4X | 6.43 / 6.08 / 2.46 | 3.93 / 2.69 / 1.19 | 4.78 / 3.14 / 1.05 |
| Gaia 1X / 2X / 4X | 3.24 / 2.25 / 1.50 | 1.90 / 1.35 / 0.94 | 1.62 / 1.13 / 0.79 |
| Nyx 1X / 2X | 1.57 / 1.54 | 1.86 / 1.56 | 2.40 / 2.09 |
| Hyperion HDR 1X | 3.22 | 11.34 | 14.56 |
| 4X Slowmo Apollo / APFast | 8.57 / 22.13 | 6.05 / 17.72 | 10.39 / 29.94 |
| 16X Slowmo Aion | DNF | 9.13 | N/A |
The Arc Pro B390 won most of the upscaling models outright, including a wide lead in Proteus and Gaia, and even beat the RTX PRO 1000 in several. The pattern flips in Hyperion HDR and the interpolation models, where NVIDIA and AMD hold clear advantages, and the Aion failure on Intel graphics is worth watching for anyone whose pipeline depends on 16X slow motion.
UL Procyon AI Text Generation
The Procyon AI Text Generation Benchmark streamlines LLM performance testing by providing a concise, consistent evaluation method. It enables repeated testing across four local models, Phi, Mistral, Llama3, and Llama2, while minimizing the complexity of large models and the number of variables. Developed with AI hardware leaders, it optimizes the use of local AI accelerators to deliver more reliable, efficient performance assessments. All four systems ran the models through ONNX Runtime with DirectML on their GPUs.
| Procyon AI Text Generation | Dell Pro Precision 5 14s Intel (Arc Pro B390) | Dell Pro Precision 5 14s AMD (Radeon 890M) | Dell Pro 5 14 Intel (Arc B390) | Lenovo ThinkPad P14s Gen 7 (RTX PRO 1000) |
| Phi | 887 | 424 | 904 | 1,618 |
| Mistral | 646 | 396 | 716 | 1,397 |
| Llama3 | 674 | 352 | 708 | 1,252 |
| Llama2 | 786 | 379 | 641 | DNF |
The two B390-class systems hold a wide lead over the Radeon 890M across all four models, ranging from 63% in Mistral to more than double in Phi, and the review unit’s 64GB memory pool lets it finish Llama2 at 786, a model the 8GB RTX PRO 1000 could not load at all. For smaller models, the dGPU’s bandwidth still wins decisively.
UL Procyon AI Computer Vision
The Procyon AI Computer Vision Benchmark measures AI inference performance across CPUs, GPUs, and dedicated accelerators using a range of neural networks, evaluating tasks such as image classification, object detection, segmentation, and super-resolution with models including MobileNet V3, Inception V4, YOLO V3, DeepLab V3, Real ESRGAN, and ResNet 50. The WinML runs use float32 on CPU and GPU, giving a like-for-like view across vendors. We also run the newer Computer Vision 2 suite through each vendor’s native path: OpenVINO in int8 on the Intel NPU and fp16 on its iGPU, and Ryzen AI on the AMD NPU; those results are listed separately since precision and runtime differ by platform. Higher scores are better.
| Procyon AI Computer Vision (WinML) | Dell Pro Precision 5 14s Intel | Dell Pro Precision 5 14s AMD | Dell Pro 5 14 Intel | Lenovo ThinkPad P14s Gen 7 |
| CPU | 141 | 106 | 119 | 134 |
| GPU | 404 | 247 | 398 | 426 |
| Procyon AI Computer Vision 2 (native runtimes) | Dell Pro Precision 5 14s Intel | Dell Pro Precision 5 14s AMD |
| NPU (int8) | 1,647 | 1,176 |
| iGPU (fp16) | 1,517 | N/A |
In the vendor-neutral WinML view, the review unit leads on both CPU and lands within 5% of the ThinkPad’s dGPU on graphics. On the native path, Intel’s AI Boost NPU scored 1,647 in Computer Vision 2, 40% ahead of the Ryzen AI NPU, and notably, the B390 iGPU nearly matches the NPU while the NPU sips a fraction of the power.
UL Procyon AI Image Generation
The Procyon AI Image Generation Benchmark provides a consistent method for measuring AI inference performance from low-power NPUs to high-end GPUs, with three tests: Stable Diffusion XL FP16 for high-end GPUs, Stable Diffusion 1.5 FP16 for moderately powerful GPUs, and Stable Diffusion 1.5 INT8 for low-power devices. The benchmark uses the optimal inference path for each platform: OpenVINO on Intel systems, the AMD-optimized DirectML pipeline on Radeon, and TensorRT on NVIDIA GPUs. The INT8 test uses Intel’s quantized SD 1.5 model where supported; the AMD pipeline does not offer a comparable quantized run, so that cell is blank pending a supported path. New with this round, we also ran the INT8 workload on the Intel NPU.
| Procyon AI Image Generation | Dell Pro Precision 5 14s Intel (Arc Pro B390) | Dell Pro Precision 5 14s AMD (Radeon 890M) | Dell Pro 5 14 Intel (Arc B390) | Lenovo ThinkPad P14s Gen 7 (RTX PRO 1000) |
| SD 1.5 FP16 | 632 | 281 | 635 | 943 |
| SD 1.5 INT8 | 7,873 | N/A | 7,693 | 12,403 |
| SDXL FP16 | 731 | 197 | 646 | 765 |
| SD 1.5 INT8 NPU | 3,003 | N/A | N/A | N/A |
At 51.3 seconds per SDXL image, the review unit came within 5% of the RTX PRO 1000, a result that would have been hard to believe from integrated graphics a generation ago, and its SDXL score of 731 beat the Pro 5 14 by 13%. The NPU run is the first we have recorded on this workload; at 3,003, it delivers roughly 38% of the iGPU’s INT8 throughput while leaving the GPU free, a useful trade for background generation tasks. Note that scores are not comparable between the FP16 and INT8 rows since the workloads use different batch sizes and step counts.
SPECviewperf 15
SPECviewperf 15 measures graphics performance using viewsets derived from professional applications in CAD, 3D modeling, rendering, engineering, and medical visualization, replayed here at 1080p. Higher scores are better, although performance can vary considerably between applications and graphics architectures. The Catia-07 viewset failed to complete on the review unit across multiple runs, and Enscape-01 failed on the AMD Twin; we will update if new driver releases resolve either.
| SPECviewperf 15 (FHD) | Dell Pro Precision 5 14s Intel (Arc Pro B390) | Dell Pro Precision 5 14s AMD (Radeon 890M) | Dell Pro 5 14 Intel (Arc B390) | Lenovo ThinkPad P14s Gen 7 (RTX PRO 1000) |
| 3dsmax-08 | 19.51 | 26.30 | 20.21 | 28.20 |
| blender-01 | 21.55 | 23.01 | 21.19 | 40.69 |
| catia-07 | DNF | 22.70 | 10.27 | 43.36 |
| creo-04 | 63.57 | 49.27 | 32.53 | 107.59 |
| energy-04 | 38.07 | 29.51 | 10.78 | 45.79 |
| enscape-01 | 14.92 | DNF | 14.28 | 25.45 |
| maya-07 | 83.86 | 53.30 | 82.42 | 112.84 |
| medical-04 | 69.41 | 73.42 | 22.96 | 86.38 |
| snx-05 | 78.74 | 59.58 | 46.22 | 103.61 |
| solidworks-08 | 33.38 | 36.66 | 23.60 | 53.63 |
| unreal_engine-01 | 41.38 | 27.31 | 38.77 | 49.24 |
This table justifies the Pro in Arc Pro. The review unit beat the standard B390 by wide margins in the ISV viewsets that lean on certified driver paths, roughly doubling it in creo-04 and tripling it in energy-04 and medical-04, while the two trade places in the game-engine and DCC traces where certification matters less. The Radeon 890M wins a handful of viewsets, and the RTX PRO 1000 sweeps all eleven.
SPECworkstation 4
SPECworkstation 4 measures workstation performance across CPU, graphics, storage, AI, product design, engineering, financial services, and other professional workloads, using real applications grouped into seven industry verticals. Higher scores are better, and N/A means the system did not complete every workload required for that category. The NAMD workload failed repeatedly on the review unit, which also suppresses its Life Sciences vertical and CPU subsystem scores; the other three systems completed their runs, though the Pro 5 14’s HandBrake failure removes its Media and Entertainment vertical.
| SPECworkstation 4 | Dell Pro Precision 5 14s Intel | Dell Pro Precision 5 14s AMD | Dell Pro 5 14 Intel | Lenovo ThinkPad P14s Gen 7 |
| Hardware Subsystems | ||||
| Graphics | 2.70 | 2.57 | 1.68 | 4.51 |
| Accelerator | 2.29 | 2.22 | N/A | 3.26 |
| Storage | 1.70 | 0.93 | 1.76 | 1.67 |
| CPU | N/A | 1.15 | 1.19 | 1.35 |
| Industry Verticals | ||||
| AI & Machine Learning | 1.45 | 1.38 | 1.36 | 1.65 |
| Energy | 1.67 | 1.28 | 1.18 | 1.69 |
| Financial Services | 0.93 | 1.07 | 0.78 | 0.96 |
| Life Sciences | N/A | 1.41 | 1.34 | 1.82 |
| Media & Entertainment | 1.53 | 1.39 | N/A | 1.81 |
| Product Design | 1.80 | 1.34 | 1.64 | 1.89 |
| Productivity & Development | 1.32 | 1.03 | 1.10 | 1.34 |
The review unit’s Graphics and Accelerator subsystem scores clear the AMD twin and post the biggest gap over the standard Pro 5 14, again reflecting the Pro driver stack. It leads the Dell group in five of the six verticals it completed. The ThinkPad’s dGPU keeps it on top overall. The AMD unit’s 0.93 Storage score tracks with its slower Kioxia drive.
Conclusion
The Dell Pro Precision 5 14s Intel is the strongest 14-inch productivity laptop we have reviewed to date. It was the first system in this group to break 10,000 points in PCMark 10, led both Geekbench 6 and Geekbench 7 CPU tests, and still delivered 23 hours and 50 minutes in our Modern Office battery test. That runtime was second only to the lower-power Pro 5 14 and nearly eight hours longer than the ThinkPad P14s Gen 7.
The Arc Pro B390 gives this model its strongest advantage over the standard Pro 5 14, delivering roughly 75% more GPU compute performance and gains of about 2x to 3x across several certified ISV viewsets. It also finished within 5% of the RTX PRO 1000 in SDXL image generation. The system produced our first published NPU image generation result, while its 64GB shared memory pool allowed it to run larger local AI workloads that exceeded the ThinkPad’s 8GB VRAM capacity.
The $5,725.11 as-tested price is steep, especially compared with the $4,703.16 ThinkPad P14s Gen 7, whose discrete RTX PRO 1000 still leads in outright GPU performance. The AMD Precision 5 14s is also the better choice for thread-heavy rendering, compression, and calculation workloads, and it comes in at a slightly lower price.
At the same time, the Intel version offers stronger graphics acceleration, AI performance, battery life, and storage speeds. However, the CATIA, NAMD, and Topaz Aion scores make it a less certain choice for buyers who depend on those workloads. Dell’s commercial support, configuration options, and volume discounts may narrow the pricing gap for business customers, but this configuration makes the most sense for organizations that need long battery life, up to 64GB of shared memory, and certified workstation graphics in a compact 14-inch laptop.
For configuration options and current pricing, visit the Dell Pro Precision 5 Series 14S product page.
Leaderboard: The Dell Pro Precision 5 14s Intel is our Best Ultraportable Workstation on the Best Mobile Workstations leaderboard.
Leaderboard: The Dell Pro Precision 5 14s Intel holds the Best Without a Discrete GPU spot on the Best Laptops for Local AI leaderboard.



 Amazon