

The MSI EdgeMesa N AI+ is a 1.18-liter aluminum mini PC built on NVIDIA’s RTX Spark N1X, the 20-core Arm processor with a 6,144-core Blackwell RTX GPU that we had previously tested only in laptops. Our review unit carries 128GB of unified memory, a 4TB PCIe Gen5 SSD, 10GbE, and Windows 11 Pro. We ran it against ASUS’s 64GB ProArt GR1X, the other RTX Spark mini PC in our lab, and the fastest 128GB and 64GB RTX Spark laptops we have tested, to measure what a desktop chassis and a 240W power adapter add to the same silicon.
Key Takeaways
- The desktop chassis is worth 4 to 11 percent in sustained CPU work. The EdgeMesa held 7,276 points in the steady state of our 30-minute Cinebench 2026 loop, against 6,970 for the 128GB HP OmniBook Ultra 16 and 6,550 for the 64GB Dell XPS 16 Creator Edition. The ASUS ProArt GR1X mini PC held 7,306.
- The desktop chassis also ran cooler than the laptops on average. The CPU averaged 88.4C across the loop while both laptops sat at 97C, and in Blender it averaged 76.0C against 96.7C and 94.2C. Peak readings were higher on the MSI, reaching 107.3C in the loop, and the GR1X ran the same loop at an 83.3C average with an 88.7C peak.
- Concurrent LLM serving showed the widest gap over the laptops. With eight requests on Qwen3.8 27B, the EdgeMesa generated 39.8 tokens per second and the GR1X 40.0, against 33.8 and 31.9 on the laptops, while single-request results landed within 6 percent on every model.
- 128GB ran a larger model tier than the 64GB systems. Qwen-Image 20B at Q8 and a 35B coding-agent model both ran here at the default memory allocation, and the EdgeMesa completed the agent task on all three attempts in 145 seconds. Our suite ran neither on the 64GB GR1X and XPS 16.
- The 4TB Gen5 SSD keeps pace with the platform. It read at 13,315MB/s and wrote at 12,910MB/s on a 25GiB footprint, at least twice the rate of the 1TB Gen4 drive in the GR1X, and peaked at 62C.
MSI’s Edge AI PC Line Gets a Windows System
MSI sells the EdgeMesa N AI+ in its Edge AI PC category beside the EdgeXpert, a 1.2-liter desktop built on NVIDIA’s DGX Spark platform that ships with DGX OS, a 200GbE ConnectX-7 port for clustering, and 64GB or 128GB of memory. The EdgeMesa takes the Windows side of that line, with the RTX Spark N1X, Windows 11, and a port set built around a desk with up to four displays. MSI first showed it at Computex in June 2026 and describes it as a compact desktop for AI developers, software engineers, system integrators, and creators who want agents, RAG, and coding assistants running locally.
MSI’s product page credits the system with up to 1 petaFLOP of FP4 AI performance, support for 120B-parameter LLMs with up to 1M tokens of context, and 1440p gaming above 100 fps. The page does not list the models, quantization, or settings behind those figures. Our testing below measures token rates on models from 3B to 27B parameters and runs a 35B coding-agent model. Our Windows client suite tops out at that 35B agent model, and 120B-class models run only in our Linux suite, so the model-size claim went untested on this system.
The EdgeMesa N AI+ is bought as a fixed configuration, because its LPDDR5X is unified memory shared by the CPU and GPU and cannot be upgraded later. MSI lists up to 128GB of memory and a single NVMe SSD of up to 4TB, which is the configuration we tested, and its US store carries two versions under the X-005US and X-006US part numbers.
Build and Design
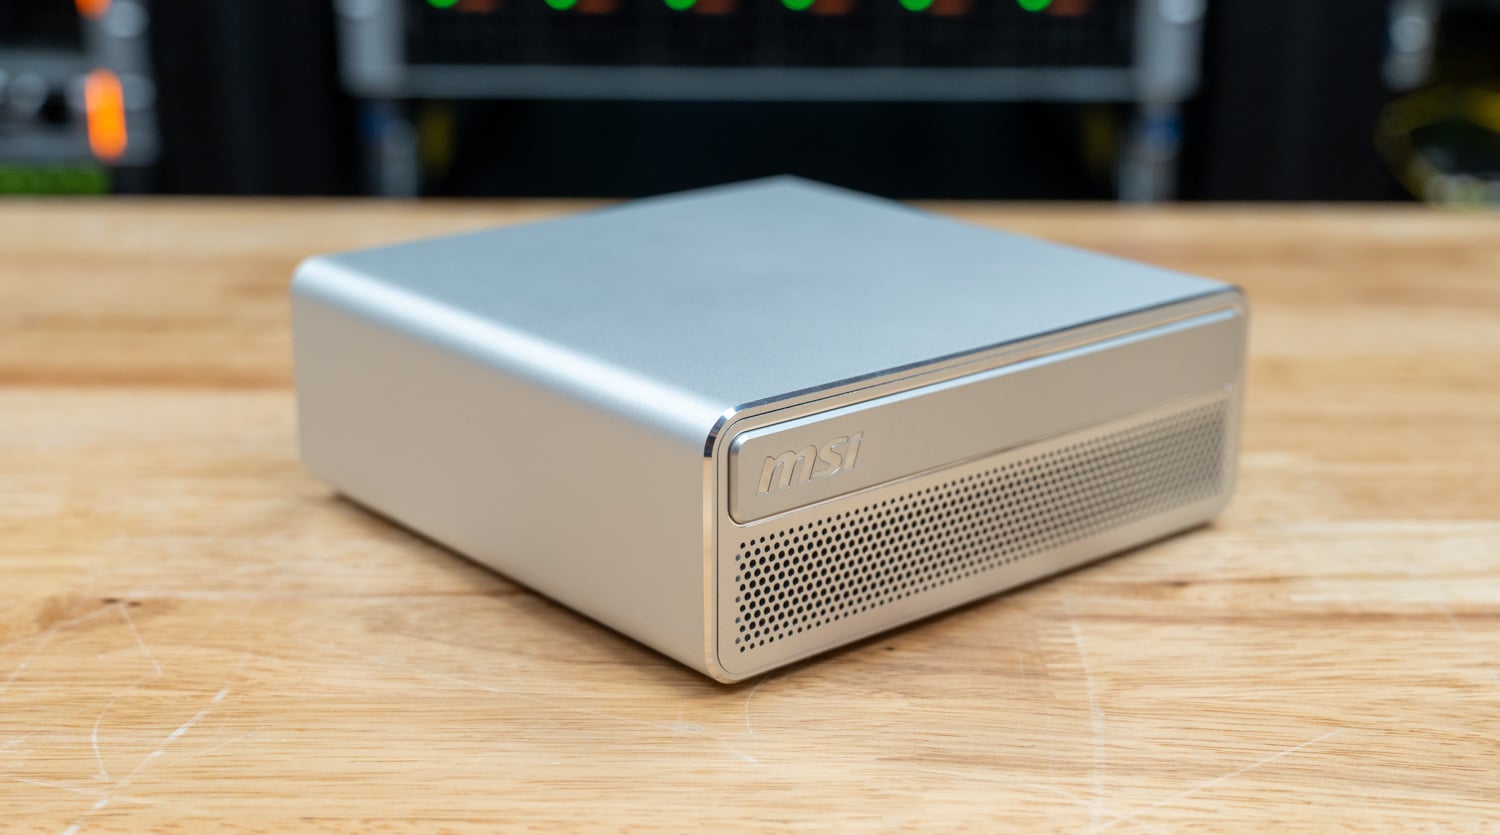
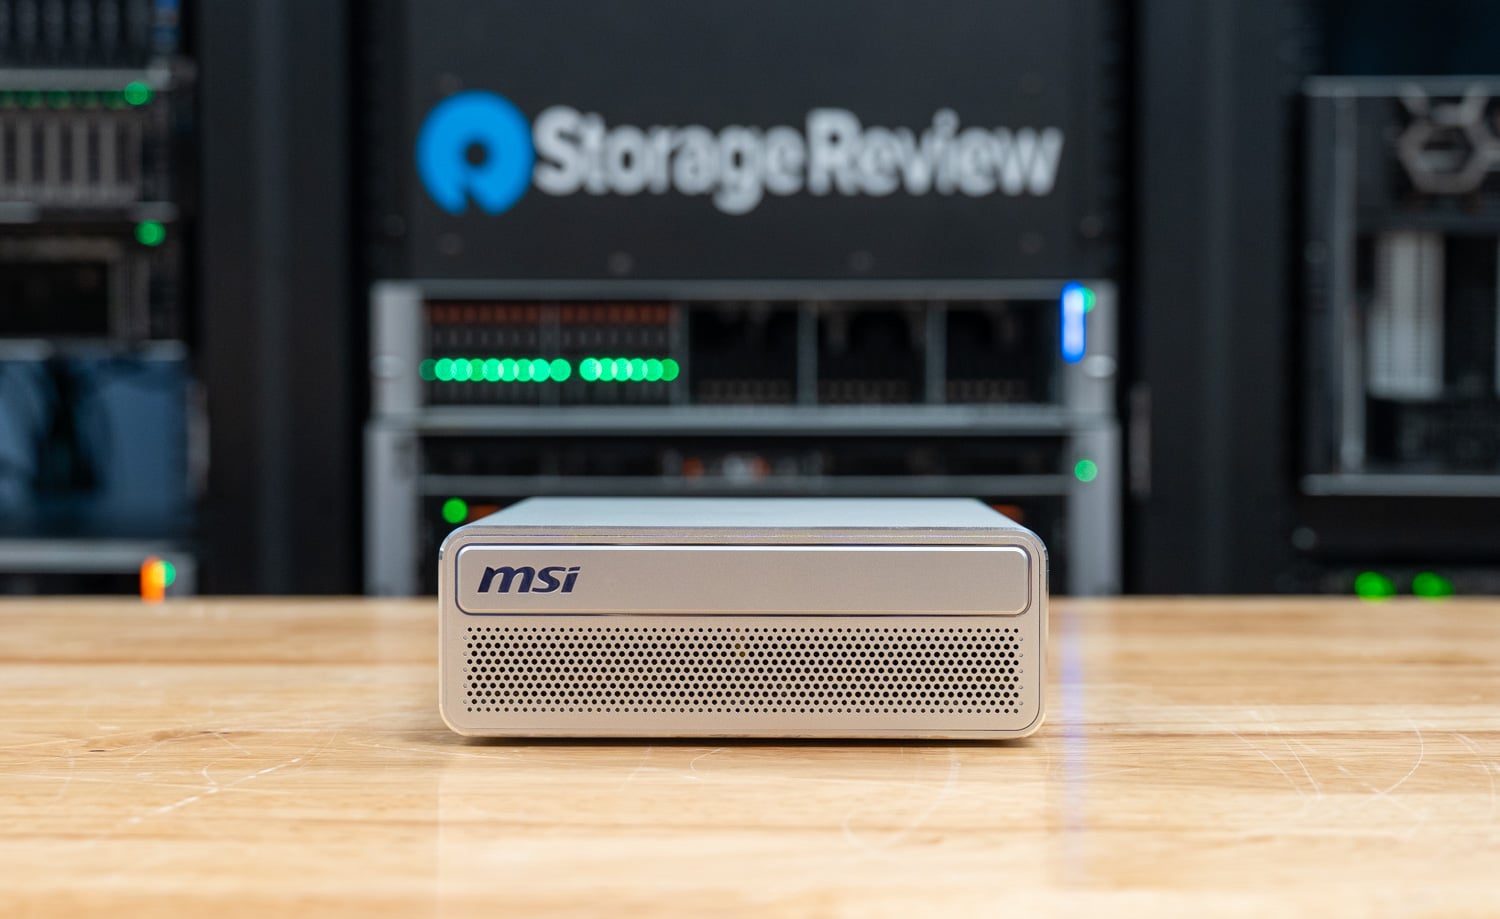
The EdgeMesa N AI+ uses an aluminum chassis with an anti-fingerprint finish. It measures 152 x 147 x 53mm and weighs 1.32kg, which works out to 1.18 liters, a little under the 1.3 liters MSI advertises and close to the company’s 1.2-liter EdgeXpert. The ASUS ProArt GR1X comes to 1.15 liters at 150 x 150 x 51mm, so the two RTX Spark mini PCs take up about the same space on a desk. The front is a perforated grille under an MSI badge with no ports or controls, the base is perforated across most of its area, and power comes from a 240W adapter.
Everything connects at the rear, where our unit has the power button, four USB Type-C ports at 20Gbps, one HDMI 2.1b output, one 10GbE RJ45 port, and a Kensington lock slot below a full-width vent. Three of the Type-C ports support DisplayPort 1.4 Alt Mode, and the fourth is the power input, so the system can drive up to four displays with HDMI in use. MSI lists wireless connectivity as Wi-Fi 7 and Bluetooth 5.4. There is no USB Type-A port and no audio jack, so a hub or dock is needed for most desks.

MSI calls the thermal design the AI Pulse Cooling System, a vapor chamber with two fans that the company rates to sustain 140W. With the outer shell removed, a fin stack runs the full width of the chassis behind the rear vent, above the port row. The XPS 16 Creator Edition fits the same chip into a 17.8mm chassis, so the cooler is where a mini PC should separate itself, and the sustained-load and thermal results later in this review test that.

Storage sits on a single M.2 NVMe slot inside the chassis. Reaching the SSD and other internals takes some effort, since the inner sled slides out of the outer case. From there, the drive sits under a thermal pad in a cutout of the inner frame, and the 4TB Samsung module in our unit is the short M.2 2242 format. That limits replacement options to 2242 drives, a smaller retail selection than the common 2280 length, and it makes the factory capacity choice more important. The ProArt GR1X takes the other approach, with two M.2 2280 slots in a 1.15-liter chassis.

MSI EdgeMesa N AI+ Specifications
| Specification | MSI EdgeMesa N AI+ |
|---|---|
| Platform | |
| Model | EdgeMesa N1x N AI+ (MS-B215) as tested |
| Processor | NVIDIA RTX Spark N1X 20-core Arm CPU (two classes of 10 cores) |
| Graphics | 6,144-core NVIDIA Blackwell RTX GPU, integrated Up to 1 petaFLOP FP4 (MSI) |
| Memory | Up to 128GB LPDDR5X unified memory 128GB LPDDR5X-9400 as tested |
| GPU Memory as Tested | 62.5GB dedicated, 47.9GB shared (default allocation) |
| Storage | 1x M.2 NVMe slot, up to 4TB 4TB Samsung MZALC4T0HBL1 (M.2 2242) on a PCIe Gen5 x4 link as tested |
| Operating System | Windows 11 Windows 11 Pro 26H1 as tested |
| Connectivity | |
| Rear Ports | 4x USB Type-C 20Gbps (3x with DisplayPort 1.4 alt mode, 1x power input) 1x HDMI 2.1b 1x 10GbE RJ45 Power button |
| Display Outputs | Up to four displays over HDMI and 3x USB Type-C |
| Networking | 10GbE Wi-Fi 7, Bluetooth 5.4 |
| Security | Kensington lock slot |
| Cooling, Power, and Chassis | |
| Cooling | AI Pulse Cooling System: vapor chamber, dual fans Rated to sustain 140W (MSI) |
| Power | 240W adapter |
| Dimensions | 152 x 147 x 53mm (5.98 x 5.79 x 2.09 in), 1.18L |
| Weight | 1.32kg (2.91 lb) |
| Chassis | Aluminum with anti-fingerprint finish |
Test Setup and Methodology
Our review unit is the MS-B215 with the RTX Spark N1X, 128GB of LPDDR5X-9400, and a 4TB Samsung SSD, running Windows 11 Pro 26H1 on Arm with the Best performance power mode. It was connected to a 4K external display for the run. As shipped, Windows presented 62.5GB of the unified memory to the GPU as dedicated memory, with another 47.9GB shared.
That memory is one physical pool, and Windows treats the GPU allocation as dedicated GPU memory and the remainder as system memory, which the GPU can spill into when it needs more. A slider in the NVIDIA app sets the allocation, the default sits close to an even split on the 64GB and 128GB systems here, and the app warns that minimum and maximum settings may cause issues. NVIDIA advises keeping the default unless a workload needs more, because a larger GPU share leaves less memory for Windows and other applications, and it recommends leaving at least 16GB for the CPU.
NVIDIA says agents and LLMs see little performance loss when they spill into system memory, and it suggests raising the allocation for image and video generation models that need more than the default provides. We test every system at its default, and our suite sizes its model tiers to the dedicated amount, so a model it skips on the 64GB systems may still run there with spillover or a larger allocation.
Results come from sr-client 1.13, our Windows client suite, which covers local AI, content creation, CPU, graphics, and storage. The AI tests use llama.cpp on CUDA for LLM serving and MLPerf Client, Ollama on CUDA for model loading, the coding agent, and RAG, and stable-diffusion.cpp on Vulkan for image generation. Each figure is the median of repeated passes, and where a test ran more than once, we report the newest valid result. Results the suite flagged for run-to-run variance or a failed pass carry an asterisk. We tested the two laptops earlier on sr-client 1.11.
The comparison set starts with the other RTX Spark mini PC in our lab, the ASUS ProArt GR1X, a 1.15-liter desktop with 64GB of memory and a 1TB Micron Gen4 SSD that ran the same sr-client 1.13 release. Beside it are the two fastest RTX Spark laptops we have tested at each memory size. The HP OmniBook Ultra 16 is the 128GB system and carries a 2TB Sandisk Gen5 SSD, and the Dell XPS 16 Creator Edition is the 64GB system with a 1TB SK hynix drive.
All four machines run the same 20-core N1X, and the two desktops run it at a higher power limit with larger coolers, so differences come down to power, cooling, memory capacity, and storage. The GR1X shows what a second desktop design does with the same chip, and the laptops show what the chassis is worth. An x64 build of Cinebench run under emulation crashed on all four, so we have no emulation results to report.
| Configuration | CPU | Memory | GPU Memory | Boot Drive | Operating System |
|---|---|---|---|---|---|
| MSI EdgeMesa N AI+ | NVIDIA RTX Spark N1X, 20 cores | 128GB LPDDR5X-9400 | 62.5GB dedicated | 4TB Samsung MZALC4T0HBL1, PCIe Gen5 | Windows 11 Pro 26H1 |
| ASUS ProArt GR1X | NVIDIA RTX Spark N1X, 20 cores | 64GB LPDDR5X-9400 | 30.5GB dedicated | 1TB Micron MTFDKBA1T0QGN, PCIe Gen4 | Windows 11 Pro 26H1 |
| HP OmniBook Ultra 16 | NVIDIA RTX Spark N1X, 20 cores | 128GB LPDDR5X-9400 | 62.5GB dedicated | 2TB Sandisk SN8050S, PCIe Gen5 | Windows 11 Pro 26H1 |
| Dell XPS 16 Creator Edition | NVIDIA RTX Spark N1X, 20 cores | 64GB LPDDR5X-9400 | 30.5GB dedicated | 1TB SK hynix PVC10 | Windows 11 Pro 26H1 |
Local AI Performance
LLM Serving
| LLM serving, llama.cpp CUDA, Q4_K_M (higher is better unless noted) | MSI EdgeMesa N AI+ (N1X, 128GB) | ASUS ProArt GR1X (N1X, 64GB) | HP OmniBook Ultra 16 (N1X, 128GB) | Dell XPS 16 Creator Edition (N1X, 64GB) |
|---|---|---|---|---|
| Ministral 3 3B, 1 request, output (tokens/s) | 58.1 | 58.4 | 57.5 | 57.8 |
| Ministral 3 3B, 4 requests, output (tokens/s) | 152.0 | 154.9 | 148.8 | 146.4 |
| Ministral 3 3B, 1 request, time to first token (ms, lower is better) | 566 | 557 | 607 | 669 |
| Ministral 3 8B, 1 request, output (tokens/s) | 42.5 | 42.7 | 41.5 | 40.6 |
| Ministral 3 8B, 4 requests, output (tokens/s) | 107.5 | 109.3 | 104.1 | 96.3 |
| Ministral 3 8B, 1 request, time to first token (ms, lower is better) | 1,343 | 1,331 | 1,554 | 1,794 |
| Qwen3.8 27B, 1 request, output (tokens/s) | 13.0 | 13.1 | 12.6 | 12.4 |
| Qwen3.8 27B, 4 requests, output (tokens/s) | 31.1 | 31.4 | 28.1 | 27.5 |
| Qwen3.8 27B, 8 requests, output (tokens/s) | 39.8 | 40.0 | 33.8 | 31.9 |
| Qwen3.8 27B, 1 request, time to first token (ms, lower is better) | 8,721 | 8,604 | 10,818 | 10,935 |
LLM serving runs each model through llama.cpp with one, four, and eight simultaneous requests, which is how a small team sharing one box would load it. With a single request, the four systems are within 6 percent of each other on every model, at 58.1 tokens per second for Ministral 3 3B, 42.5 for the 8B model, and 13.0 for Qwen3.8 27B on the EdgeMesa. One request leaves most of the chip idle, so cooling’s role is minimized.

The gap opens as requests stack up: at four requests on Qwen3.8 27B the EdgeMesa generated 31.1 tokens per second against 28.1 for the HP and 27.5 for the XPS 16, and at eight requests it reached 39.8 against 33.8 and 31.9, leads of 18 and 25 percent. Time to first token on that model was 8.7 seconds on the MSI and 10.8 to 10.9 seconds on the laptops. Ministral 3 8B at four requests showed a smaller version of the same pattern, at 107.5 tokens per second against 104.1 and 96.3.

The ProArt GR1X tracked the EdgeMesa at every step, with 31.4 tokens per second at four requests and 40.0 at eight on Qwen3.8 27B, 109.3 on Ministral 3 8B at four requests, and an 8.6-second first token on the 27B model. The two desktops finished within 2 percent of each other across the serving table, even though the GR1X has half the memory, because every model in that table fits on the 64GB system.
The serving table stops at the 27B class by design. Our Windows client suite, which every RTX Spark system here ran, does not include gpt-oss 120B or other models of that size. We test those in our Linux suite on larger unified-memory desktops and GPU workstations. MSI advertises support for 120B-parameter LLMs on this system, and that is a claim we did not test.
MLPerf Client v2.0
| MLPerf Client v2.0, llama.cpp CUDA (higher is better unless noted) | MSI EdgeMesa N AI+ (N1X, 128GB) | ASUS ProArt GR1X (N1X, 64GB) | HP OmniBook Ultra 16 (N1X, 128GB) | Dell XPS 16 Creator Edition (N1X, 64GB) |
|---|---|---|---|---|
| Llama 3.1 8B, time to first token (s, lower is better) | 0.25 | 0.24 | 0.28 | 0.31 |
| Llama 3.1 8B, token rate (tokens/s) | 56.3 | 56.8 | 56.5 | 55.7 |
| Phi-4-mini, time to first token (s, lower is better) | 0.11 | 0.11 | 0.13 | 0.14 |
| Phi-4-mini, token rate (tokens/s) | 96.8 | 96.3 | 97.0 | 96.2 |

MLPerf Client sends one prompt at a time, and the four systems tie on it. The EdgeMesa generated 56.3 tokens per second on Llama 3.1 8B and 96.8 on Phi-4-mini, compared with 56.8 and 96.3 for the GR1X, 56.5 and 97.0 for the HP, and 55.7 and 96.2 for the XPS 16. Time to first token was slightly shorter on the desktops (0.25 and 0.24 seconds for Llama 3.1 8B) than on the laptops (0.28 and 0.31 seconds). For a single user chatting with a small model, the mini PCs and the laptops deliver the same experience.
Model Loading and the Coding Agent
| Model loading and coding agent, Ollama CUDA | MSI EdgeMesa N AI+ (N1X, 128GB) | ASUS ProArt GR1X (N1X, 64GB) | HP OmniBook Ultra 16 (N1X, 128GB) | Dell XPS 16 Creator Edition (N1X, 64GB) |
|---|---|---|---|---|
| gpt-oss:20b cold load to first token (s, lower is better) | 7.00 | 10.94 | 6.70 | 7.73 |
| gpt-oss:20b warm load to first token (s, lower is better) | 3.96 | 3.68 | 3.68 | 3.69 |
| qwen3.6:35b cold load to first token (s, lower is better) | 8.32 | Not run | 9.33 | Not run |
| Agent, gpt-oss:20b 64K context, successful runs (of 3) | 2* | 1* | 2* | 3 |
| Agent, gpt-oss:20b 64K context, wall time (s, lower is better) | 294* | 154* | 216* | 360 |
| Agent, qwen3.6:35b 64K context, successful runs (of 3) | 3 | Not run | 1* | Not run |
| Agent, qwen3.6:35b 64K context, wall time (s, lower is better) | 145 | Not run | 1783* | Not run |
| Agent, qwen3.6:35b 64K context, generation rate (tokens/s) | 86.8 | Not run | 72.7 | Not run |
| Speedometer slowdown beside the agent (x, lower is better) | 1.78 | 1.79 | 2.35 | 2.79 |
*Flagged by the suite: at least one of the three agent runs did not pass all tests.
Cold loads track the SSD and the memory path more than the chassis. The EdgeMesa brought gpt-oss:20b from a cold start to its first token in 7.00 seconds, between the HP at 6.70 and the XPS 16 at 7.73, and loaded the 21GB qwen3.6:35b model in 8.32 seconds, compared with 9.33 for the HP. The GR1X took 10.94 seconds to load the gpt-oss:20b model from its Gen4 drive. The suite does not run the 35B model on the 64GB GR1X and XPS 16.
The coding agent instructs a model to write and test code over several rounds, three times per configuration. With qwen3.6:35b the EdgeMesa passed all three attempts in 145 seconds at 86.8 tokens per second, where the 128GB HP passed one of three and took 1,783 seconds. With gpt-oss:20b, the MSI passed two of three attempts, the GR1X one, and the XPS 16 all three, so pass counts on that model vary by run. Running Speedometer beside the agent slowed the browser by 1.78x on the MSI and 1.79x on the GR1X, against 2.35x and 2.79x on the laptops.
RAG
| RAG pipeline (higher is better unless noted) | MSI EdgeMesa N AI+ (N1X, 128GB) | ASUS ProArt GR1X (N1X, 64GB) | HP OmniBook Ultra 16 (N1X, 128GB) | Dell XPS 16 Creator Edition (N1X, 64GB) |
|---|---|---|---|---|
| Ingest, passages per second | 114.7 | 115.6 | 111.5 | 104.4 |
| Ingest, embedding rate (tokens/s) | 18,566 | 18,720 | 18,049 | 16,901 |
| Answer, generation rate (tokens/s) | 103.4 | 104.2 | 103.4 | 95.0 |
| Answer, time to first token p50 (s, lower is better) | 0.15 | 0.15 | 0.15 | 0.17 |
| Question-to-answer p50 (s, lower is better) | 0.23 | 0.22 | 0.23 | 0.25 |
The RAG test embeds a passage set, retrieves against it, and answers questions with phi4-mini. Ingest ran at 114.7 passages per second on the EdgeMesa, 3 percent ahead of the HP at 111.5 and 10 percent ahead of the XPS 16 at 104.4. Answer generation matched the HP at 103.4 tokens per second, with the XPS 16 at 95.0, and the median question was answered in 0.23 seconds on both 128GB systems. The GR1X was level with the EdgeMesa at 115.6 passages per second and 104.2 tokens per second. Retrieval-backed assistants at this scale run comfortably on any of the four.
Image Generation
| Image generation at 1024×1024, stable-diffusion.cpp Vulkan (higher is better unless noted) | MSI EdgeMesa N AI+ (N1X, 128GB) | ASUS ProArt GR1X (N1X, 64GB) | HP OmniBook Ultra 16 (N1X, 128GB) | Dell XPS 16 Creator Edition (N1X, 64GB) |
|---|---|---|---|---|
| FLUX.2 klein 4B Q4_0, images per minute | 9.95 | 10.07 | 11.01 | 11.17 |
| FLUX.2 klein 4B Q4_0, time per image (s, lower is better) | 6.03 | 5.96 | 5.45 | 5.37 |
| Z-Image Turbo 6B BF16, images per minute | 4.03 | 4.17 | 4.19 | 3.89 |
| Qwen-Image 20B Q4_0, images per minute | 0.53 | 0.53 | 0.50 | 0.49 |
| Qwen-Image 20B Q8_0, images per minute | 0.51 | Not run | 0.47 | Not run |

Image generation is the one AI test where the EdgeMesa trailed the laptops. FLUX.2 klein 4B at Q4 produced 9.95 images per minute here, compared with 11.01 on the HP and 11.17 on the XPS 16, while Z-Image Turbo 6B at BF16 landed between the two laptops at 4.03. These tests ran through Vulkan, and the laptops ran an earlier release of our suite. The GR1X ran the current release and produced 10.07 images per minute on FLUX.2, level with the EdgeMesa, which suggests the suite release is the source of the gap.
Qwen-Image 20B ran at Q4 on all four systems at about half an image per minute, and its larger Q8 version ran on the two 128GB machines, at 0.51 images per minute on the EdgeMesa and 0.47 on the HP. The BF16 version is reserved for the suite’s workstation tier and did not run on any of them. The FLUX.2 klein Q8 and BF16 runs on the EdgeMesa completed one pass where the suite expects more, so we left them out of the table.
CPU Performance
Cinebench 2026 and the 30-Minute Loop
| Cinebench 2026 (points, higher is better unless noted) | MSI EdgeMesa N AI+ (N1X, 128GB) | ASUS ProArt GR1X (N1X, 64GB) | HP OmniBook Ultra 16 (N1X, 128GB) | Dell XPS 16 Creator Edition (N1X, 64GB) |
|---|---|---|---|---|
| Single core | 548 | 553 | 561 | 565 |
| Multi core | 7,284 | 7,304 | 7,001 | 6,631 |
| 30-minute loop, first pass | 7,219 | 7,256 | 7,014 | 6,539 |
| 30-minute loop, steady state | 7,276 | 7,306 | 6,970 | 6,550 |
| Steady state / first pass | 1.008 | 1.007 | 0.994 | 1.002 |
| Loop CPU temperature, mean (C) | 88.4 | 83.3 | 97.4 | 97.3 |
| Loop CPU temperature, max (C) | 107.3 | 88.7 | 98.2 | 98.3 |
| Steady-state CPU clock, mean (MHz) | 3,372 | 3,385 | 3,239 | 3,083 |

Cinebench isolates the chassis better than any other test in the suite, and in a single Cinebench 2026 multi-core run the EdgeMesa scored 7,284 points, 4 percent ahead of the HP at 7,001 and 10 percent ahead of the XPS 16 at 6,631, with the GR1X level at 7,304. Single-core scores went the other way by a small margin, at 548 on the EdgeMesa and 553 on the GR1X against 561 and 565, which fits a test that loads one core and never stresses the cooler.
Our sustained test loops the multi-core render for 30 minutes and compares the steady state with the first pass. All four systems held their first-pass score, so none of them throttled, and the desktops settled above the laptops. The EdgeMesa held 7,276 points at a 3,372MHz mean clock, and the GR1X held 7,306 at 3,385MHz, while the HP held 6,970 at 3,239MHz and the XPS 16 held 6,550 at 3,083MHz.
Temperatures in the loop separated all three chassis types. The laptops ran it at a 97C mean, pinned at their 98C ceiling, while the MSI averaged 88.4C with peaks to 107.3C. The GR1X ran the same loop at a slightly higher clock and averaged 83.3C, 5C below the EdgeMesa, with a peak of 88.7C. Both desktops delivered the same sustained score, and the ASUS cooler did it with more margin under the chip’s limit.
7-Zip, Blender, HandBrake, and LLVM
| Content creation and build (higher is better unless noted) | MSI EdgeMesa N AI+ (N1X, 128GB) | ASUS ProArt GR1X (N1X, 64GB) | HP OmniBook Ultra 16 (N1X, 128GB) | Dell XPS 16 Creator Edition (N1X, 64GB) |
|---|---|---|---|---|
| 7-Zip, all threads, total (GIPS) | 152.6 | 153.8 | 150.6 | 147.0 |
| 7-Zip, one thread, total (GIPS) | 8.92 | 8.92 | 9.10 | 9.13 |
| Blender 4.5 Monster (samples/min) | 215.1 | 215.6 | 211.4 | 198.9 |
| Blender 4.5 Junkshop (samples/min) | 129.7 | 127.2 | 127.7 | 119.1 |
| Blender 4.5 Classroom (samples/min) | 95.7 | 95.7 | 92.8 | 86.7 |
| HandBrake x265 (fps) | 43.7 | 44.1 | 40.6 | 38.8 |
| HandBrake SVT-AV1 (fps) | 16.3 | 16.4 | 15.4 | 14.0 |
| LLVM build (s, lower is better) | 217 | 225 | 218 | 232 |

The all-core application tests repeat the Cinebench pattern at different sizes. 7-Zip, which relies as much on memory as clock speed, showed the smallest spread at 152.6 GIPS, compared with 150.6 and 147.0. Blender’s Monster scene rendered at 215.1 samples per minute on the EdgeMesa, 2 percent ahead of the HP and 8 percent ahead of the XPS 16, and the Classroom scene widened those leads to 3 and 10 percent. The GR1X landed within 1 percent of the EdgeMesa in 7-Zip and in the Monster and Classroom scenes, and 2 percent behind it in Junkshop.

Video encoding gave the mini PC its largest application lead. HandBrake’s x265 encode ran at 43.7 fps against 40.6 on the HP and 38.8 on the XPS 16, leads of 8 and 13 percent, and SVT-AV1 ran at 16.3 fps against 15.4 and 14.0. The GR1X encoded at 44.1 and 16.4 fps, level with the EdgeMesa. The LLVM build finished in 217 seconds on the MSI, level with the HP at 218, 8 seconds ahead of the GR1X, and 15 seconds ahead of the XPS 16. One-thread 7-Zip slightly favored the laptops at 9.10 and 9.13 GIPS against 8.92 on both desktops.

Stockfish, primesieve, Python, and the Browser
| Compute and web (higher is better unless noted) | MSI EdgeMesa N AI+ (N1X, 128GB) | ASUS ProArt GR1X (N1X, 64GB) | HP OmniBook Ultra 16 (N1X, 128GB) | Dell XPS 16 Creator Edition (N1X, 64GB) |
|---|---|---|---|---|
| Stockfish, one thread (Mnps) | 1.70 | 1.70 | 1.73 | 1.74 |
| Stockfish, all threads (Mnps) | 14.42 | 15.13 | 15.19 | 13.87 |
| primesieve to 10^12, all threads (s, lower is better) | 9.40 | 9.39 | 9.53 | 10.39 |
| primesieve to 10^11, one thread (s, lower is better) | 12.33 | 12.35 | 12.02 | 12.03 |
| PyPerformance go (ms, lower is better) | 113.8 | 113.8 | 111.2 | 111.6 |
| PyPerformance nbody (ms, lower is better) | 82.5 | 82.5 | 80.4 | 80.8 |
| Speedometer 3.1 (score) | 34.7 | 34.3 | 34.8 | 36.5 |
Short and lightly threaded tests show no chassis effect. Stockfish, in all threads, ran at 14.42 Mnps on the EdgeMesa, between the HP at 15.19 and the XPS 16 at 13.87, and primesieve to 10^12 finished in 9.40 seconds, compared with 9.53 and 10.39. The GR1X ran Stockfish at 15.13 Mnps and primesieve in 9.39 seconds. The single-thread Python tests and Speedometer 3.1 were within a few percent across the four, with the XPS 16 slightly ahead in the browser at 36.5 against 34.7. Everyday responsiveness is the same on the desktops and the laptops.
GROMACS, OpenBLAS, and Memory
| HPC kernels and memory (higher is better unless noted) | MSI EdgeMesa N AI+ (N1X, 128GB) | ASUS ProArt GR1X (N1X, 64GB) | HP OmniBook Ultra 16 (N1X, 128GB) | Dell XPS 16 Creator Edition (N1X, 64GB) |
|---|---|---|---|---|
| GROMACS benchMEM (ns/day) | 17.43 | 17.48 | 17.48 | 17.41 |
| OpenBLAS DGEMM, all cores (GFLOPS) | 361.0 | 356.8 | 374.0 | 354.6 |
| OpenBLAS LU solve N=20000, all cores (GFLOPS) | 318.5 | 320.6 | 321.9 | 314.9 |
| STREAM Triad (MB/s) | 122,423 | 124,529 | 120,783 | 122,872 |
| Memory latency, 4KiB pages (ns, lower is better) | 143.0 | 141.0 | 143.6 | 140.5 |
The memory subsystem is identical across the four machines, and the numbers reflect that. STREAM Triad measured 122,423MB/s on the EdgeMesa and 124,529 on the GR1X, compared with 120,783 and 122,872 on the laptops. Memory latency on 4KiB pages ranged from 140.5ns to 143.6ns. GROMACS benchMEM landed within 0.4 percent across all four at about 17.4 ns/day, and the OpenBLAS DGEMM and LU results were within 6 percent, with the HP slightly ahead. Bandwidth-bound work gains nothing from the larger cooler.
Graphics and GPU Encoding
| Graphics and GPU encode (higher is better) | MSI EdgeMesa N AI+ (N1X, 128GB) | ASUS ProArt GR1X (N1X, 64GB) | HP OmniBook Ultra 16 (N1X, 128GB) | Dell XPS 16 Creator Edition (N1X, 64GB) |
|---|---|---|---|---|
| SuperTuxKart 1080p, average FPS | 269.8 | 274.0 | 269.7 | 248.6 |
| SuperTuxKart 1080p, typical FPS | 270 | 275 | 271 | 250 |
| SuperTuxKart 1080p, mostly stable FPS | 232 | 238 | 236 | 214 |
| SuperTuxKart 1080p, steady FPS | 134 | 136 | 141 | 131 |
| SuperTuxKart 4K, average FPS | 111.8 | 114.1 | Not run | Not run |
| FFmpeg HEVC Media Foundation (fps) | 54 | 65 | 53 | 61 |
SuperTuxKart at its ultra preset averaged 269.8 fps at 1080p on the EdgeMesa, level with the HP at 269.7 and ahead of the XPS 16 at 248.6, and it averaged 111.8 fps at 4K on our external display, a resolution the laptops did not run. The GR1X averaged 274.0 fps at 1080p and 114.1 fps at 4K. FFmpeg’s hardware HEVC encode through Media Foundation ran at 54 fps, matching the HP at 53, with the XPS 16 at 61 and the GR1X at 65. The hevc_nvenc encoder was not available in the FFmpeg build the suite uses on Arm.
Thermals Under Load
| CPU temperature, mean / max (C, lower is better) | MSI EdgeMesa N AI+ (N1X, 128GB) | ASUS ProArt GR1X (N1X, 64GB) | HP OmniBook Ultra 16 (N1X, 128GB) | Dell XPS 16 Creator Edition (N1X, 64GB) |
|---|---|---|---|---|
| Cinebench 2026 | 69.0 / 93.4 | 65.3 / 103.8 | 83.3 / 98.2 | 90.5 / 98.3 |
| Cinebench 30-minute loop | 88.4 / 107.3 | 83.3 / 88.7 | 97.4 / 98.2 | 97.3 / 98.3 |
| 7-Zip | 62.2 / 81.2 | 55.4 / 74.4 | 78.2 / 97.7 | 81.2 / 98.0 |
| Blender 4.5 | 76.0 / 87.7 | 70.0 / 81.9 | 96.7 / 98.3 | 94.2 / 98.3 |
| LLVM build | 70.5 / 85.9 | 67.2 / 79.2 | 91.6 / 98.1 | 92.9 / 98.2 |
| HandBrake | 74.1 / 90.9 | 66.5 / 87.9 | 87.5 / 97.9 | 90.3 / 98.4 |
| Stockfish | 84.5 / 105.3 | 80.8 / 88.6 | 97.4 / 98.4 | 97.6 / 98.3 |
| LLM serving | 85.0 / 95.0 | 73.4 / 88.4 | 81.0 / 92.9 | 94.0 / 97.8 |
| Image generation | 82.3 / 89.3 | 63.9 / 72.7 | 81.9 / 94.3 | 91.8 / 97.1 |
| RAG | 76.2 / 89.7 | 65.3 / 72.5 | 88.9 / 93.4 | 93.2 / 96.8 |

The desktop cooler shows most clearly in mean temperature, where both laptops ran every all-core CPU test against their 98C ceiling, with means of 92C to 97C in Blender, the LLVM build, and the 30-minute loop. The EdgeMesa averaged 76.0C in Blender, 70.5C in the LLVM build, and 69.0C in the single Cinebench run, 14C to 22C below the laptops while finishing the same work sooner. That headroom is what lets it hold a higher clock.
The ProArt GR1X ran cooler again at the same throughput. Its mean CPU temperature was 3C to 8C below the EdgeMesa in the seven CPU tests in the table, at 70.0C in Blender and 67.2C in the LLVM build, and 11C to 18C below it in LLM serving, RAG, and image generation. Its peaks stayed under 90C in nine of the ten tests. Mean temperature under load is the largest difference between the two desktops in our data.
Peak readings are less tidy because the EdgeMesa logged maximums above the laptops’ ceiling in three tests: 105.3C in Stockfish, 107.3C in the 30-minute loop, and a single 124.7C sample in MLPerf Client, against a 70.4C mean for that test, which reads as a sensor spike. In GPU-heavy LLM serving, its 85.0C mean sat between the HP at 81.0C and the XPS 16 at 94.0C. The SSD stayed at 62C or below through the storage test.
Storage Performance
| fio, 25GiB footprint (higher is better) | MSI EdgeMesa N AI+ (N1X, 128GB) | ASUS ProArt GR1X (N1X, 64GB) | HP OmniBook Ultra 16 (N1X, 128GB) | Dell XPS 16 Creator Edition (N1X, 64GB) |
|---|---|---|---|---|
| Sequential read 128K (MB/s) | 13,315 | 6,511 | 13,598 | 6,502 |
| Sequential write 128K (MB/s) | 12,910 | 5,235 | 11,899 | 5,670 |
| Random read 4K, QD32 x 4 jobs (IOPS) | 331,187 | 552,652 | 449,043 | 300,063 |
| Random write 4K, QD32 x 4 jobs (IOPS) | 386,814 | 143,165 | 234,888 | 256,856 |

The 4TB Samsung drive in our unit links at PCIe Gen5 x4 and delivers Gen5 sequential speeds, at 13,315MB/s read and 12,910MB/s write on the 25GiB footprint. That matches the 2TB Sandisk Gen5 drive in the HP at 13,598 and 11,899MB/s and doubles the Gen4 drives in the GR1X at 6,511 and 5,235MB/s and the XPS 16 at 6,502 and 5,670MB/s. For a system that will hold multiple multi-gigabyte model files, both capacity and read speed matter, and the model-load results above reflect that.

Random performance at queue depth 32 across four jobs was mixed. The EdgeMesa wrote at 386,814 IOPS, well ahead of the HP at 234,888 and the XPS 16 at 256,856, and read at 331,187 IOPS, behind the HP at 449,043 and ahead of the XPS 16 at 300,063. The current suite also records a peak across queue depths, where the Samsung drive reached 674,013 IOPS read and 608,063 IOPS write. The Micron drive in the GR1X led the group in random reads at 552,652 IOPS and trailed it in writes at 143,165. The Samsung drive peaked at 62C during the test.
Conclusion
The MSI EdgeMesa N AI+ is a desktop RTX Spark system that answers the question of whether leaving the laptop chassis buys anything. In our testing, it does once the load is sustained: 4 to 11 percent more multi-core throughput than the fastest N1X laptops, 8 to 13 percent in x265 encoding, and 18 to 25 percent more output when eight requests hit a 27B model, all at lower average temperatures. Single-request AI work and short tasks run essentially the same on all four.

The ability to run larger models with more KV cache is why you’d choose the 128GB model over a smaller one, which is a consistent theme with all of these local AI systems. It ran Qwen-Image at Q8 and a 35B coding-agent model that our suite didn’t run on the 64GB RTX Spark systems, and its 4TB Gen5 SSD gives those models room and fast load times. The larger memory footprint will still load bigger models, though token rates fall as model size grows. The limits are peak CPU readings above 100C in a few tests and a single M.2 2242 slot.
Against the ASUS ProArt GR1X, the other RTX Spark mini PC we tested, performance is a tie, with the two within 2 percent of each other in the Cinebench loop, Blender, x265 encoding, and LLM serving. The main differences are cooling and storage expansion: the GR1X runs 3C to 8C cooler on average during CPU workloads and offers two M.2 2280 slots where the EdgeMesa has a single M.2 2242 slot. Our EdgeMesa carried twice the memory and a 4TB Gen5 SSD, and those two parts decided how quickly models loaded and which model tiers our suite ran on each unit.
Within MSI’s line, the EdgeMesa is the choice for developers and creators who work in Windows and want the RTX Spark platform at a desk with a 10GbE link and four displays, where the EdgeXpert remains the DGX OS system for clustering and Linux-first deployment. Compared with the laptops, the EdgeMesa offers better sustained performance and lower average temperatures but trades portability. Either way, customers have more options than ever for local AI work, and it’s great to see the Windows ecosystem growing to make these platforms more accessible to a broad audience.



 Amazon