

The most common question we got about the MSI XpertStation WS300 after our review coalesces around one key theme. The GB300 Grace Blackwell Ultra Superchip is a 1,300W part that normally lives in a liquid-cooled rack, so what happens to thermals when you put it in a tower? The concern is fair: a GB300 system that hits its thermal limit will shed performance, and a system that throttles under sustained inference isn’t delivering what it was bought for. In our review, we said the WS300 stayed cool and stable through testing. The why is in MSI’s own cooling design data, paired here with the thermal, power, and clock traces we logged during a run on the system.
What the Loop Has to Do
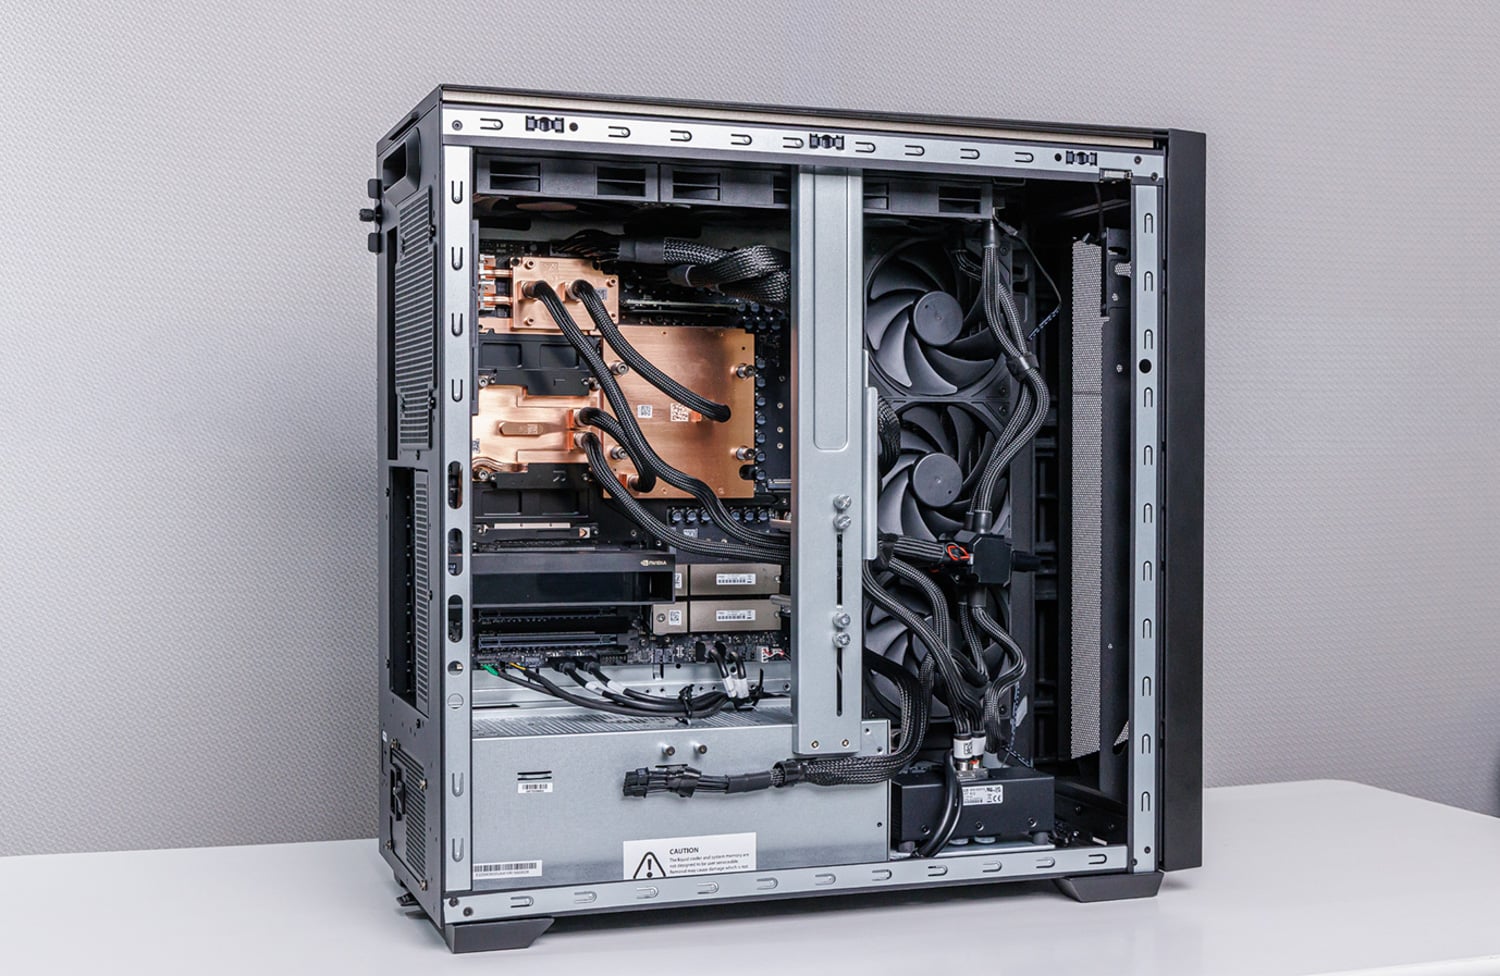
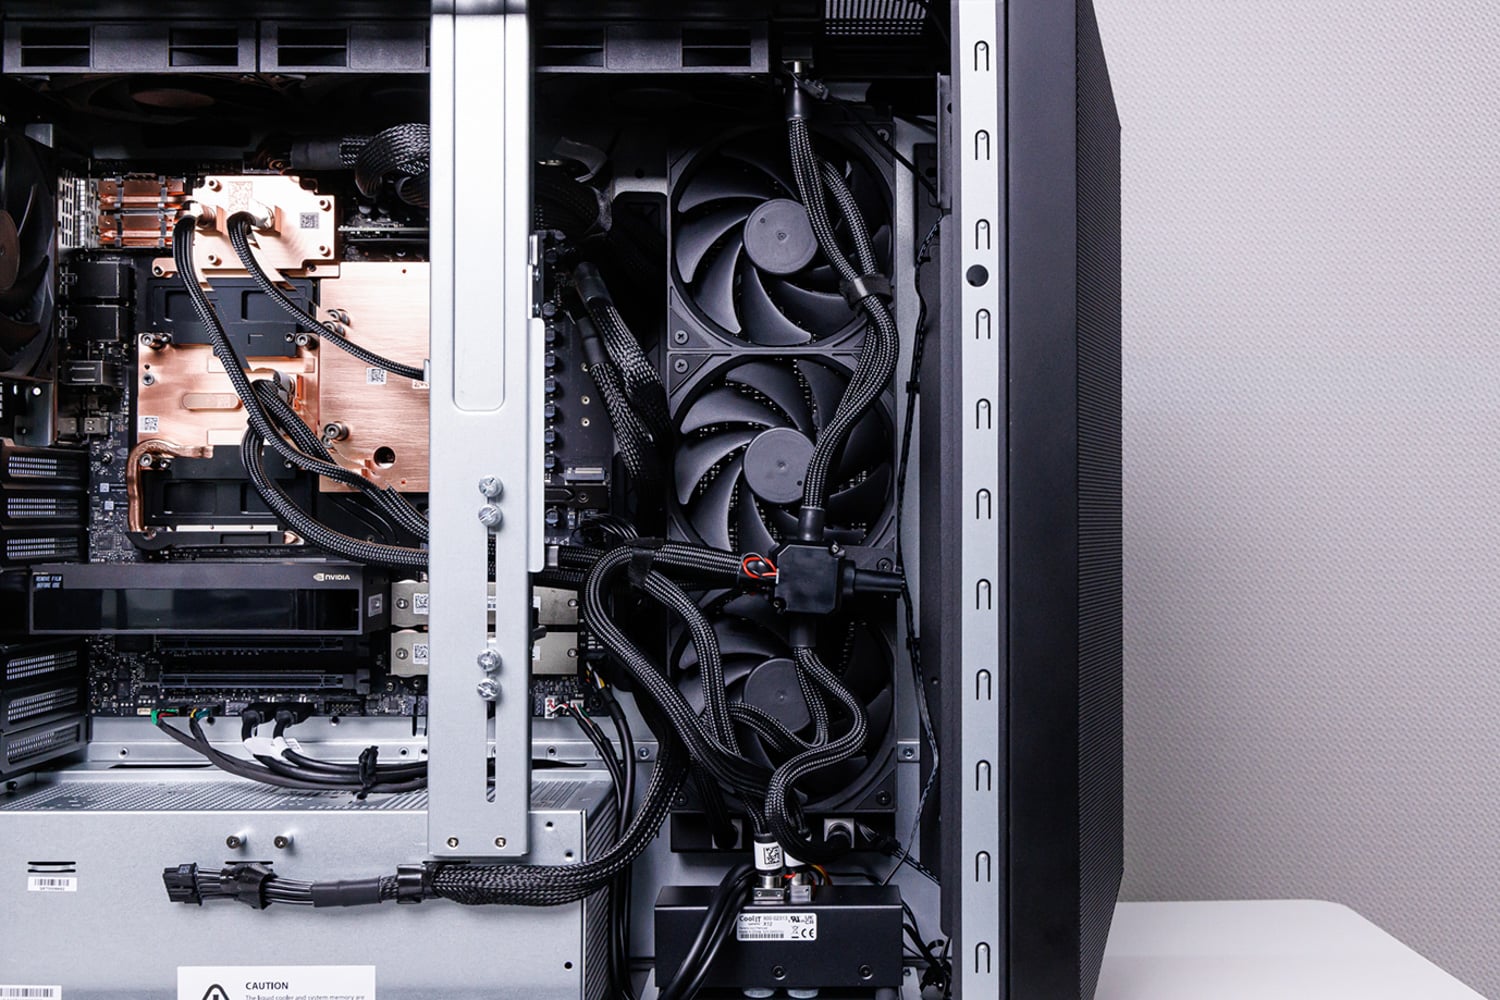
The thermal budget on a DGX Station is set by NVIDIA; the GB300 module carries a 1,300W SuperChip power limit, and the whole system runs from a single 1,600W power supply that also has to feed storage, pumps, fans, and any optional RTX PRO card. Nearly all of that 1,300W ends up as heat in four places: the Blackwell Ultra GPU and its 252GB of HBM3e, the 72-core Grace CPU, 496GB of memory across four SOCAMM LPDDR5X modules, and the ConnectX-8 SuperNIC with its two 400GbE optical ports. MSI puts cold plates on all four, and the loop runs through two 360mm radiators with six 120mm fans. A separate 120mm chassis fan moves air through the rest of the case for the SSDs and other air-cooled parts. MSI rates the assembly for 1,400W across the CPU and GPU, roughly 100W above what NVIDIA lets the Superchip draw.
That 100W of margin is a design decision that matters quite a bit. A loop rated only for the nominal load has no room for a warm office, a dusty radiator, or a fan running below full speed. A loop with headroom above the power limit means the silicon reaches its power cap before it reaches its thermal cap.
MSI’s Cold Plate Data
MSI shared the characterization data behind the loop with us. The company calls the methodology CIT, for Component Integrity Test, and labels the curves empirical: they were measured on the bench across repeated pressure and thermal cycles. The first chart is the one a thermal engineer cares most about. It plots thermal resistance in degrees C per watt for the GPU and CPU cold plates against coolant flow rate, along with the pressure drop each plate imposes on the pump.
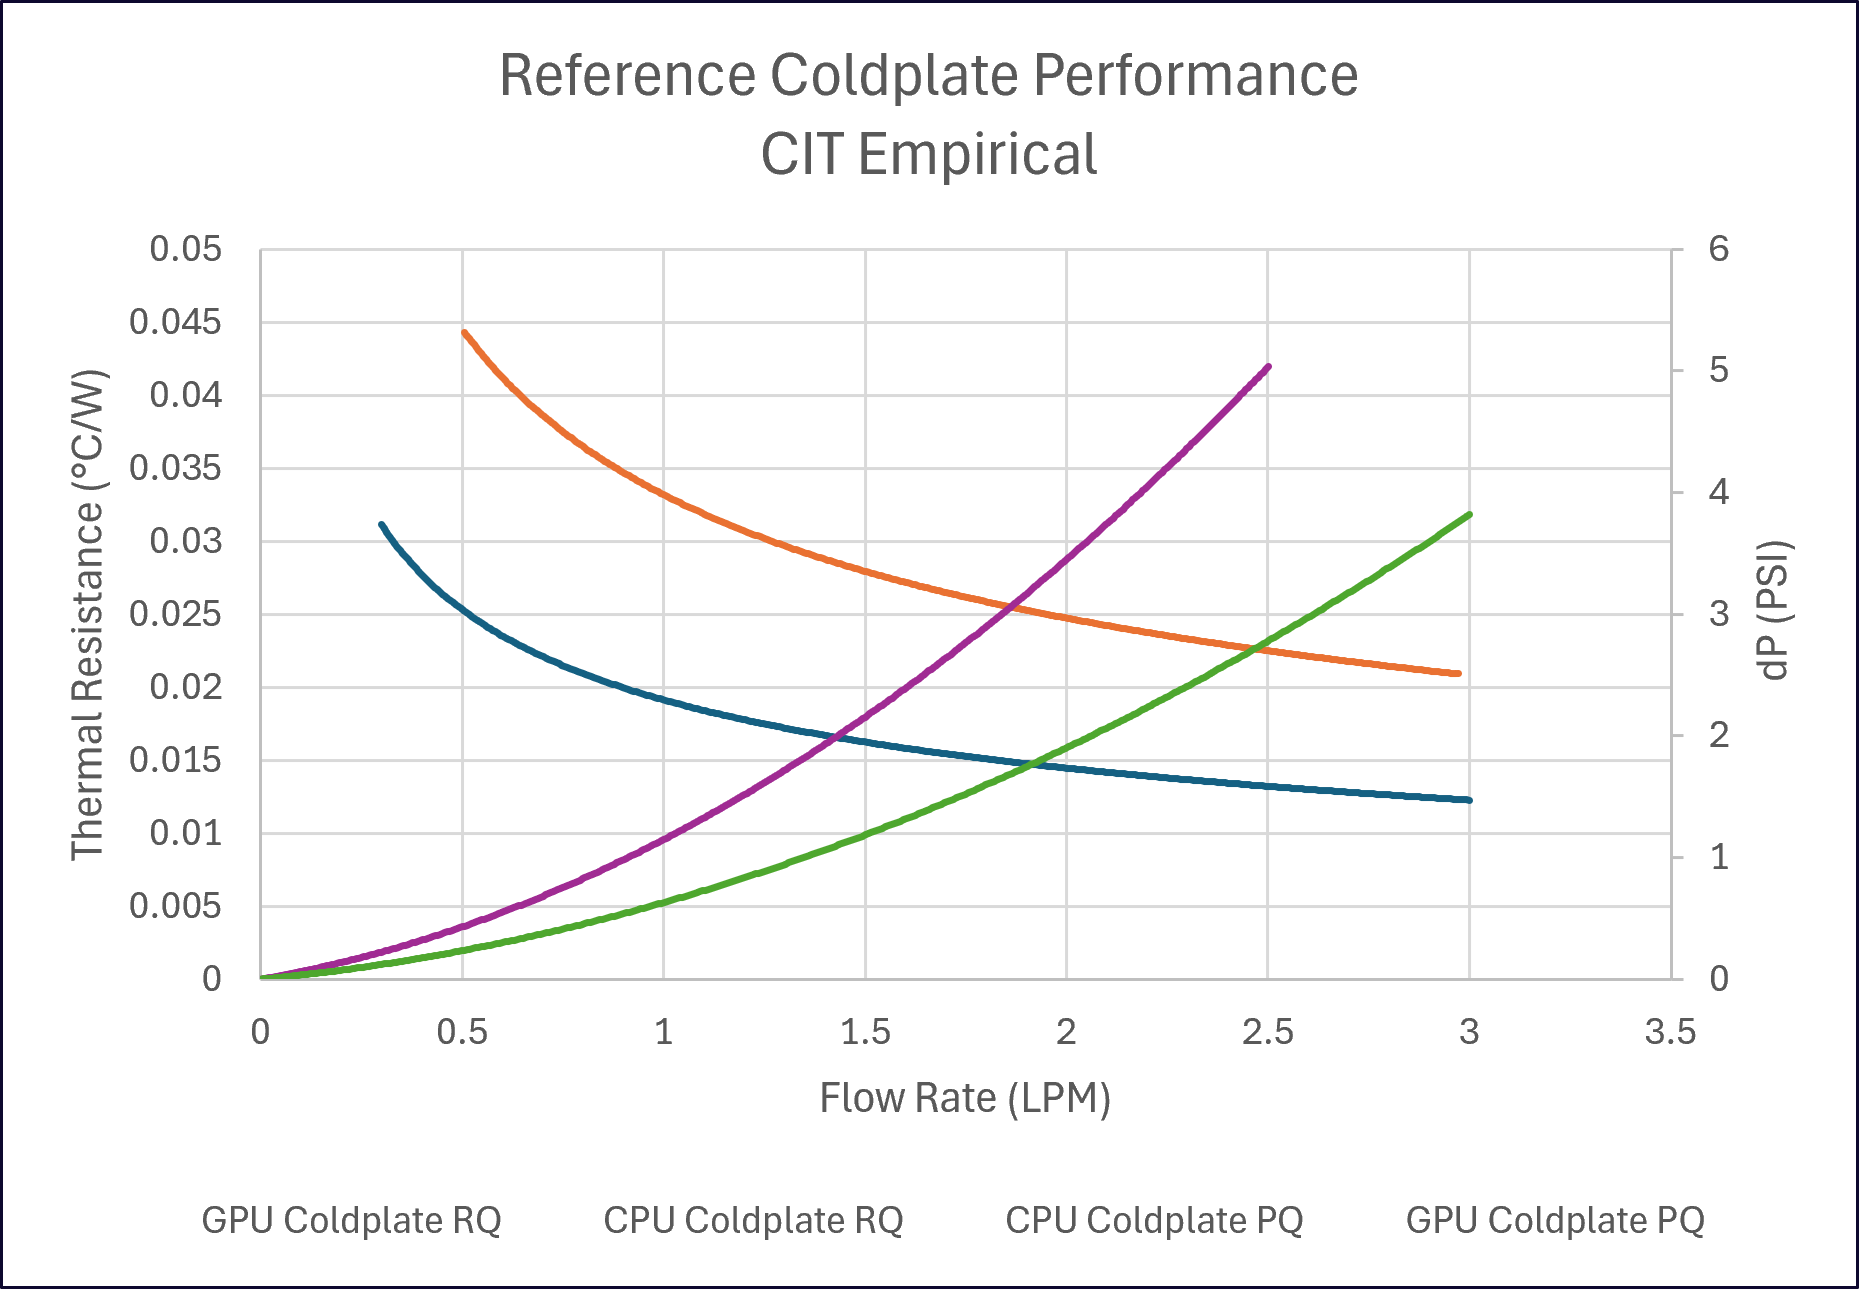
The GPU plate starts near 0.031 C/W at a trickle of 0.3 liters per minute and drops steeply as flow increases, reaching about 0.017 C/W at 1.5 LPM and 0.012 C/W at 3 LPM. The CPU plate, which covers a much lower-power part, sits higher, around 0.028 C/W at 1.5 LPM. Thermal resistance is the multiplier that turns watts into degrees: at 1.5 LPM, every 100W through the GPU plate costs about 1.7C of rise between the coolant and the plate. Push 1,000W through it, and the plate runs about 17C above the water. The tradeoff is pressure drop, which climbs with the square of flow. At 1.5 LPM, the GPU plate costs the pump about 1.1 PSI and the CPU plate about 1.9 PSI. The curves flatten past 2 LPM, which is why the loop is designed to run in the 1.5 to 2 LPM range; higher flow buys a diminishing thermal return for a steep pump cost.
Radiators, Fans, and the Noise Trade-off
The second set of charts covers the other end of the loop. ATD is the term for Ambient Temperature Difference, the rise of the coolant above room air after it leaves the radiators. It’s the number that sets the floor for every component temperature in the system, since nothing on the loop can run cooler than the water feeding it. MSI plots ATD against heat load for the pair of 360mm radiators at flow rates from 1 to 2 LPM, once with the six fans at 100 percent PWM (pulse-width modulation) and once at 60 percent.
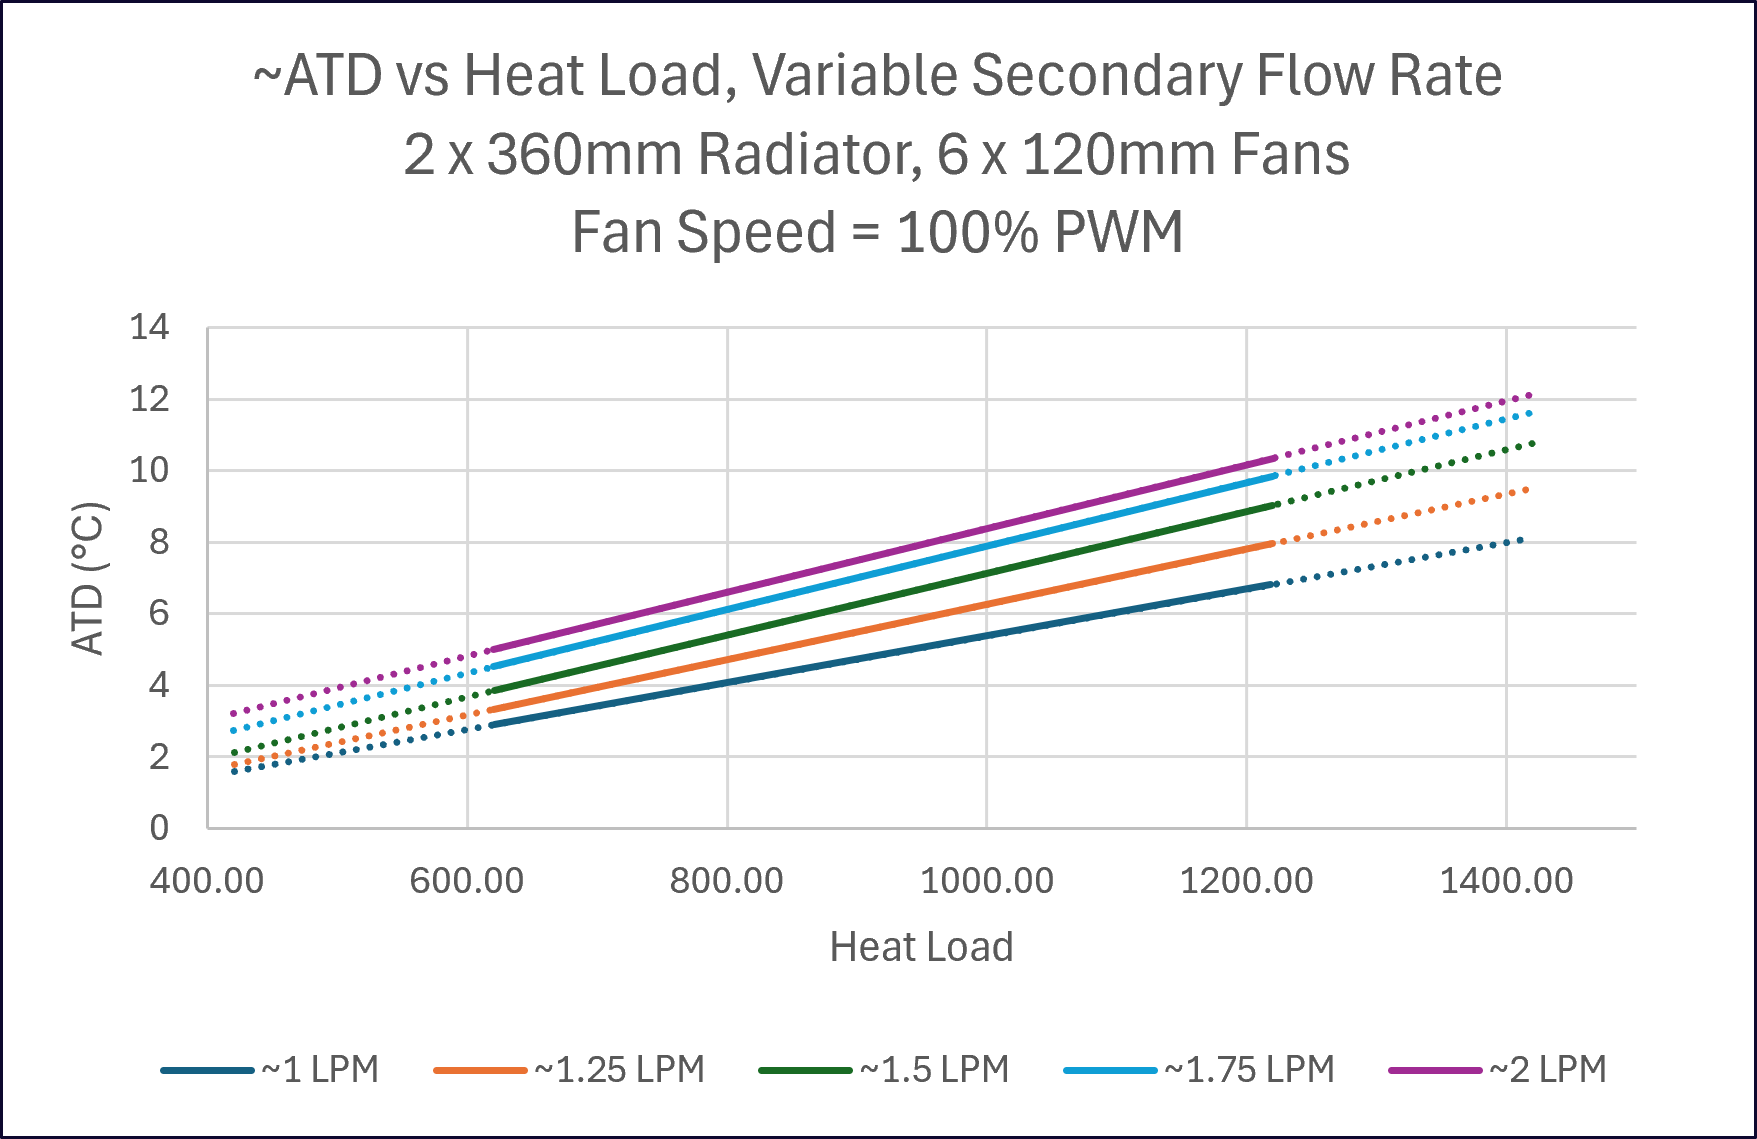
At full fan speed, the radiators hold the coolant within 5 to 9C of ambient at a 1,000W heat load across the flow range, and within 8 to 12C at 1,400W, past the Superchip’s power limit. The lines are nearly linear, and slower coolant spends longer in the radiator and comes out closer to room temperature, which is why the 1 LPM line sits lowest; the tradeoff is the higher cold plate resistance at low flow from the first chart, so the loop’s operating point is a balance between the two. The 60 percent PWM chart is the more realistic one for a system beside a desk, because nobody runs (or wants to run) six 120mm fans flat out in an office.
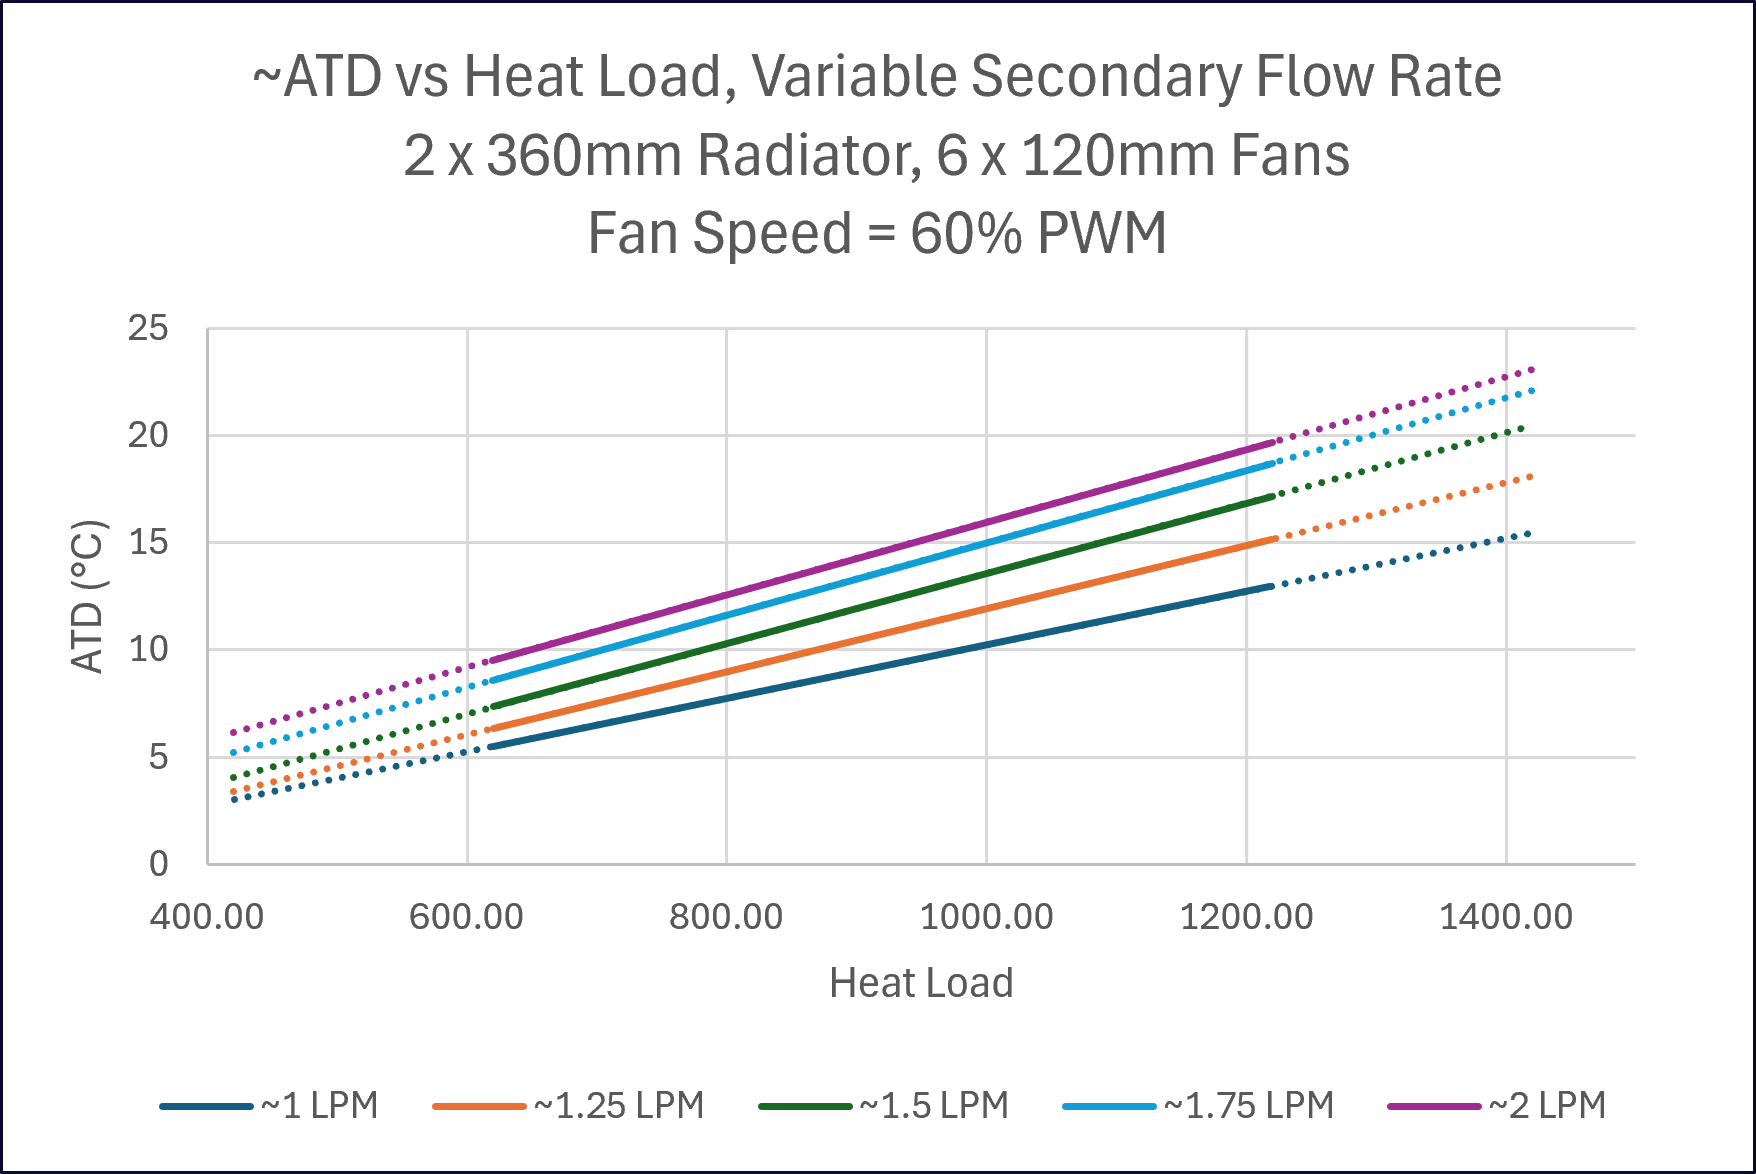
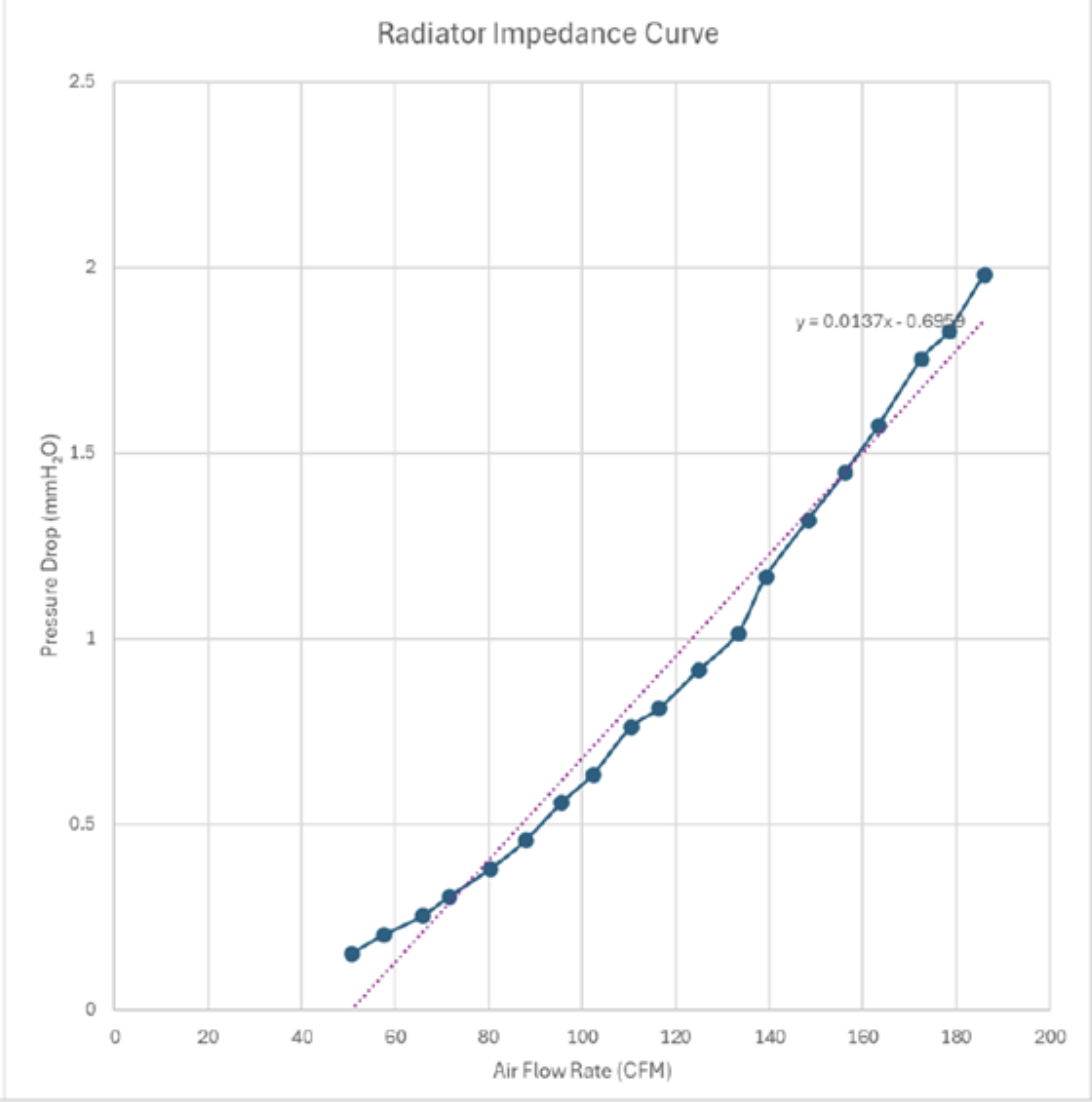
At 60 percent, ATD roughly doubles: 10 to 16C at 1,000W and 15 to 23C at 1,400W, a relatively modest penalty. Even at full Superchip power and reduced fan speed, the coolant enters the cold plates no more than about 23C above the room. Add the 17C GPU plate rise from the first chart, and the Blackwell Ultra package is running around 40C above ambient at 1,000W, well inside its operating range in any normal office. The final MSI chart is the radiator’s air-side impedance curve, which shows the pressure the fans have to overcome to push air through the fin stack, reaching about 1 mm of water at 135 CFM and 2 mm at 185 CFM. It’s a low-restriction core, which is what lets the fans run slow.
Our Run: ~3 Hours on the GB300
Design curves say what a loop should do, to see what it actually does, we logged the WS300 through a 2.8 hour session made up of five phases: a 75 minute burn-in at sustained GPU load, then DeepSeek v4 Flash served through vLLM under three profiles, an equal 512 input and 512 output token workload, a prefill-heavy 8,192 in and 1,024 out workload, and a decode-heavy 1,024 in and 8,192 out workload stepped through increasing concurrency, followed by an idle observation window. We sampled the GPU, HBM, CPU, and power telemetry continuously. Coolant, chassis air, and board temperatures come from the BMC, which we polled every couple of minutes. The shaded regions in each chart mark the phases.
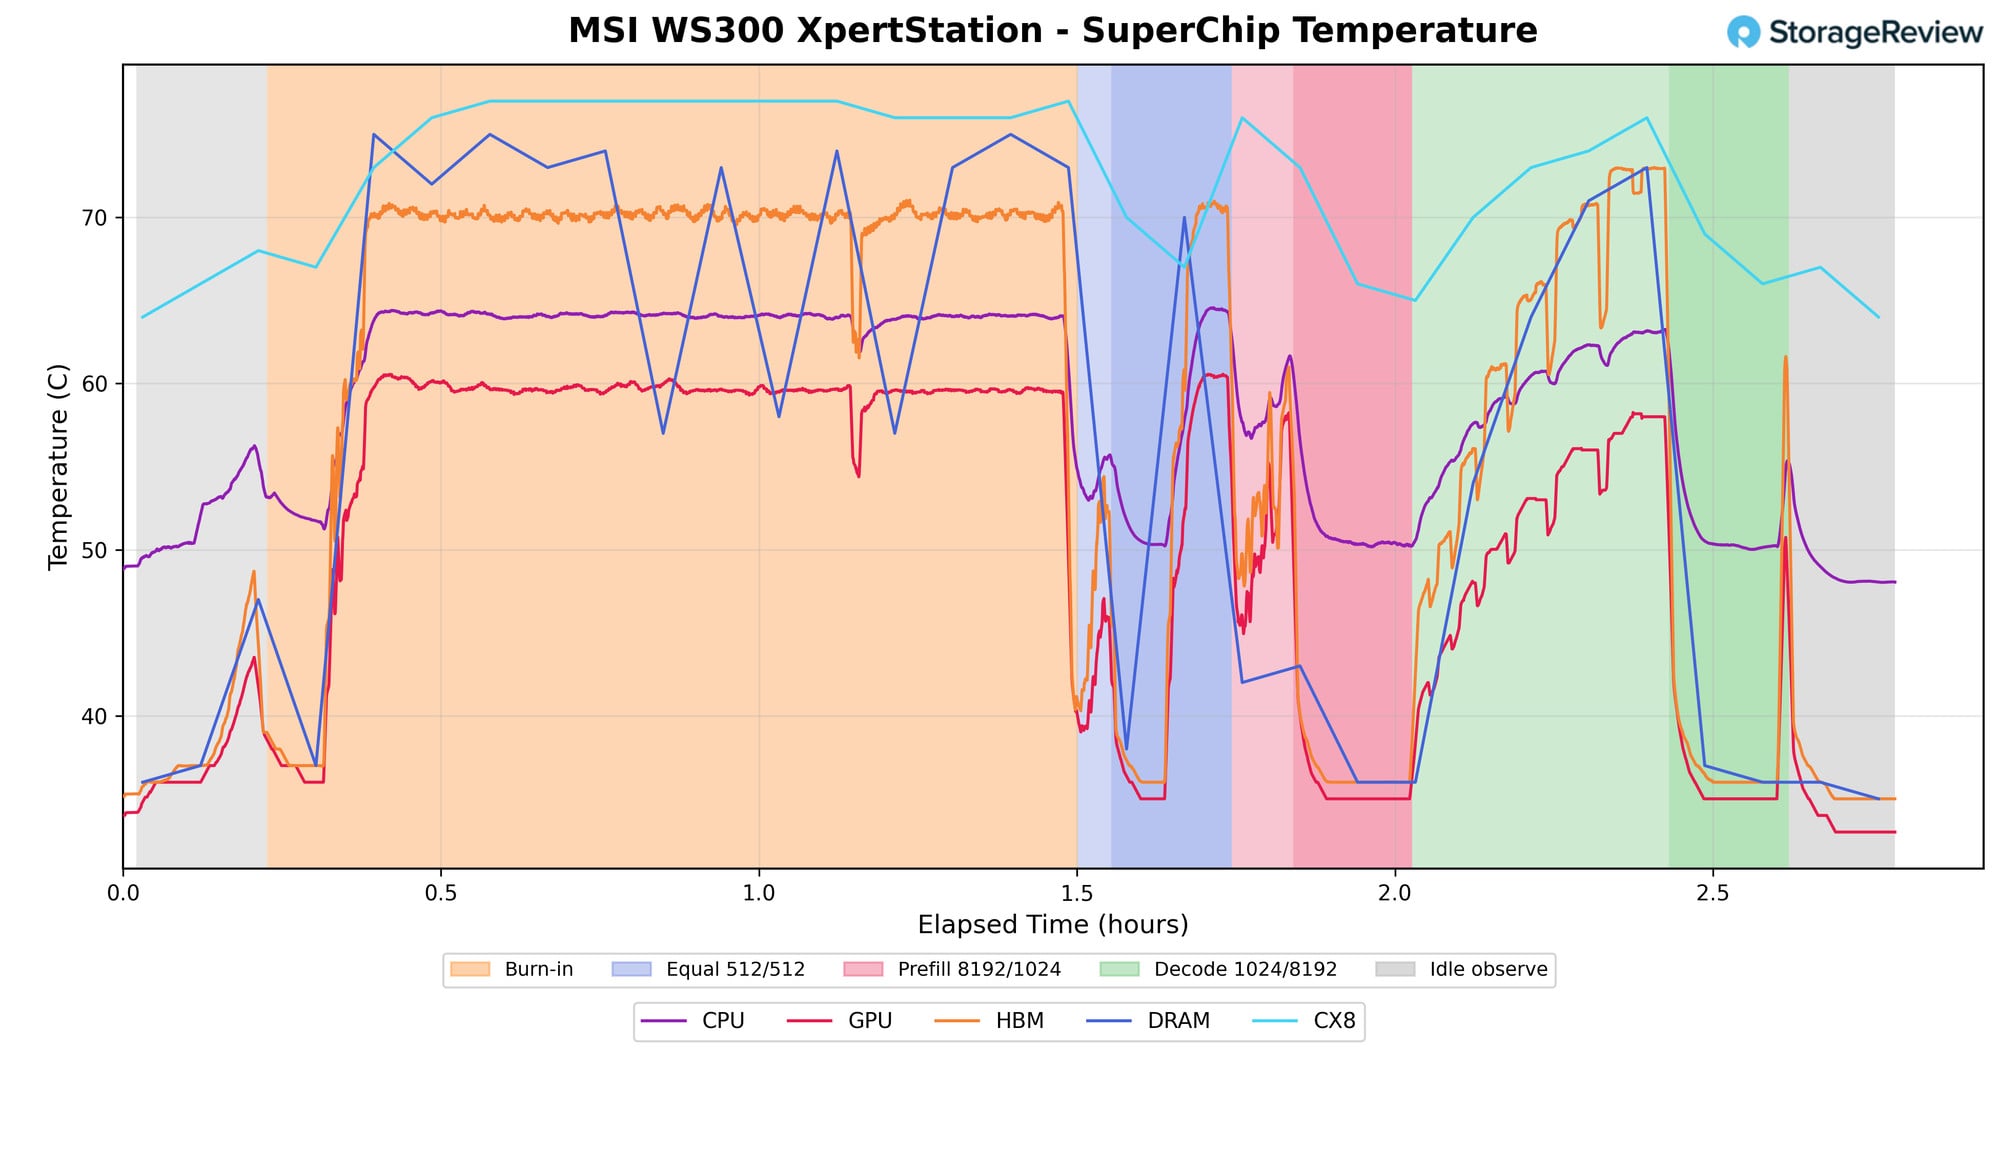
Through the entire burn-in, the Blackwell Ultra die was held at 60C, with HBM3e about 10C warmer at 70C and Grace at 64C. Those are the steady-state numbers at roughly 1,000W of GPU power, and they didn’t drift upward over the 75 minutes, which is the signature of a loop that has reached equilibrium with headroom. The inference phases are cooler on average because the load is burstier: the GPU peaked at 60C again during the equal workload and 58C during the long decode ramp, with HBM topping out at 73C. The sawtooth on the DRAM line is an artifact of the BMC’s sampling interval; the LPDDR5X itself peaked around 75C. The warmest sensor in the box for most of the run was the ConnectX-8 at 76 to 77C. Idle temperatures settled at 33 to 36C for the GPU and HBM and around 48C for Grace.
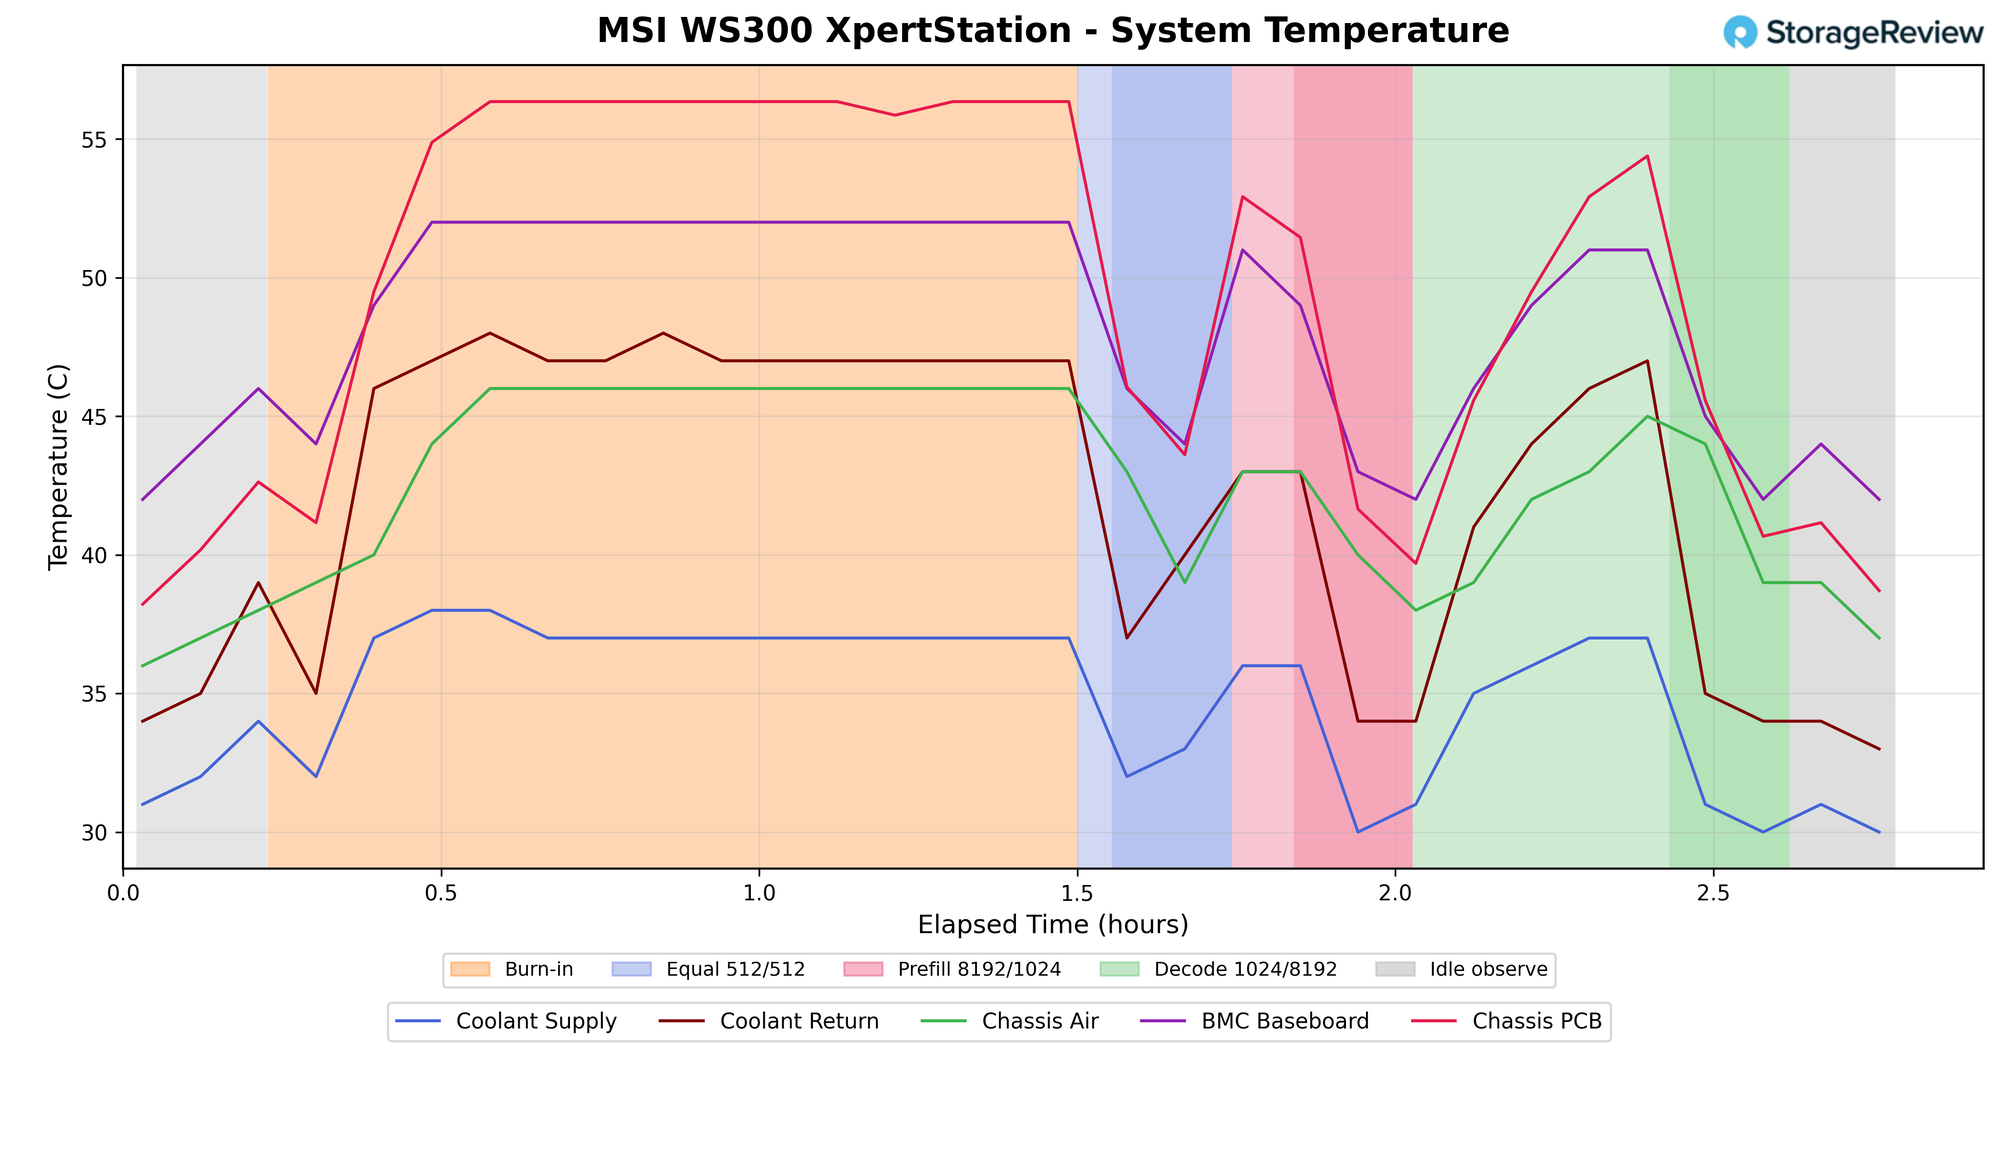
During burn-in, the coolant left the radiators at 37C and returned from the cold plates at 47C, a 10C rise across the loop. Chassis air inside the case reached 46C, the BMC baseboard 52C, and the hottest board sensor 56C. Every one of those lines plateaus within the first 15 minutes of load and stays flat, then falls back within minutes when the load stops. At idle, the coolant supply sat at 30 to 31C.
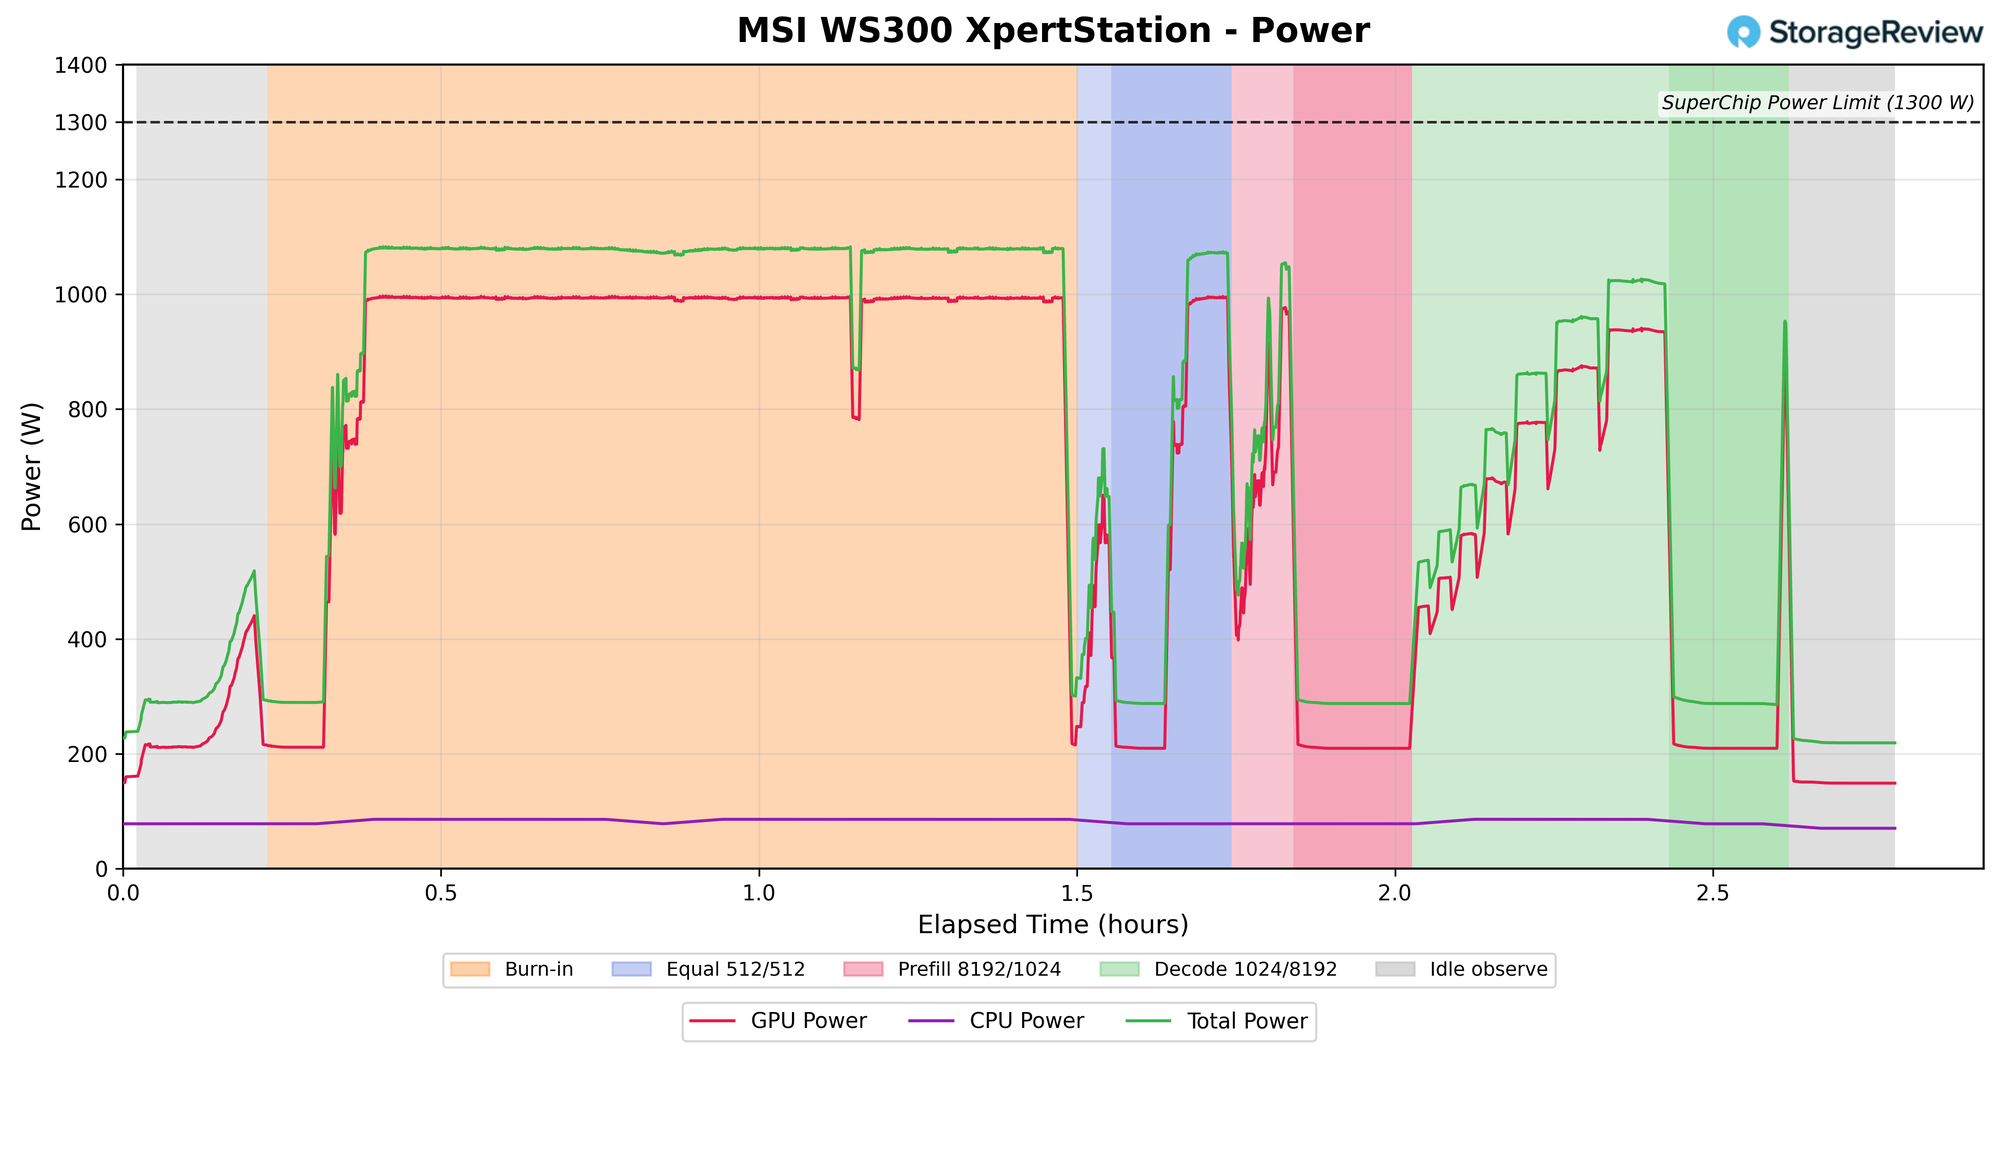
Burn-in held the GPU at about 995W, with Grace adding another 85 to 90W for a Superchip total near 1,080W, which is the load the coolant delta above corresponds to. The equal workload briefly touched the same 1,000W GPU level at high concurrency; the prefill-heavy phase ran in short bursts to about 1,050W total; and the decode-heavy ramp is the clearest picture of how an inference server loads a GPU, stepping from roughly 500W to just over 1,000W as concurrency doubled at each stage. At no point in the run did total Superchip power come within 200W of the 1,300W limit marked on the chart. Idle is worth noting for anyone planning power: the GPU alone draws 150 to 210W with nothing running, and the Superchip total idles at 220 to 290W.
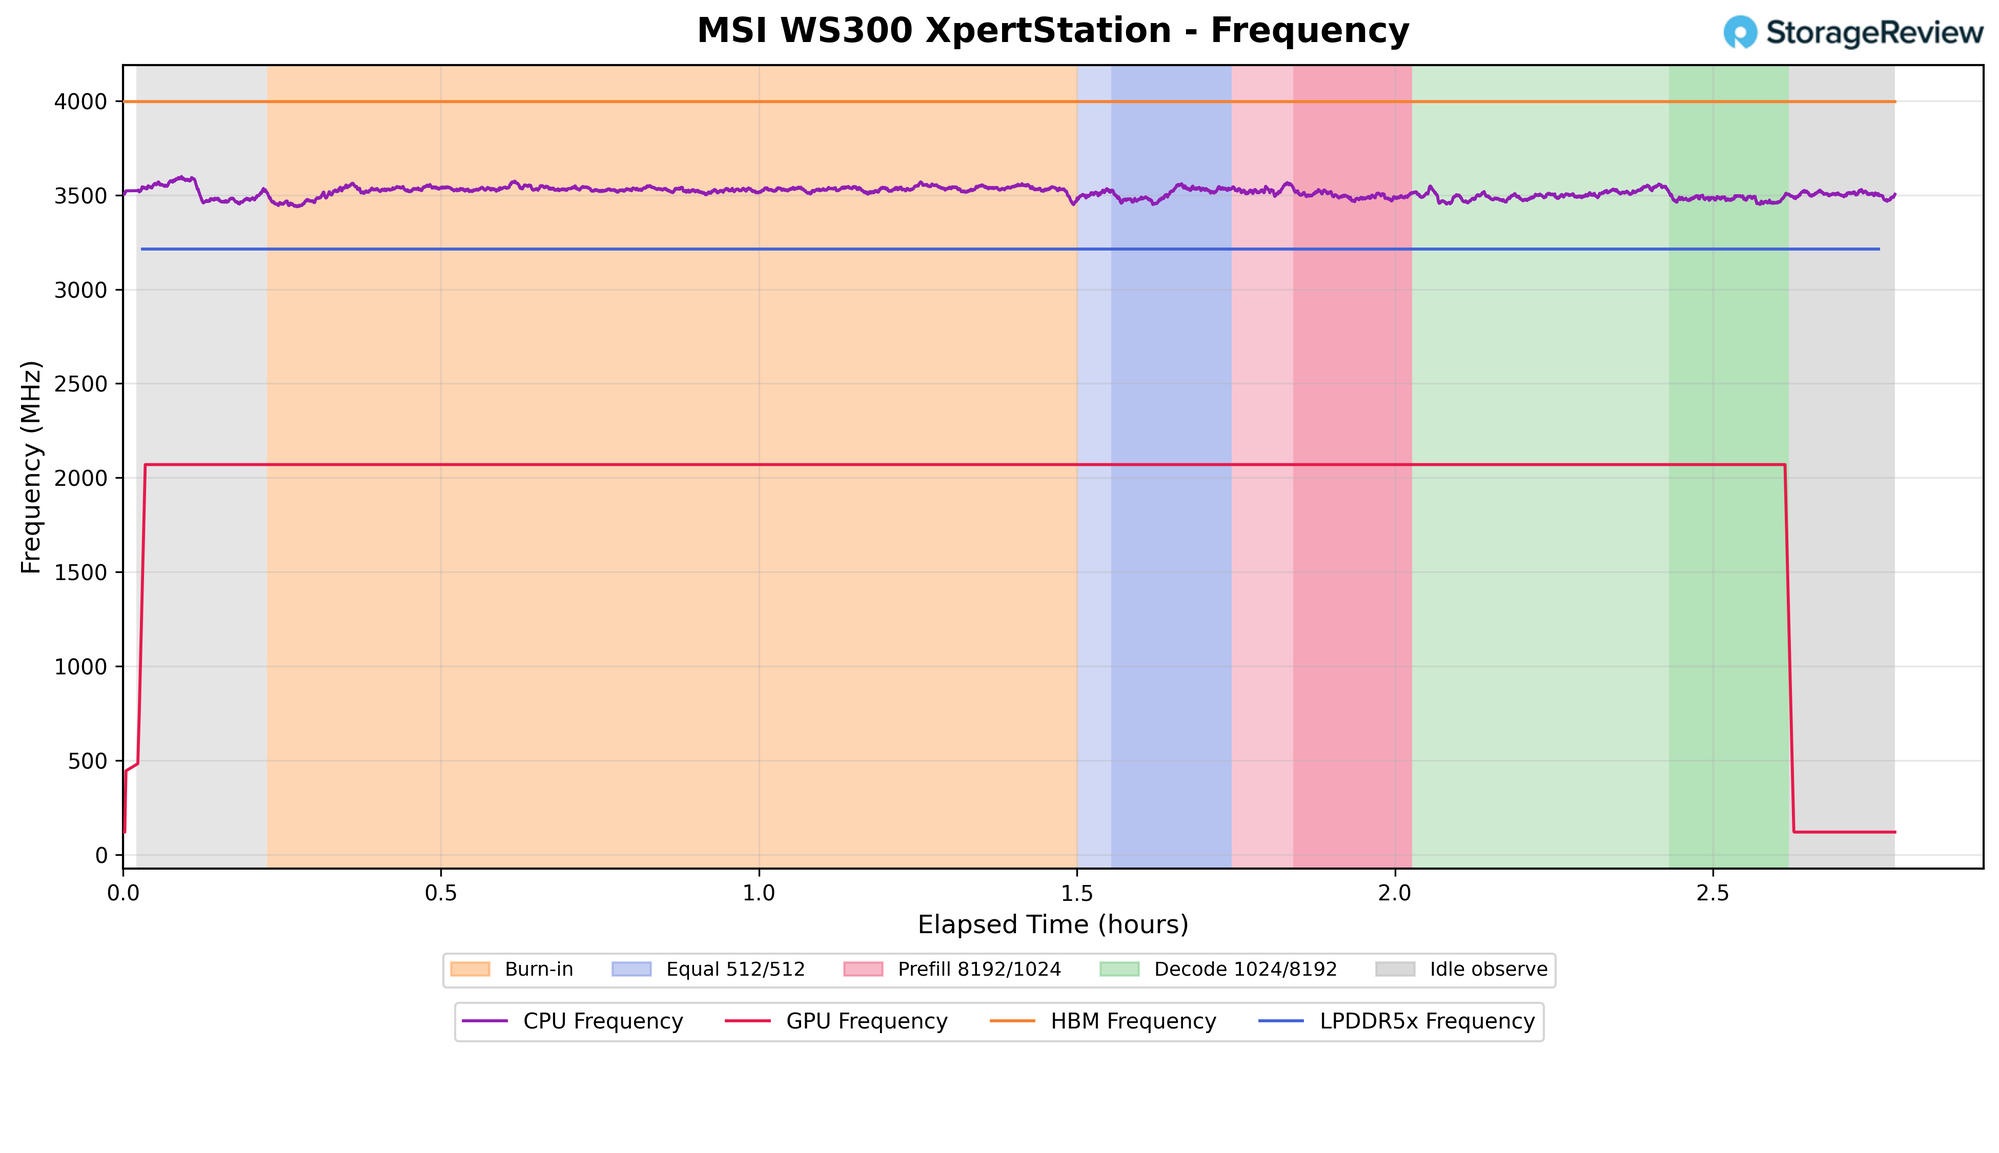
The Blackwell Ultra ran at about 2.07GHz from the moment the burn-in started until the run ended, a flat line through every phase with no dips at all. Grace held near 3.5GHz with normal jitter, HBM stayed at 4,000MHz, and the LPDDR5X stayed at 3,200MHz. A thermally limited GPU shows up here as very choppy, as the boost algorithm backs off and recovers; a power-limited one shows up as a clock that tracks load; neither pattern appears in our testing. Under these workloads, the system was neither hot enough nor power-constrained enough to leave its top clock.
Tying the Two Together
MSI’s curves and our measurements were produced independently, and they come together at the same conclusion. Start from the 10C coolant rise at 1,080W. Heat carried by a liquid is flow times temperature rise, so that delta implies a coolant flow rate of about 1.5 liters per minute for water-based coolant, squarely in the range MSI characterized. Read MSI’s radiator chart at that flow and load: at 100 percent fan speed, the coolant should sit about 8C above the room; at 60 percent, about 14C. We didn’t have a calibrated ambient probe in MSI’s lab, so we can’t close that loop to the degree, but a 37C supply temperature is consistent with a warm lab room and fans running well below full speed.
At 1.5 LPM, the GPU plate’s measured resistance is about 0.017 C/W, which at 995W predicts a 17C rise from coolant to plate. We measured the Blackwell Ultra die at 60C against a 37C supply, a 23C gap. The 6C difference between the two is the thermal interface and the package itself, the part of the path the cold plate can’t control, and it is a small number for a dual-reticle GPU of this size. The plate is doing what MSI’s bench data says it does, and the margin between the die and the coolant is dictated by physics.
Work the budget the other way, and the headroom we discussed earlier becomes more visible. NVIDIA’s data center GPUs don’t begin reducing clocks until the die is well into the 80s, so the WS300 at full sustained load left roughly 20C between the Blackwell Ultra die and the point where thermal management would step in, and that was with the loop absorbing 1,080W. Even at the worst-case 1,300W Superchip limit, another 220W through a 0.017 C/W plate adds under 4C at the GPU, and MSI’s radiator chart shows the coolant rising only about 2C more for that extra load.
What This Means for a Buyer
The WS300 doesn’t throttle under sustained inference or synthetic load because its cooling loop was sized above the Superchip’s power limit, and the measured temperatures leave roughly 20C of margin at the GPU, with HBM and CPU running cooler still relative to their limits. The component that runs warmest is the ConnectX-8, which is why it’s on the loop in the first place. Coolant temperatures stabilize within 15 minutes and recover within minutes, so back-to-back jobs don’t stack heat. Fan speed is the one lever between noise and coolant temperature, and MSI’s 60 percent data shows the system can give up a lot of airflow before the fans have to scale up. The one thing that doesn’t shrink is the electrical side: a 20A circuit is still required in North America, and idle draw in the 220 to 290W range is the cost of keeping 252GB of HBM3e and a 72-core Arm CPU ready to work. Then again, with this kind of investment, the system should rarely be kept idle.
This report is sponsored by MSI. All views and opinions expressed in this report are based on our unbiased view of the product(s) under consideration.



 Amazon