

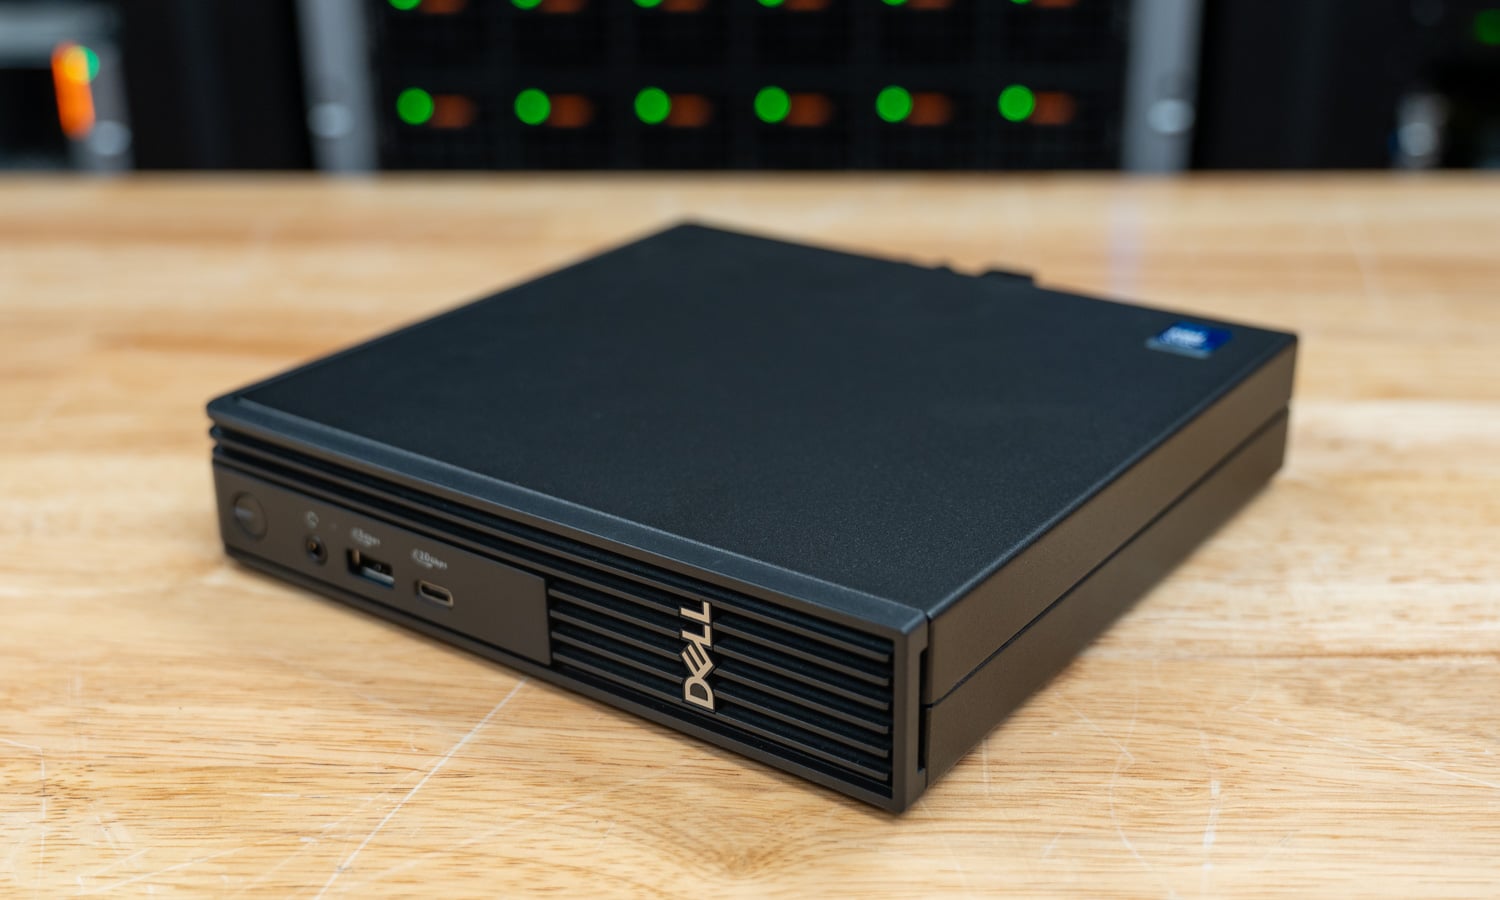
The Dell Pro 5 Micro is Dell’s mainstream commercial mini PC for the Panther Lake generation, a 1.17-liter box that fits behind a monitor and ships with vPro, two SO-DIMM slots, two M.2 SSD slots, and a rear module bay for whatever legacy port a fleet still needs. Our review unit carries the Intel Core Ultra 7 366H vPro, 64GB of DDR5-5600 in two SO-DIMMs, and a 1TB Sandisk PC SN8050S self-encrypting SSD, the top processor and the largest memory capacity Dell offers in this chassis.
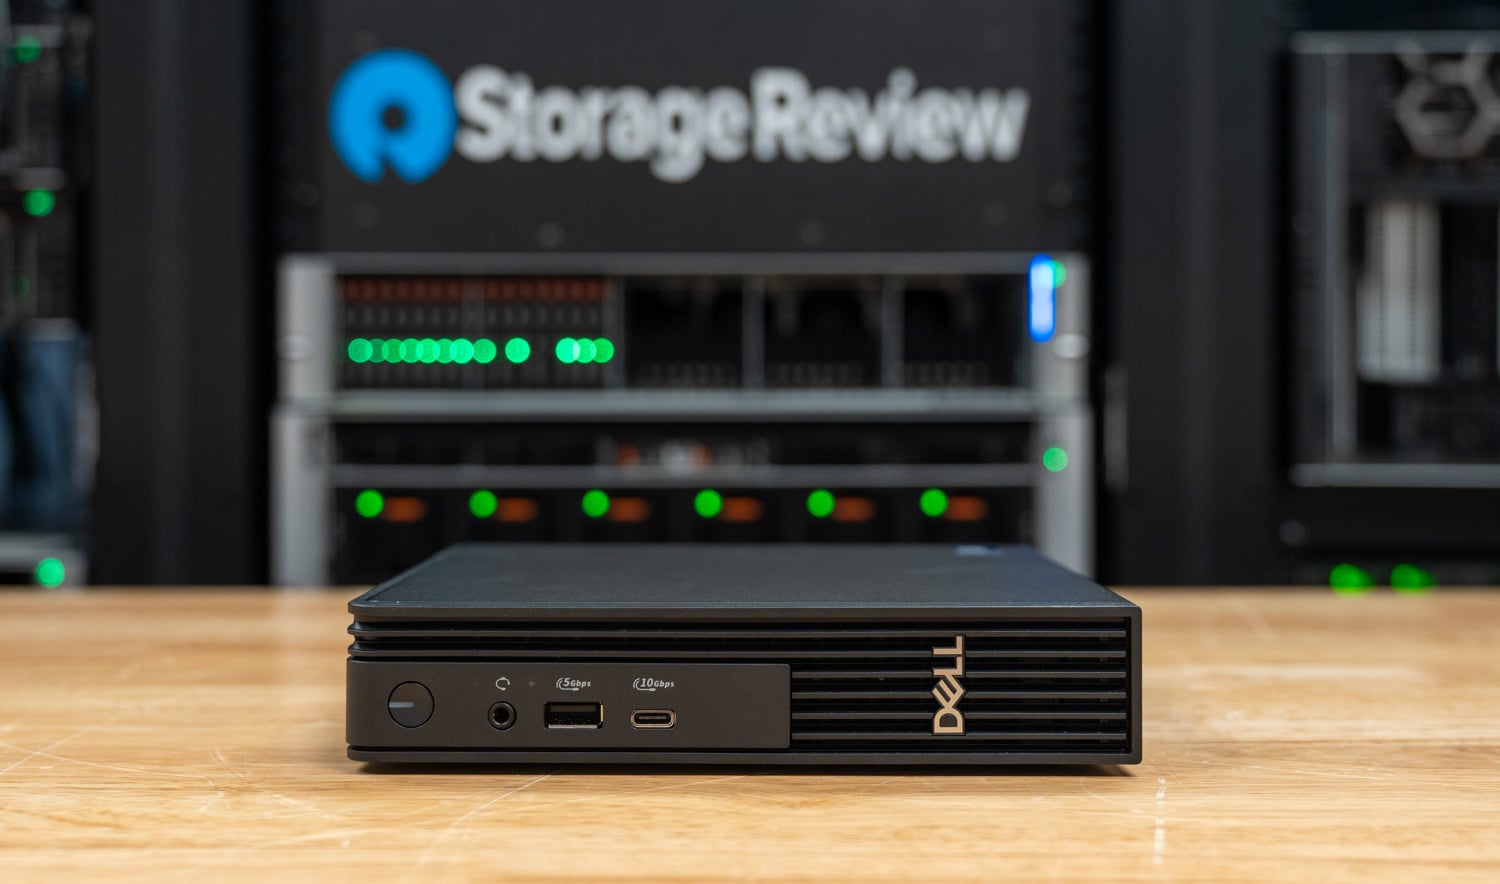
The processor choice is central to this review, because Intel’s Core Ultra Series 3 splits into X-series parts with the 12 Xe3 core Arc B390 GPU and LPDDR5X only, and standard parts with a 4 Xe3 core GPU that also run DDR5 SO-DIMMs and qualify for vPro. Dell took the second group, and the ASUS NUC16 Pro we reviewed with the Core Ultra X7 358H took the first. The two chips share 16 cores, 18MB of cache, and a 4.8GHz peak, so the comparison isolates what the GPU, the memory, and the power budget are worth in a micro.
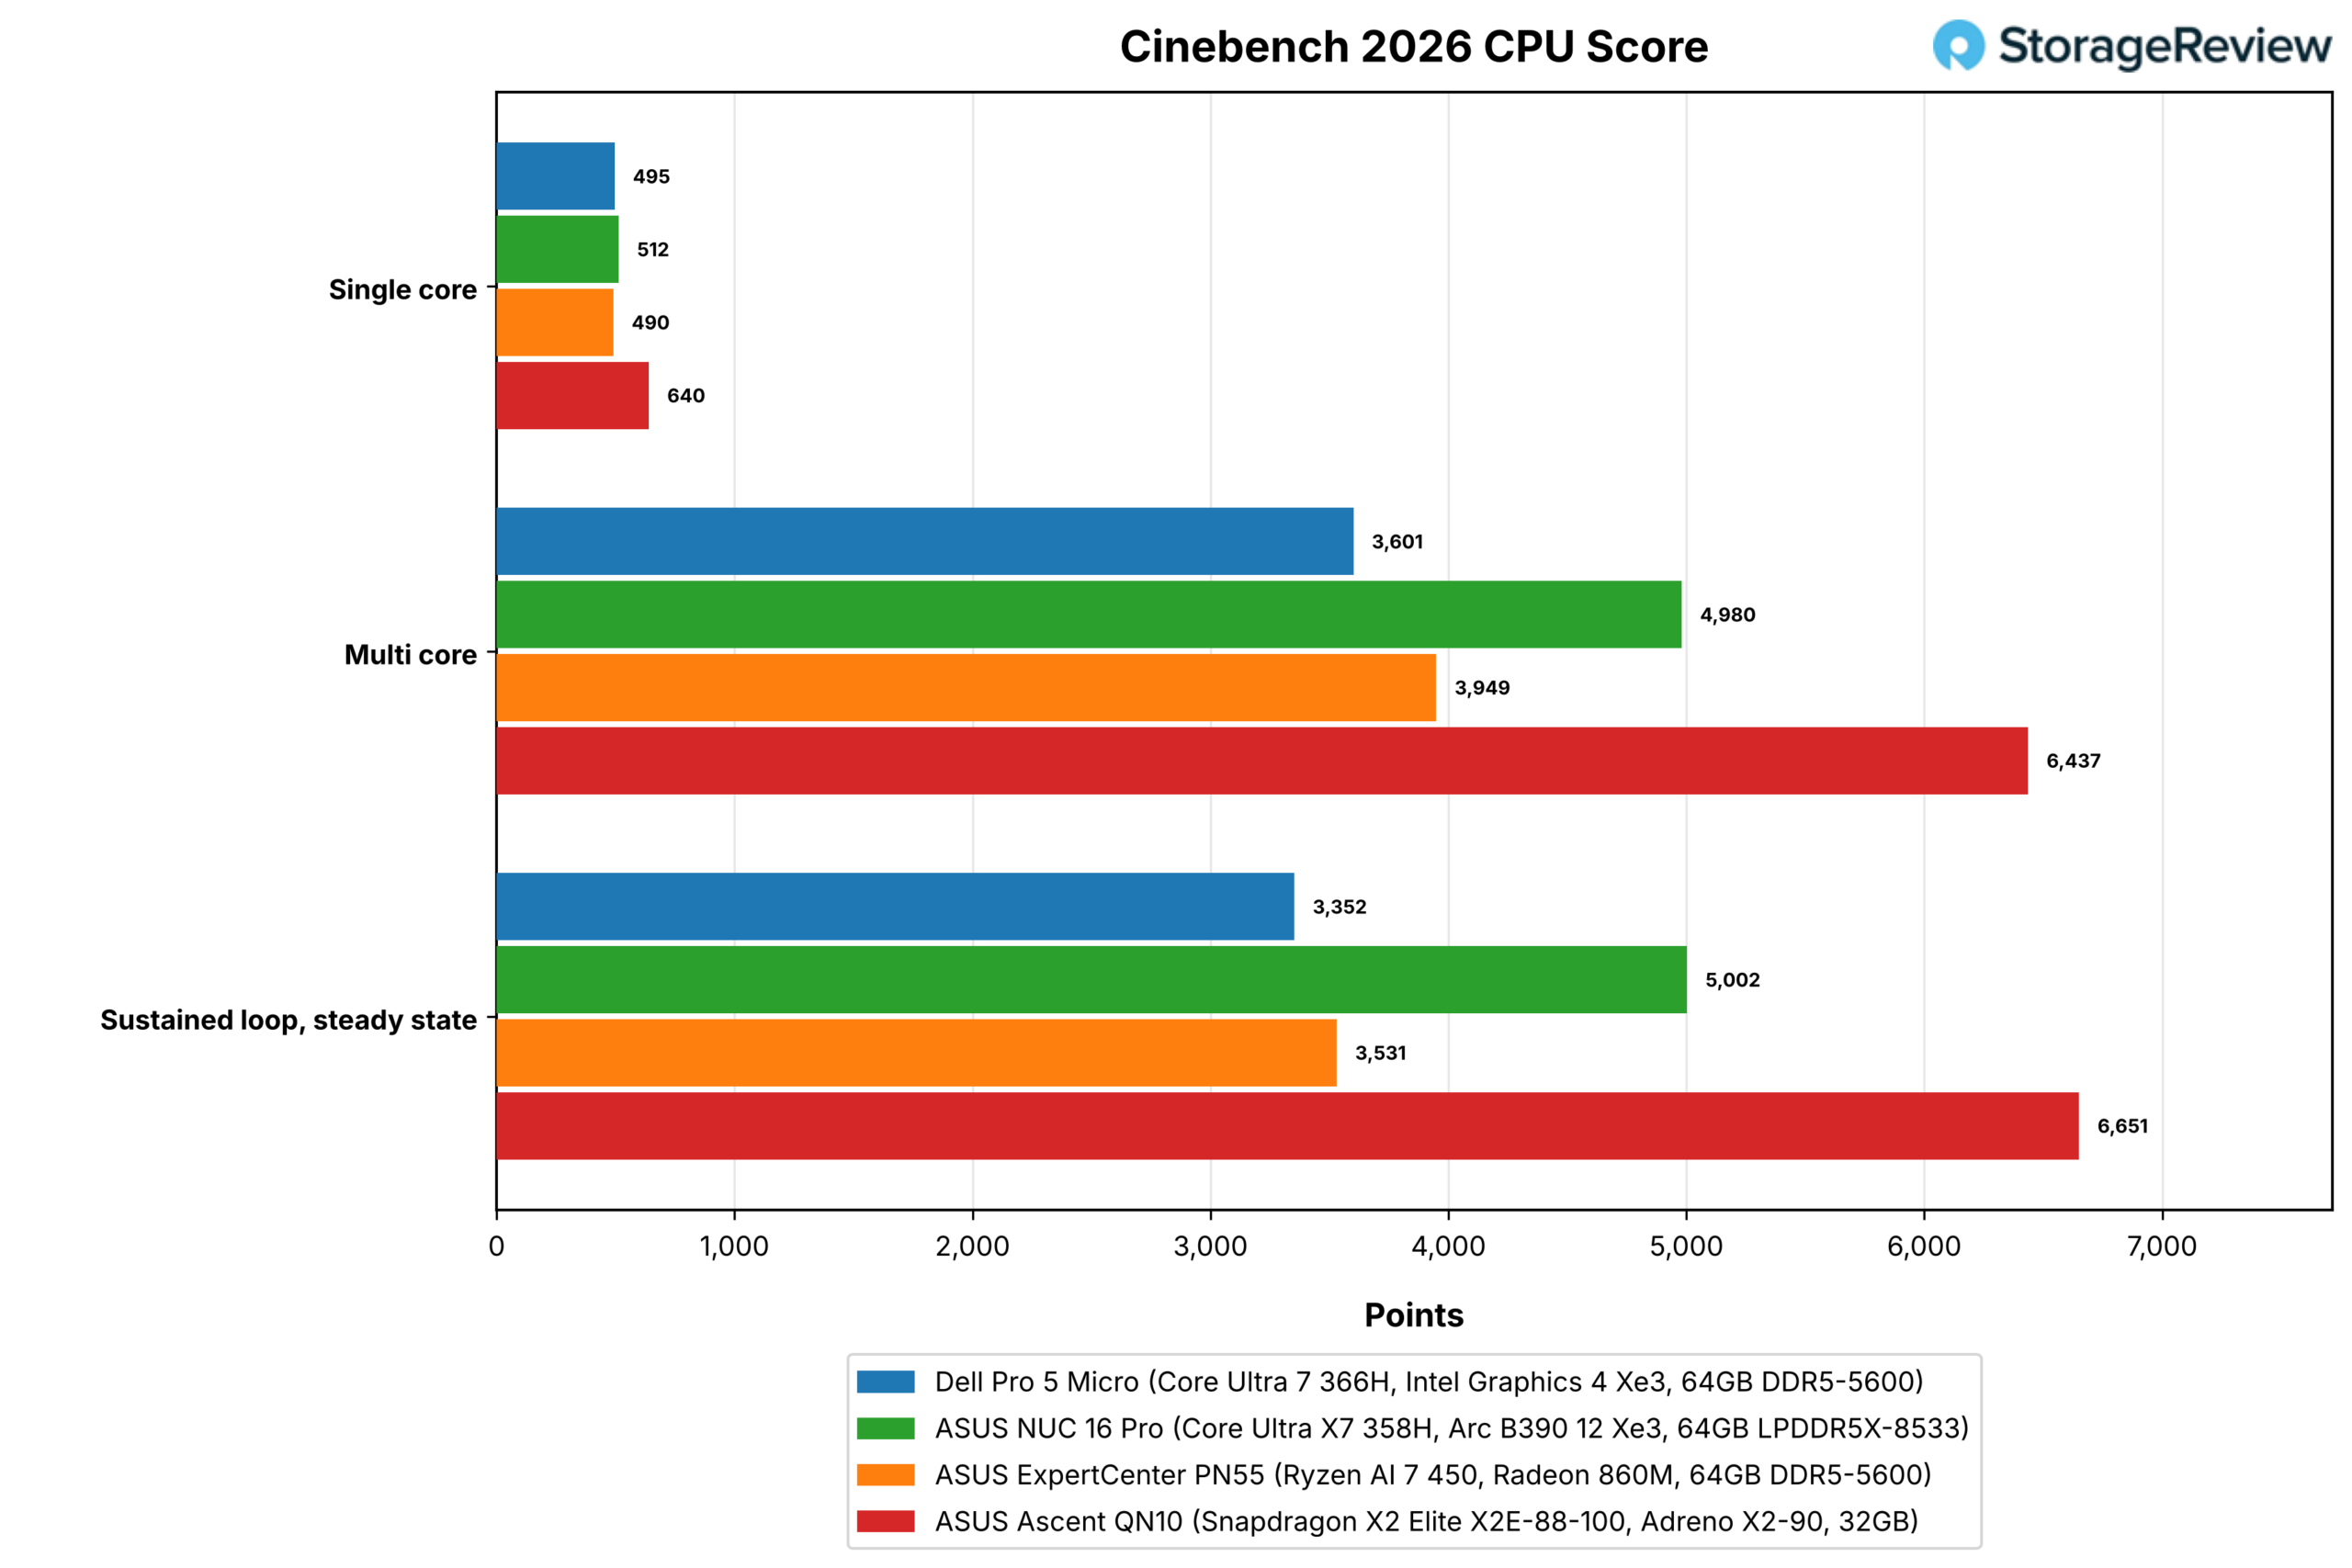
The answer splits by workload: single-core CPU performance lands about 3 percent behind the NUC at 495.1 in Cinebench 2026, browser and Python results match, and hardware video encoding runs at the same 127 fps because both chips carry the same Xe media engine. All-core work is a different story: the Pro 5 Micro scores 3,601 in Cinebench multi-core against 4,980, and it holds a 2,483MHz mean clock through a 30-minute loop where the NUC holds 3,572MHz.
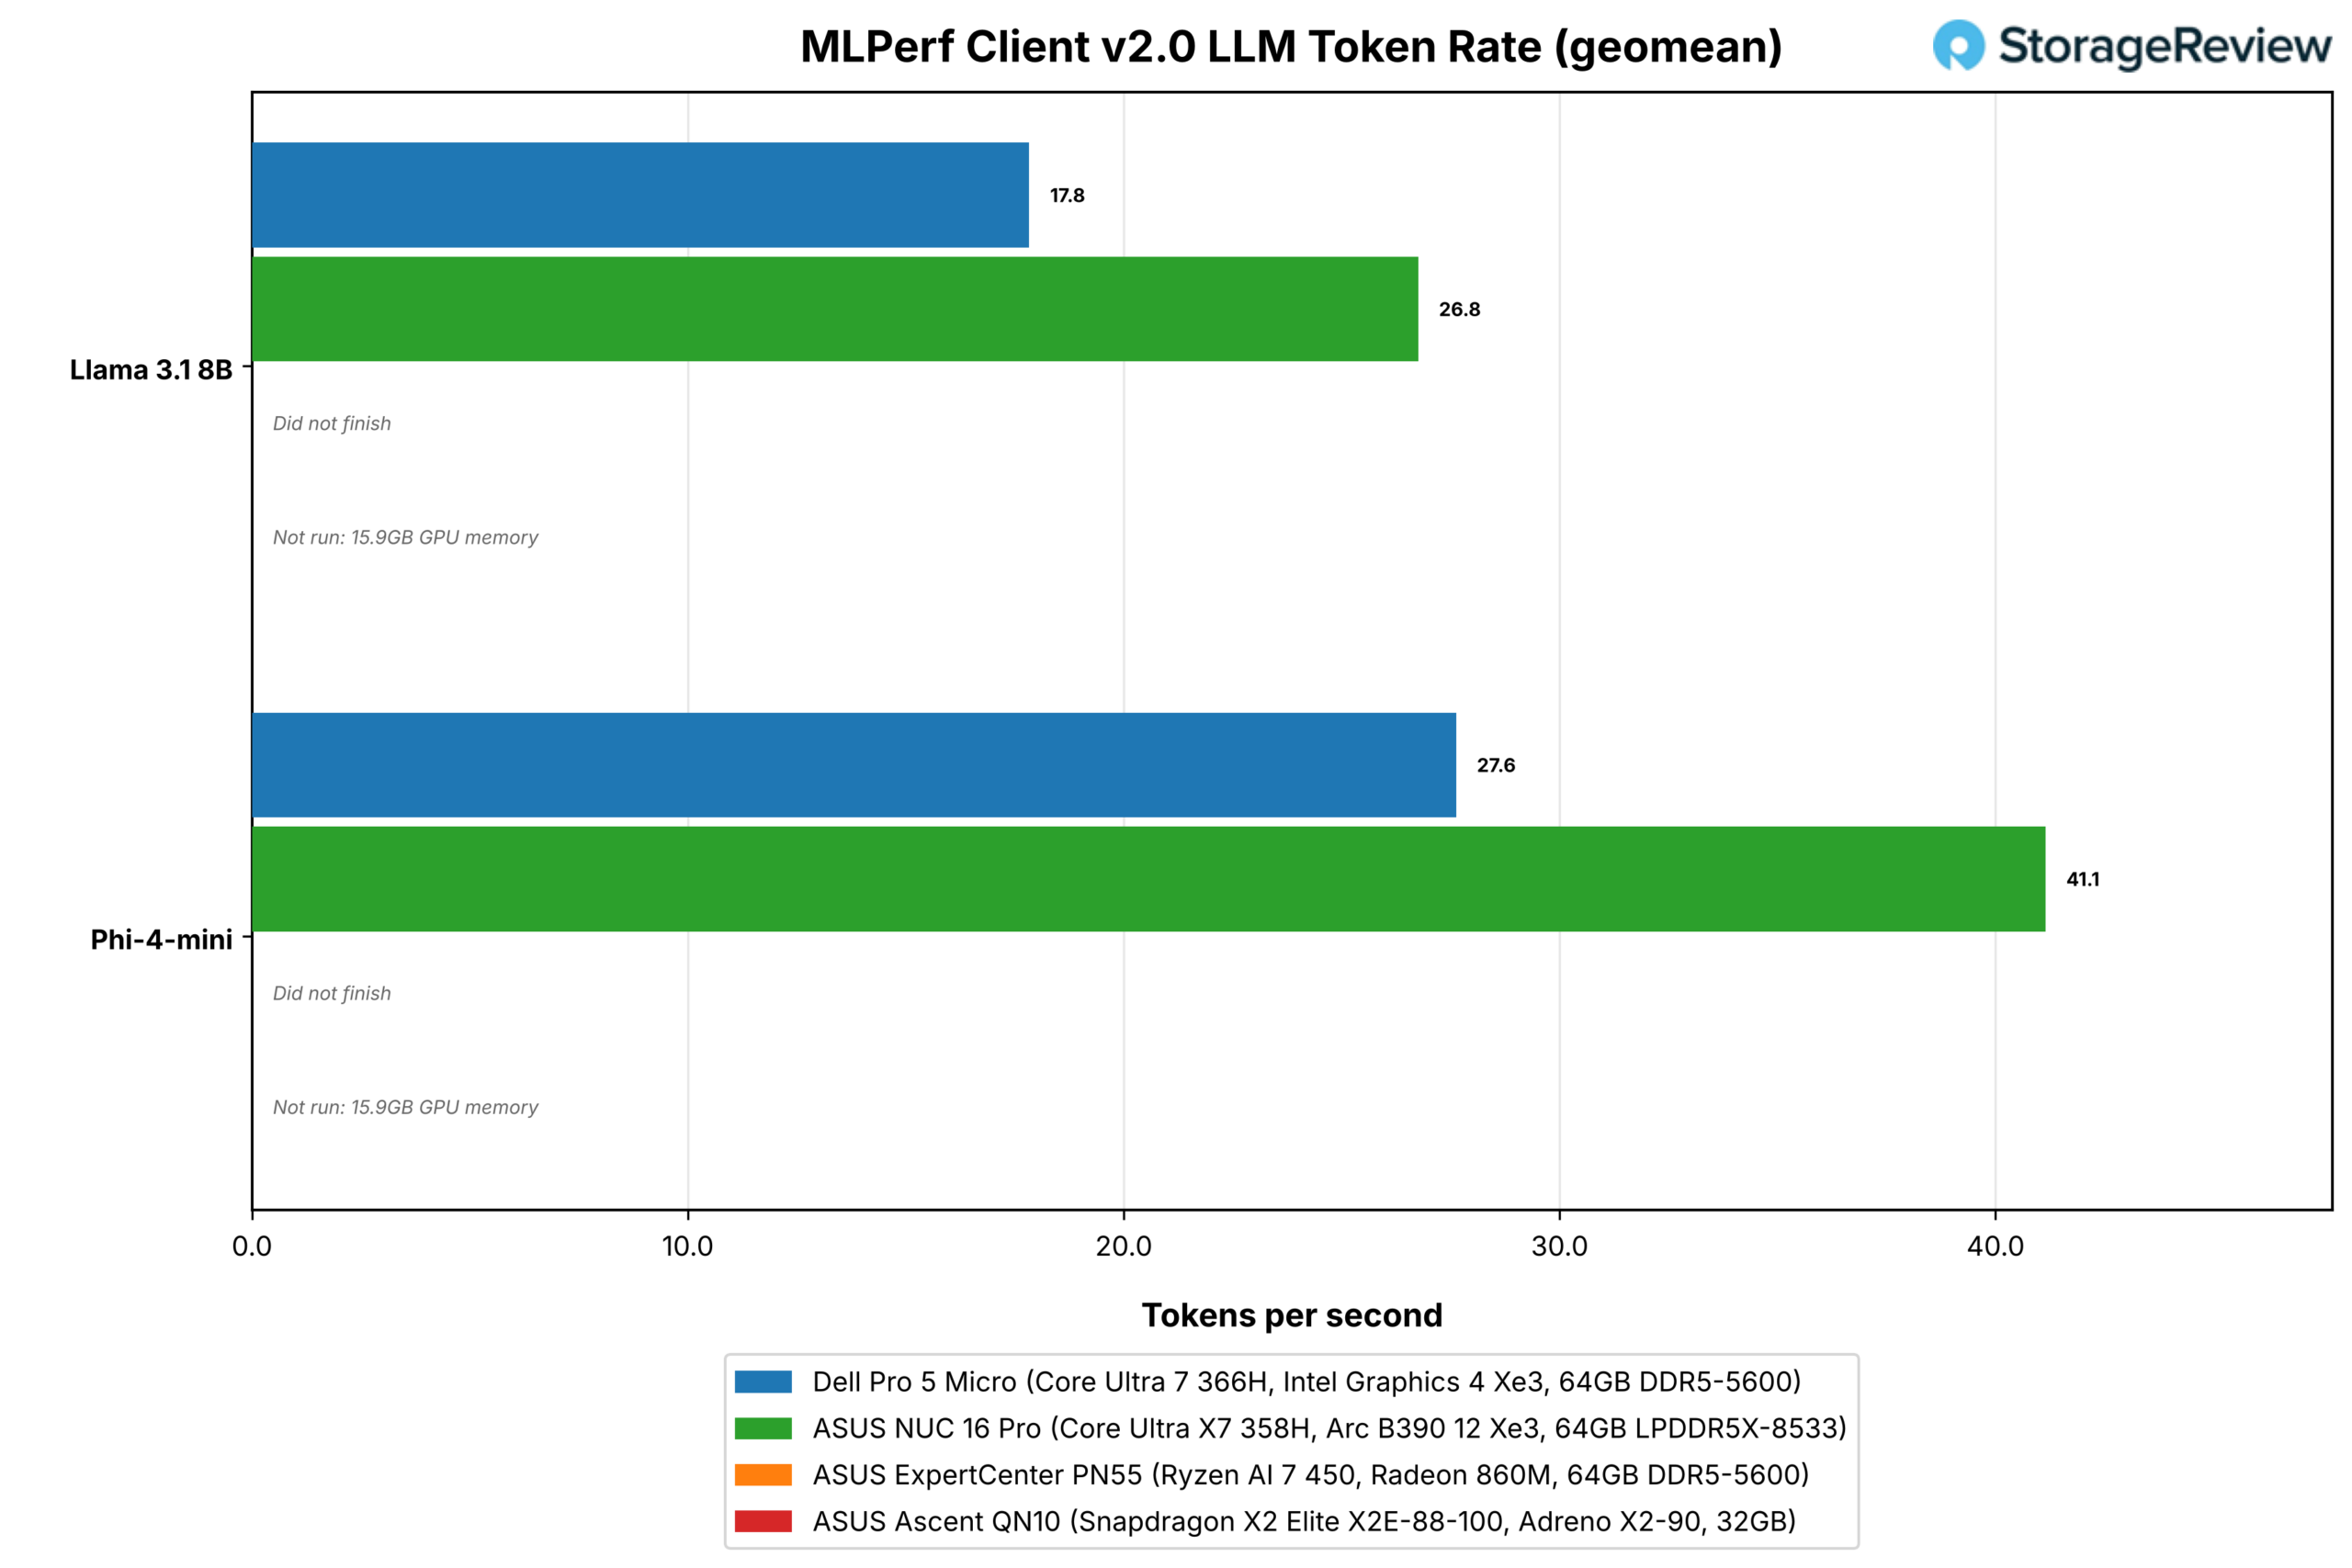
Local AI follows the GPU, and MLPerf Client generates Llama 3.1 8B at 17.8 tokens per second on the Pro 5 Micro against 26.8 on the NUC, and llama-server serves Qwen3.8 27B at 4.7 aggregate tokens per second against 9.1. The 64GB of system memory gives the small GPU 47.6GB to work with, so the Pro 5 Micro runs the 20B and 27B models in our suite; it runs them at a pace suited to a single user.
Points clés à retenir
- Same cores as the NUC 16 Pro, same single-thread speed: 495.1 in Cinebench 2026 single-core against 512.2, Speedometer 42.2 against 42.1, and 127 fps on the Quick Sync HEVC 4K60 encode against 129; the Core Ultra 7 366H and Core Ultra X7 358H are the same 16-core CPU.
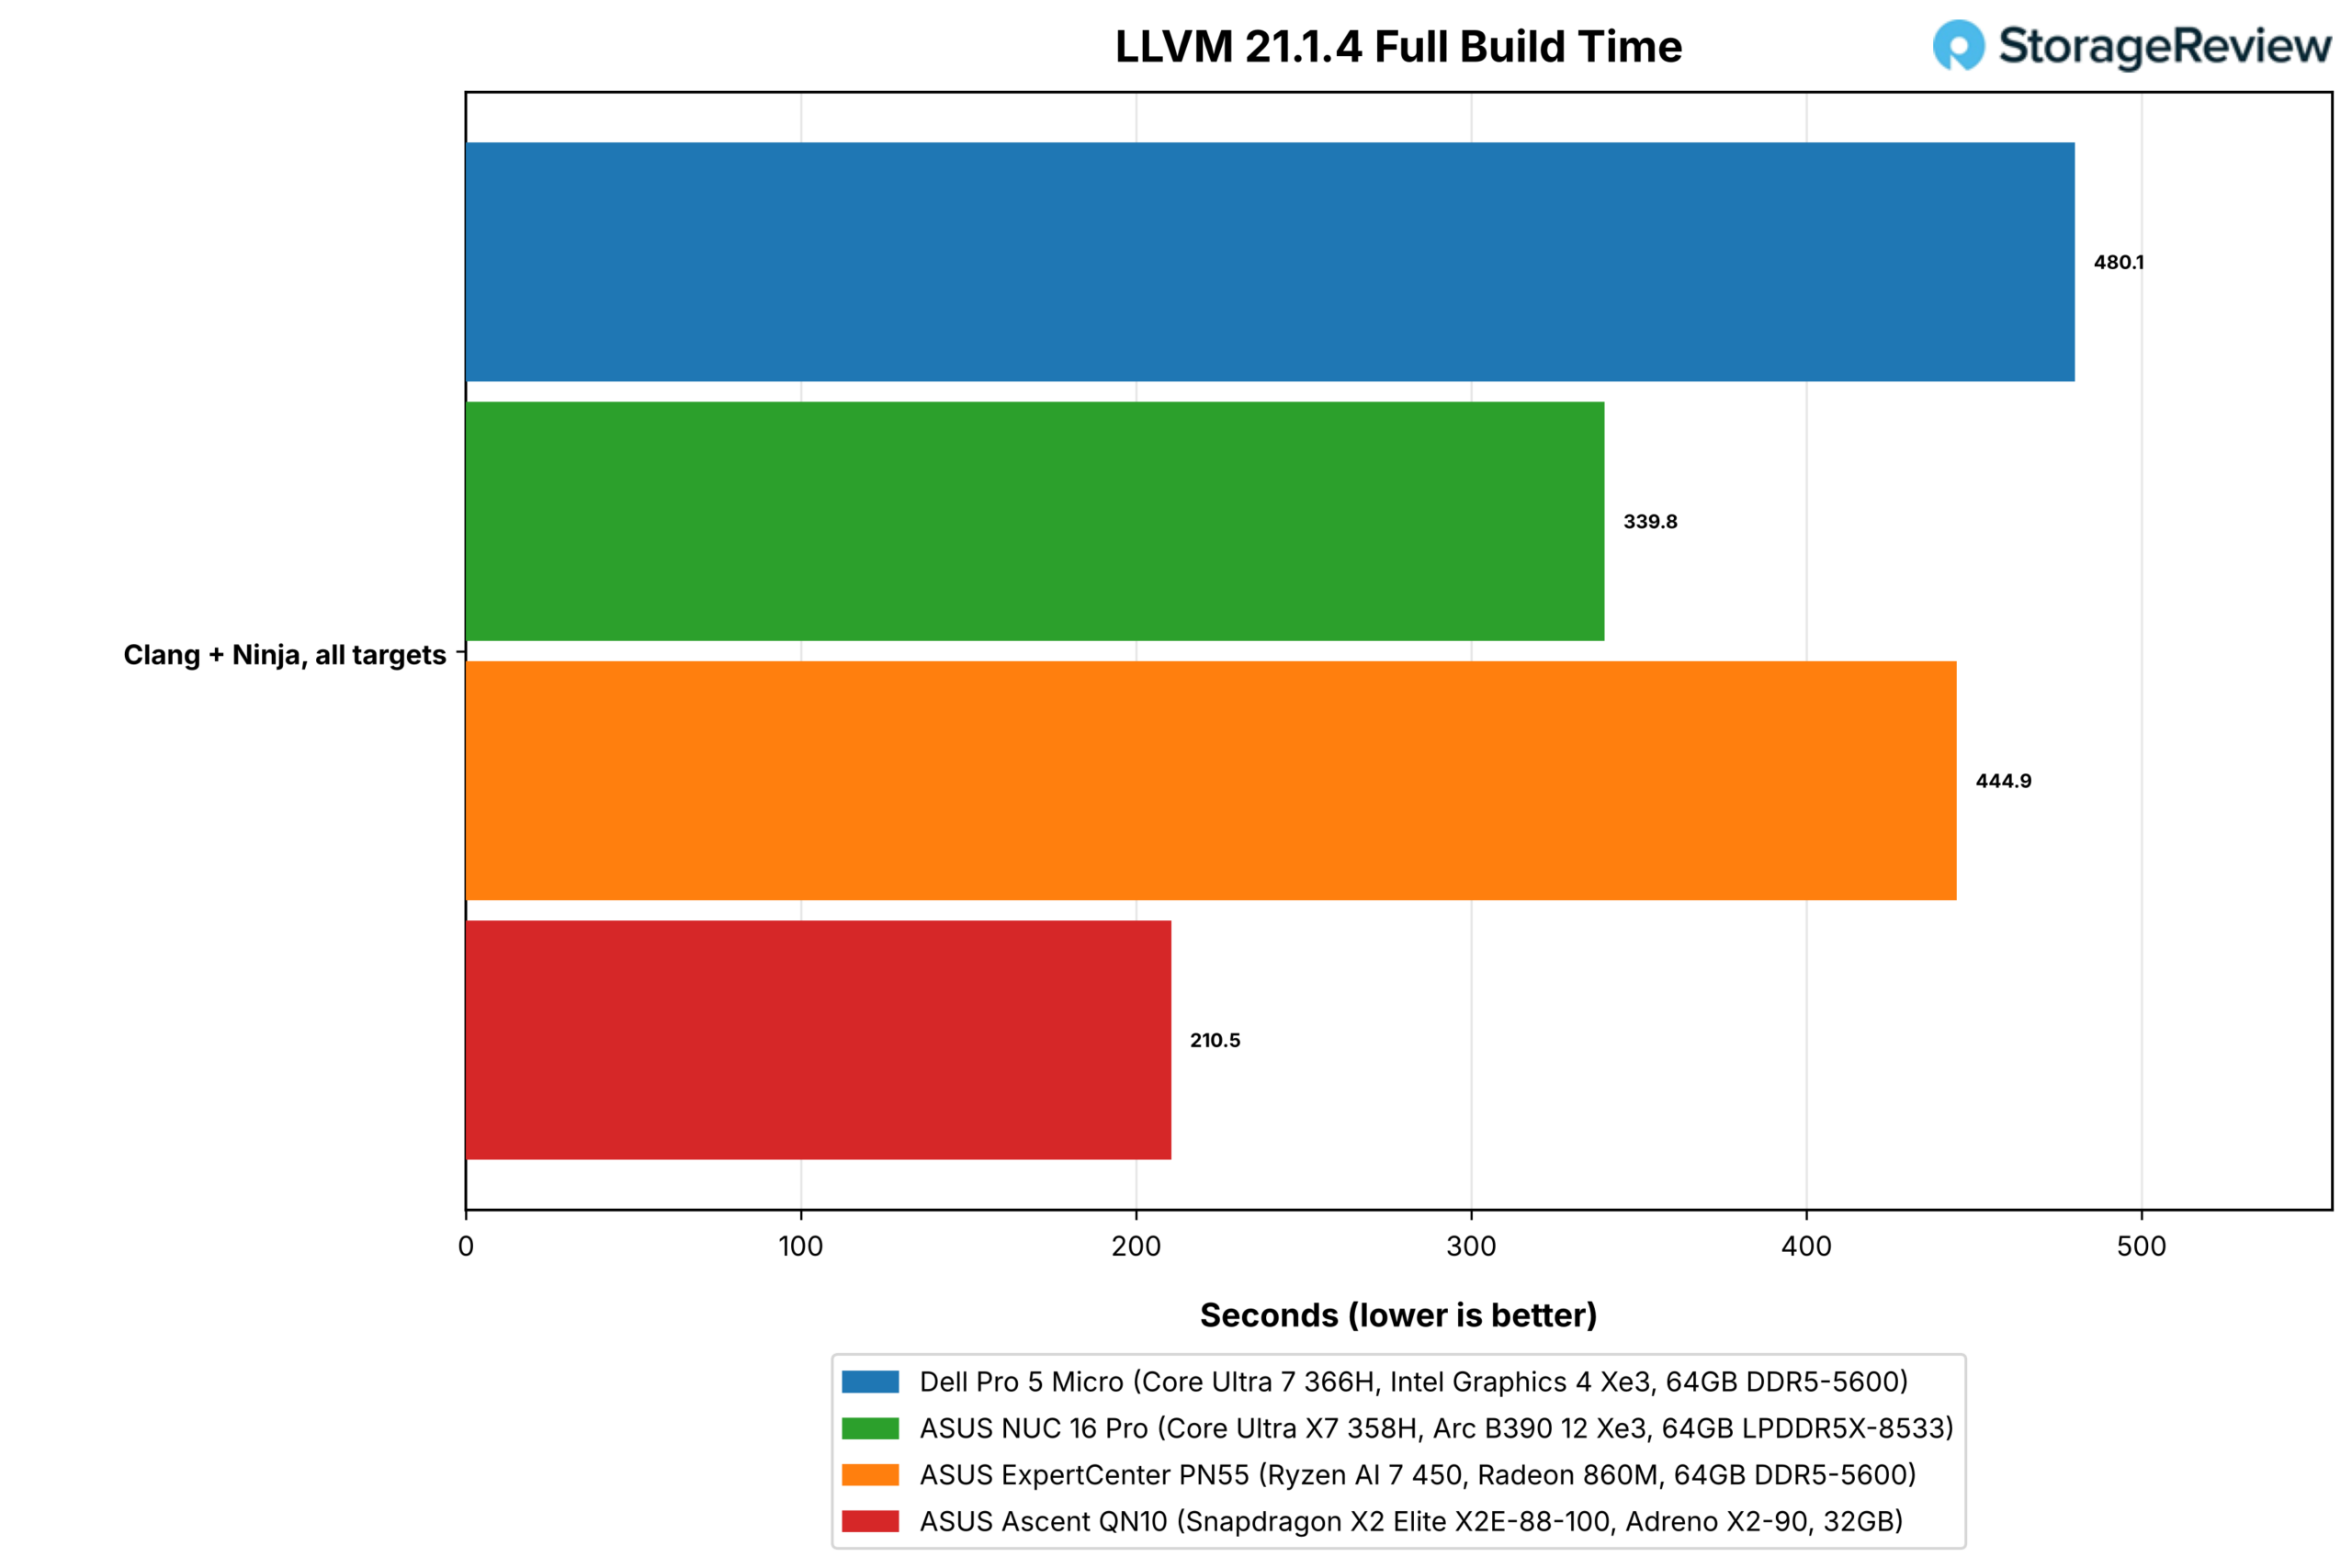
- All-core work runs 28 percent behind the NUC on the power budget: 3,601 multi-core against 4,980, 75.9 GIPS in 7-Zip against 107.7, and an LLVM build of 480.1 seconds against 339.8; the Pro 5 Micro’s all-core clock settles at 2,483MHz as shipped, with no vendor performance mode to change it, where the NUC runs 3,572MHz, and the steady-state score of 3,352 is 0.954 of the first pass.
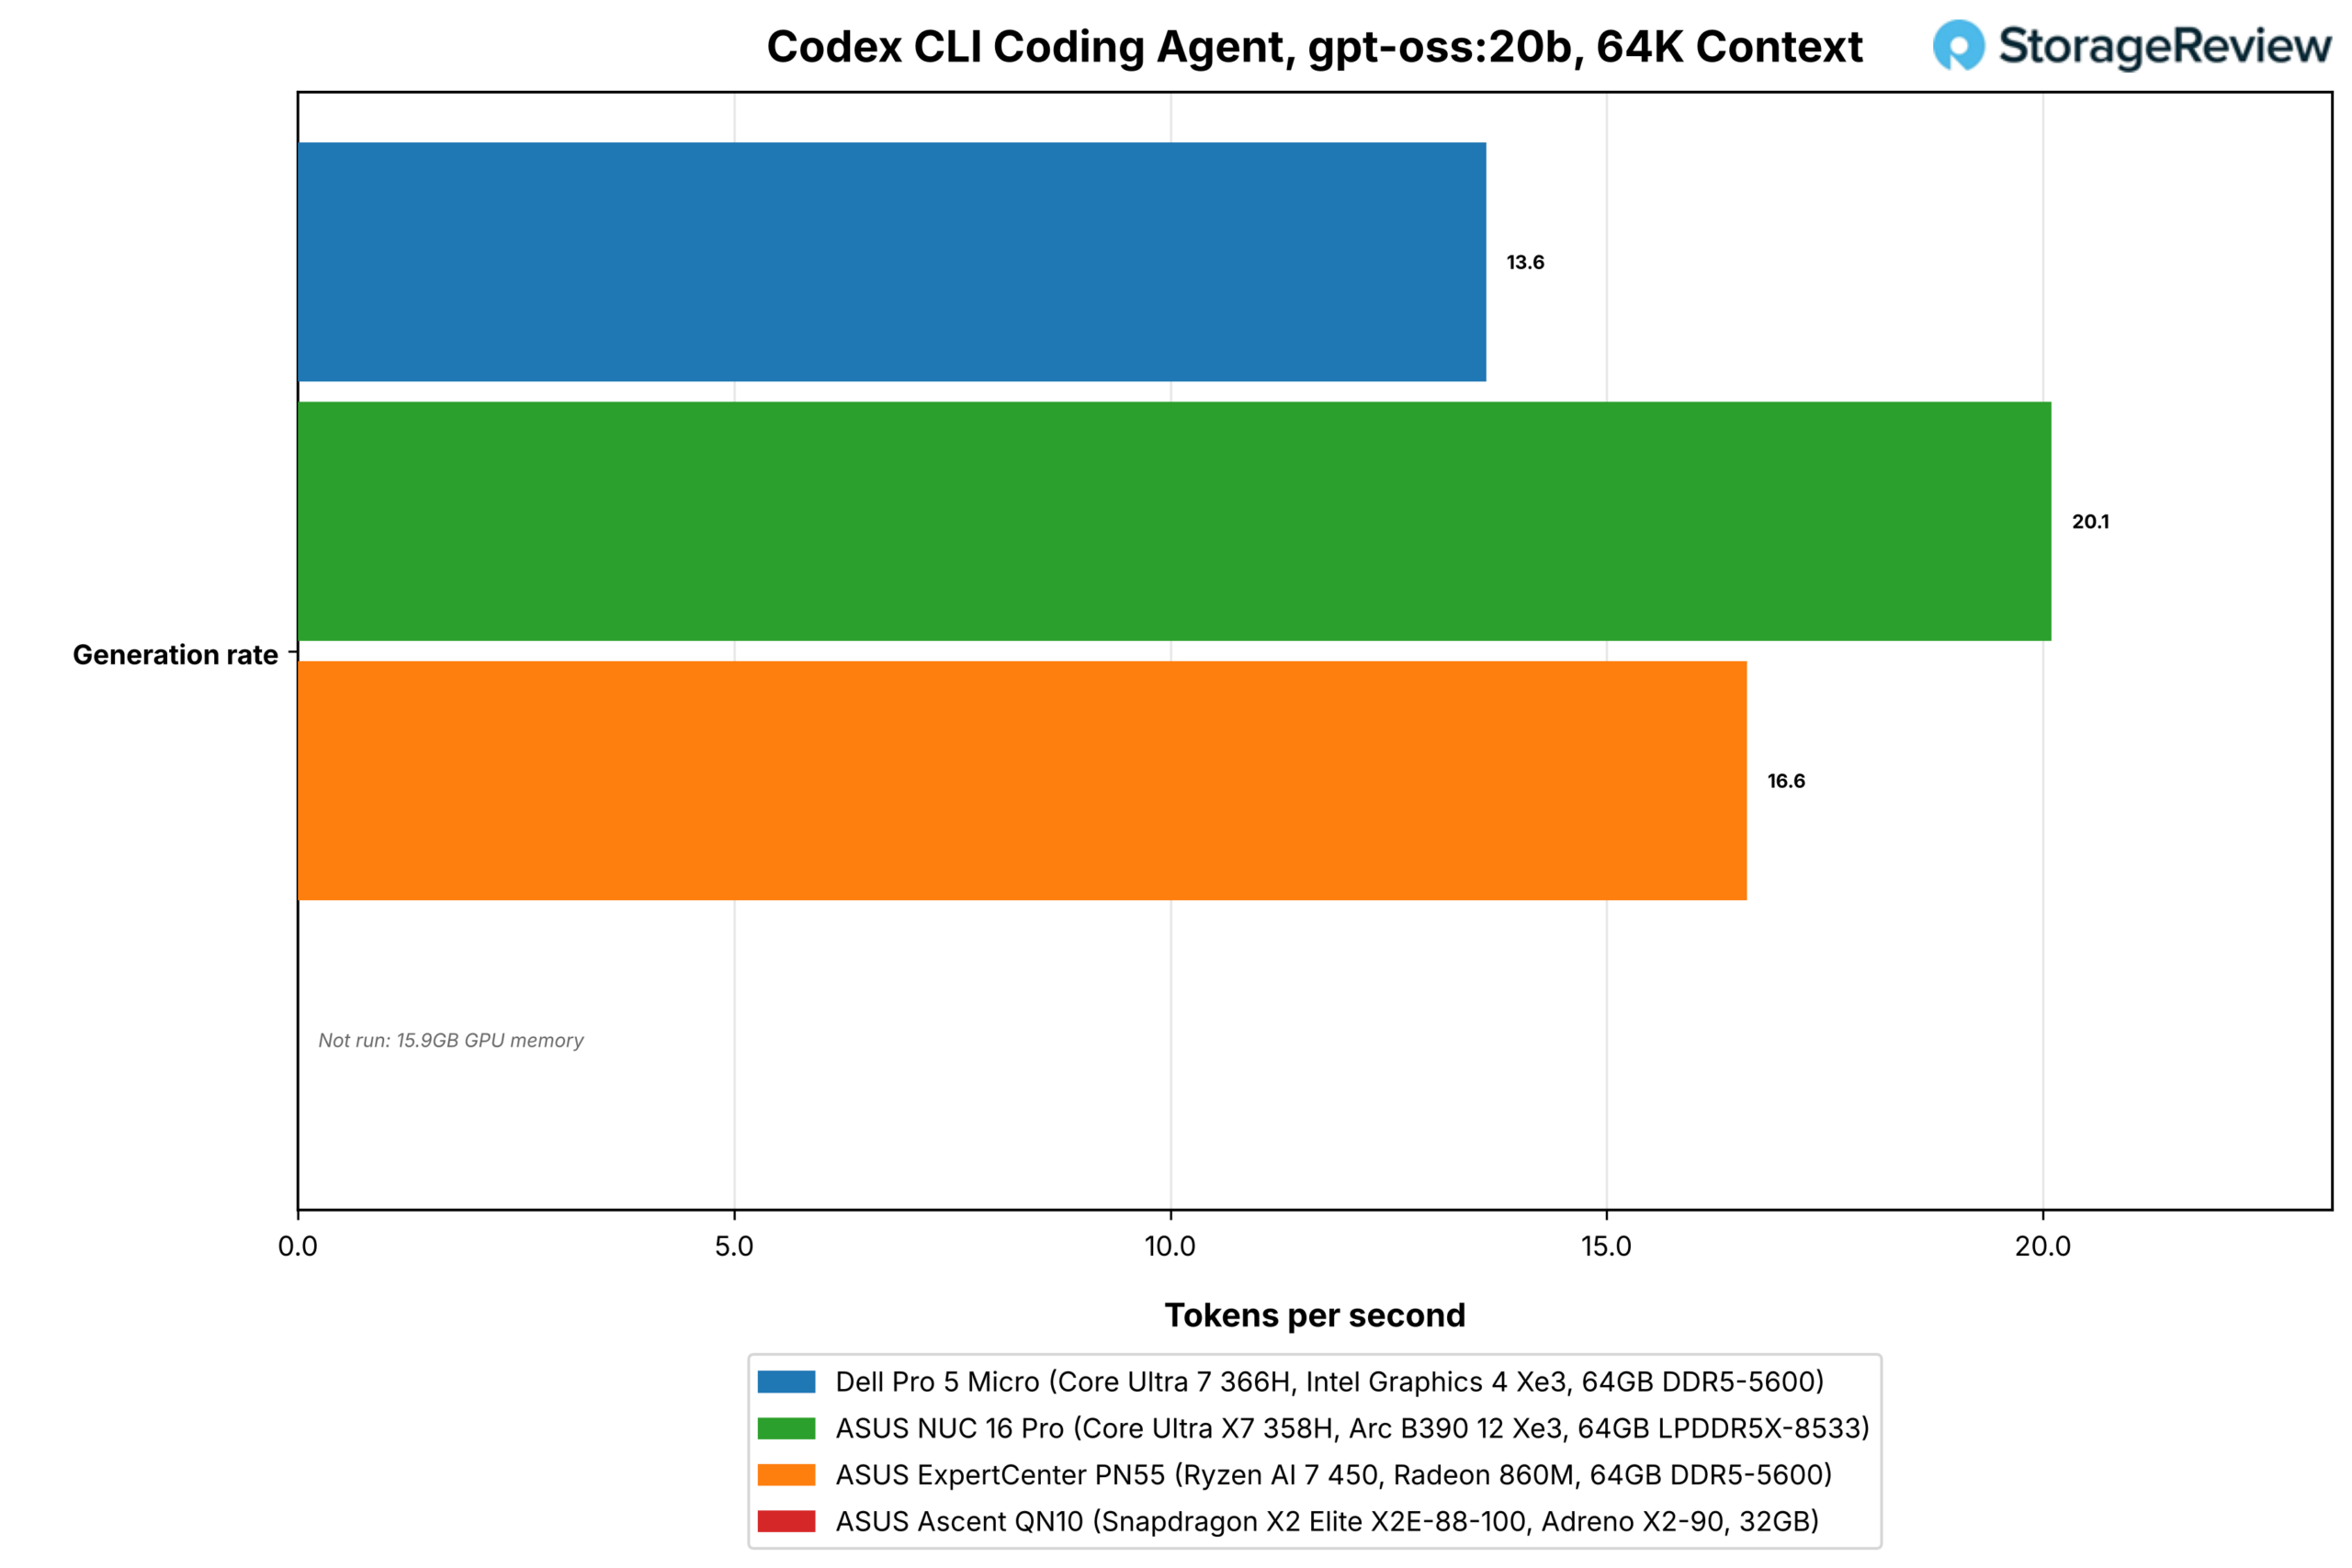
- Four Xe3 cores cover local AI for one user: MLPerf Client runs Llama 3.1 8B at 17.8 tokens per second and Phi-4-mini at 27.6, the Codex coding agent generates 13.6 tokens per second with gpt-oss:20b, and Ministral 3 3B serves 29.5 aggregate tokens per second at four concurrent requests, between a quarter and a third behind the 12 Xe3 core NUC on each; the 47.6GB of GPU-usable memory means every 20B and 27B model in our suite loads and runs.
- The commercial feature set is the reason to buy it: vPro Enterprise, two DDR5 SO-DIMM slots rated to 7200 MT/s, two M.2 2230/2280 SSD slots, a self-encrypting Gen5 drive, Wi-Fi 7, HDMI 2.1 plus DisplayPort 1.4a plus a 20Gbps USB-C with DisplayPort and 100W power input, and a rear module bay with DisplayPort 2.1, VGA, serial, PS/2, fiber, or dual DisplayPort options; the X-series NUC has no vPro and no memory slots.
- The Gen5 SSD runs at Gen4 speed in this chassis: fio reads 7,095MB/s and writes 6,781MB/s sequentially with 538.3K IOPS on 4K random reads at 16 jobs (586.6K at its eight-job peak), a Gen4 x4 ceiling that matches the “up to Gen4” PCIe bus in Dell’s specifications, against 14,236MB/s and 972.9K IOPS at 16 jobs from the NUC’s Gen5 link; the Pro 5 Micro’s 6,781MB/s sequential write is the best in this group.
Where the Pro 5 Micro Sits
Dell sells the Pro 5 Micro as an “ultracompact Copilot+ PC” for productivity, the mainstream rung of its numbered commercial desktop line, and the chassis carries the OptiPlex Micro heritage in everything but the name: the configurator still lists an “OptiPlex Micro and Thin Client Vertical Stand” as the no-cost stand option alongside a monitor-mount kit. The box measures 182 x 36 x 178mm, 1.17 liters, and weighs 1.10kg at the base configuration, with a 90W barrel adapter or a 100W USB-C adapter at the same price; our unit shipped with the 90W barrel adapter.
The configurator opens at $1,617 for the Core Ultra 5 335 with 16GB of DDR5-5600 and a 512GB Gen4 QLC SSD, and Dell lists our review configuration at $4,500 on Dell.com. The Core Ultra 7 366H accounts for $460 of that and 64GB of DDR5-5600 for $1,530, with the 1TB self-encrypting SSD, Wi-Fi 7, the HDMI module, Windows 11 Pro, and three years of Basic Onsite Service making up the rest. Fleet buyers purchase through Dell account teams and partners at negotiated volume pricing, so $4,500 is the single-unit ceiling. The SN8050S appears in the specifications manual but not in the US configurator at the time of writing.
Intel’s Core Ultra Series 3 quick reference explains the processor Dell chose. The Core Ultra 7 366H is vPro eligible, supports DDR5 to 7200 MT/s and 128GB alongside LPDDR5X, and exposes 20 PCIe lanes, 12 of them Gen5. The Core Ultra X7 358H in the NUC 16 Pro is not vPro-eligible, supports LPDDR5X only, and exposes 12 lanes. A commercial micro with user-serviceable SO-DIMMs and fleet management cannot use the X-series part, and the price of that constraint is the GPU: 4 Xe3 cores rated at 40 TOPS against 12 cores at 122 TOPS, with the same 50 TOPS NPU on both.
Cela fait ASUS NUC16 Pro the right primary comparison, with the Centre d'expertise ASUS PN55 on AMD’s Ryzen AI 7 450 as the other SO-DIMM commercial micro in the lab and the ASUS Ascent QN10 on the Snapdragon X2 Elite as the Arm reference. All four ran the same sr-client 1.13 suite, so the figures below come from the current build of each test.
Construire et concevoir
The front of the Pro 5 Micro carries the power button, a headset jack, a 5Gbps USB-A port, and a 10Gbps USB-C port. The back carries the 1GbE Intel i219-LM port, two USB 2.0 ports with Smart Power On, two 5Gbps USB-A ports, HDMI 2.1 (TMDS), DisplayPort 1.4a, and the 20Gbps USB 3.2 Gen 2×2 Type-C port that doubles as a DisplayPort 1.4a output and a 100W power input. A Kensington slot, a padlock ring, the 4.5mm DC jack, and the optional antenna port fill out the panel.
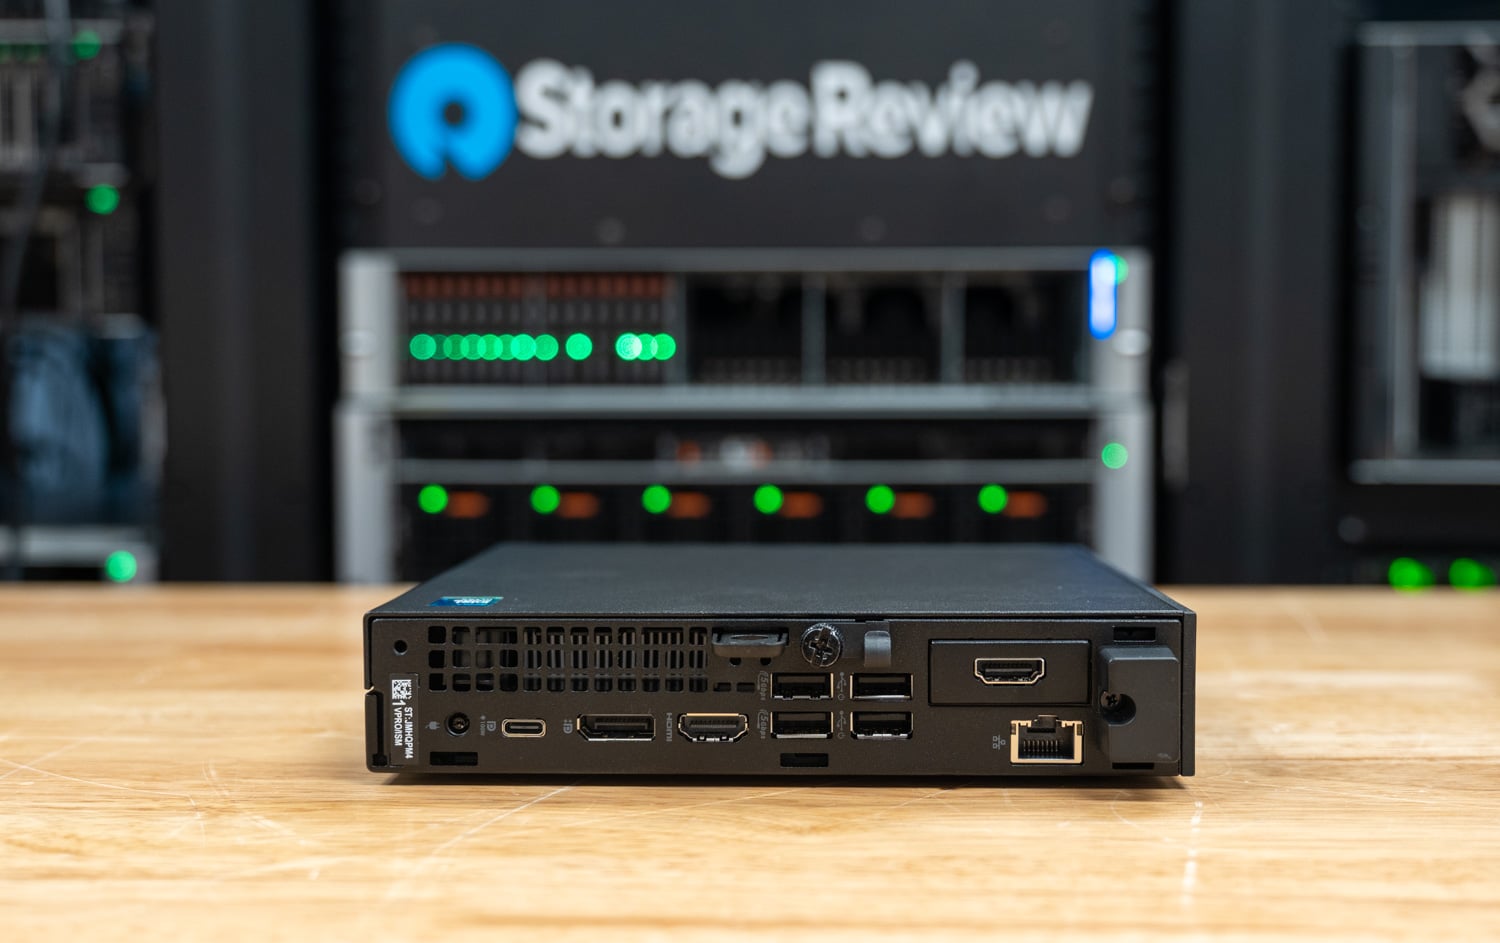
The module bay is the part of this chassis that an IT buyer will care about configuring. Dell’s specifications list ten options for the single rear slot: a 10Gbps USB-C with DisplayPort Alt Mode, a DisplayPort 2.1 (UHBR20) output rated for 7680 x 4320 at 60Hz, HDMI 2.1 FRL, VGA, two 10Gbps USB-A ports, PS/2 plus serial, serial alone, a 1Gbps fiber port, or a dual DisplayPort 1.4a expansion module that takes the display count to six with MST. Without a module, the integrated graphics drive three displays, four with MST, at up to 5120 x 3200 on the DisplayPort and USB-C outputs and 4096 x 2160 on the HDMI port.
Our review unit arrived with the optional HDMI module fitted in the bay, which gives it two HDMI outputs alongside the DisplayPort and USB-C, and the rear panel photo shows the module port in use.
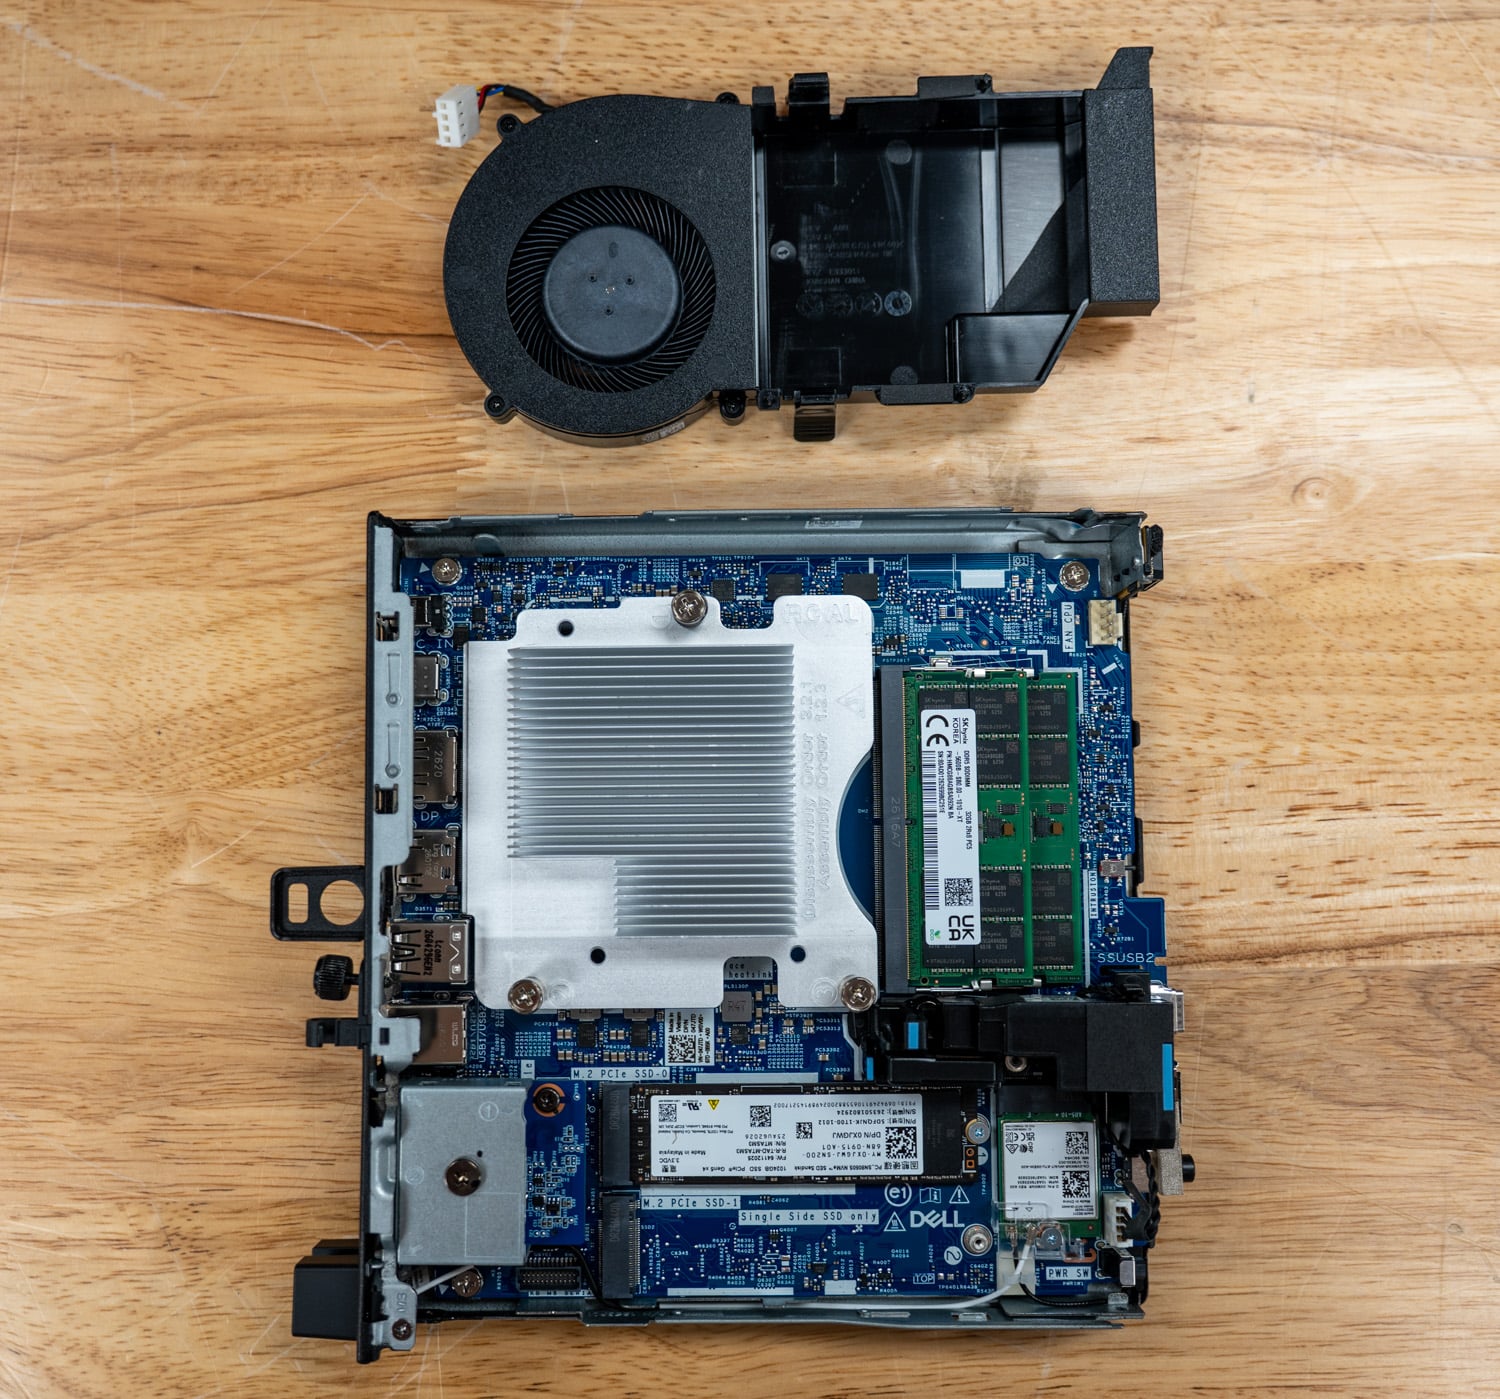
Inside sit the SODIMM slots, two M.2 2230/2280 SSD slots, and an M.2 2230 slot for the Wi-Fi card, with Intel’s Wi-Fi 7 BE211 (5,760Mbps, Bluetooth 6.0) as the default radio, a BE213 option, and a MediaTek Wi-Fi 6E option. The 2W internal speaker, the Realtek ALC3204 codec, TPM 2.0, and the self-encrypting drive option round out the platform. Dell rates the box for 0C to 35C operation and ships it with Ubuntu 24.04 LTS as an alternative to Windows 11 Pro.
The management stack is the other half of the commercial case. The Core Ultra 7 366H carries Intel vPro Enterprise with Active Management Technology, which gives an administrator out-of-band discovery, diagnosis, and repair of the box when the operating system is down, and Dell adds Dell Command Update for driver and firmware delivery, SafeBIOS with BIOS recovery, and a discrete TPM 2.0 on top of it. The review configuration also carries three years of Basic Onsite Service, so a failed unit behind a kiosk gets a technician at the site once remote diagnosis runs out.
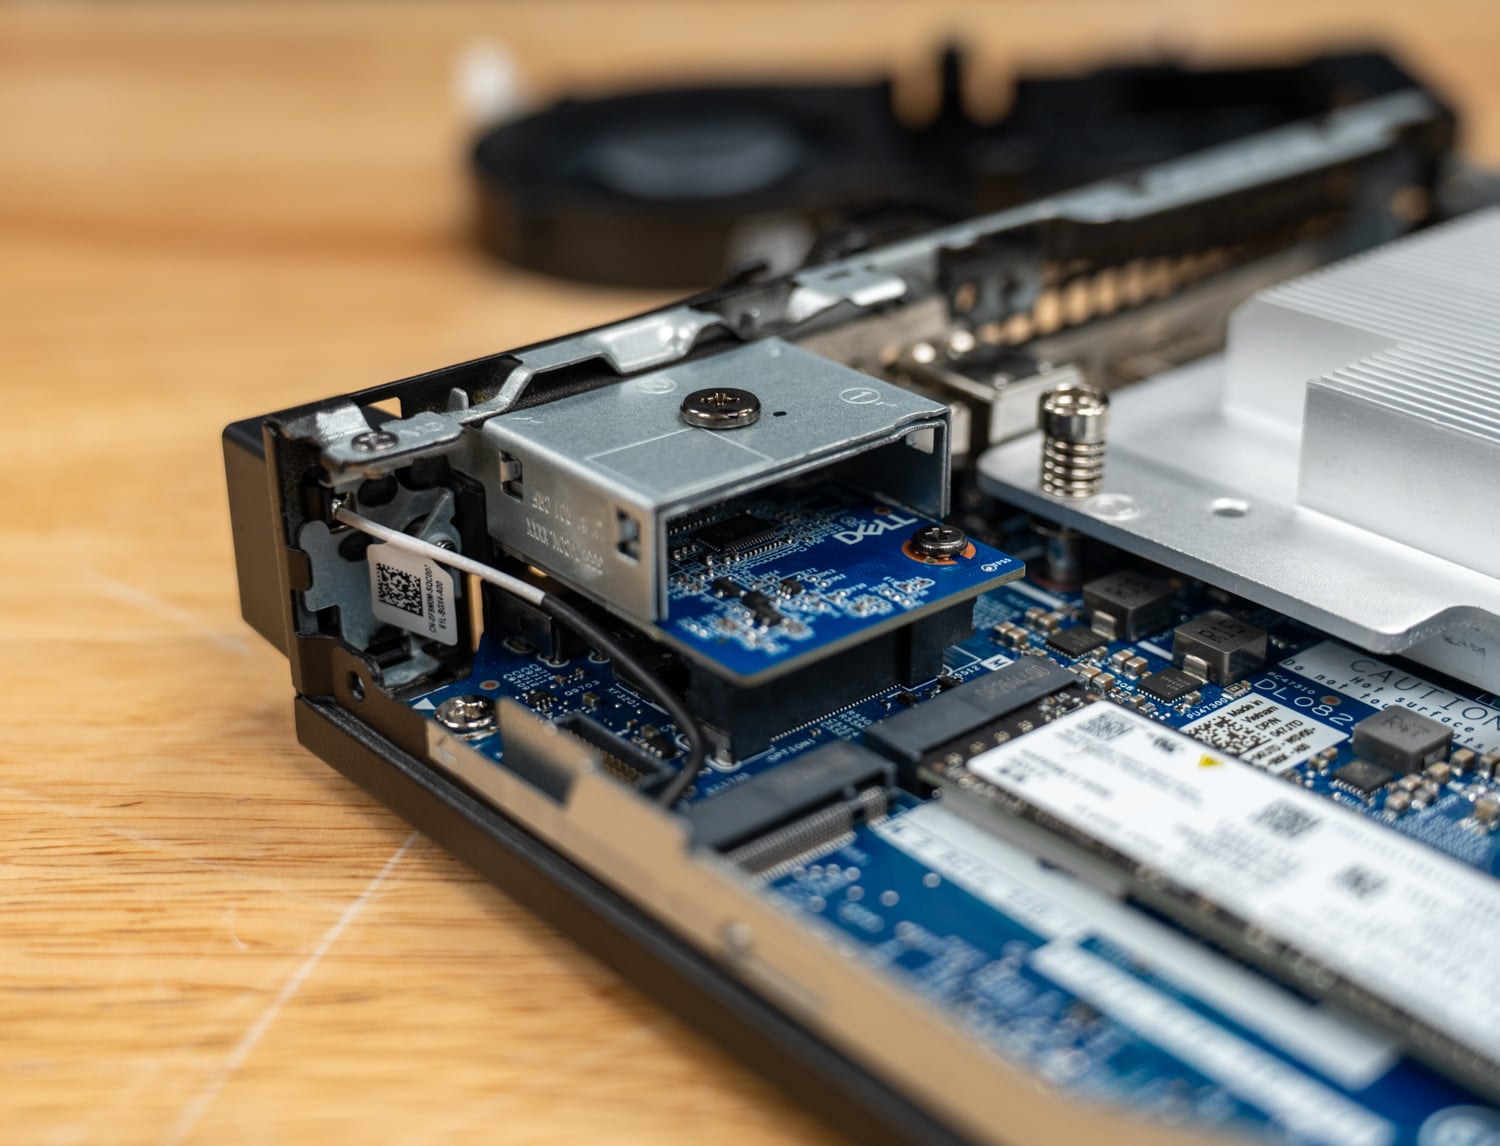
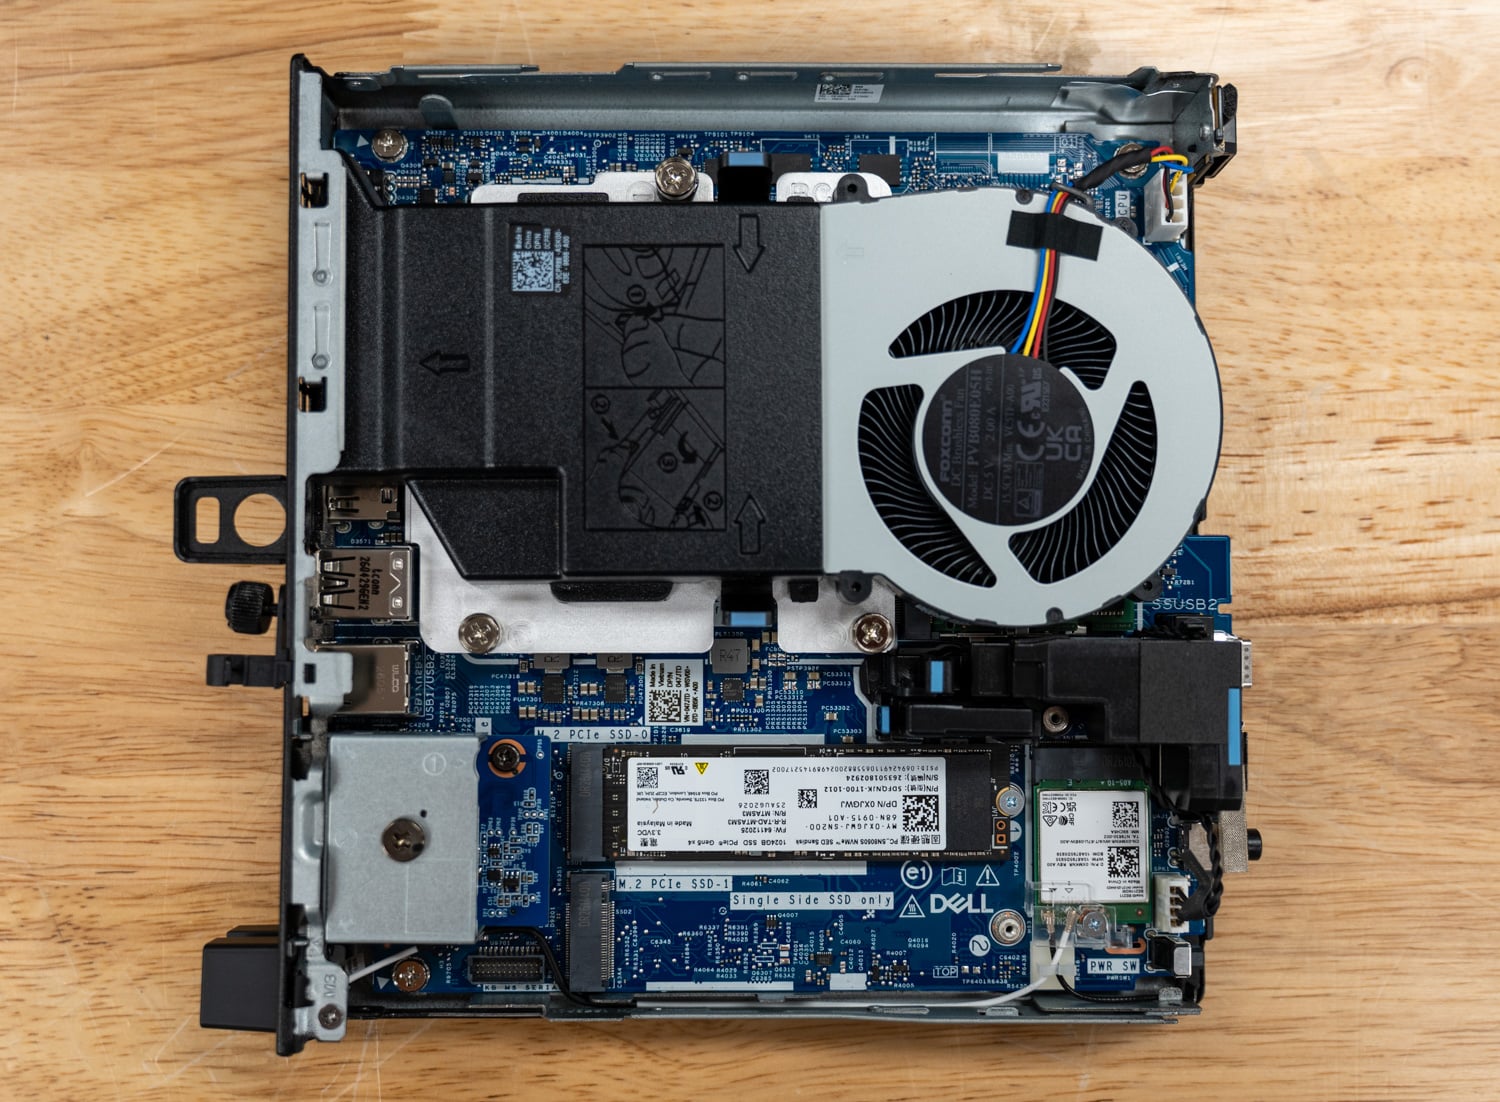
Opening the Pro 5 Micro is about as simple as a small desktop gets. The top cover pops off and exposes every serviceable part at once: the CPU heatsink and its blower, the two SO-DIMM slots, and the M.2 bays, with nothing to unroute or unscrew on the way in. The case is stamped steel and feels built for a hard life behind a kiosk or in a back office, which is the environment Dell sells it into. The one thing we would change inside is the M.2 bay, which tops out at Gen4 speeds.
Dell Pro 5 Micro Specifications
| Spécifications | Dell Pro 5 Micro P5M1260 (as tested) |
|---|---|
| Plateforme complète | |
| Processeur | Intel Core Ultra 7 366H vPro, 16 cores (4P + 8E + 4LPE) / 16 threads, up to 4.80GHz, 18MB cache, 25W base power Also offered: Intel Core Ultra 5 335 vPro, 8 cores / 8 threads, up to 4.60GHz, 12MB cache |
| Les éléments graphiques | Intel Graphics (integrated, 4 Xe3 cores, up to 2.5GHz) |
| NPU | Intel NPU, 50 TOPS (47 TOPS on the Core Ultra 5 335) |
| Mémoire | 64GB DDR5-5600 (2 x 32GB SO-DIMM) as tested Two SODIMM slots, 16GB to 64GB, 5600 / 6400 / 7200 MT/s depending on processor and configuration |
| Stockage | Sandisk PC SN8050S 1TB TLC Gen5 NVMe, Opal 2.0 self-encrypting, M.2 2280 as tested Two M.2 2230/2280 SSD slots; PCIe bus up to Gen4 per Dell |
| Sans-fil | Intel Wi-Fi 7 BE211 (up to 5,760Mbps) with Bluetooth 6.0 as tested Options: Intel Wi-Fi 7 BE213, MediaTek Wi-Fi 6E MT7922 |
| Réseau filaire | Intel i219-LM, 1GbE RJ45 |
| Ports and Display | |
| Ports avant | Headset jack, USB 3.2 Gen 1 (5Gbps) Type-A, USB 3.2 Gen 2 (10Gbps) Type-C |
| Ports arrière | RJ45 1GbE, 2 x USB 2.0 with Smart Power On, 2 x USB 3.2 Gen 1 (5Gbps) Type-A, HDMI 2.1 TMDS, DisplayPort 1.4a HBR3, USB 3.2 Gen 2×2 (20Gbps) Type-C with DisplayPort 1.4a Alt Mode and 100W power in, 4.5mm DC-in, Kensington slot, padlock ring |
| Optional module port | USB-C 10Gbps with DP Alt Mode DisplayPort 2.1 UHBR20 HDMI 2.1 FRL VGA 2 x USB-A 10 Gb/s PS/2 and serial Port série Fibre 1GbE Dual DisplayPort 1.4a HBR2 expansion module |
| Prise en charge de l'affichage | Up to 5120 x 3200 at 60Hz on DisplayPort and USB-C, 4096 x 2160 at 60Hz on HDMI 3 displays (4 with MST) from the base ports; up to 6 with the dual DisplayPort module |
| Power, Physical, and Security | |
| Adaptateur secteur | 90W 4.5mm barrel (19.5V, 4.62A) or 100W USB Type-C |
| Dimensions | 182.00 x 36.00 x 178.00mm (7.17 x 1.42 x 7.01 inches), about 1.17 liters |
| Poids | 1.10kg (2.42lb) minimum, 1.32kg (2.92lb) maximum |
| Environnement d'exploitation | 0C to 35C, 10 to 90 percent relative humidity, up to 3,048m |
| Sécurité | TPM 2.0 (discrete on the review unit), self-encrypting drives, Kensington slot, padlock ring, Intel vPro Enterprise |
| Système exploitation | Windows 11 Pro (Copilot+ PC) as tested; Windows 11 Home, Ubuntu 24.04 LTS, or no OS |
| Certifications | ENERGY STAR, EPEAT Gold avec Climate+ |
| Garantie | Three years of Basic Onsite Service as configured |
| Tarifs et Prix | $1,617 base (Core Ultra 5 335, 16GB, 512GB); $4,500 as tested per Dell (Core Ultra 7 366H, 64GB DDR5-5600, 1TB SED, Wi-Fi 7, HDMI module, three years Basic Onsite Service), single-unit Dell.com pricing |
Configuration du test et méthodologie
Our review unit runs the Core Ultra 7 366H vPro with 64GB of DDR5-5600 in two SO-DIMMs and the 1TB SN8050S on Windows 11 Pro 26H2, in Windows Best Performance power mode. The Pro 5 Micro ships with no Dell performance or thermal mode of its own, so Best Performance is the only power setting it exposes.
The comparison units ran the same sr-client 1.13 suite in Best Performance mode on their shipped drivers. The Dell measured 47.6GB of GPU-usable memory, which places it in the S and M memory tiers along with the NUC 16 Pro and the PN55; the 32GB QN10 measured 15.9GB GPU-usable and ran the CPU, GPU, and storage tests only.
| Configuration | Processeur | Mémoire | GPU | lecteur de démarrage | Système d'exploitation et mode d'alimentation |
|---|---|---|---|---|---|
| Dell Pro 5 Micro (P5M1260) | Intel Core Ultra 7 366H vPro, 16C / 16T (4P + 8E + 4LPE) | 64GB DDR5-5600 SO-DIMM (2x32GB), 47.6GB GPU-usable | Intel Graphics (integrated, 4 Xe3 cores) | Sandisk PC SN8050S SED 1TB (Gen5 drive), M.2 2280 | Windows 11 Pro 26H2 (x64), Best performance (no vendor performance mode) |
| ASUS NUC 16 Pro (NUC16GDKX76) | Intel Core Ultra X7 358H, 16C / 16T (4P + 8E + 4LPE) | 64GB LPDDR5X-8533 (soldered), 47.5GB GPU-usable | Intel Arc B390 (integrated, 12 Xe3 cores) | Samsung PM9E1 1TB, Gen5 x4 | Windows 11 Pro 26H2 (x64), Best performance |
| Centre d'expertise ASUS PN55 | AMD Ryzen AI 7 450, 8C / 16T | 64GB DDR5-5600 SO-DIMM (2x32GB), 16GB assigned to GPU, 47.7GB GPU-usable | AMD Radeon 860M (intégrée) | Micron 2500 1TB, Gen4 x4 | Windows 11 Pro 26H2 (x64), Best performance |
| ASUS Ascent QN10 | Qualcomm Snapdragon X2 Elite X2E-88-100, 18C / 18T (Arm) | 32GB LPDDR5X-8294, 15.9GB GPU-usable | Qualcomm Adreno X2-90 (intégré) | Sandisk PC SN5100S 512GB, Gen4 x4 | Windows 11 Pro 26H1 (Arm64), Performances optimales |
The Pro 5 Micro exposes no CPU temperature sensor that sr-client can read, so the suite fell back to fixed 180-second pauses between tests, and we have no temperature trace for it. The NUC 16 Pro’s sensor reported a constant 40.1C through every test, which is not a real reading, so we do not report temperatures for either Intel system. The clocks each system held under load, which the suite logs independently, carry the thermal analysis in this review.
Three tests did not complete on every system: MLPerf Client did not finish on the PN55 after a disk space failure, gpt-oss:120B did not fit on any of these systems, and Qwen-Image 20B failed on the NUC 16 Pro in stable-diffusion.cpp. Each chart marks the affected system in place. Geekbench, 3DMark, PCMark 10, Cinebench 2024, and Procyon were not in the kit for these runs, so this review carries the open-source CPU suite in their place.
Performances de l'IA locale
Client MLPerf v2.0
MLPerf Client runs on the integrated GPU through OpenVINO on both Intel systems, so the comparison is 4 Xe3 cores against 12 with the same software path. The Pro 5 Micro generates Llama 3.1 8B at 17.8 tokens per second and Phi-4-mini at 27.6, against 26.8 and 41.1 on the NUC 16 Pro, about a third behind on both. Time to first token shows the larger gap: 0.536 seconds on Llama against 0.211, because prompt processing is the compute-bound phase and scales with Xe core count.
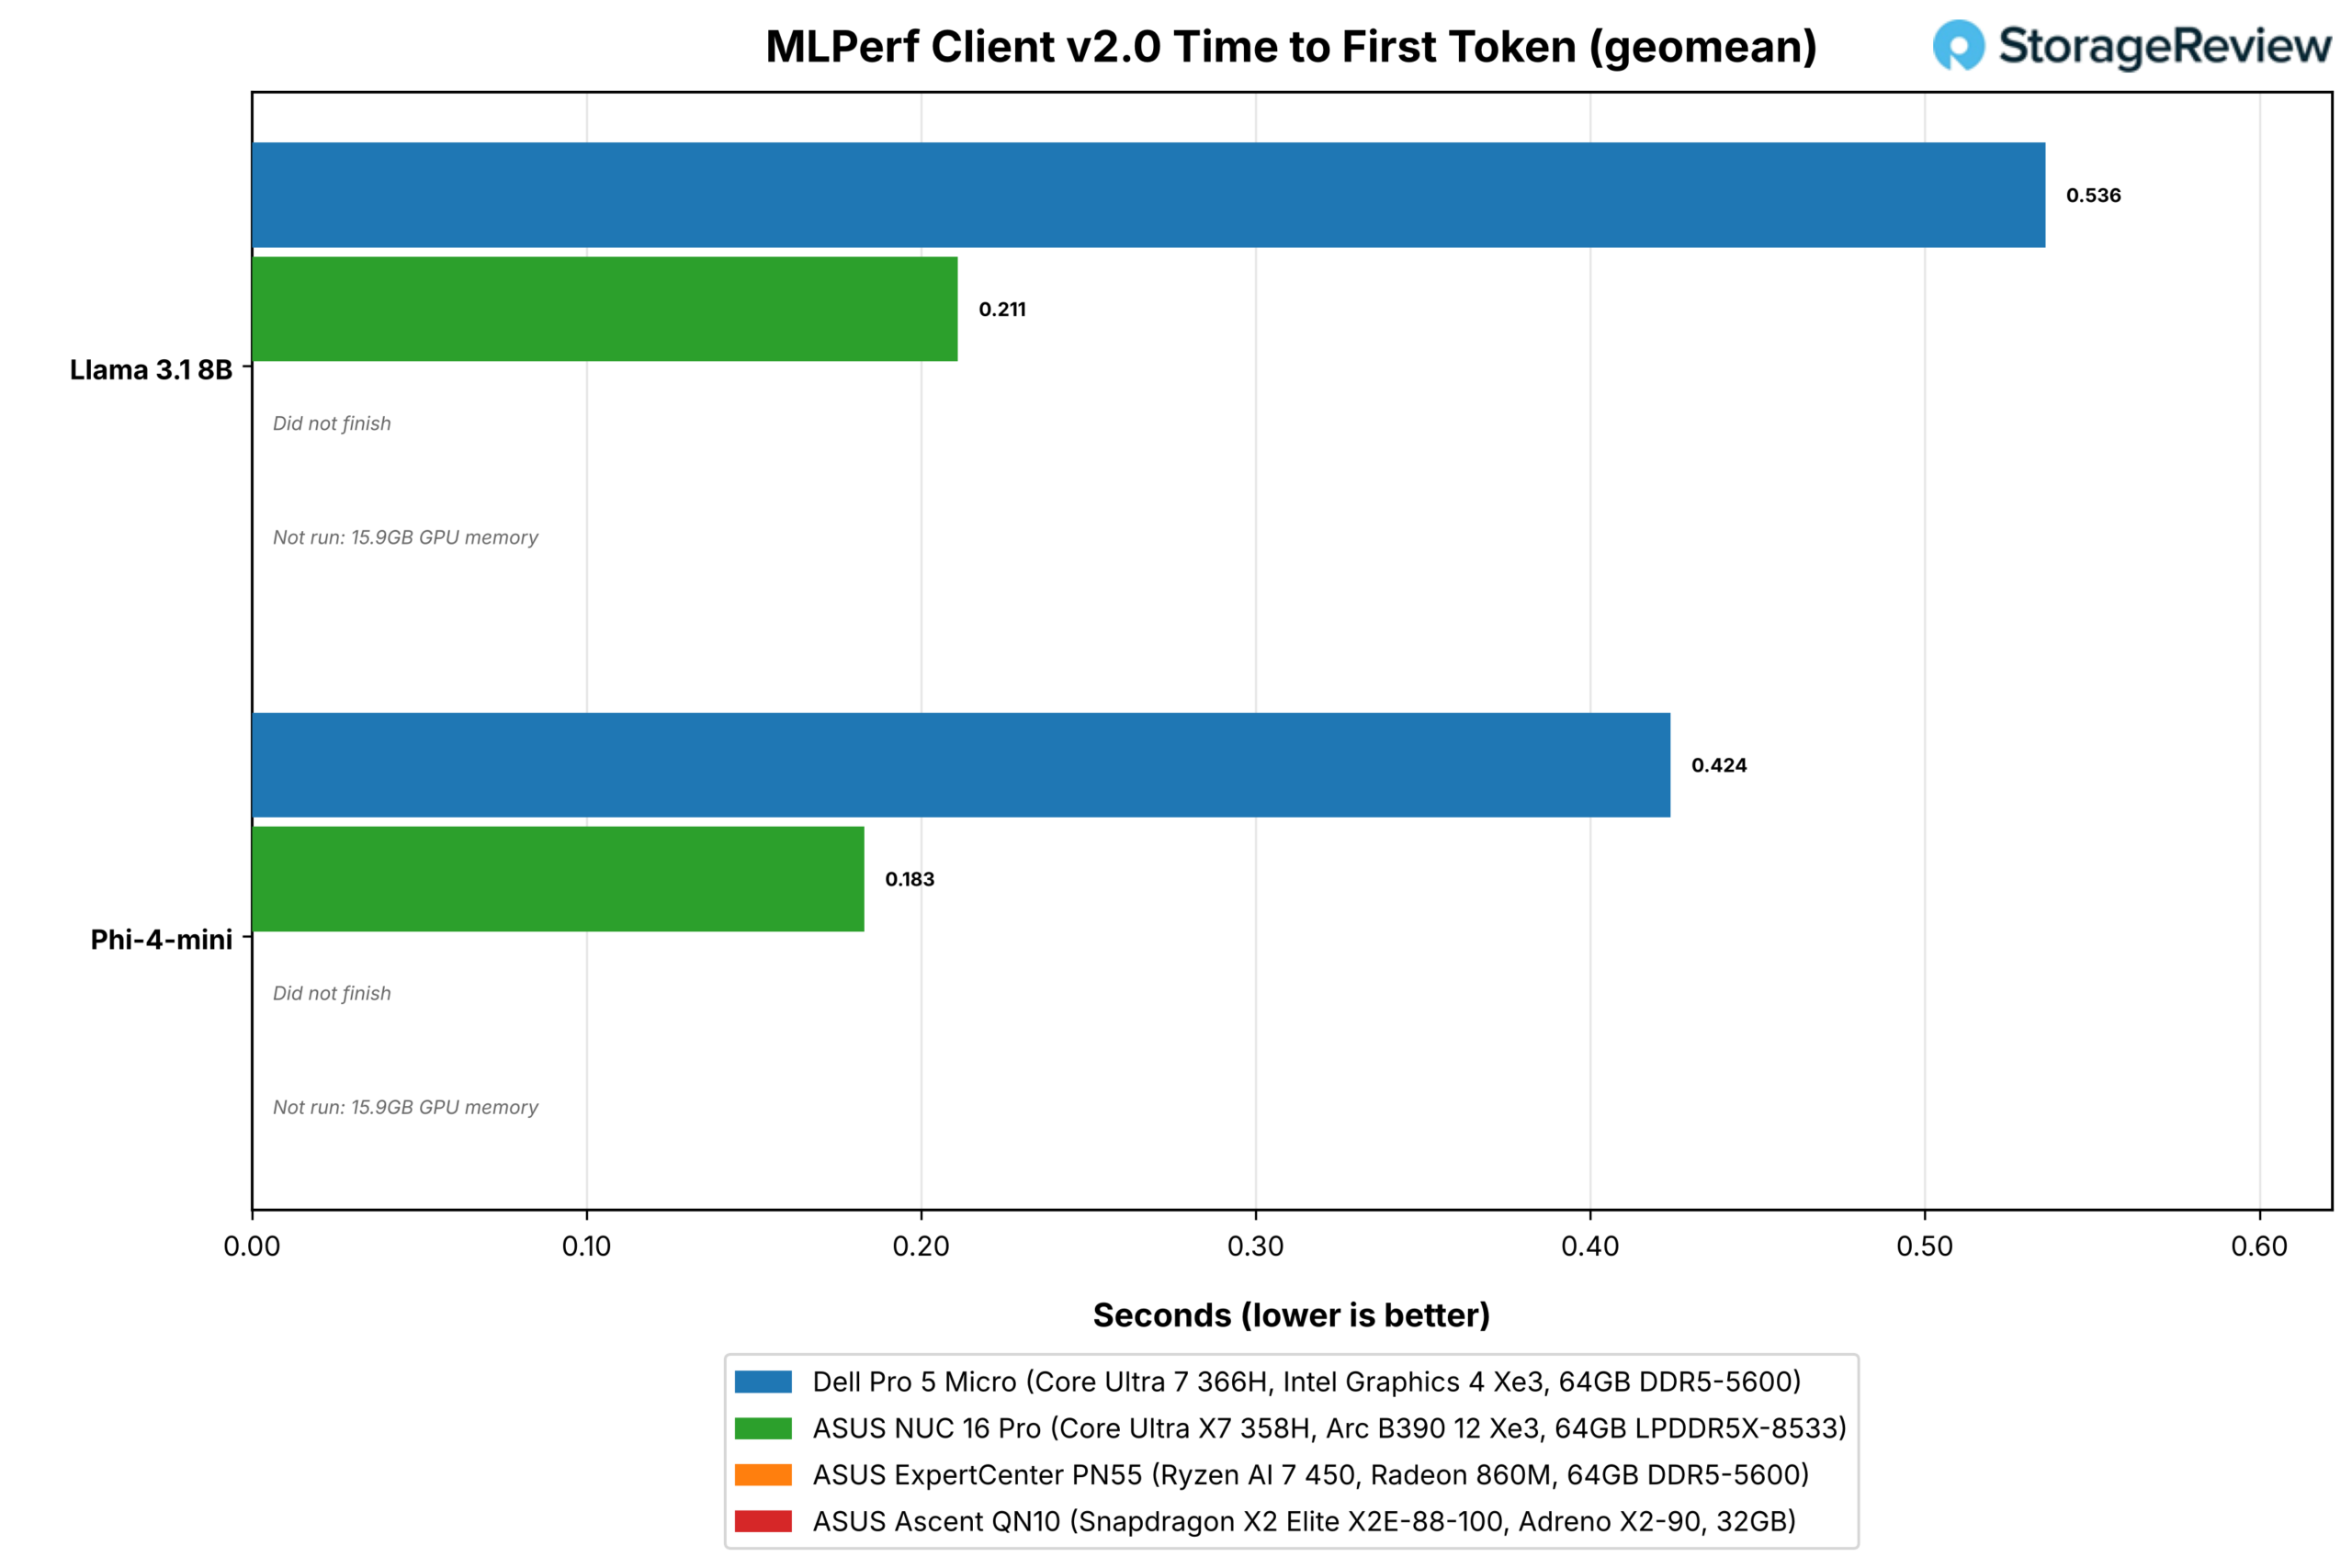
The agentic workloads in MLPerf Client tell the same story with a longer tail. The Data Analyst agent scenario finishes end to end in 135.1 seconds on the Pro 5 Micro against 85.3 on the NUC, with first tokens at 4.5 and 1.6 seconds. For a single user chatting with an 8B model, 18 tokens per second reads faster than most people do; the half-second first token is where the smaller GPU is felt.
Chargement du modèle et agent de codage
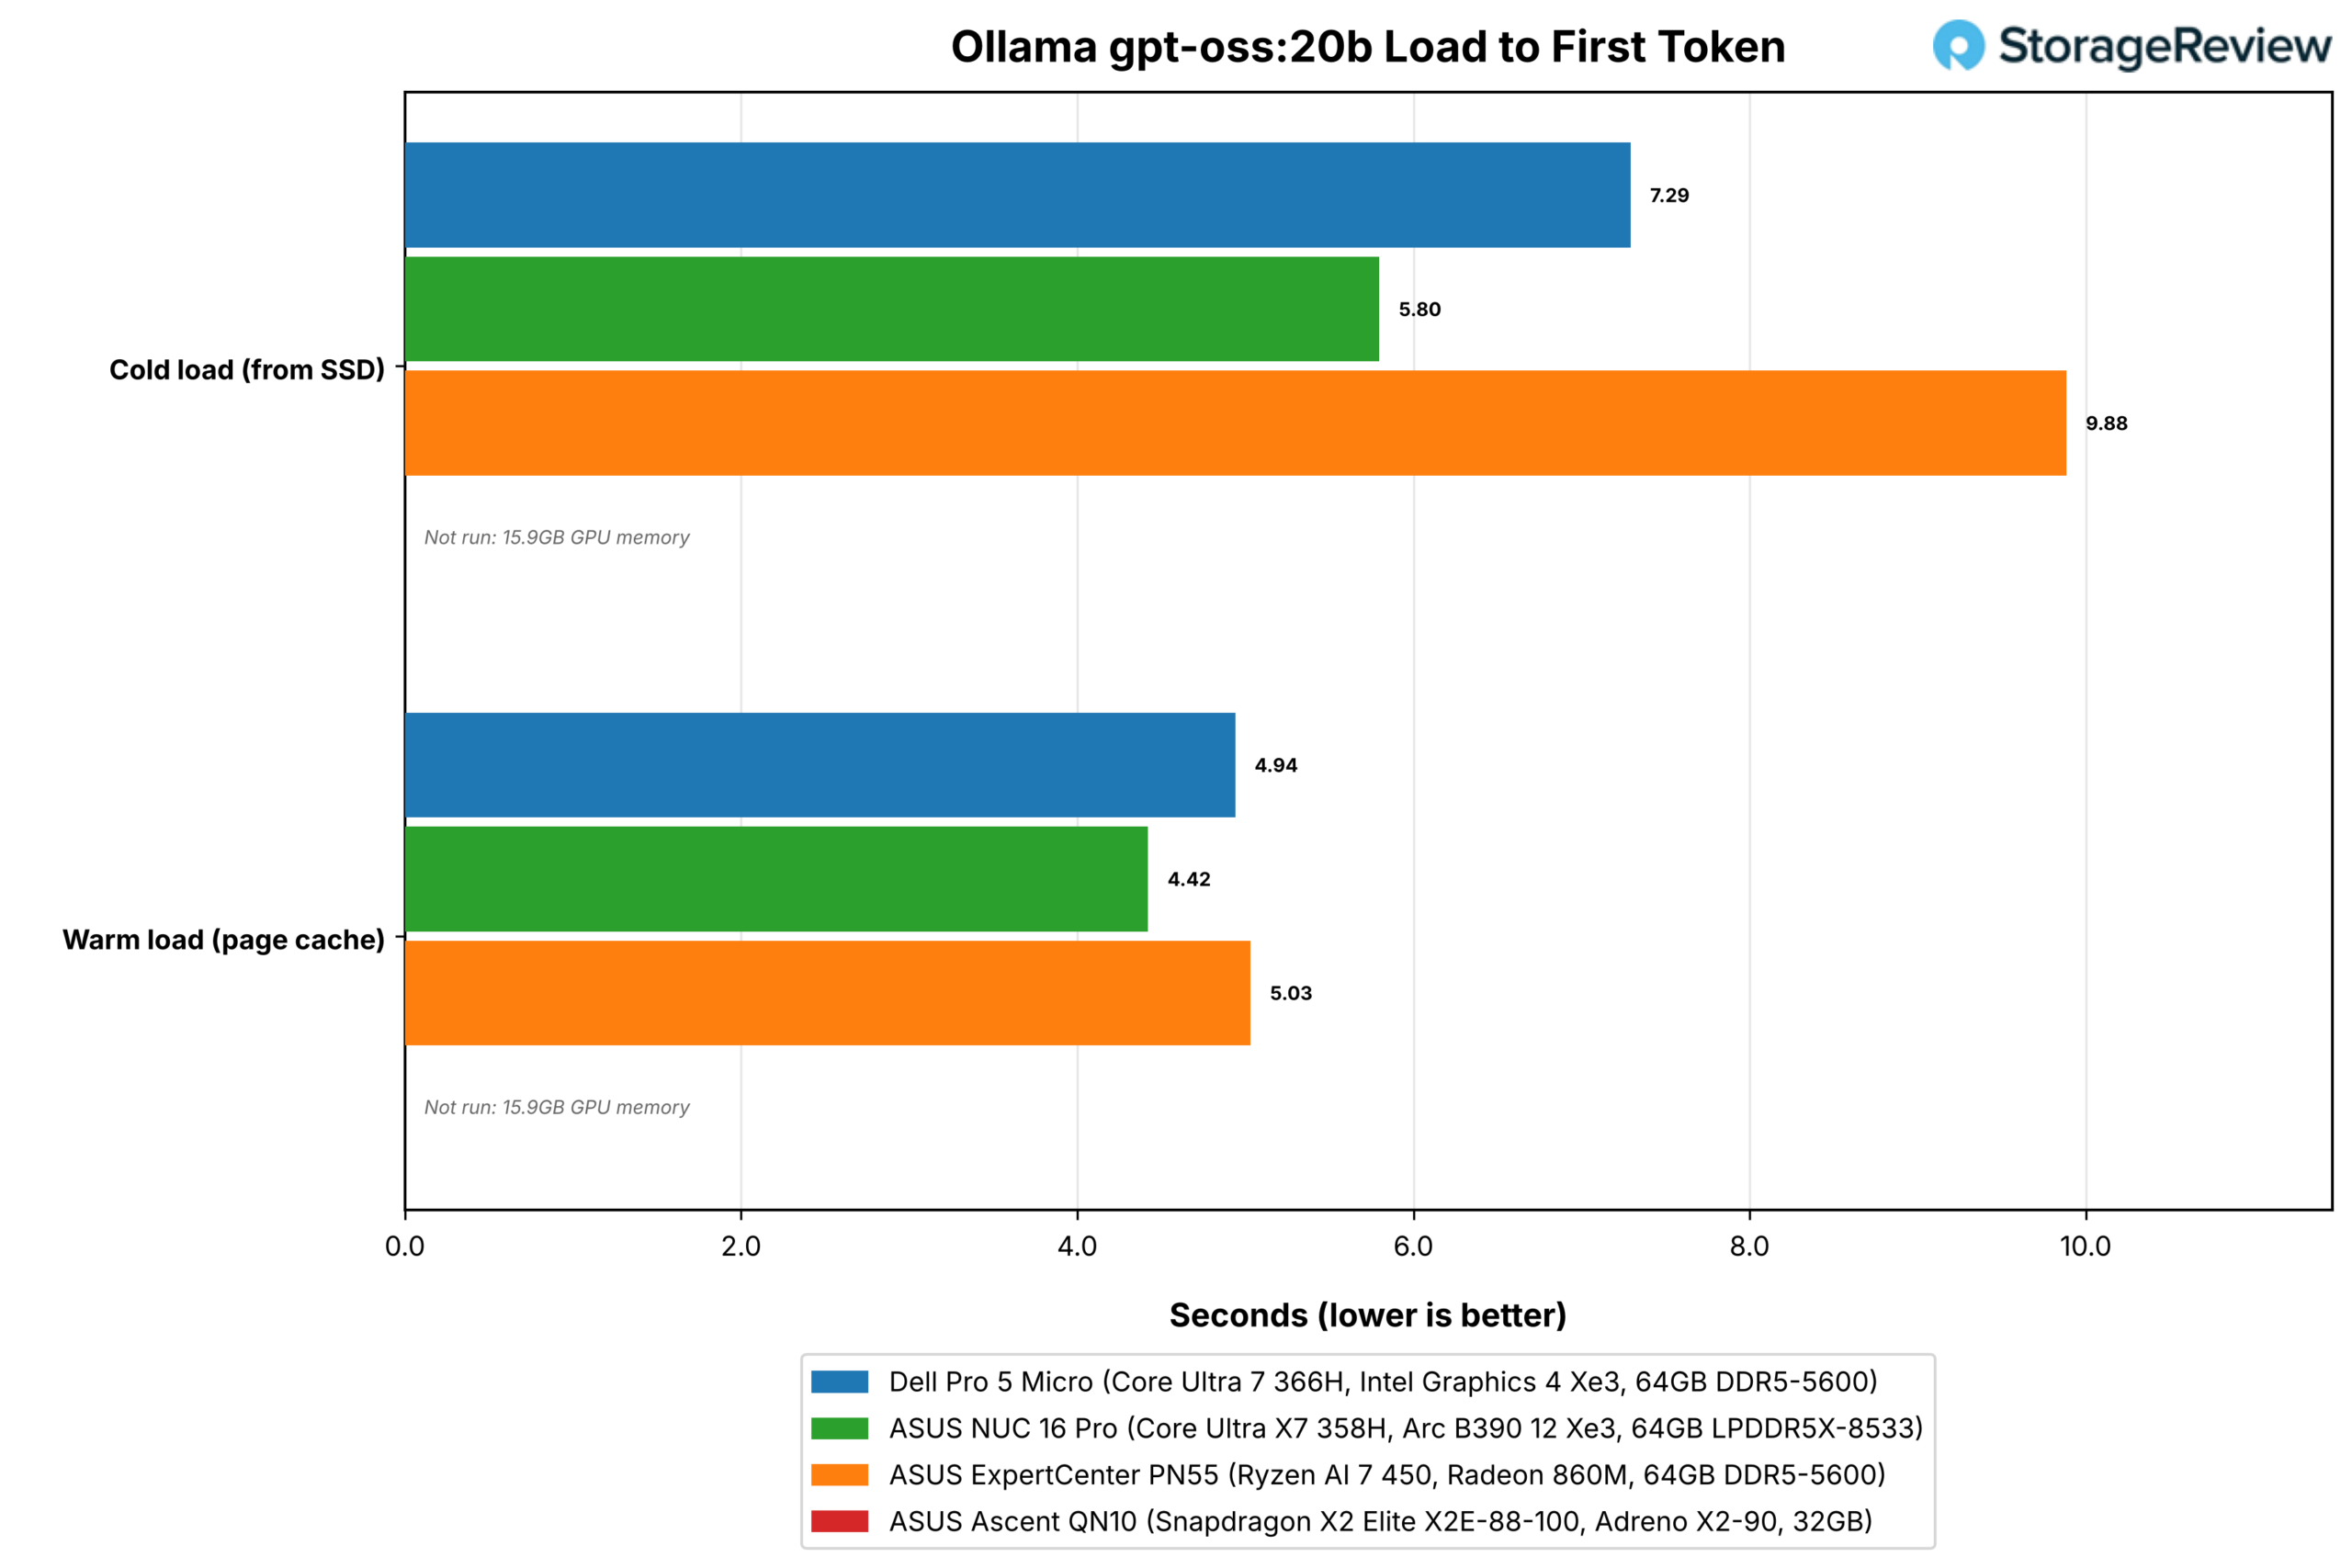
Loading gpt-oss:20b into Ollama from a cold cache takes 7.29 seconds on the Pro 5 Micro, 5.80 on the NUC, and 9.88 on the PN55, with the drive reading at 2,991MB/s during the Dell load against 3,710MB/s on the NUC’s Gen5 link. Warm loads from the page cache converge at 4.94, 4.42, and 5.03 seconds, and swapping between two resident models takes 15.5 seconds on the Dell.
The Codex CLI coding agent running gpt-oss:20b at a 64K context generates 13.6 tokens per second on the Pro 5 Micro, 20.1 on the NUC, and 16.6 on the PN55. The Dell made 27 tool calls in its run against 21 on the NUC, so the agent works on the small GPU at two-thirds of the NUC’s pace. The agent-beside-user test, which runs the agent while a browser session measures responsiveness, kept Speedometer at 30.2 on the Dell against 29.8 on the NUC, so the foreground stays usable while the agent runs.
RAG et LLM au service
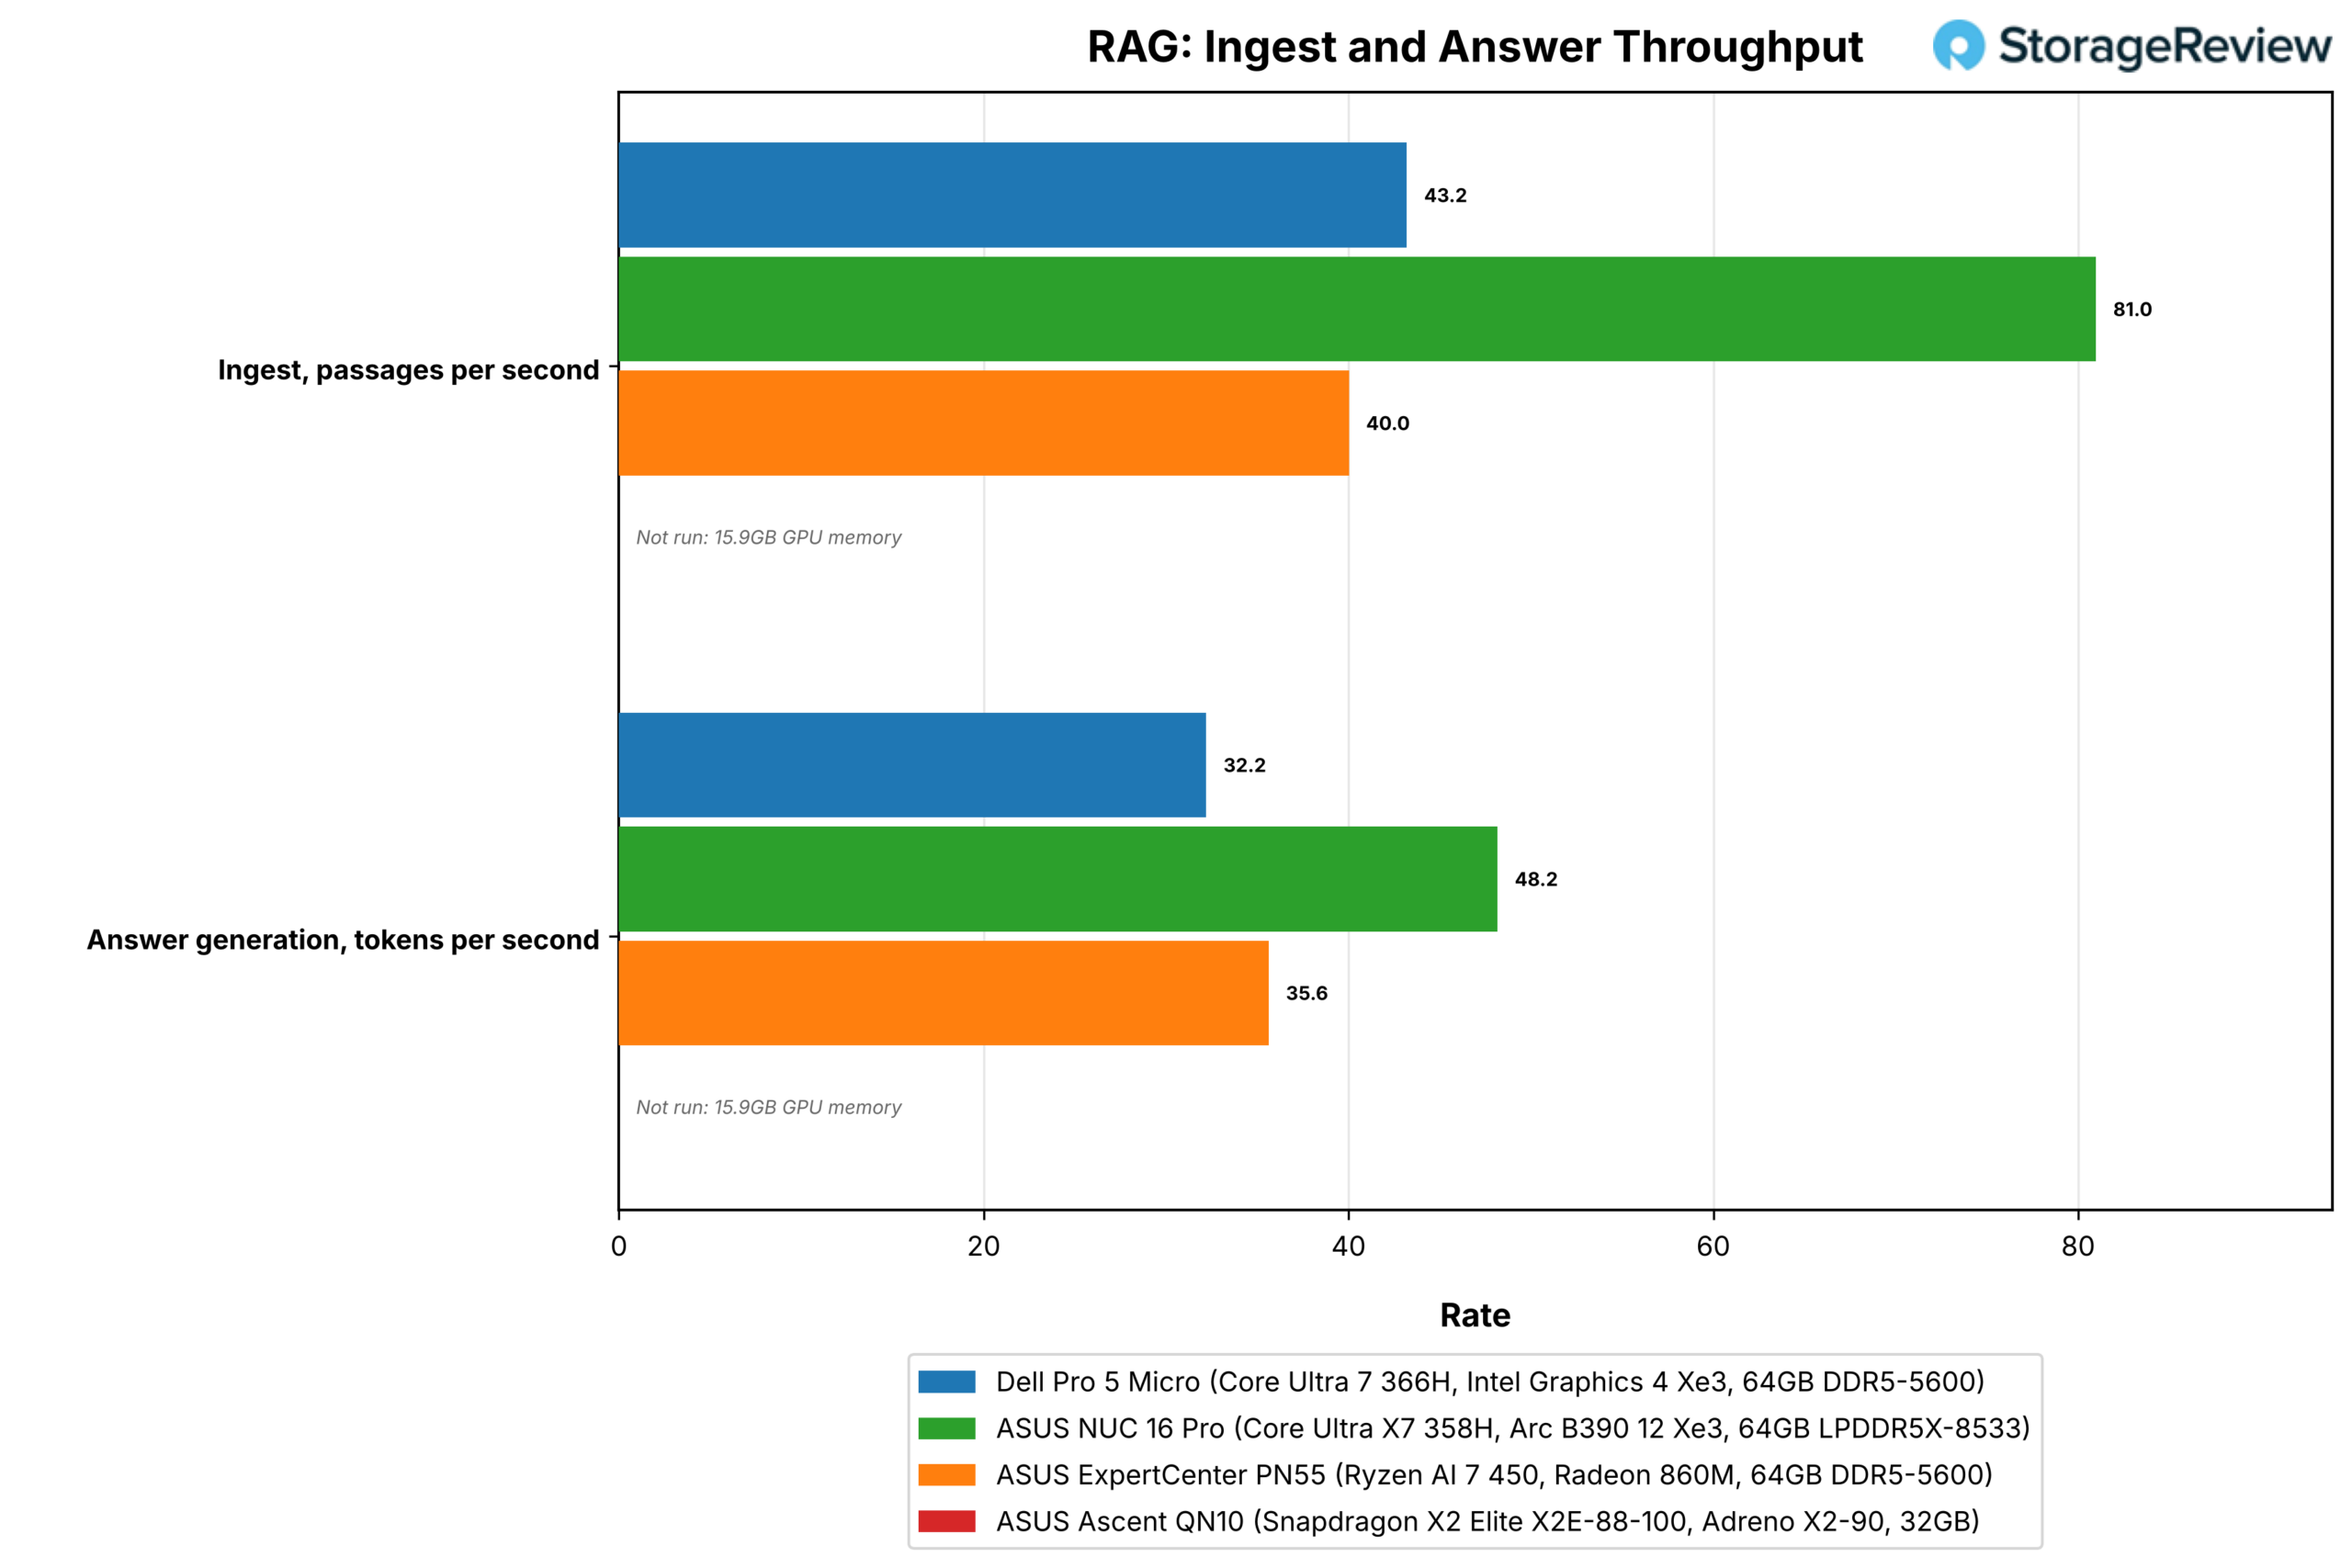
The RAG test embeds a document set and answers questions against it. The Pro 5 Micro ingests 43.2 passages per second and generates answers at 32.2 tokens per second, against 81.0 and 48.2 on the NUC and 40.0 and 35.6 on the PN55. Median time from question to answer is 1.71 seconds on the Dell, 1.00 on the NUC, and 3.65 on the PN55, and all three return the same 82.7 percent recall at five because the retrieval math does not change with the hardware.
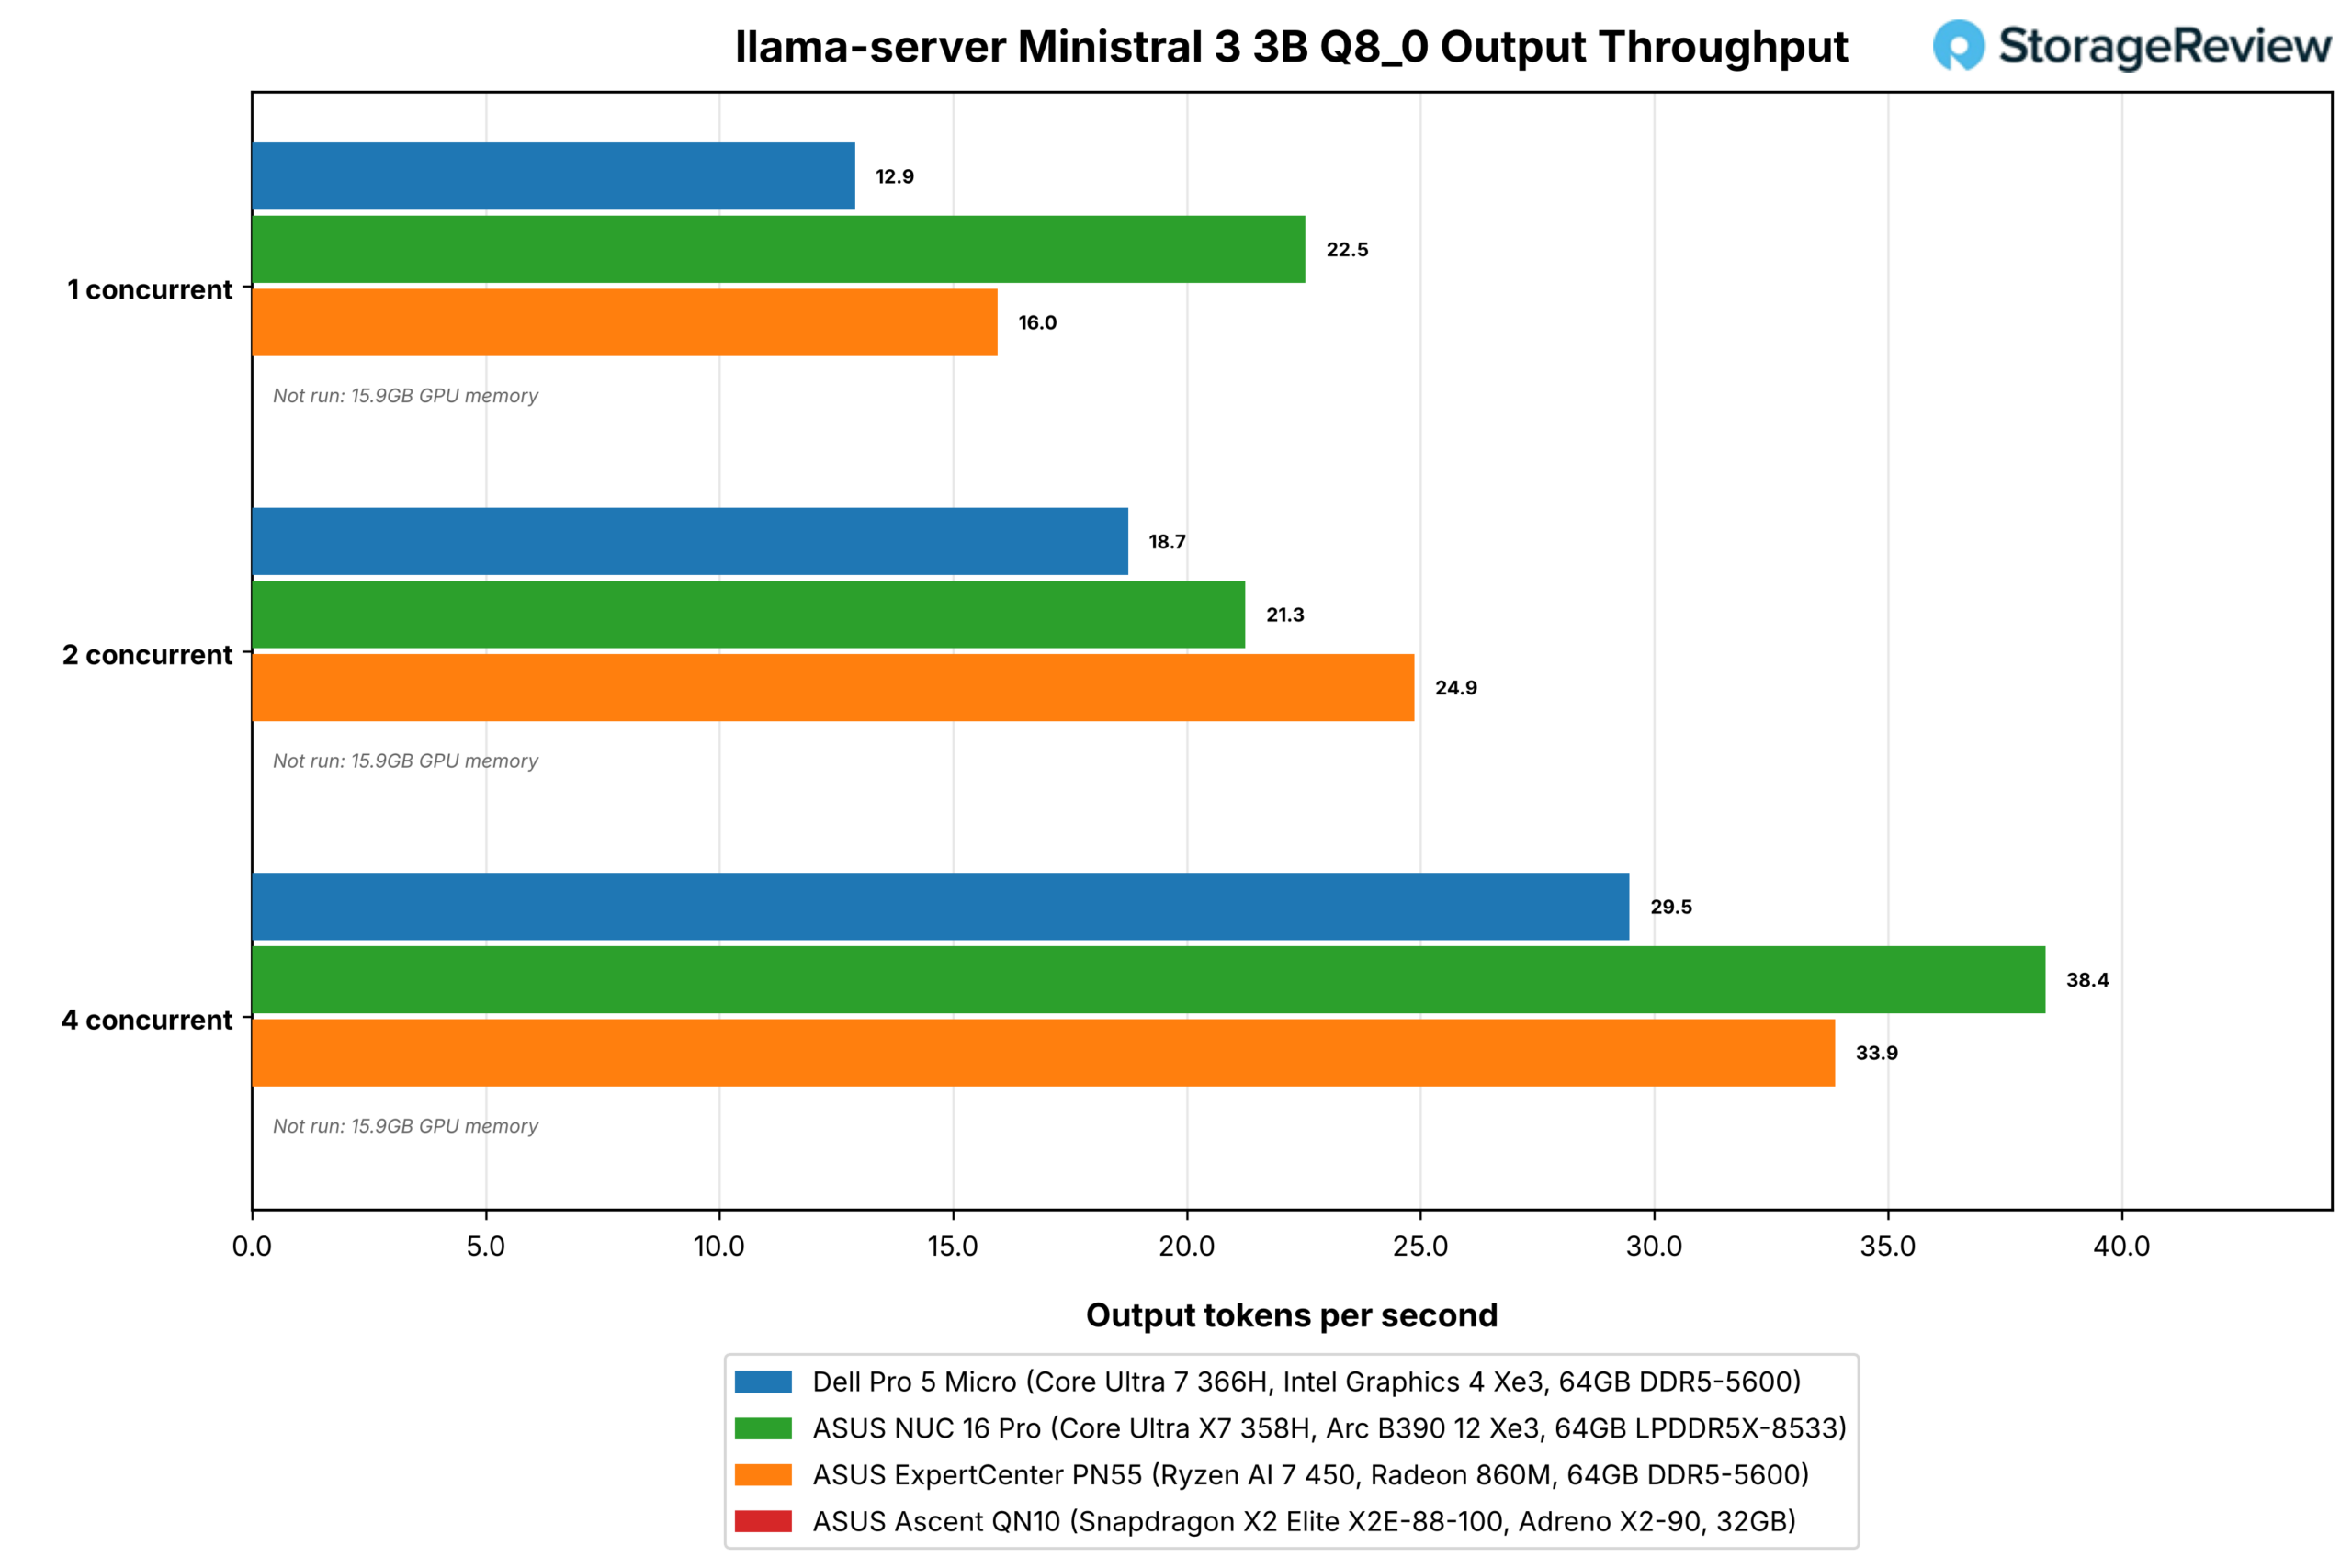
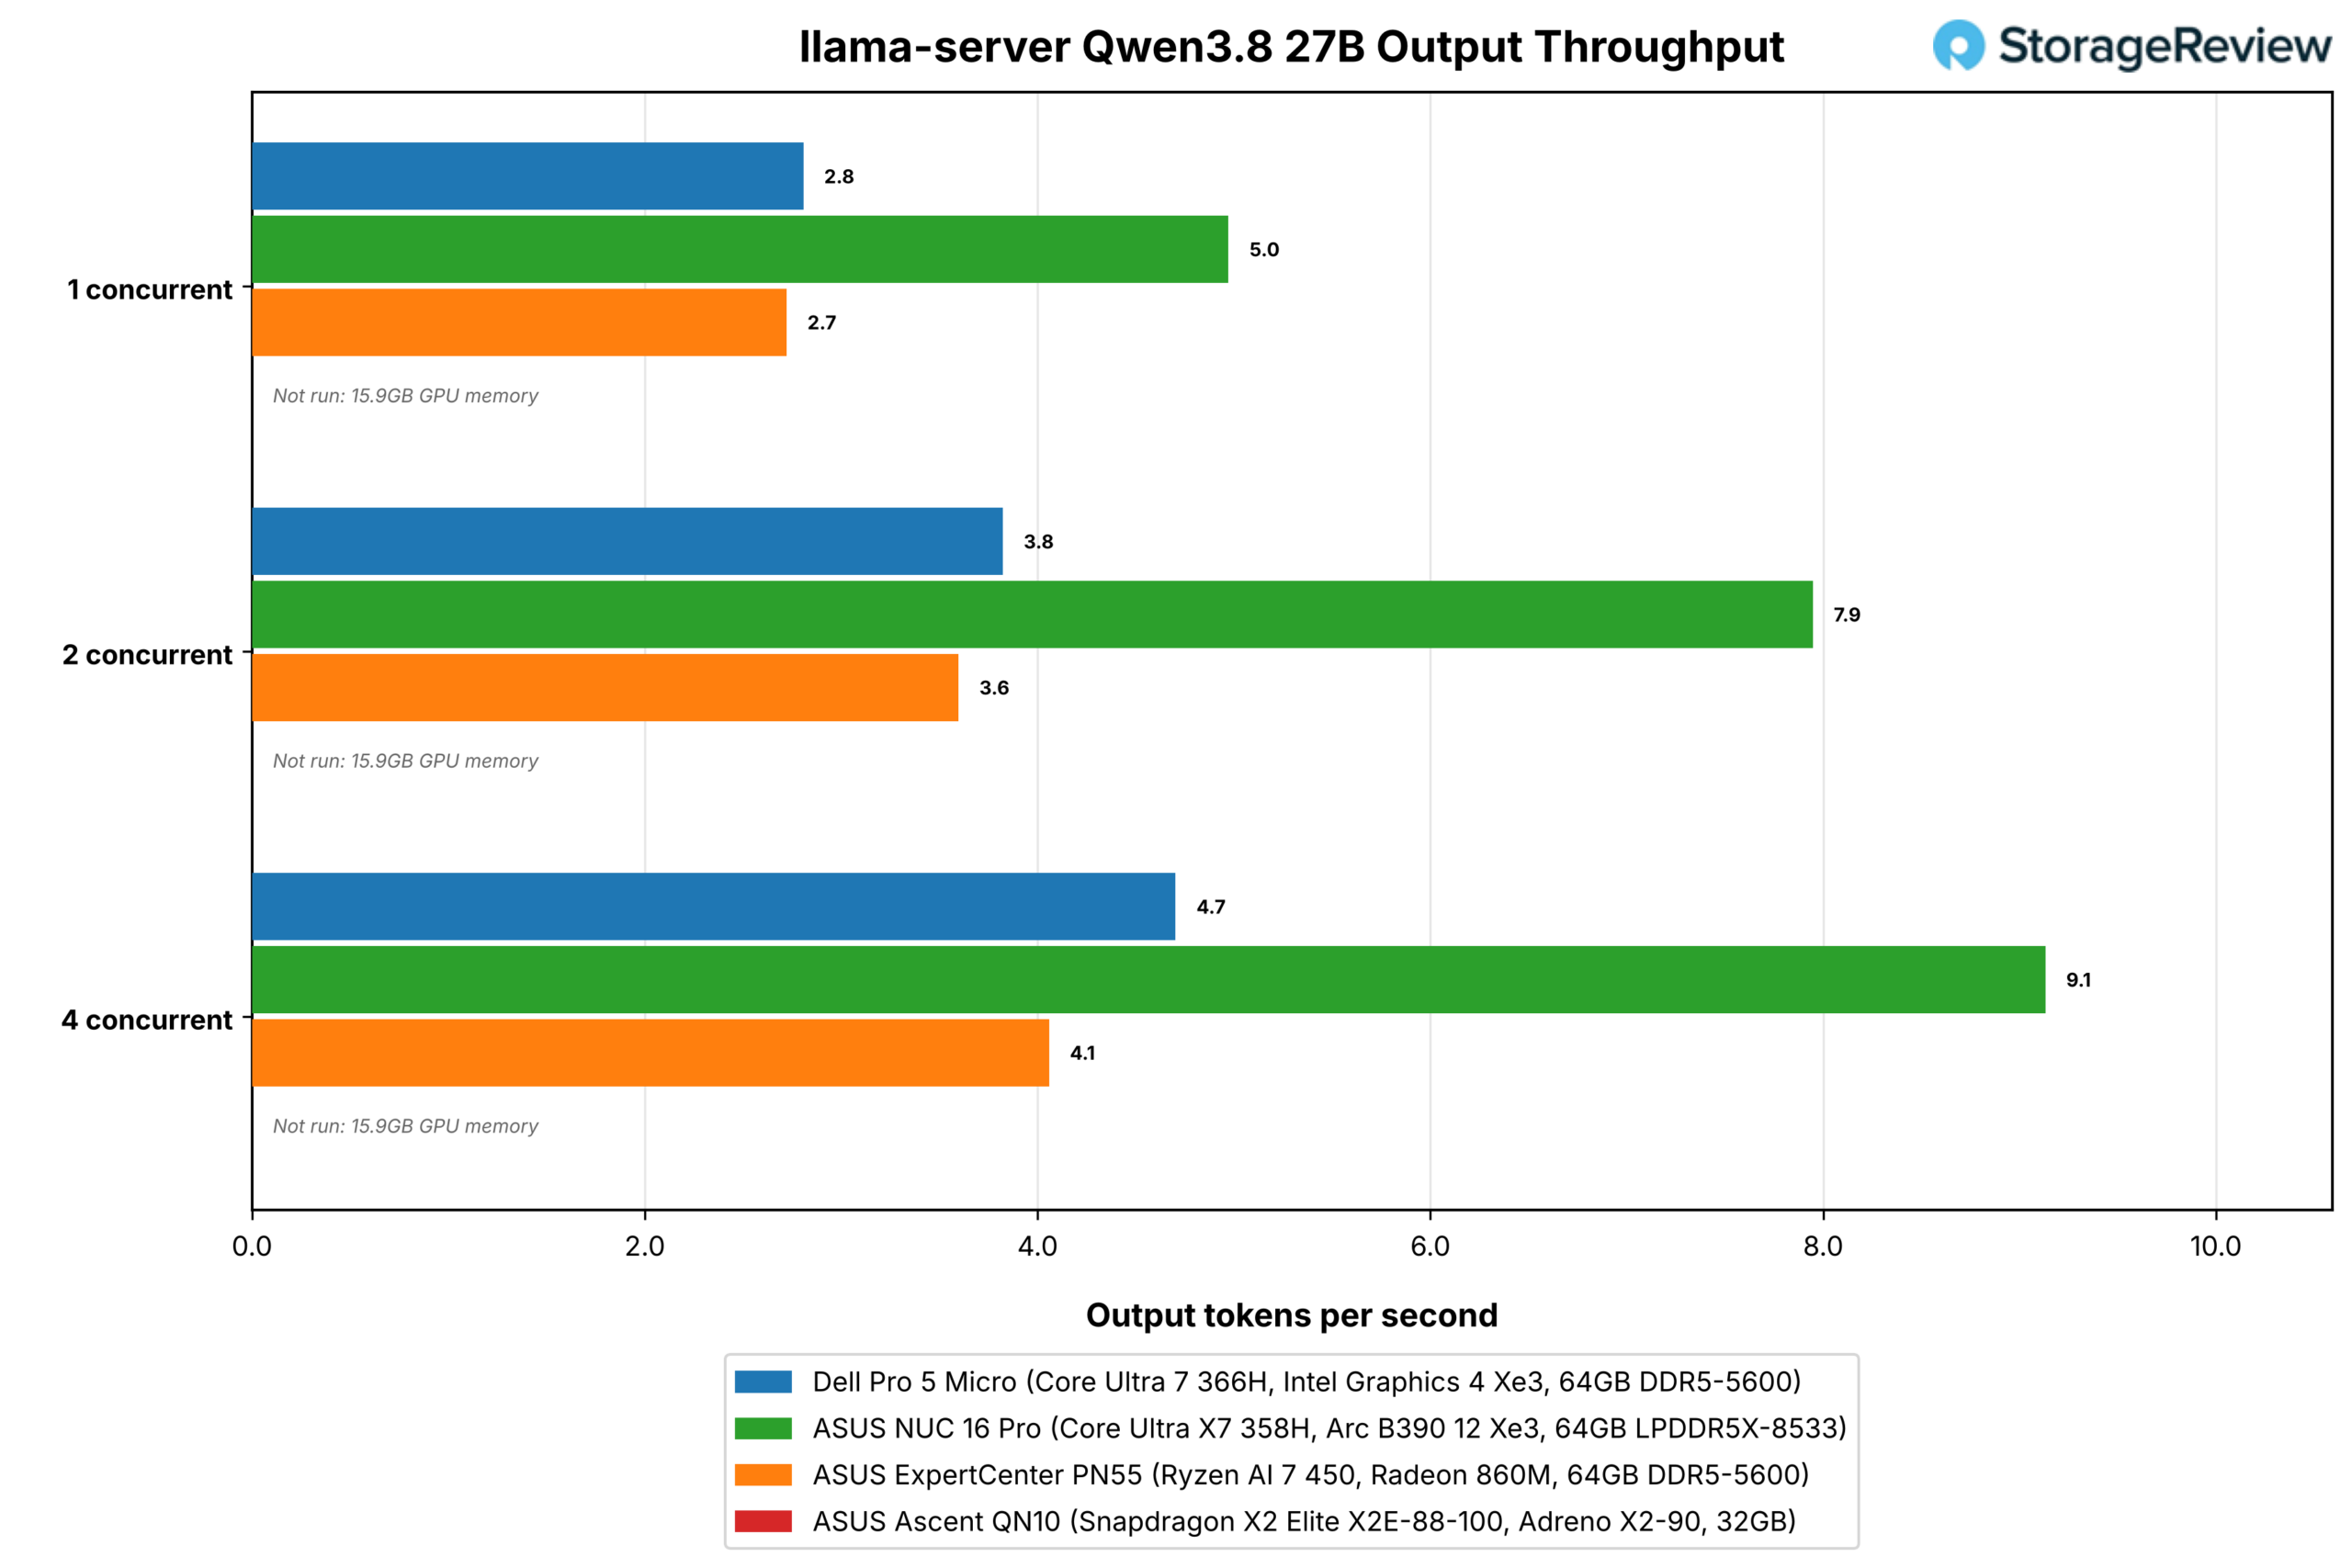
Serving through llama-server, the Pro 5 Micro pushes Ministral 3 3B to 12.9 output tokens per second for one request and 29.5 aggregate at four concurrent requests, against 22.5 and 38.4 on the NUC and 16.0 and 33.9 on the PN55. Qwen3.8 27B, the largest model that fits, runs at 2.8 tokens per second for one request and 4.7 aggregate at four on the Dell, with first tokens arriving after 103 seconds on the 8K prompt; the NUC reaches 9.1 at four and ran eight concurrent requests at 12.6, a point the Dell did not complete.
Génération d'image
Image generation runs through stable-diffusion.cpp on Vulkan, and here the chart needs reading with care. The Pro 5 Micro produces 0.84 FLUX.2 klein 4B images per minute at 1024 x 1024 and 0.36 Z-Image Turbo 6B images per minute, close to the PN55’s 1.04 and 0.37 and about four times the NUC 16 Pro’s 0.19 and 0.10.
The 4 Xe3 core GPU is not faster than the B390 at image generation. The stage timings show the B390 taking 309 seconds per FLUX image, 126 of them in VAE decode, against 72 seconds on the Dell. We recorded the same pattern on the Dell Pro Precision 5 16S with the same GPU, so the Vulkan path in this build of stable-diffusion.cpp is the limit on the B390, and the number will move when the backend does.
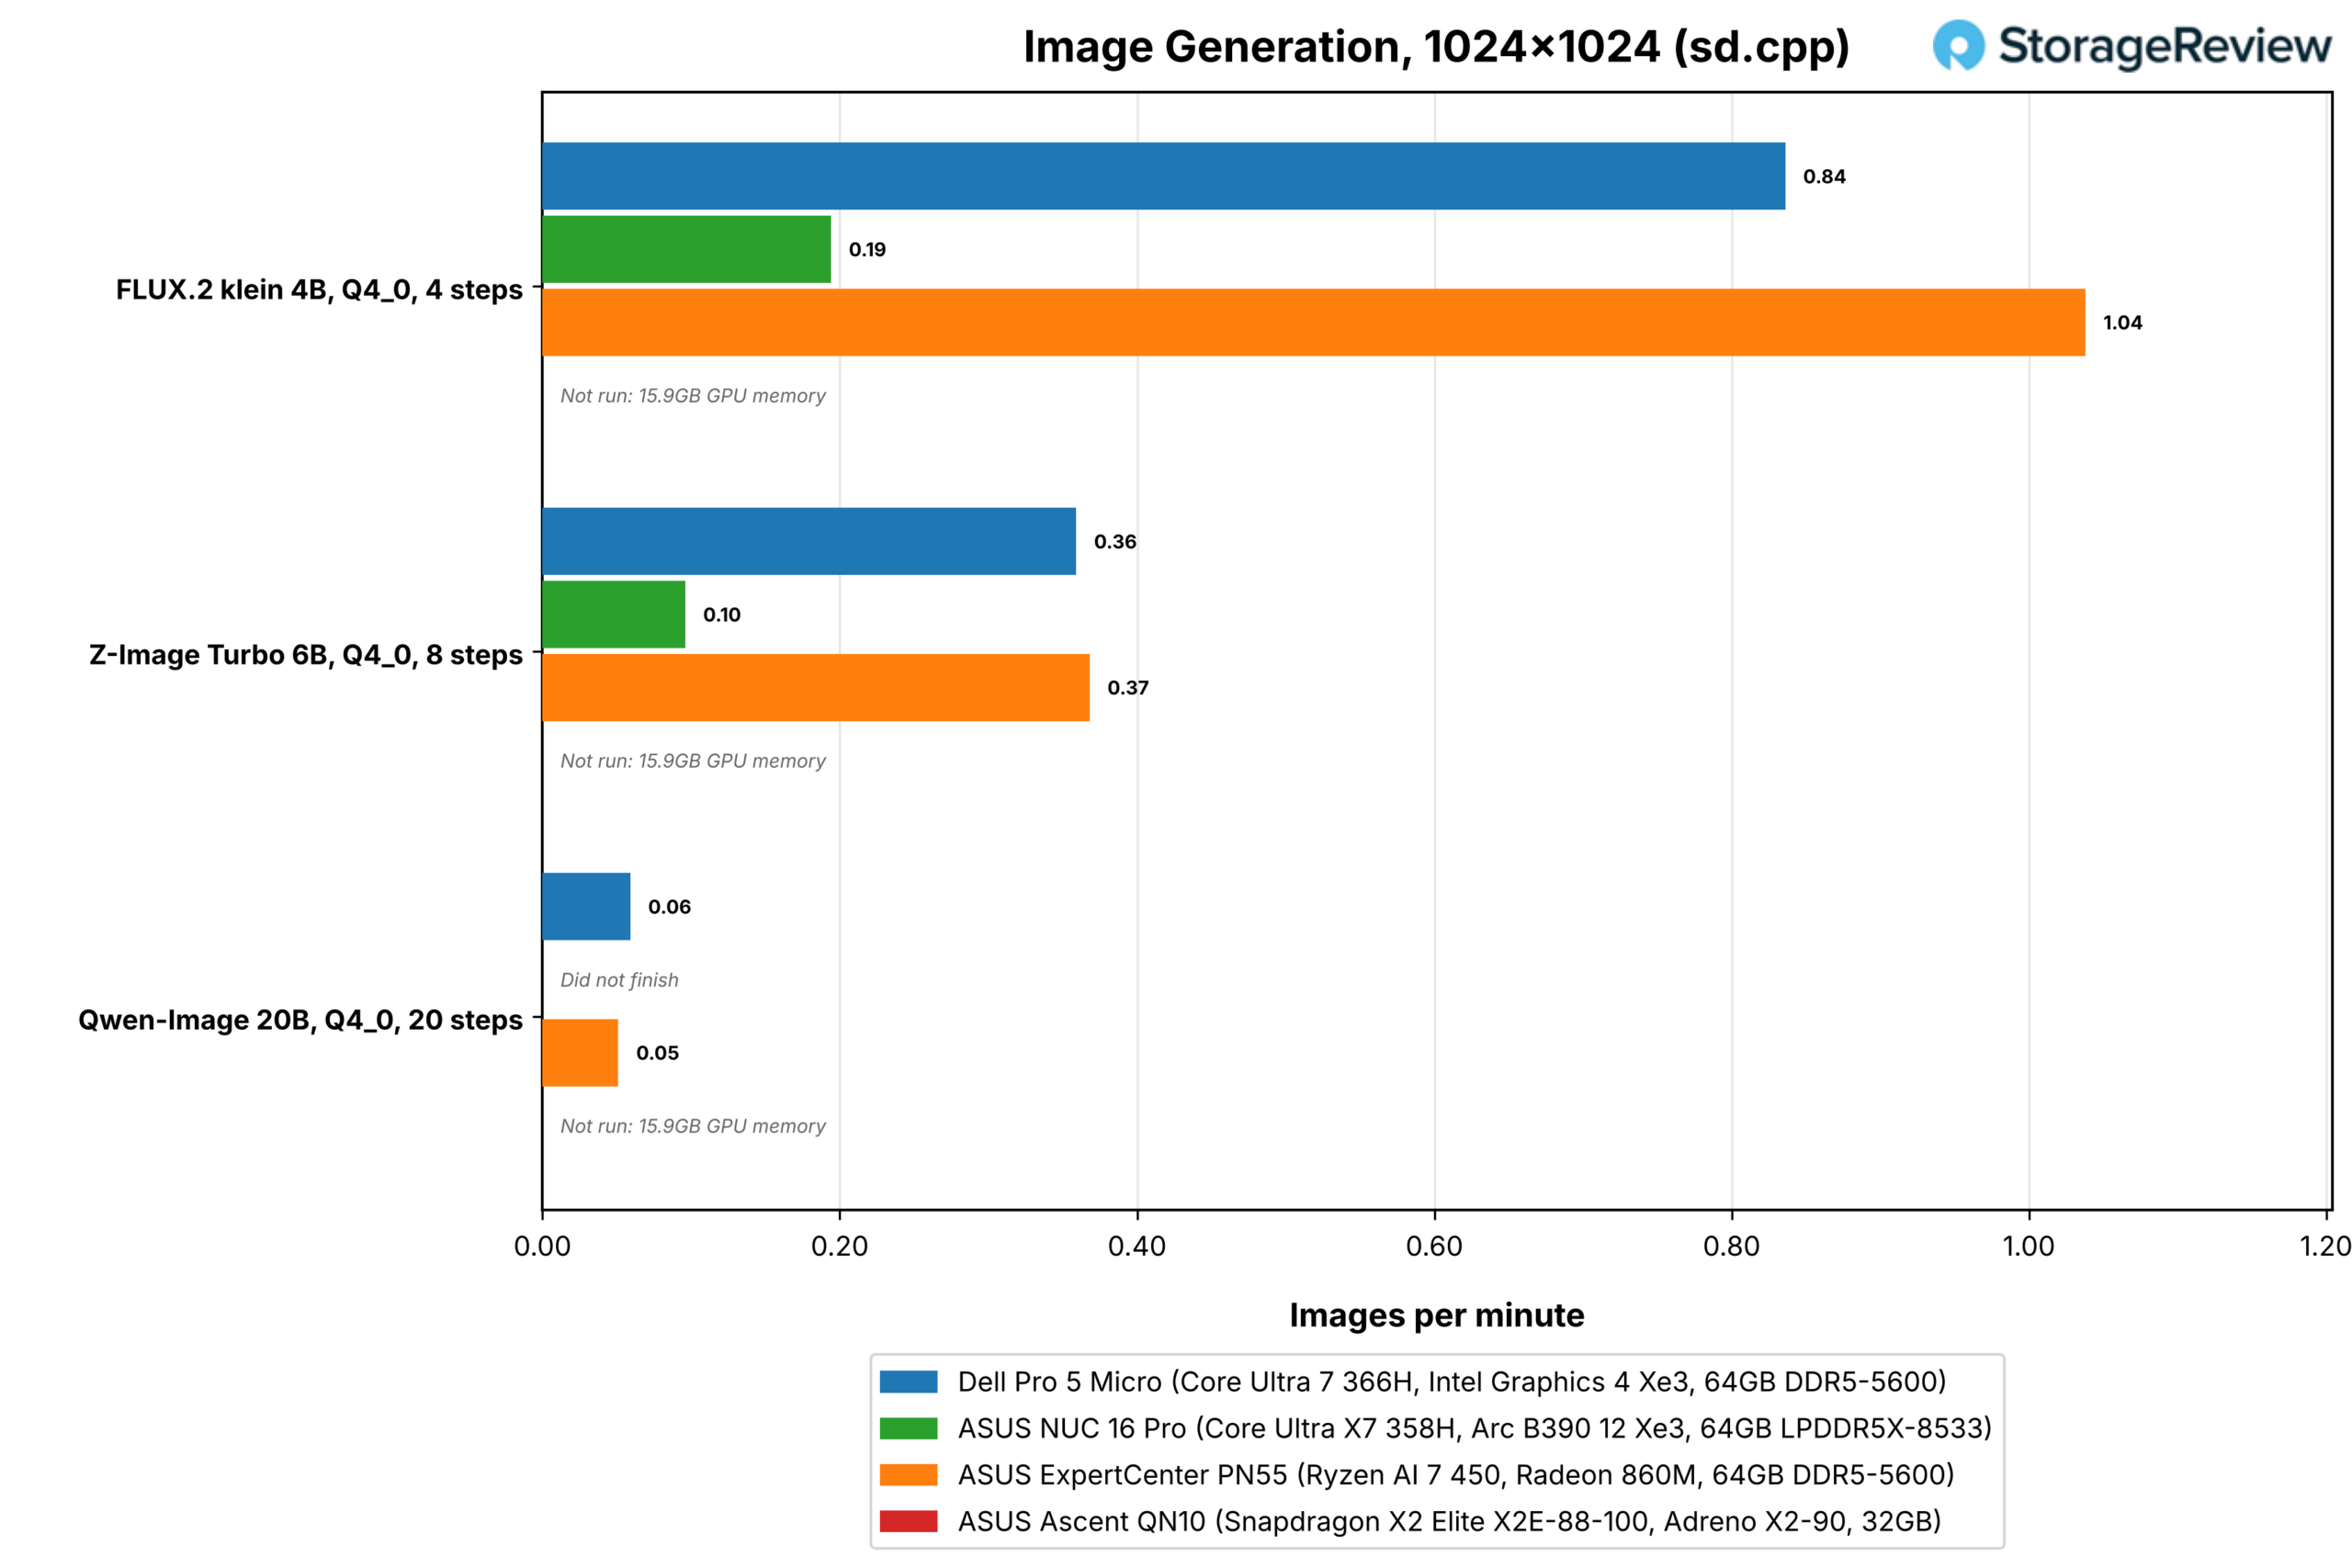
Qwen-Image 20B at Q4_0 runs on the Pro 5 Micro at 0.06 images per minute, about 17 minutes per image, which proves the model fits and little more. The useful finding for buyers is the memory line: with 47.6GB available to the GPU, the Dell loads the 18GB Q4_0 weights and completes the run, where a 32GB system would not.
Performance du processeur
Cinebench 2026 puts the Pro 5 Micro at 495.1 single-core and 3,601 multi-core. The NUC 16 Pro’s identical core complex scores 512.2 and 4,980, so the single-core gap is 3 percent, and the multi-core gap is 28 percent. The PN55’s eight Zen 5 cores with SMT score 490.0 and 3,949, and the 18-core QN10 leads the group at 639.7 and 6,437. The suite logs a 3,324MHz mean clock on the Dell during Cinebench against 3,773MHz on the NUC, which is the whole multi-core difference.
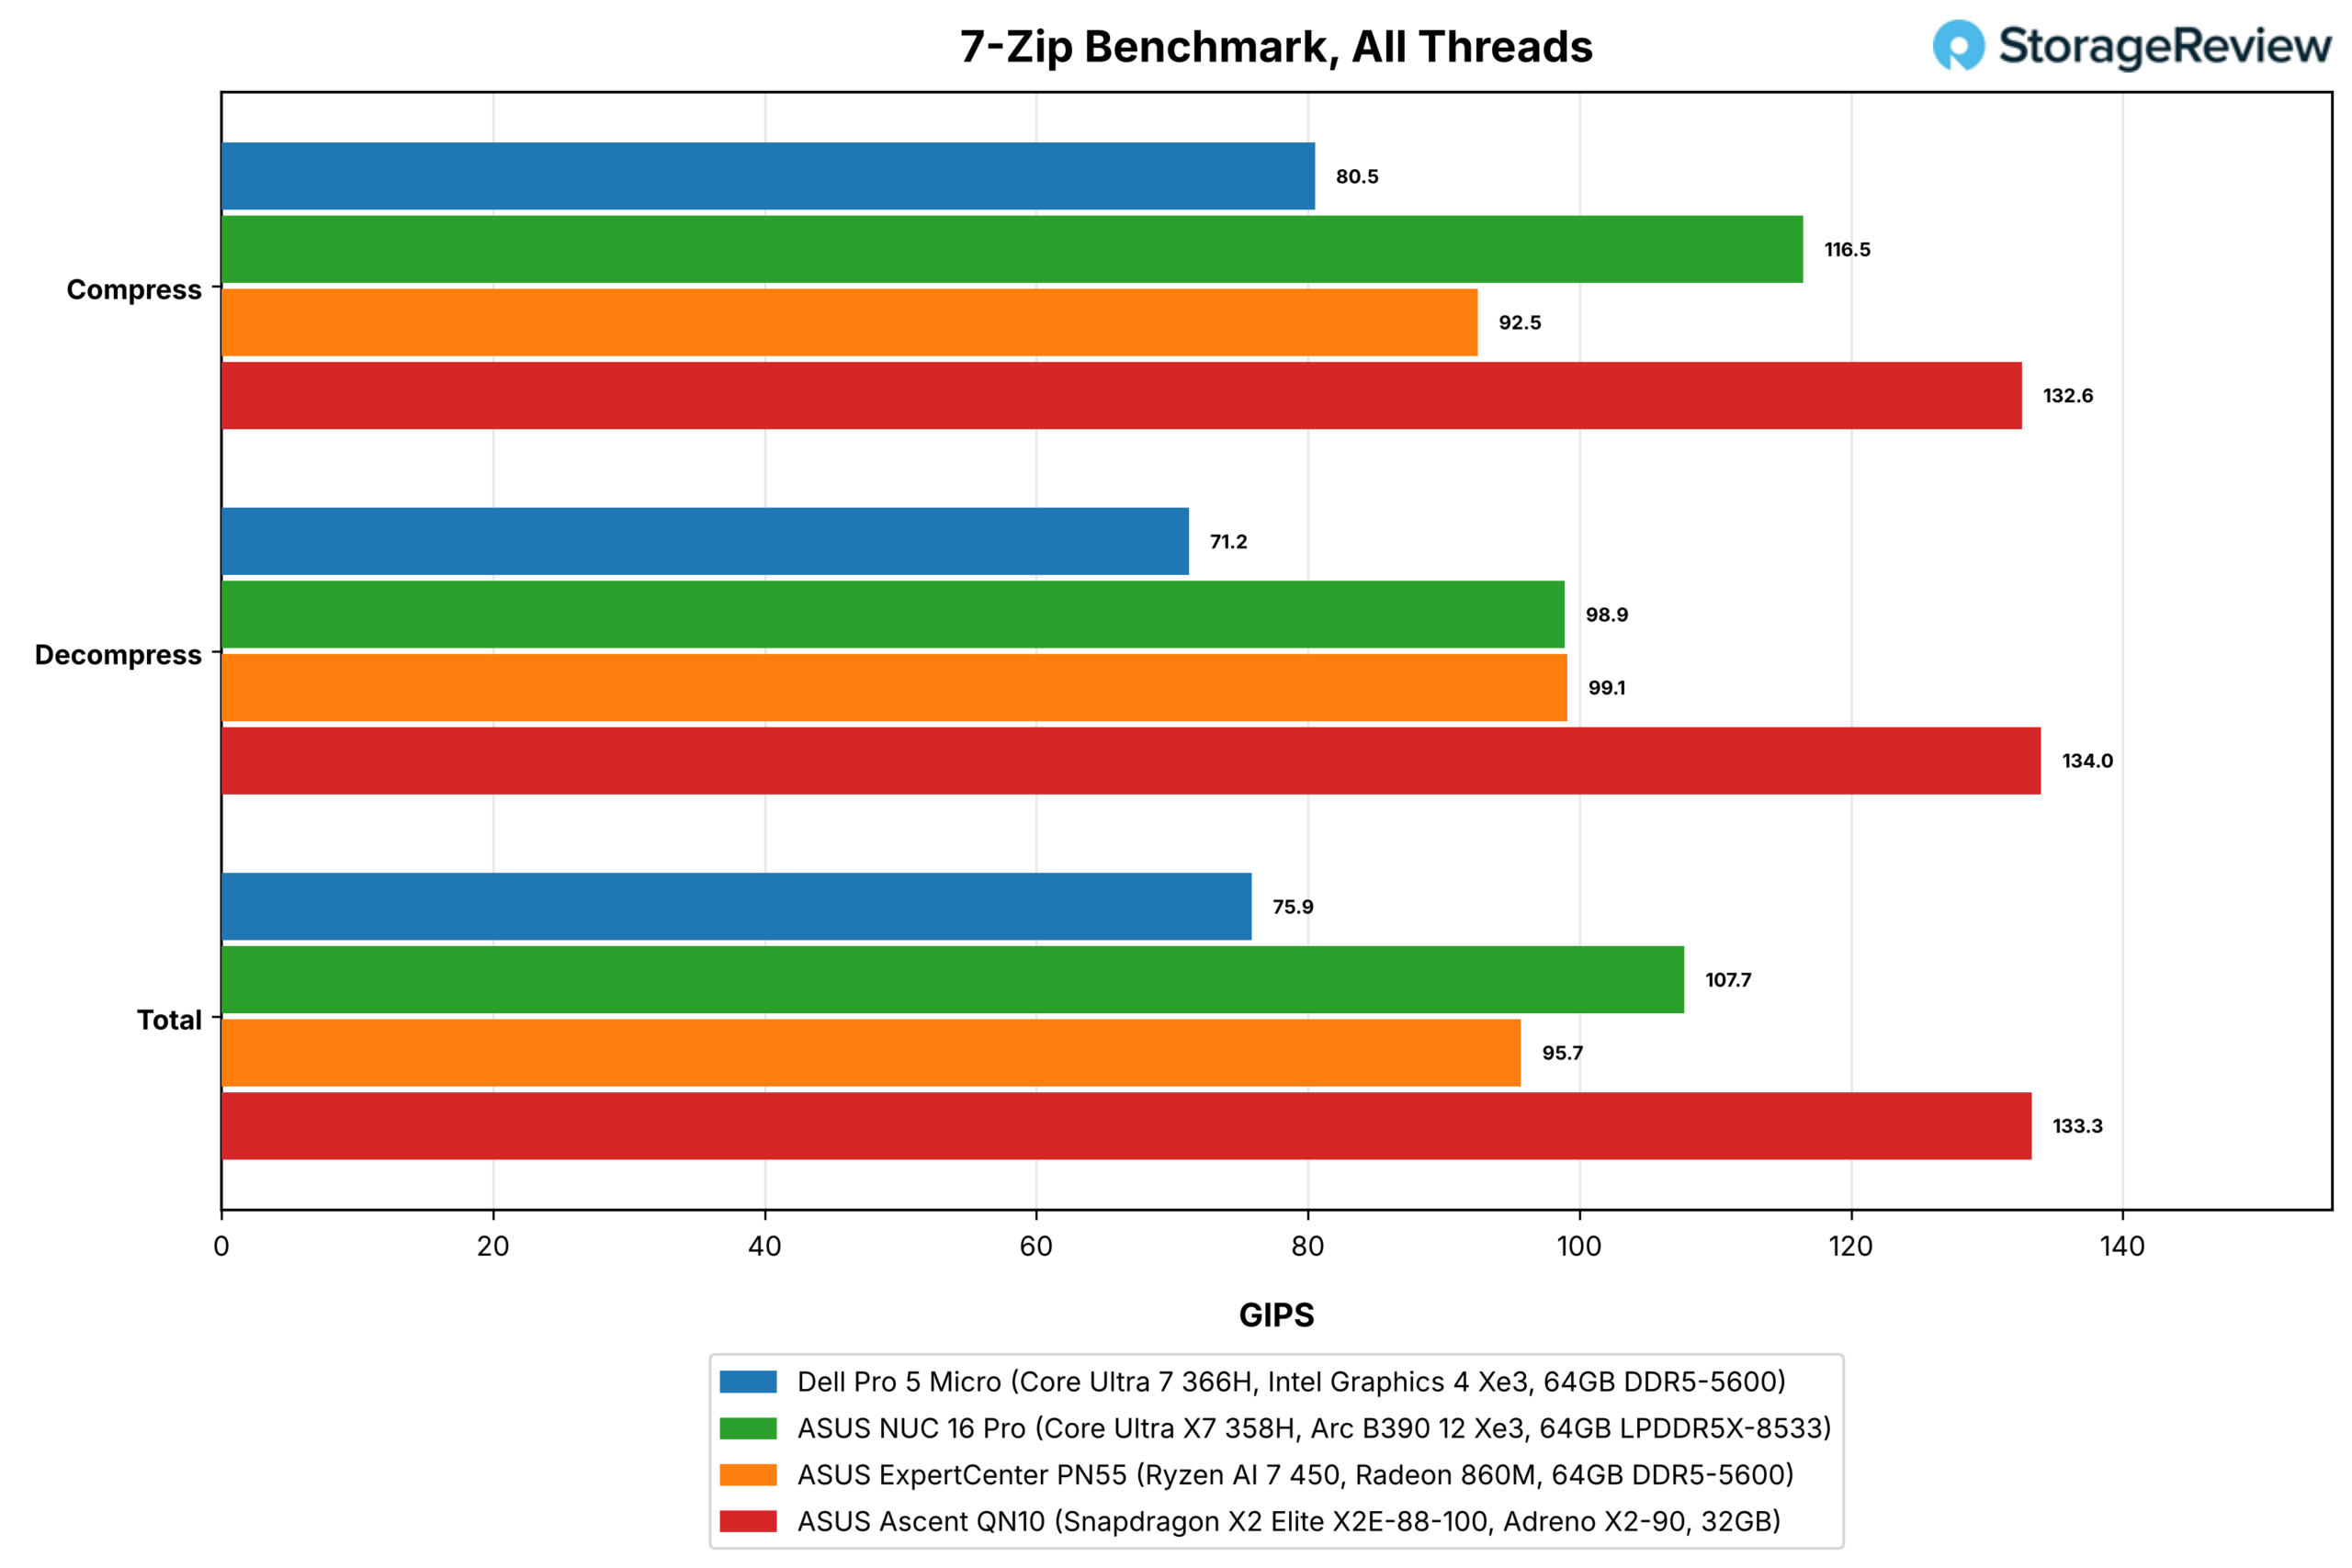
7-Zip measures integer throughput, and the Pro 5 Micro posts 80.5 GIPS compressing and 71.2 decompressing for a 75.9 total, against 107.7 on the NUC, 95.7 on the PN55, and 133.3 on the QN10. On a single thread, the four systems bunch between 8.3 and 10.4 GIPS, with the Dell at the low end by a small margin, which again points at the all-core power budget and not at the cores themselves.
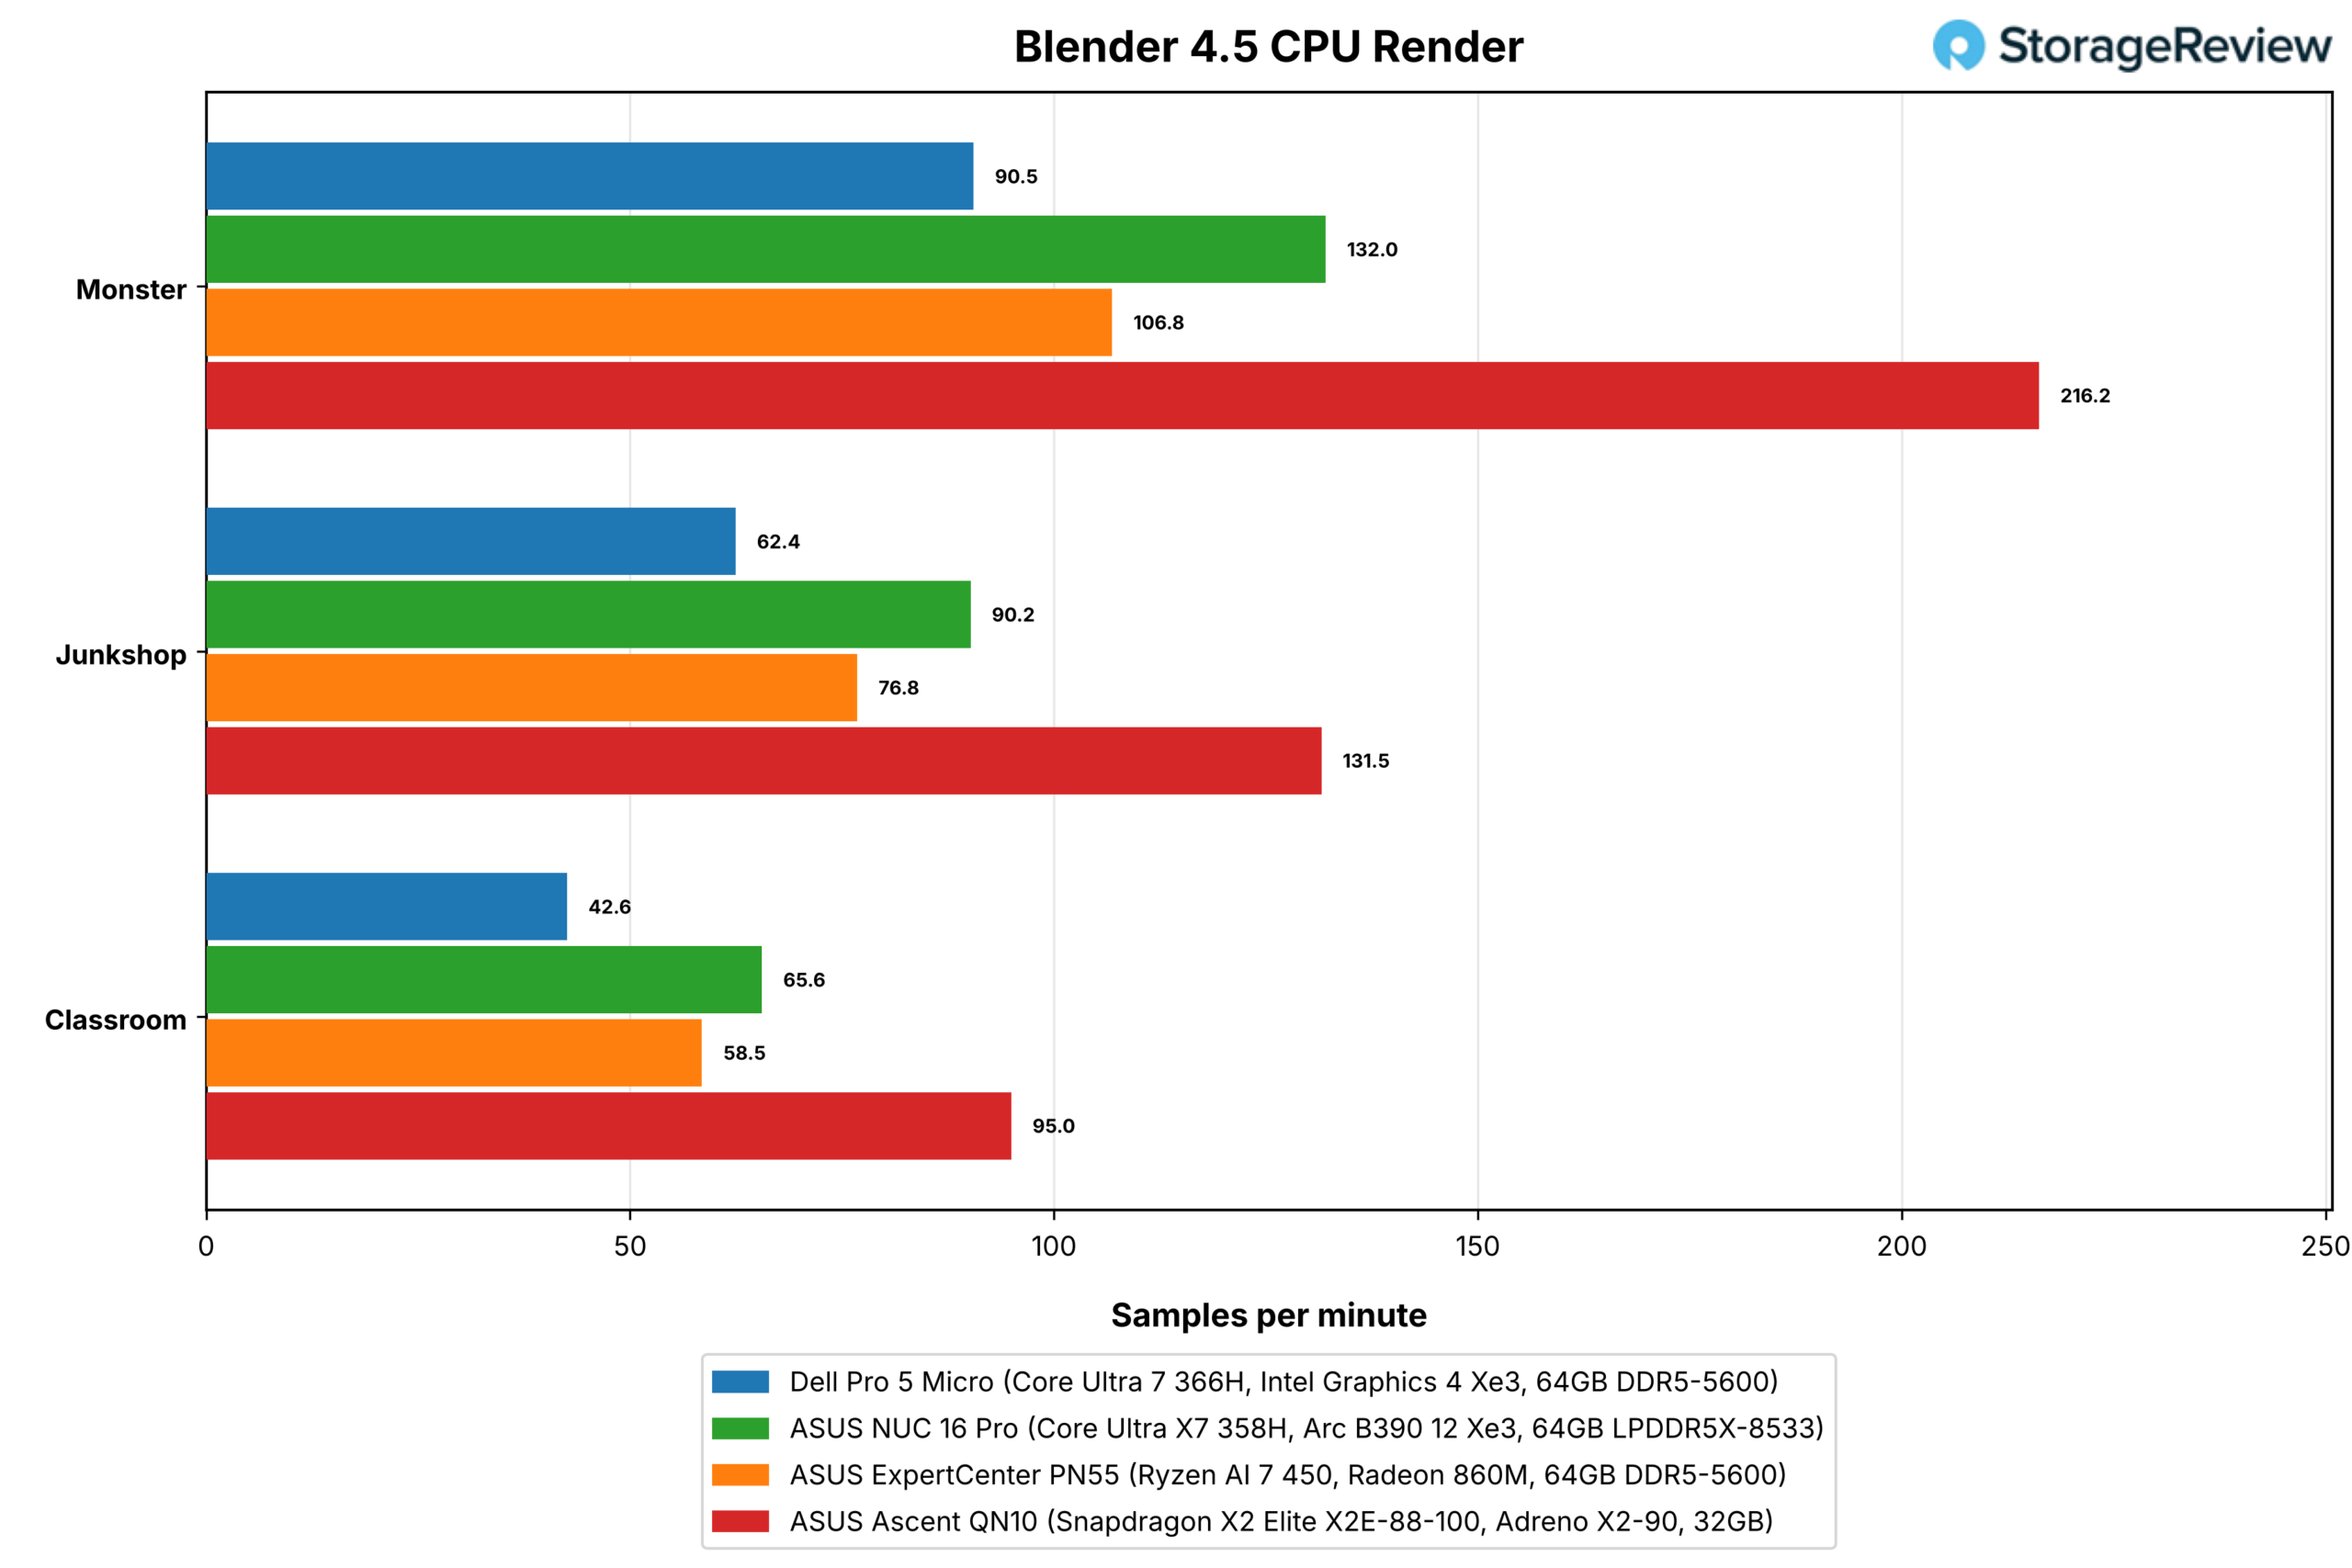
Blender 4.5 on the CPU renders Monster at 90.5 samples per minute, Junkshop at 62.4, and Classroom at 42.6 on the Pro 5 Micro. The NUC lands at 132.0, 90.2, and 65.6, the PN55 at 106.8, 76.8, and 58.5, and the QN10 at 216.2, 131.5, and 95.0. The Dell’s mean clock through Blender was 2,806MHz.
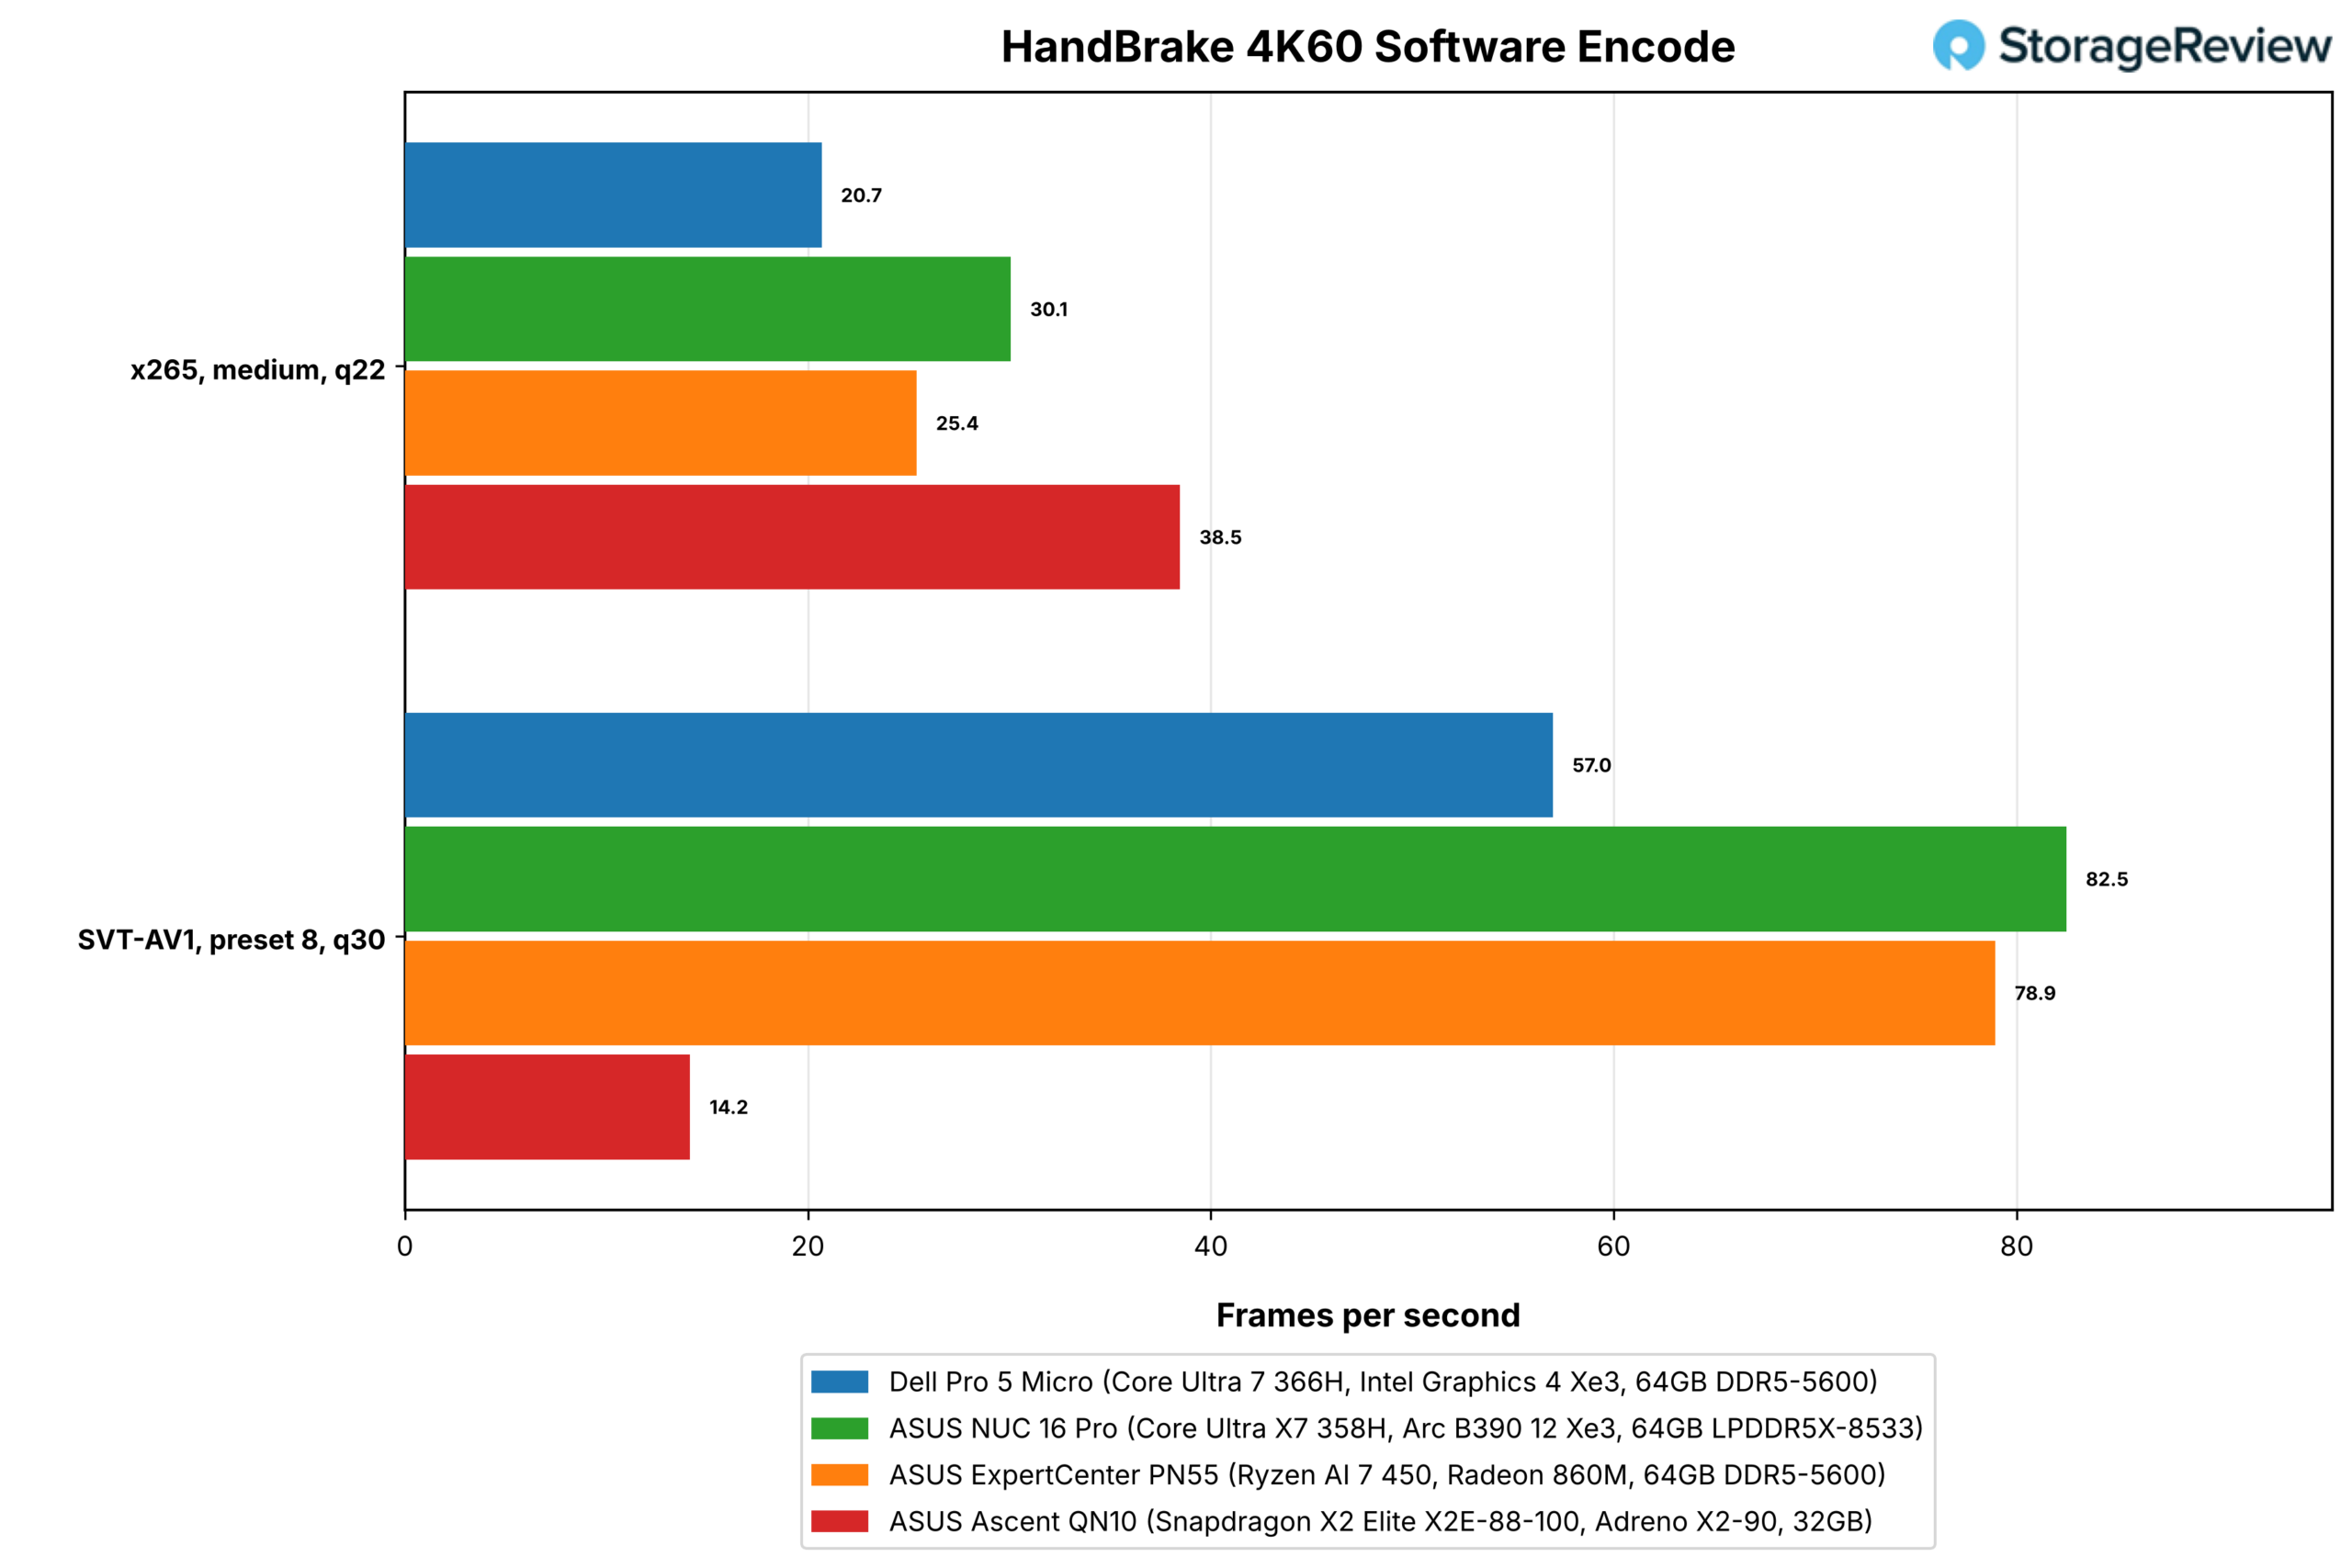
HandBrake’s software encoders run the same pattern: 20.7 fps on the x265 4K60 encode and 57.0 fps on SVT-AV1 for the Pro 5 Micro, against 30.1 and 82.5 on the NUC and 25.4 and 78.9 on the PN55. The QN10’s 38.5 fps on x265 leads, while its 14.2 fps on SVT-AV1 reflects the Arm build of that encoder. The hardware encoders are covered in the GPU section below.
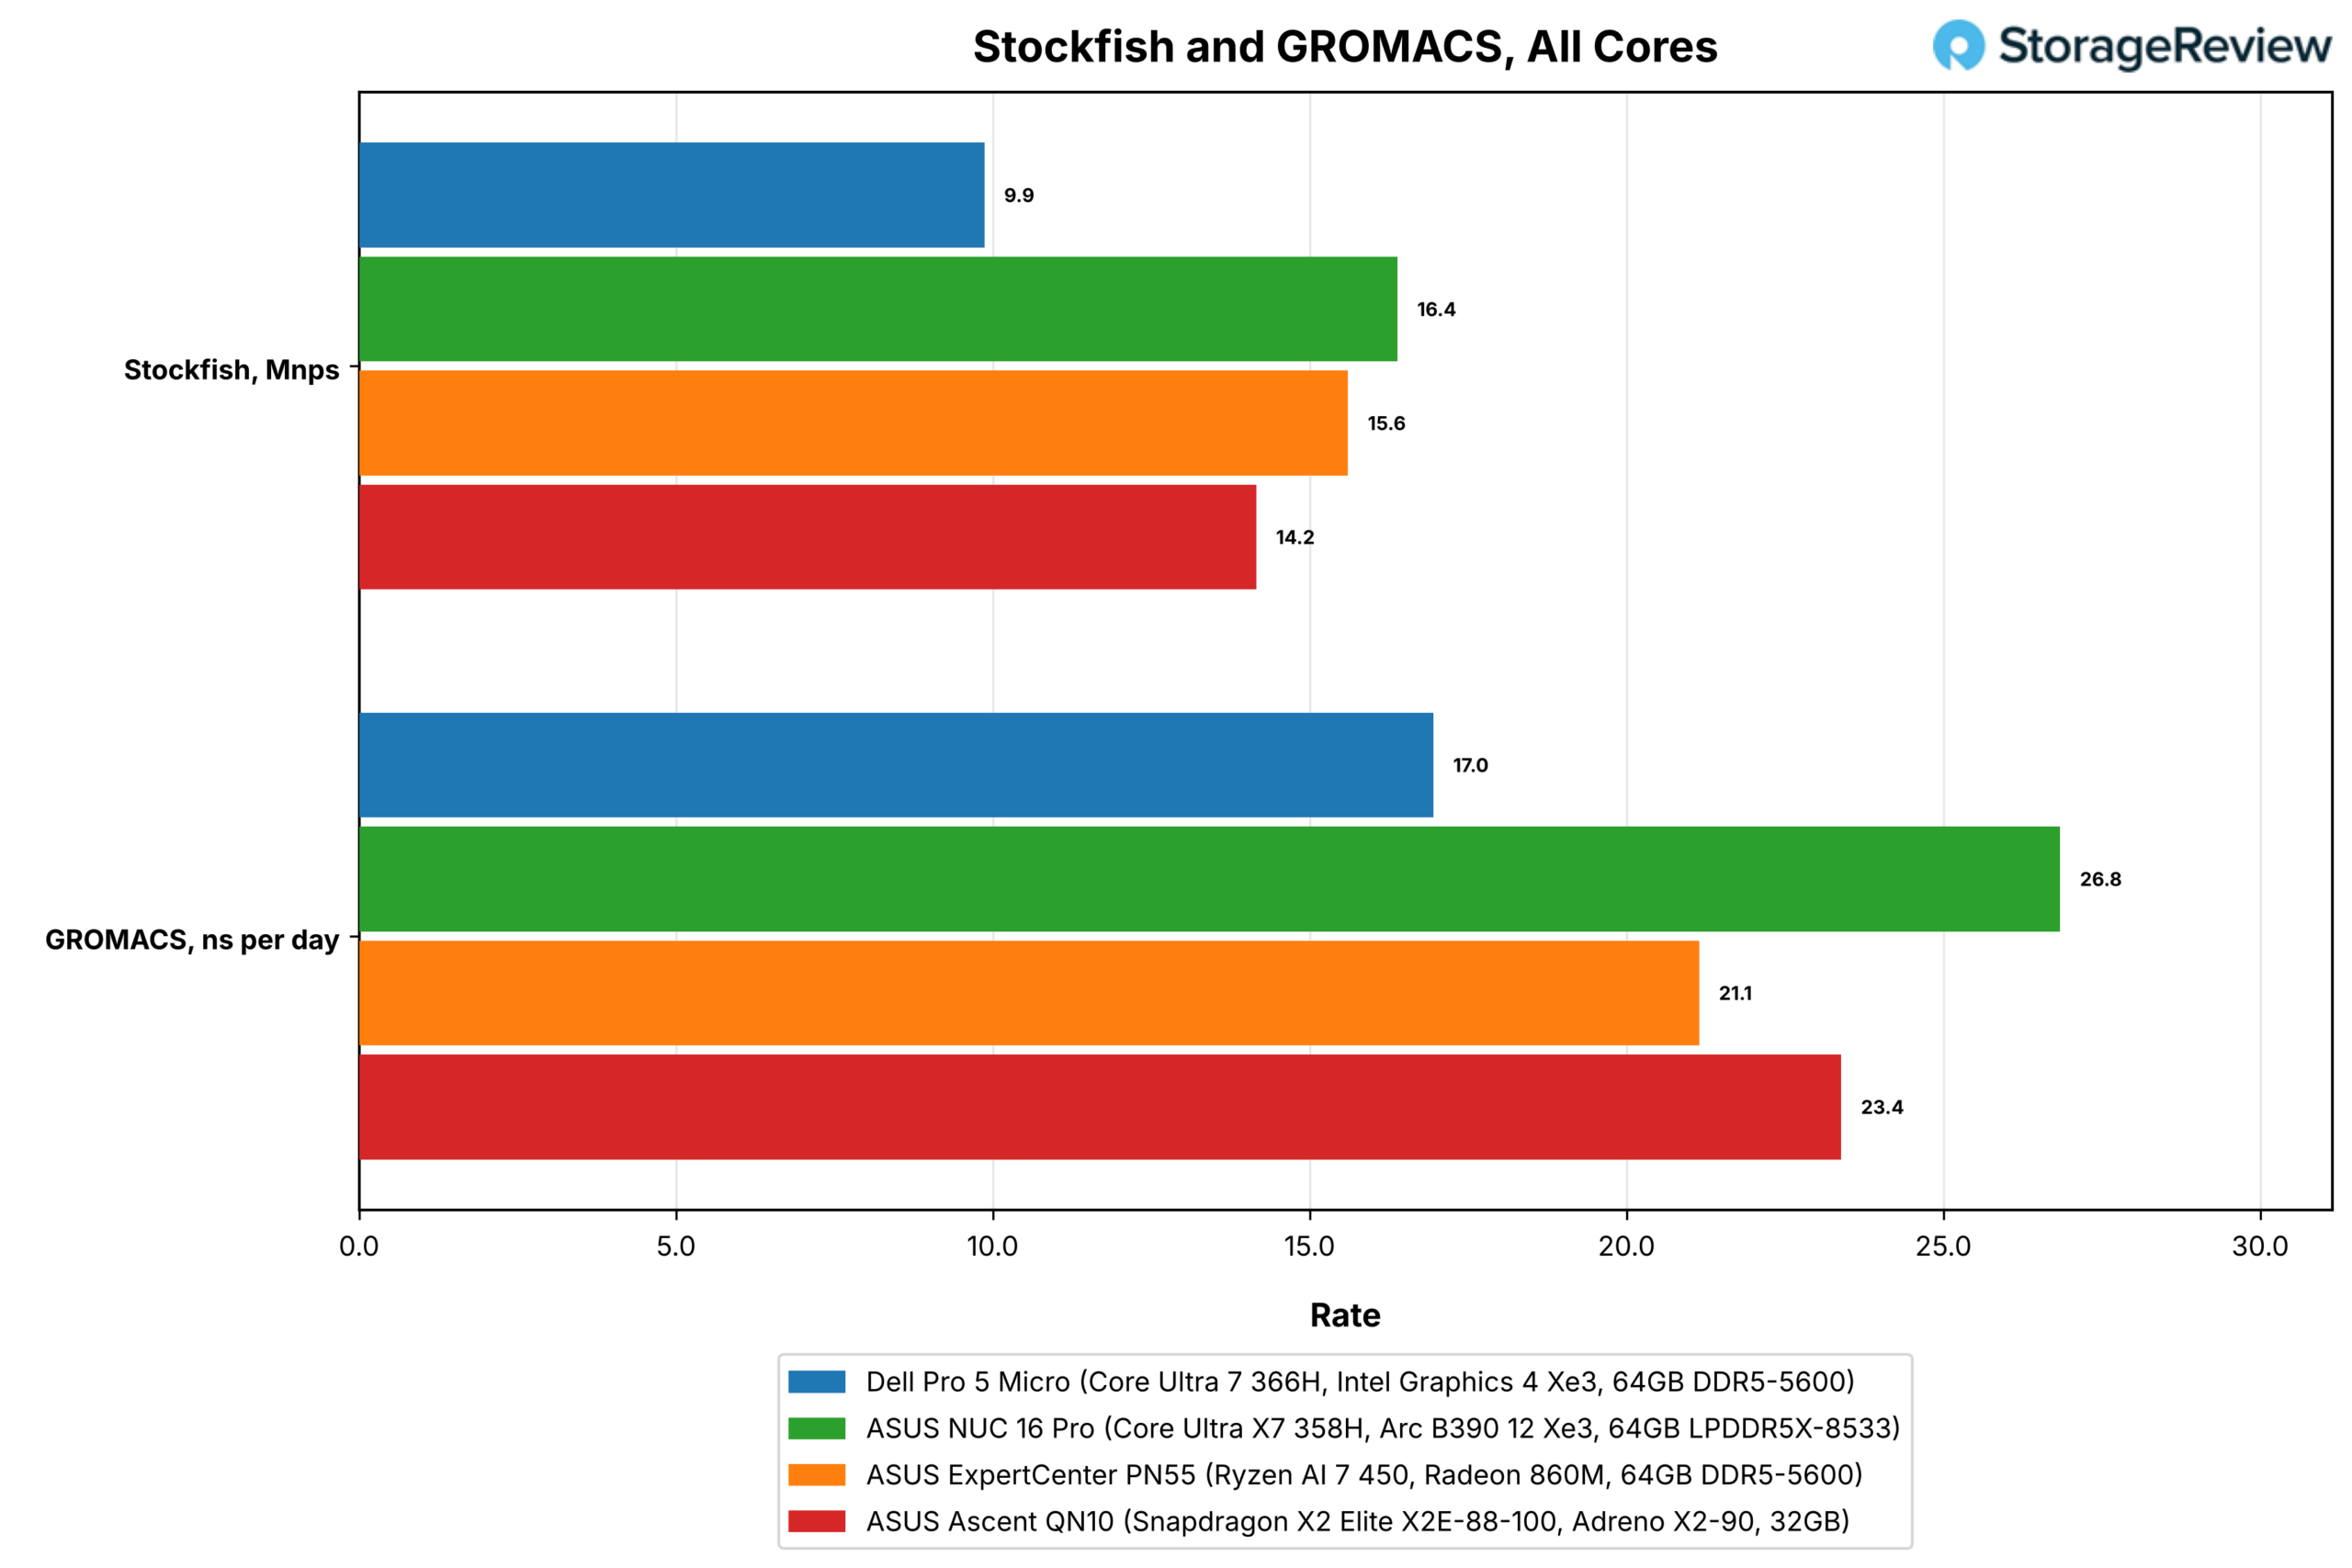
The LLVM 21.1.4 build, the longest sustained all-core job in the suite, takes 480.1 seconds on the Pro 5 Micro against 339.8 on the NUC, 444.9 on the PN55, and 210.5 on the QN10. Stockfish searches 9.87 million nodes per second on all cores against 16.39 on the NUC, the widest gap in the CPU set at 40 percent, and the suite recorded a 2,318MHz mean clock during that run. GROMACS runs the benchMEM system at 17.0 ns per day against 26.8, 21.1, and 23.4.
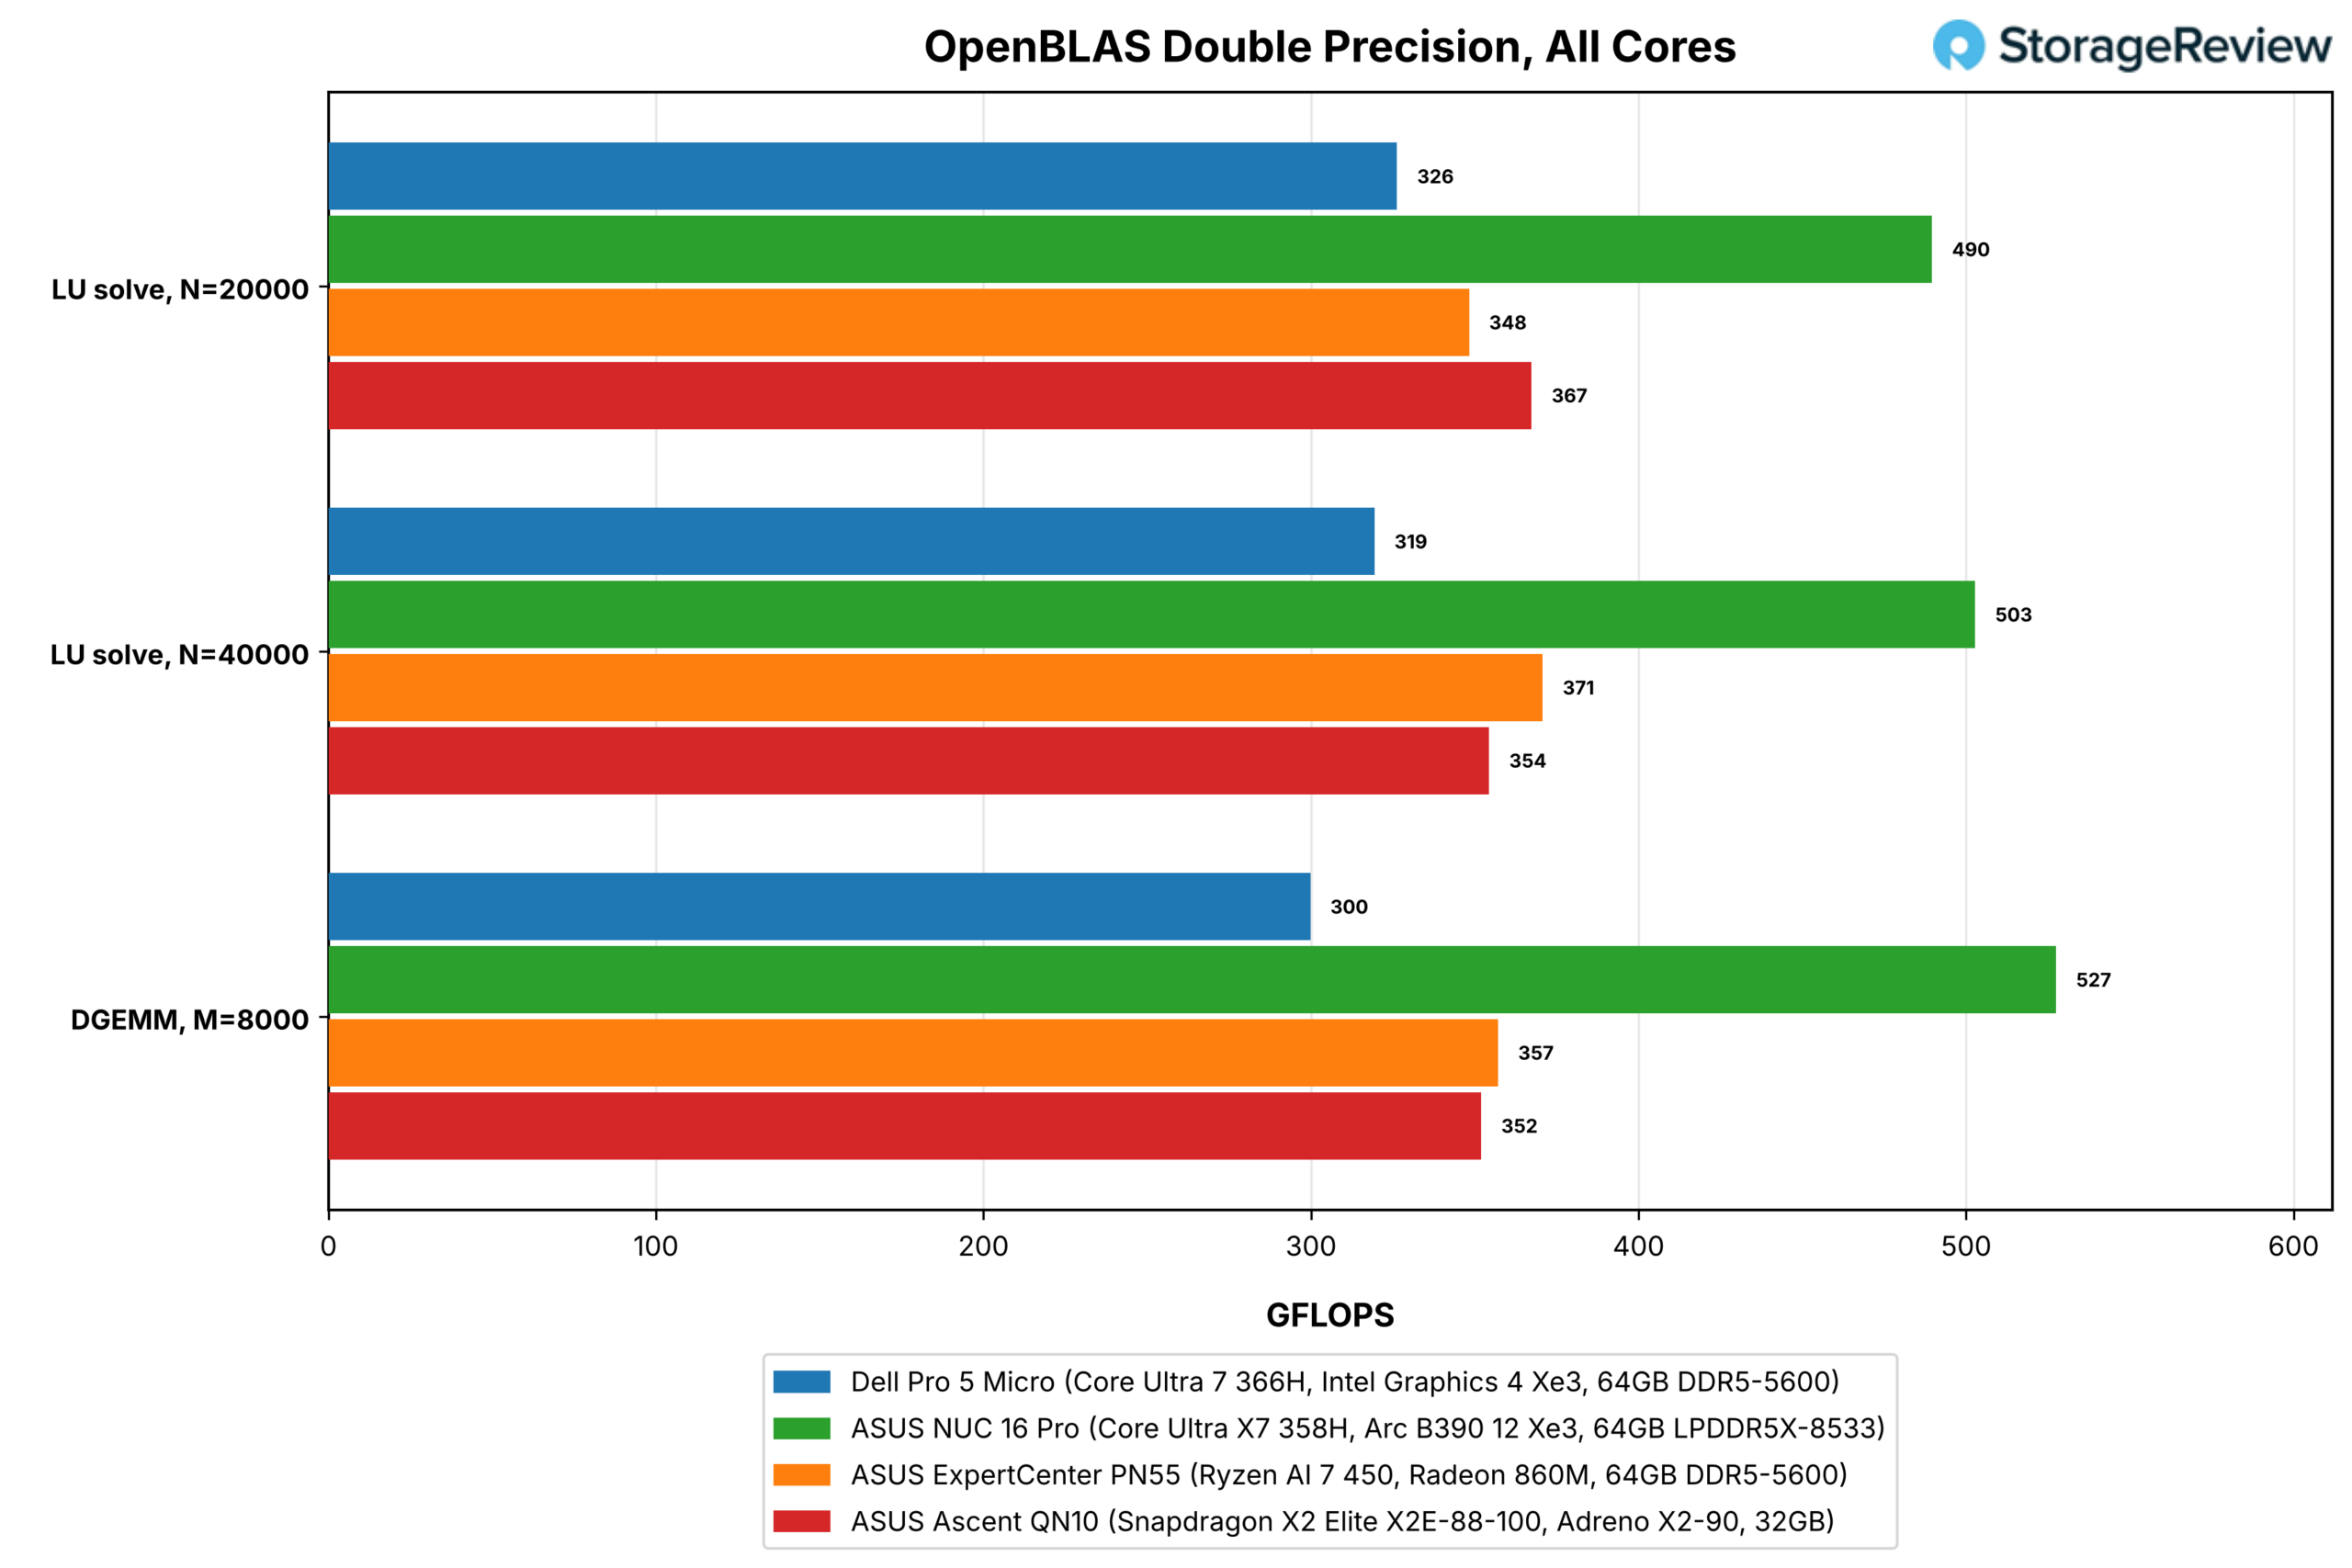
OpenBLAS separates the power budget from the core design, because the all-core LU solve at N=20000 reaches 326 GFLOPS on the Pro 5 Micro against 490 on the NUC, and DGEMM at M=8000 reaches 300 against 527. On the four P-cores alone, the Dell posts 197 GFLOPS against 238, a 17 percent gap, so the P-cores run close to the NUC’s when the E-cores are idle and fall back when all 16 share the power budget.
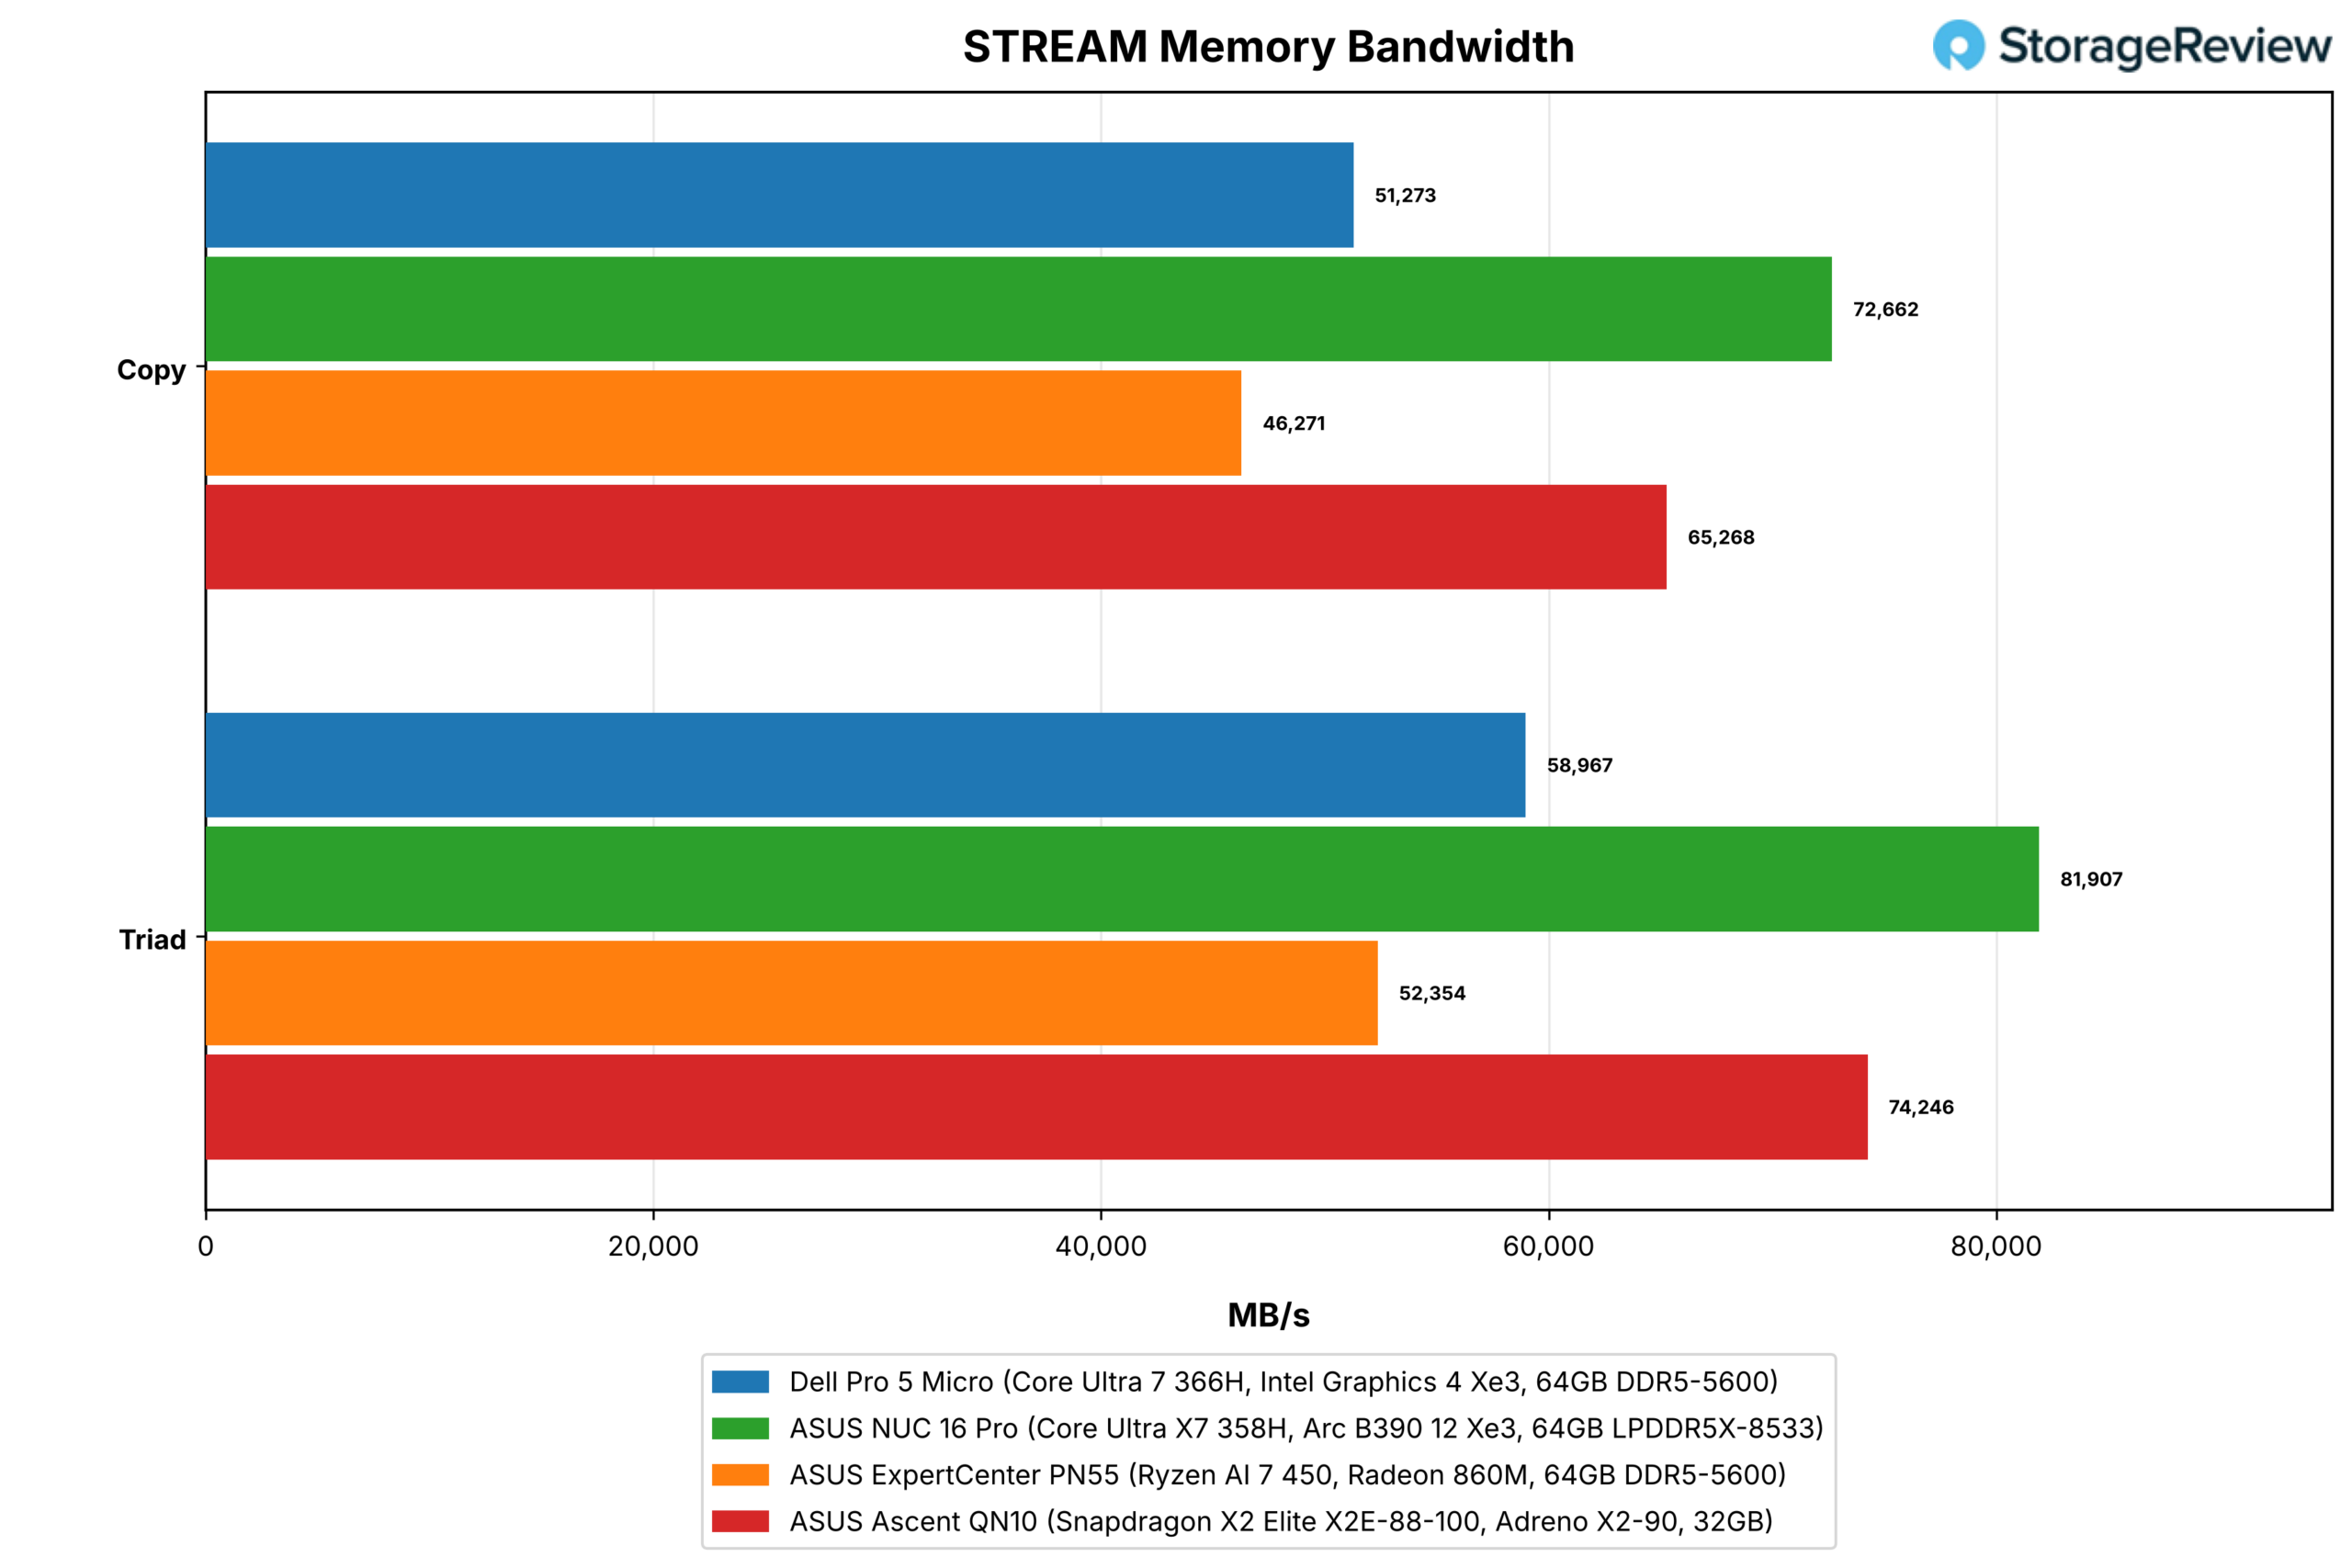
STREAM shows the cost of DDR5-5600 SO-DIMMs against soldered LPDDR5X-8533. The Pro 5 Micro copies at 51,273MB/s and runs Triad at 58,967MB/s, 28 percent behind the NUC’s 81,907MB/s, ahead of the PN55’s 52,354MB/s on the same DDR5-5600 speed, and behind the QN10’s 74,246MB/s. Memory latency is Dell’s weakest number at 155.7ns against 118.6ns on the NUC and 118.8ns on the PN55; Dell offers 6400 and 7200 MT/s SO-DIMM options that would narrow the bandwidth gap, and we tested the 5600 MT/s configuration Dell shipped.
The lightly threaded tests close the gap entirely. Speedometer 3.1 scores 42.2 on the Pro 5 Micro, 42.1 on the NUC, 39.2 on the PN55, and 48.2 on the QN10. PyPerformance’s go benchmark runs in 77.5ms on the Dell against 72.1ms on the NUC, and nbody in 60.2ms against 55.3ms. For the office and browser work this machine is sold for, the Core Ultra 7 366H in this chassis is as quick as the X7 358H in a larger one.
| Lightly threaded tests | Dell Pro 5 Micro (Core Ultra 7 366H, 64GB) | ASUS NUC 16 Pro (Core Ultra X7 358H, 64GB) | ASUS ExpertCenter PN55 (Ryzen AI 7 450, 64GB) | ASUS Ascent QN10 (Snapdragon X2 Elite, 32GB) |
|---|---|---|---|---|
| Cinebench 2026 single-core (higher is better) | 495 | 512 | 490 | 640 |
| 7-Zip single thread, GIPS (higher is better) | 8.33 | 9.41 | 9.56 | 10.36 |
| Speedometer 3 (higher is better) | 42.2 | 42.1 | 39.2 | 48.2 |
| PyPerformance go, ms (lower is better) | 77.5 | 72.1 | 76.1 | 113.9 |
| PyPerformance nbody, ms (lower is better) | 60.2 | 55.3 | 60.9 | 94.3 |
| PyPerformance regex_compile, ms (lower is better) | 72.9 | 68.6 | 70.1 | 82.1 |
| primesieve single thread, seconds (lower is better) | 10.62 | 10.17 | 6.79 | 6.27 |
| Memory latency, ns (lower is better) | 155.7 | 118.6 | 118.8 | 133.2 |
| Core-to-core latency, mean ns (lower is better) | 98.8 | 95.9 | 28.1 | 157.3 |
Encodage de jeux et de GPU
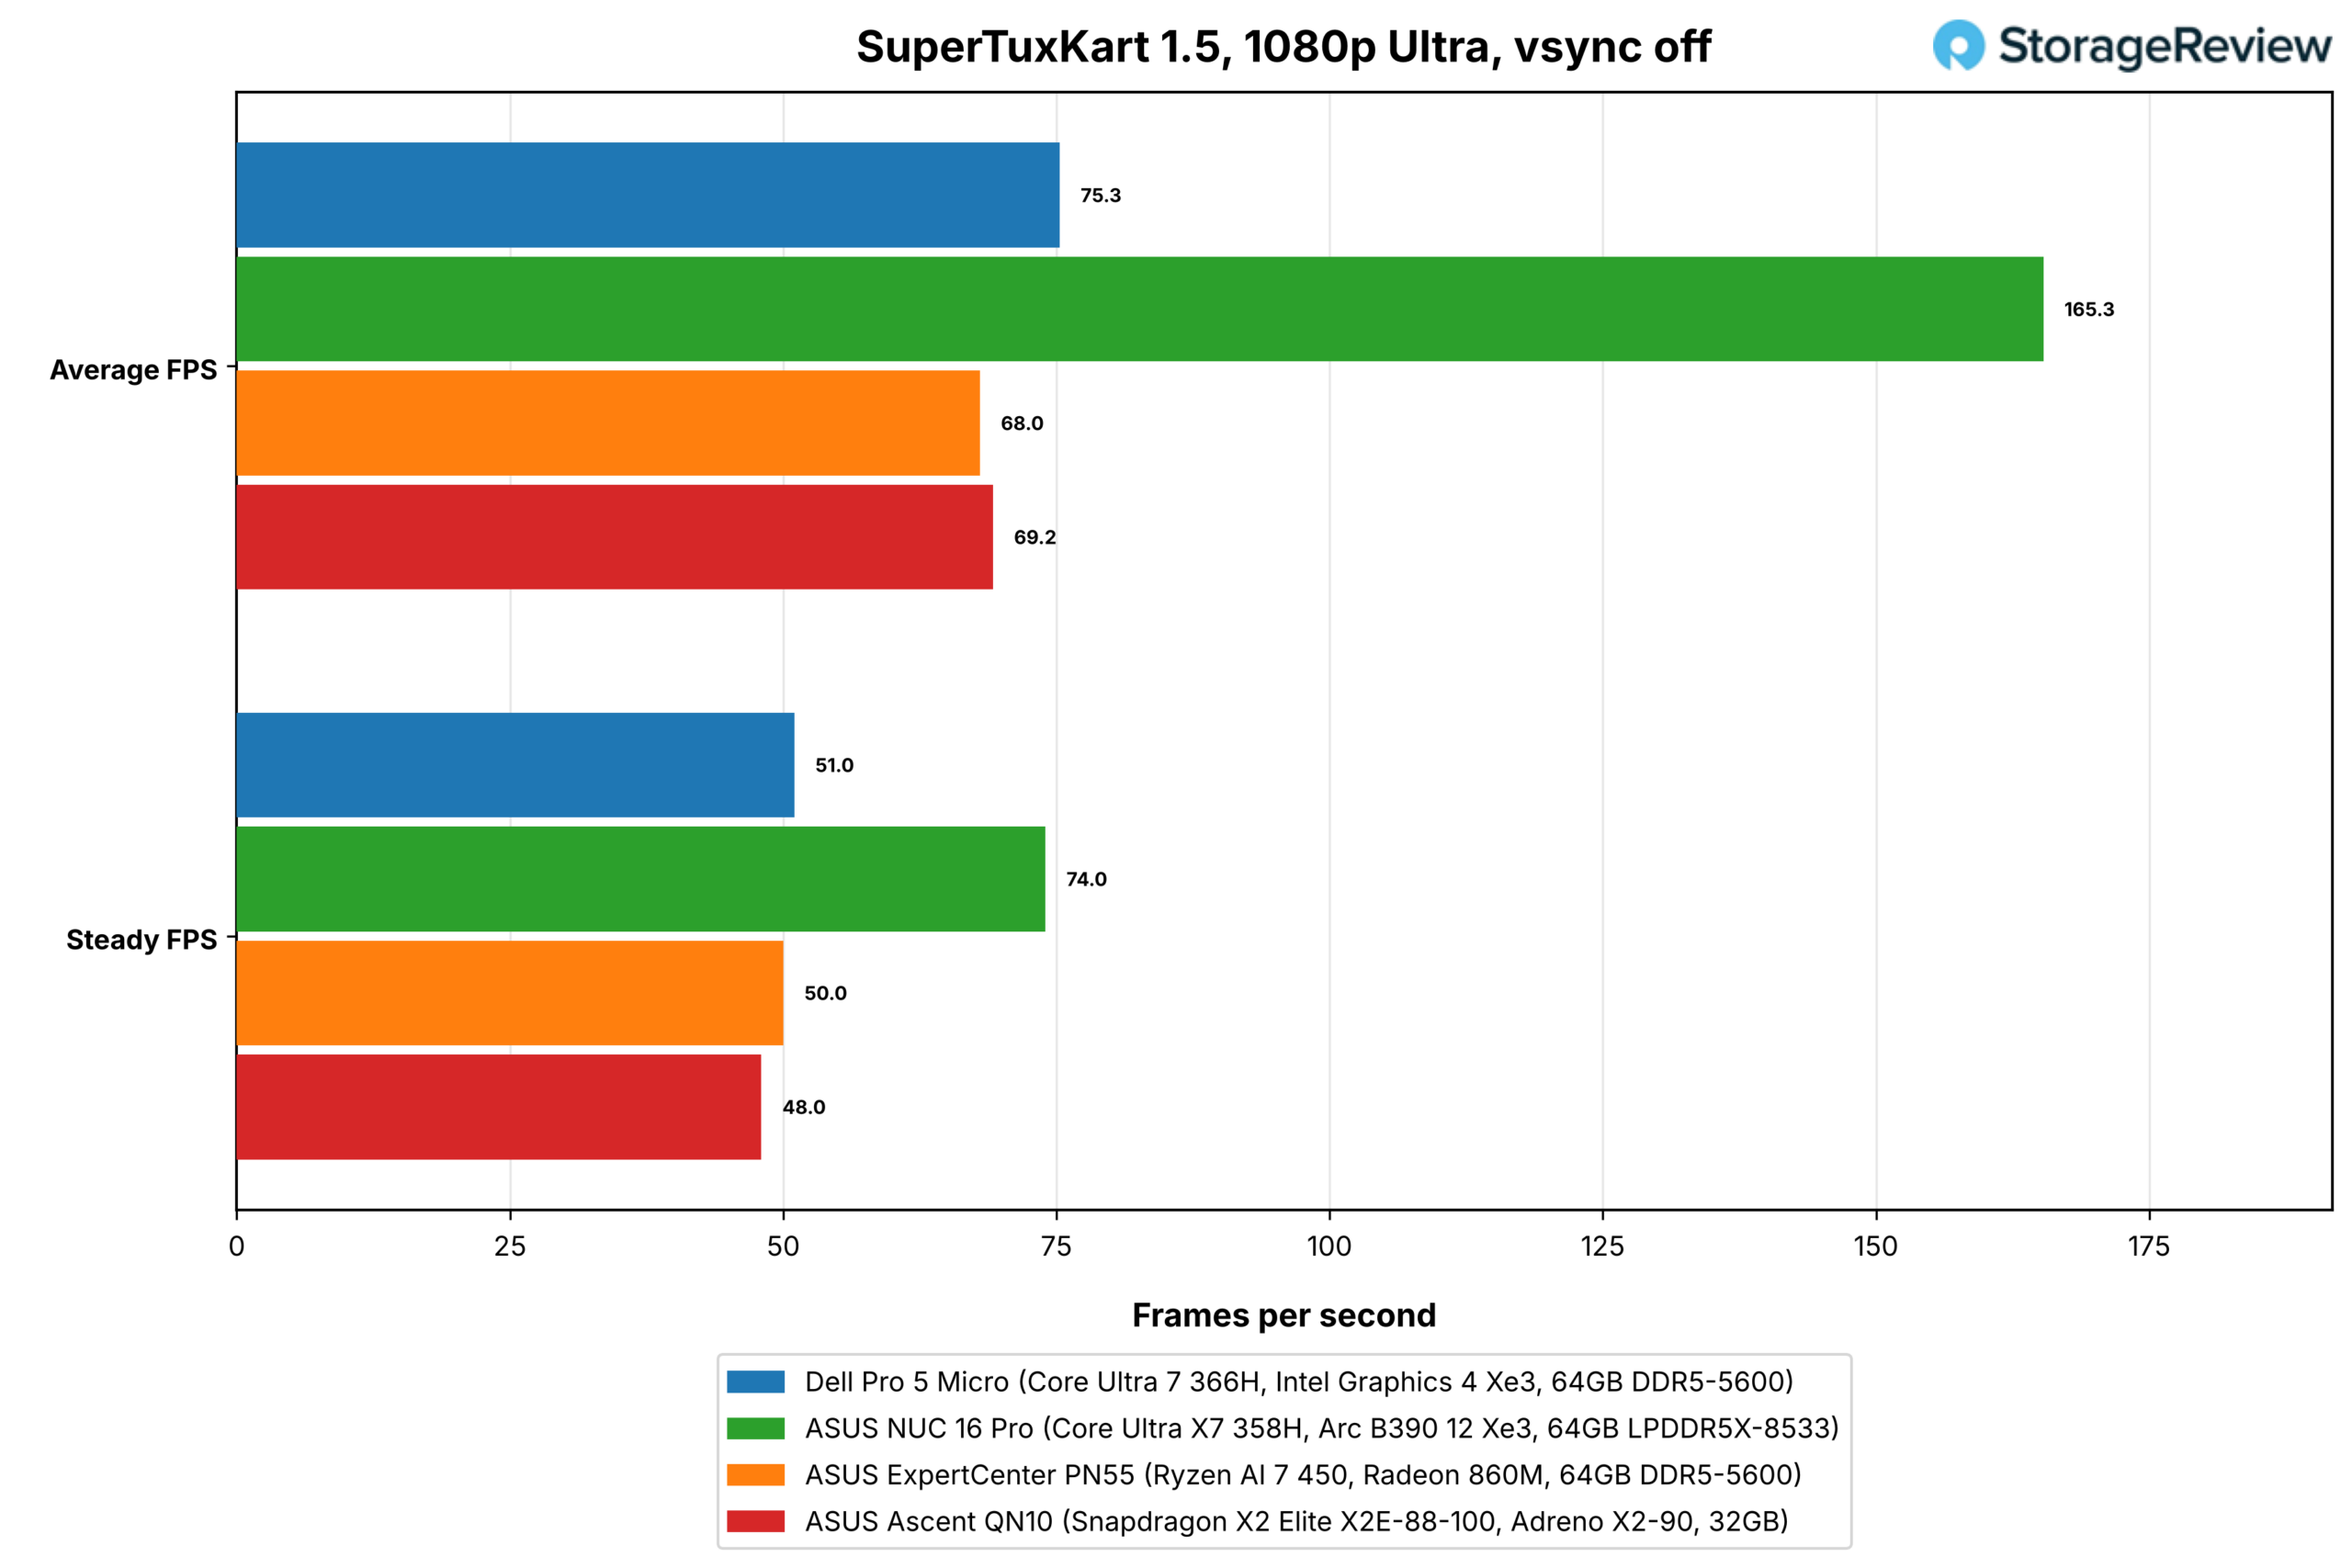
SuperTuxKart at 1080p Ultra with vsync off averages 75.3 fps on the Pro 5 Micro with a 51 fps steady figure, against 165.3 and 74 on the NUC 16 Pro, 68.0 and 50 on the PN55, and 69.2 and 48 on the QN10. The 4 Xe3 core GPU lands with the Radeon 860M and the Adreno X2-90 at a playable 1080p, and the B390 runs at 2.2x the Dell’s frame rate.
The media engine is where the two Intel chips are equal. The hardware HEVC 4K60 encode in the same test, run through ffmpeg’s hevc_qsv path, reaches 127 fps on the Pro 5 Micro and 129 fps on the NUC, because Intel’s Xe media engine is separate from the Xe compute cores and both chips carry the same one. The PN55’s AMD encoder ran the same job through the Media Foundation path at 152 fps, and the QN10 has no hardware encode path in this build of HandBrake. For a desktop that will transcode meeting recordings or screen captures, the Dell gives up nothing to the NUC.
| Hardware video encode, 4K60 HEVC via ffmpeg (fps, higher is better) | Dell Pro 5 Micro (Core Ultra 7 366H, 64GB) | ASUS NUC 16 Pro (Core Ultra X7 358H, 64GB) | ASUS ExpertCenter PN55 (Ryzen AI 7 450, 64GB) | ASUS Ascent QN10 (Snapdragon X2 Elite, 32GB) |
|---|---|---|---|---|
| Intel Quick Sync (hevc_qsv) | 127 | 129 | N/D | N/D |
| AMD via Media Foundation (hevc_mf) | N/D | N/D | 152 | N/D |
Températures et fréquences d'horloge sous charge
The 30-minute Cinebench loop scores 3,513 on the first pass and settles at 3,352, 0.954 of pass one, with a 2,483MHz mean clock over the run. The NUC 16 Pro holds 5,002, 1.002 of its first pass, at 3,572MHz; the PN55 drops to 0.917 of its first pass at a reported 100.1C; and the QN10 holds 0.995 at 3,447MHz. The Dell loses 5 percent over the half hour, which is a well-behaved curve for a 1.17-liter chassis; it starts the curve lower than the NUC because its all-core clock is set lower from the first minute.
The clock table shows how consistent that budget is. Across every all-core test, the Pro 5 Micro logs between 2,318 and 3,324MHz, with the heaviest vector loads (Stockfish, GROMACS, OpenBLAS) at the bottom of that range and Cinebench and 7-Zip at the top, while the NUC sits between 3,527 and 3,803MHz on the same tests.
The lightly threaded tests put the Dell between 3,459MHz in Speedometer and 3,965MHz in the memory latency test, so the chip is not clock-limited in bursts; the all-core ceiling is a package power limit, and the GPU-bound AI runs sit lower still (MLPerf Client at 2,508MHz, image generation at 3,088MHz) because the CPU has little to do while the GPU works.
| Fréquence d'horloge moyenne du processeur pendant le test (MHz) | Dell Pro 5 Micro (Core Ultra 7 366H, 64GB) | ASUS NUC 16 Pro (Core Ultra X7 358H, 64GB) | ASUS ExpertCenter PN55 (Ryzen AI 7 450, 64GB) | ASUS Ascent QN10 (Snapdragon X2 Elite, 32GB) |
|---|---|---|---|---|
| Cinebench 2026 | 3,324 | 3,773 | 4,729 | 3,622 |
| Boucle soutenue | 2,483 | 3,572 | 3,966 | 3,447 |
| 7-Zip | 3,251 | 3,803 | 4,547 | 3,835 |
| Stockfisch | 2,318 | 3,527 | 3,826 | 3,180 |
| Mixeur | 2,806 | 3,609 | 4,074 | 3,451 |
| HandBrake | 2,825 | 3,601 | 4,091 | 3,661 |
| LLVM build | 2,699 | 3,593 | 4,054 | 3,493 |
| GROMACS | 2,408 | 3,587 | 4,035 | 3,536 |
| Ouvrir BLAS | 2,834 | 3,700 | 4,571 | 3,312 |
| FLUX | 3,722 | 3,649 | 4,182 | 3,743 |
| tamis | 2,871 | 3,743 | 3,964 | 3,334 |
| Client MLPerf | 2,508 | 2,387 | N/D | N/D |
| CHIFFON | 3,592 | 3,603 | 4,089 | N/D |
| LLM au service | 3,615 | 3,552 | 3,375 | 3,857 |
| SuperTuxKart | 3,605 | 3,655 | 3,514 | 2,879 |
| stockage fio | 2,854 | 2,969 | 3,519 | 2,267 |
Dell’s manual describes Dell Optimizer thermal modes for this model, but our unit exposes none, and Windows Best Performance is the only power setting available, so the clocks in the table are what the box does as shipped and what a fleet will see; there is no higher gear to test.
Performances de stockage
The Sandisk PC SN8050S is a Gen5 drive, but it runs at Gen4 speed in the Pro 5 Micro. Sequential reads reach 7,095MB/s through the file system and 7,101MB/s on the raw device, right at the Gen4 x4 ceiling, against 14,236MB/s from the Samsung PM9E1 on the NUC’s Gen5 link. The 2TB version of the same drive in the HP OmniBook Ultra 16 we reviewed read 13,598MB/s on a Gen5 link.
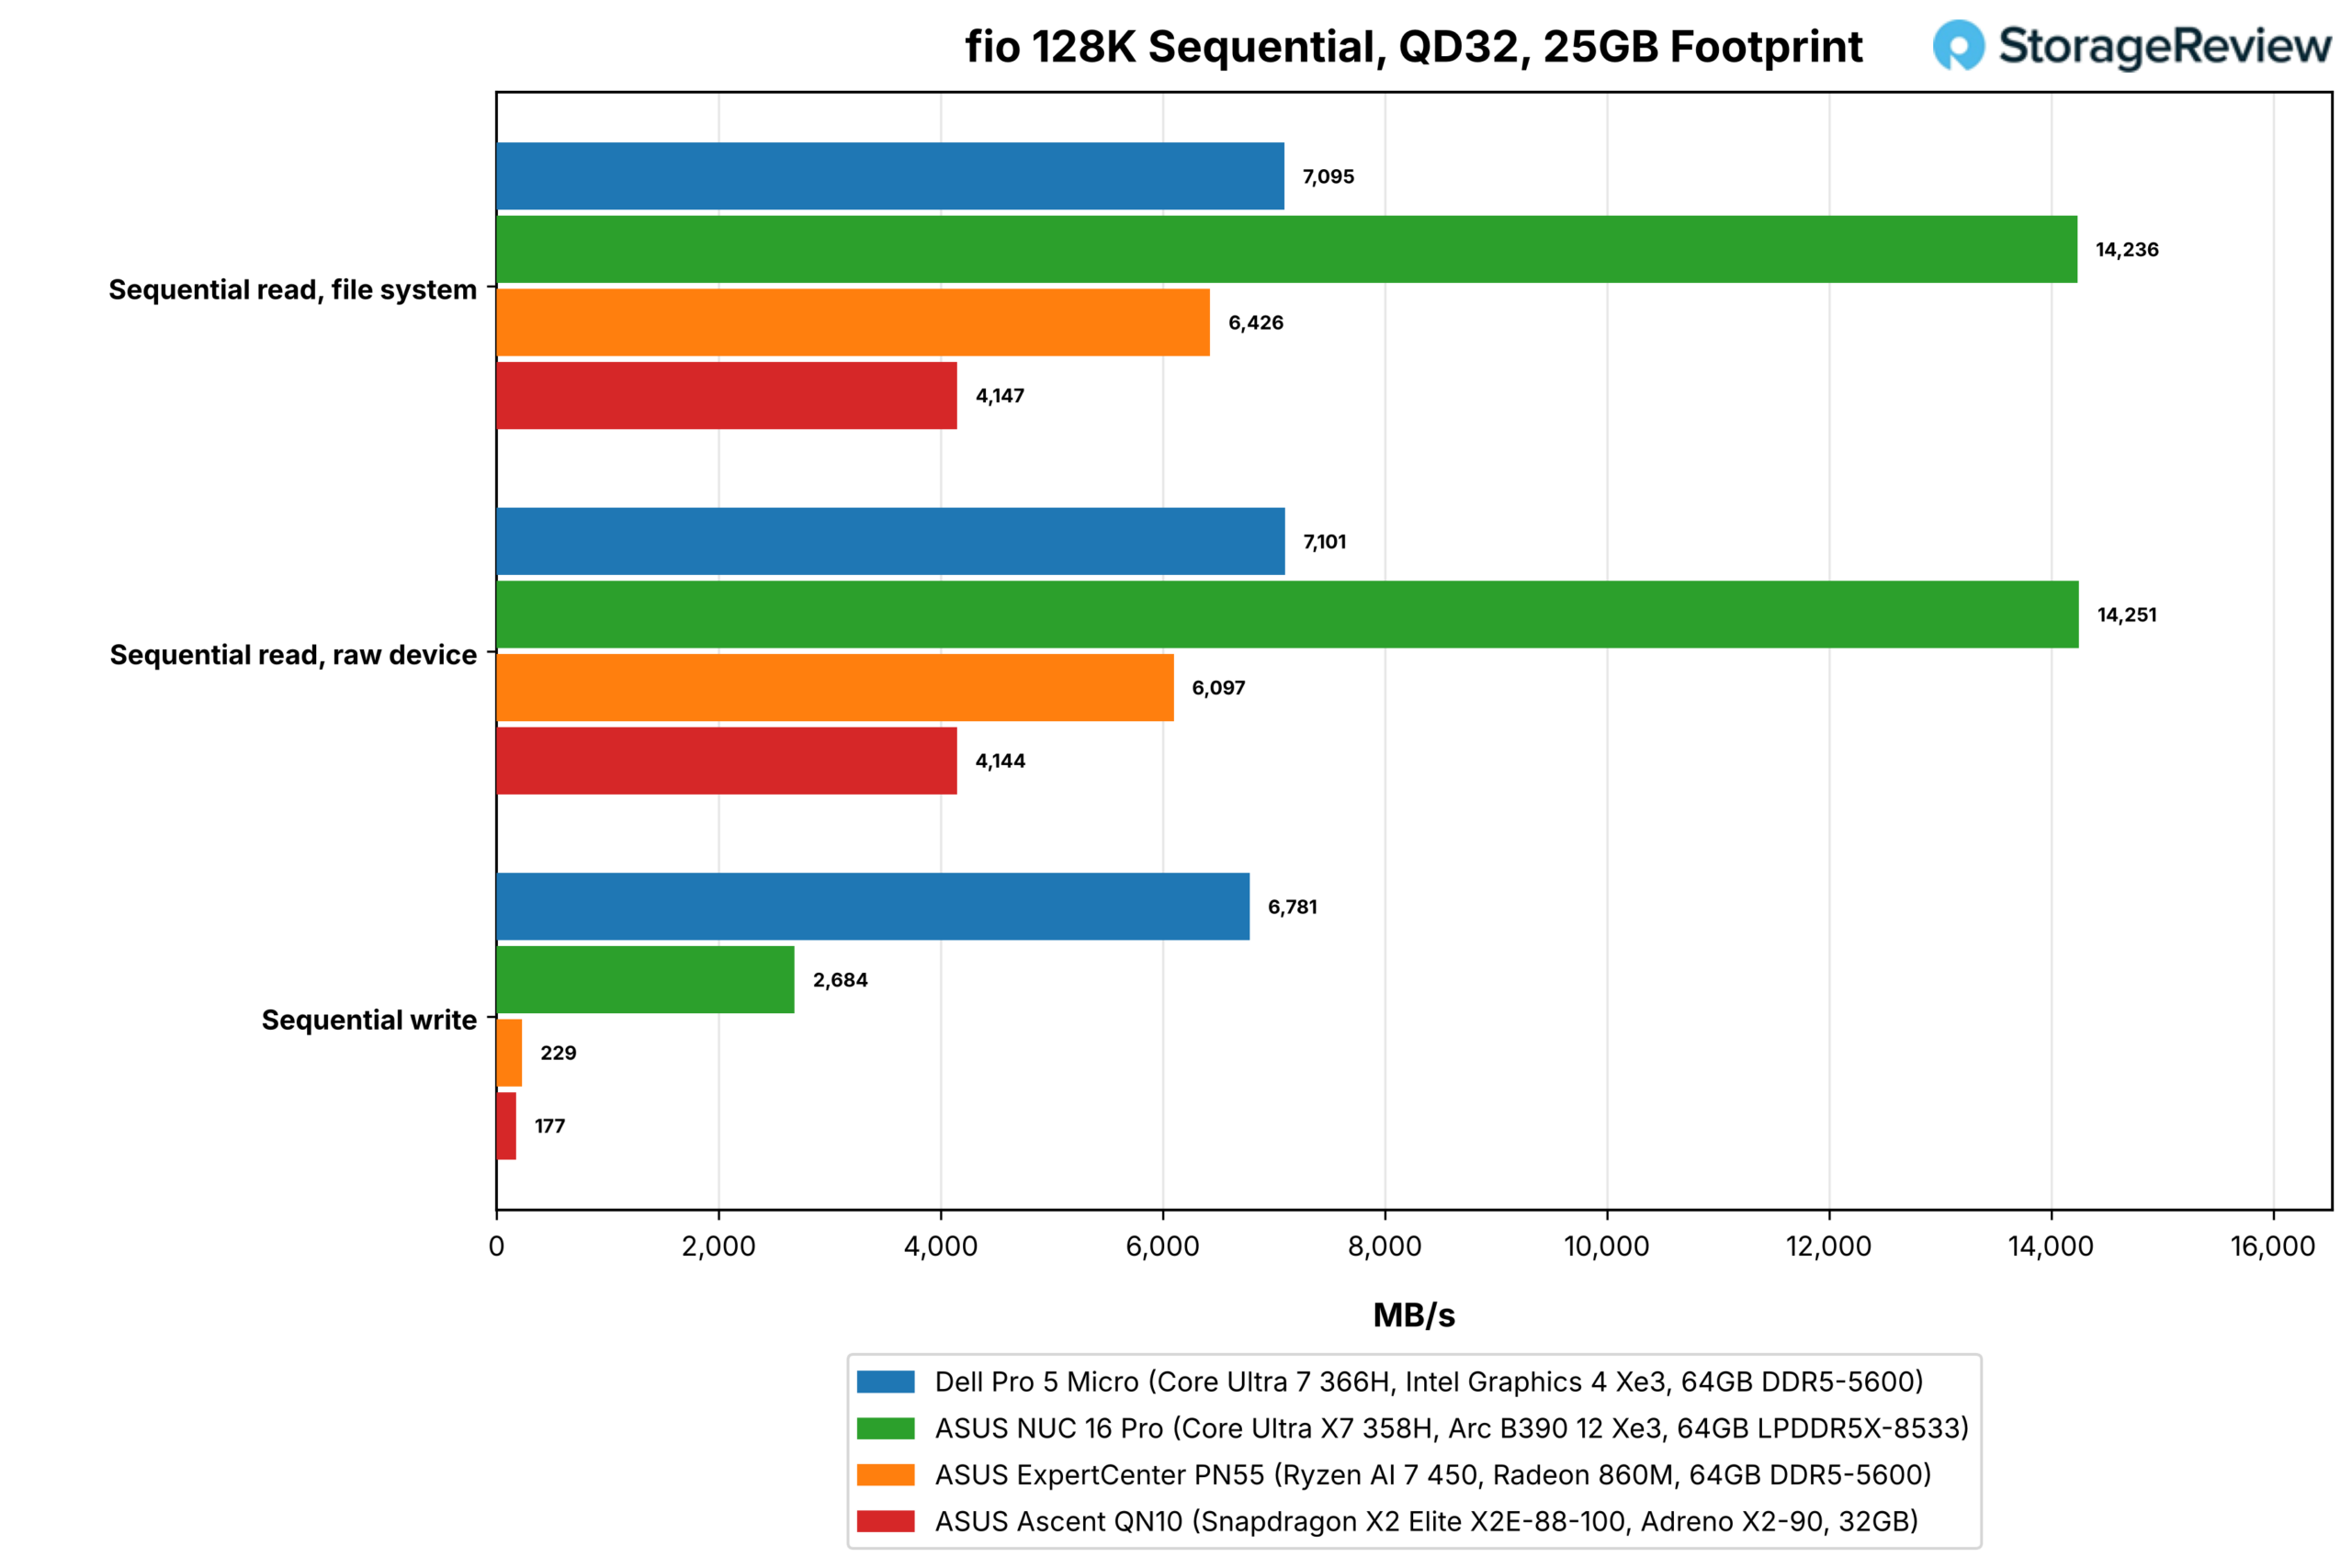
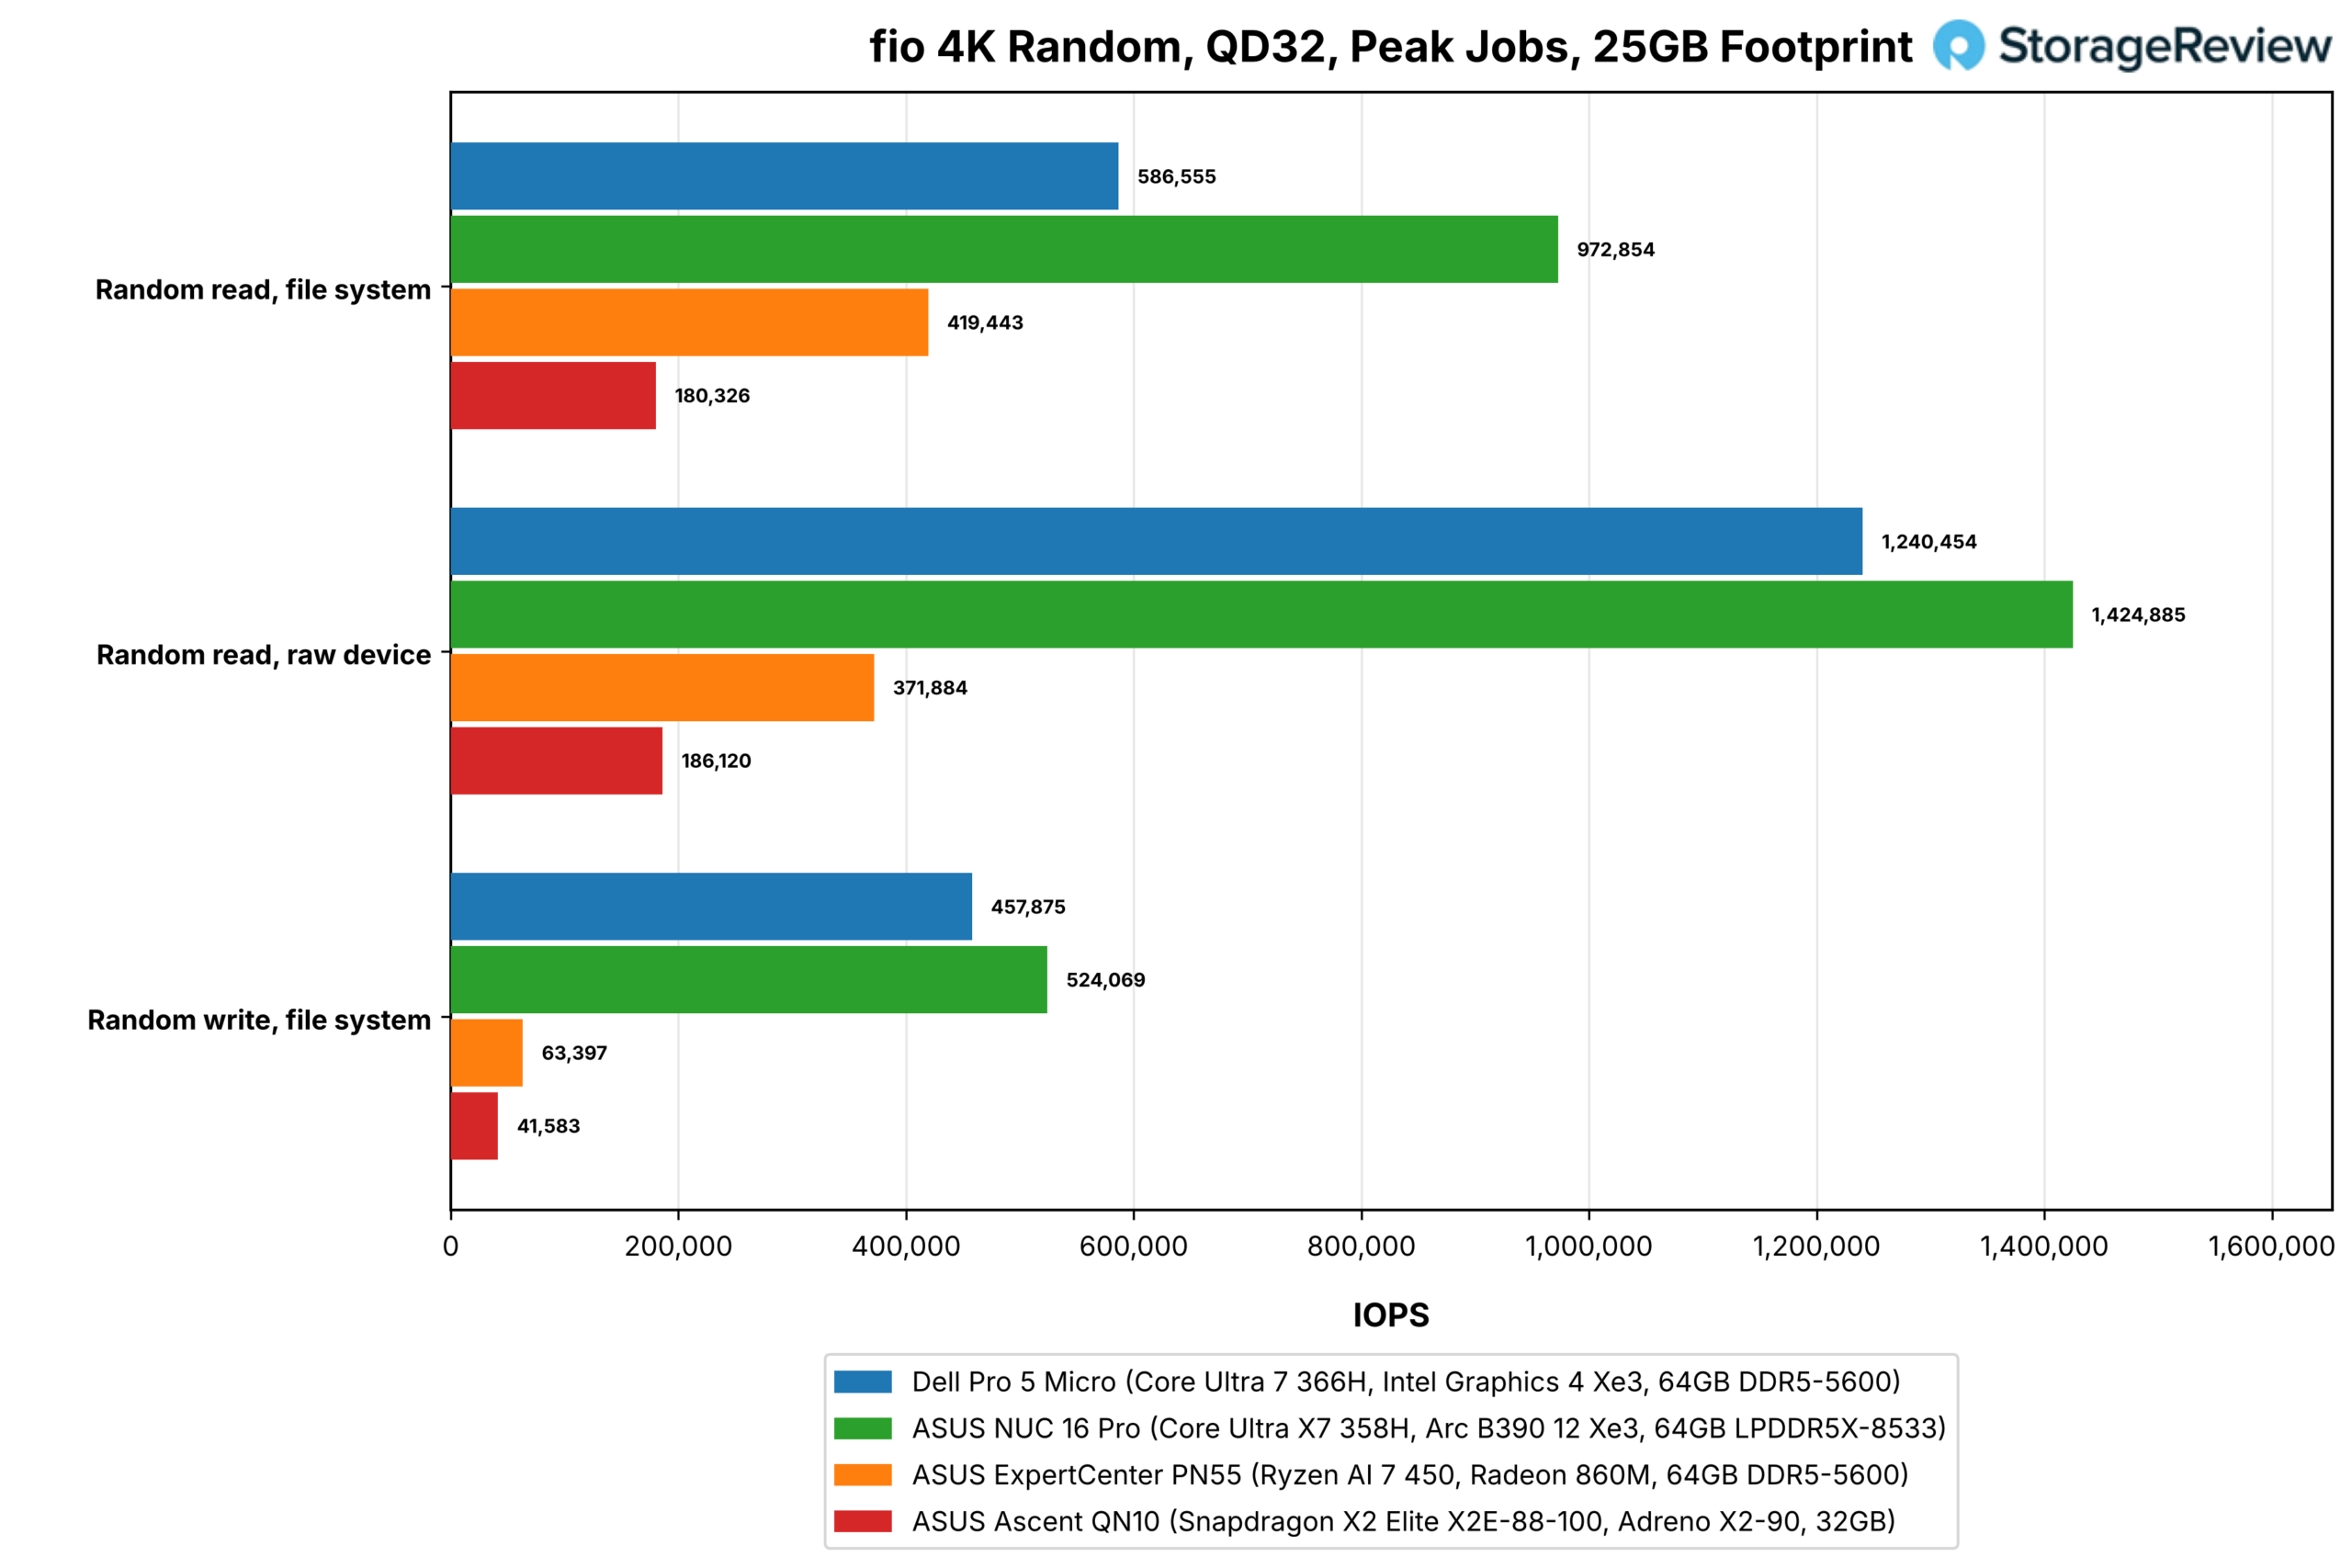
Writes are where the Dell’s drive leads this group, with sequential writes at 6,781MB/s, a wide margin over the 2,684MB/s on the NUC and 229MB/s on the PN55’s Micron 2500, and 4K random writes at 16 jobs reach 457.9K IOPS against 524.1K on the NUC and 57.3K on the PN55. Random reads at 16 jobs reach 538.3K IOPS through the file system and 1.24M on the raw device, against 972.9K and 1.42M on the NUC; the Dell’s file-system peak comes at eight jobs, 586.6K IOPS, which is the figure on the chart, with the Dell’s 99th percentile read latency at QD32 on four jobs at 416 microseconds.
| fio results (25GB footprint) | Dell Pro 5 Micro (Core Ultra 7 366H, 64GB) | ASUS NUC 16 Pro (Core Ultra X7 358H, 64GB) | ASUS ExpertCenter PN55 (Ryzen AI 7 450, 64GB) | ASUS Ascent QN10 (Snapdragon X2 Elite, 32GB) |
|---|---|---|---|---|
| Sequential 128K, QD32 (MB/s, higher is better) | ||||
| Sequential read, file system | 7,095 | 14,236 | 6,426 | 4,147 |
| Sequential read, raw device | 7,101 | 14,251 | 6,097 | 4,144 |
| Écriture séquentielle | 6,781 | 2,684 | 229 | 177 |
| Random 4K, QD32 (IOPS, higher is better) | ||||
| Random read, 4 jobs | 371,538 | 522,083 | 329,771 | 177,169 |
| Random read, 8 jobs | 586,555 | 813,910 | 412,650 | 179,044 |
| Random read, 16 jobs | 538,254 | 972,854 | 419,443 | 180,326 |
| Random read, raw device, 16 jobs | 1,240,454 | 1,424,885 | 371,884 | 184,202 |
| Random write, 16 jobs | 457,875 | 524,069 | 57,283 | 26,074 |
| Latency (microseconds, lower is better) | ||||
| Random read p99, 4 jobs | 416 | 317 | 905 | 1,188 |
| Random read p99.99, 4 jobs | 4,555 | 553 | 2,441 | 2,277 |
| Random write p99, 16 jobs | 1,401 | 2,212 | 41,681 | 111,673 |
| Sequential read mean latency | 588 | 293 | 651 | 1,010 |
For the work this machine does, the Gen4 link won’t be an obvious issue. The cold gpt-oss:20b load ran at 2,991MB/s, which is the model loader’s pace, not the drive’s ceiling, and a 1TB self-encrypting TLC drive with 6,781MB/s writes is more SSD than most office images will exercise.
Conclusion
The Dell Pro 5 Micro is the Panther Lake commercial micro built around the parts a fleet needs: a vPro Enterprise processor, two DDR5 SO-DIMM slots, two M.2 SSD slots, a self-encrypting drive, Wi-Fi 7, three display outputs before the module bay, and a module bay that covers DisplayPort 2.1 at one end and serial and PS/2 at the other. It does the office work it is sold for at the same single-thread speed as the X-series NUC 16 Pro, encodes video on the same media engine, and holds 95 percent of its first-pass score through a 30-minute loop in 1.17 liters.
The costs of the commercial configuration are measurable, though. All-core CPU work runs 28 percent behind the NUC on the same 16 cores because the platform’s power limits hold the package near 2,483MHz, local AI runs about a third slower on 4 Xe3 cores than on 12, the DDR5-5600 SO-DIMMs trail LPDDR5X on bandwidth and latency, and the Gen5 SSD sits on a Gen4 slot. None of these change what the machine is for, and buyers who need the GPU for local models or the extra multi-core throughput are shopping for a different class of box, one that gives up vPro and memory slots to get it.
At $1,617 for the base configuration and $4,500 for our review unit as Dell configures it, with three years of onsite service in that figure, the Pro 5 Micro prices its memory at $1,530 for the step from 16GB to 64GB; the two SO-DIMM slots are user-serviceable, so a buyer who orders the 16GB build can populate them from the open market. The Core Ultra 7 366H adds $460 over the Core Ultra 5 335 and brings eight more E-cores and 3 TOPS of NPU at the same 25W, which is worth it for anyone who compiles, encodes, or runs a local model; the Core Ultra 5 build with 32GB is the sensible fleet configuration for everyone else.
The serviceability deserves the last word. A cover that pops off to expose the memory, storage, and cooling in one step, in a stamped steel case that will shrug off years behind a kiosk, is the kind of design a fleet manager values more than a benchmark lead, and it is the reason the Pro 5 Micro earns its place in the commercial catalog even where the X-series micros outrun it.

Classement: The Dell Pro 5 Micro holds Best Commercial Mini PC on our Meilleurs mini-PC classement.



 Amazon