

The Dell Pro Precision 7 16 is the higher-end 16-inch mobile workstation in Dell’s current Pro Precision lineup. Our review unit is built around significantly more GPU power than the 5 16s Intel tested alongside it. It pairs a Series 3 Intel Core Ultra 9 386H, a 16-core Panther Lake processor with a 50 TOPS NPU, with NVIDIA RTX PRO 3000 Blackwell graphics and 12GB of GDDR7, 64GB of LPDDR5x at 8533 MT/s, and two 1TB Gen5 SSDs in RAID 0. The panel is a 16-inch UHD+ Tandem OLED with touch and a 120Hz variable refresh rate, running at 3840 x 2400. In testing, the discrete GPU rendered the Blender Monster scene at 1,555.53 samples per minute, roughly 2.7 times the integrated Arc Pro B390 in the 5 16s Intel, while the same configuration recorded the shortest battery runtime of any Pro Precision we have tested.
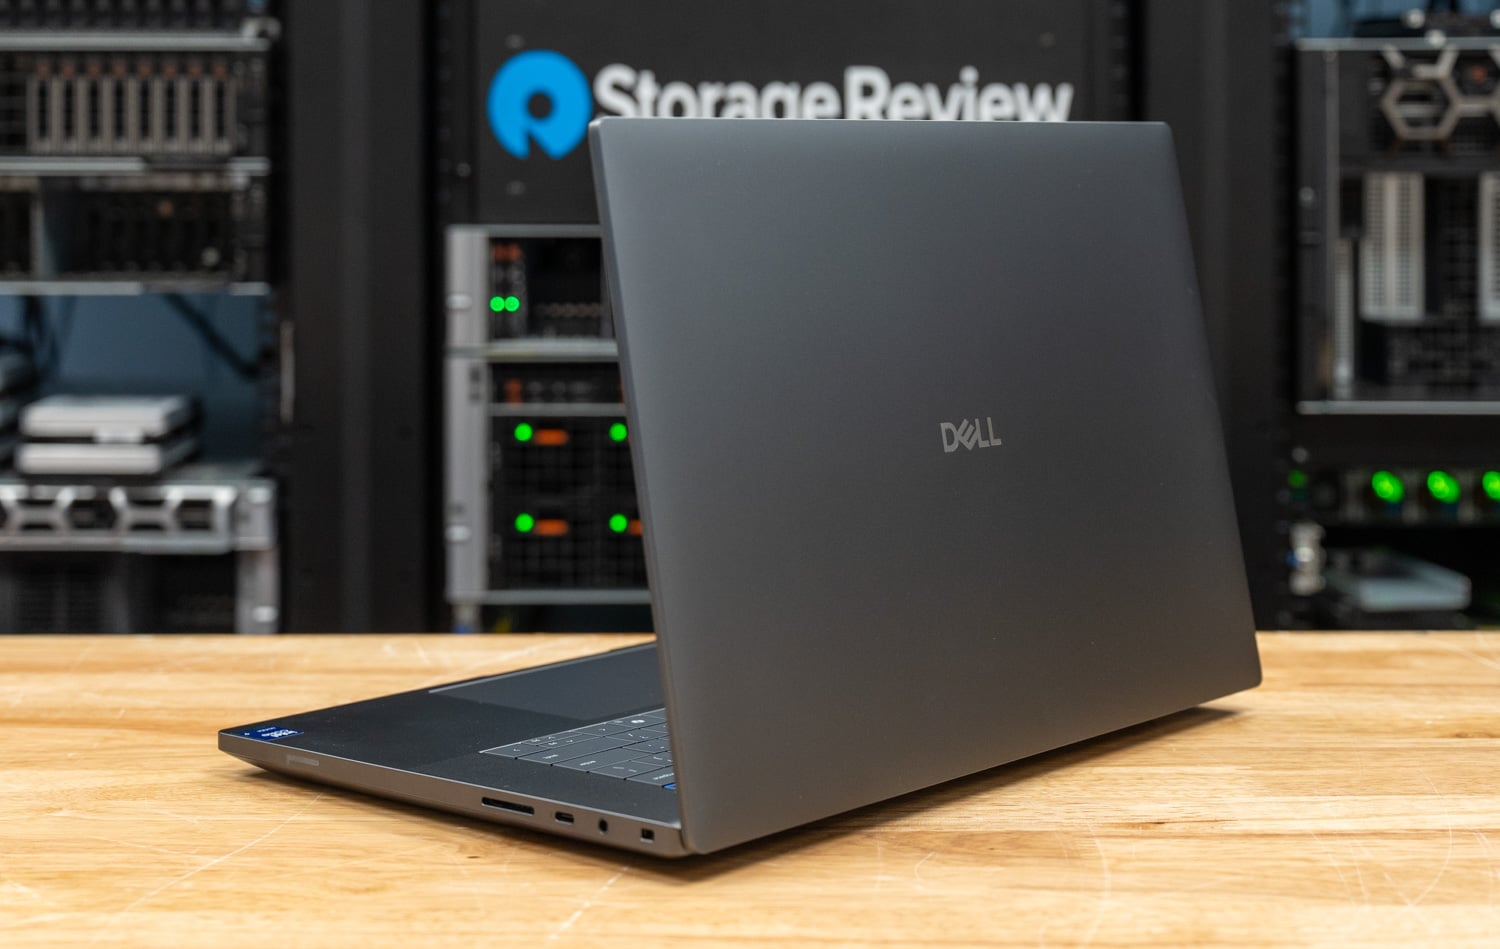
Compared with the Pro Precision 5 16s Intel, the 7 16 trades some portability and battery life for substantially more GPU performance and a higher-end feature set. Our configuration adds the RTX PRO 3000, a 96Wh battery, a 165 W adapter, a second Gen5 drive bay, and two Thunderbolt 5 ports alongside Thunderbolt 4. It is a better fit for engineers, designers, visualization specialists, video professionals, and other users whose applications benefit from dedicated NVIDIA graphics. The 7 16 also features a large haptic trackpad, which immediately differentiates the keyboard deck from the 5 16s.
The RTX PRO 3000 Blackwell is the mobile professional card in the NVIDIA Blackwell generation, with 12GB of GDDR7 and certified drivers for professional applications. Combined with the 50 TOPS NPU in the Core Ultra 9 386H, the system can run local AI work across the CPU, the discrete GPU, or the dedicated accelerator, and our Procyon testing covers all three paths. Coverage also includes professional graphics, rendering, content creation, storage, and battery.
The Dell Pro Precision 7 16 starts at $3,293, while the hardware in our review unit costs approximately $8,245. Dell’s public configurator does not currently allow us to reproduce the two-drive Gen5 RAID 0 configuration exactly, even though the otherwise equivalent single-drive configuration is priced at $7,795 in our brief. Applying the same $440 price difference for the second Gen5 SSD brings the as-shipped equivalent to that figure. Commercial buyers may see different pricing through account agreements and volume purchases, so Dell.com’s single-unit pricing is best used as a reference. The system is now available on the Dell Pro Precision 7 Series 16 product page.
Dell Pro Precision 7 16 Specifications
| Specification | Dell Pro Precision 7 16 (PW716260) |
|---|---|
| Model | Dell Pro Precision 7 Series 16 (PW716260) |
| Processor | Intel Core Ultra 9 386H vPro Enterprise (Series 3), 16 cores / 16 threads, up to 4.9GHz, 50 TOPS NPU |
| Graphics | NVIDIA RTX PRO 3000 Blackwell, 12GB GDDR7 |
| Memory | 64GB LPDDR5x, 8533 MT/s, dual-channel, onboard, non-ECC |
| Storage | Two 1TB Gen5 SED-ready SSDs in RAID 0 |
| Display | 16″ UHD+ Tandem OLED 3840 x 2400, touch, 120Hz VRR, 500 nits, 100% DCI-P3, VESA DisplayHDR True Black 1000, anti-reflection |
| Camera | 8MP HDR RGB + IR with User Presence Detection and ExpressSign-In |
| Wireless | Intel Wi-Fi 7 BE211 2×2, Bluetooth 6.0 |
| Keyboard | Zero-lattice spill-resistant with mini-LED backlighting |
| Security | TPM 2.0, FIPS 140-3, TCG certified, post-quantum cryptography, chassis intrusion detection, SED storage, Windows Hello facial recognition |
| Battery | 6-cell, 96Wh Long Life Cycle |
| Power | 165W USB-C AC adapter |
| Ports | Two Thunderbolt 5, one Thunderbolt 4, HDMI 2.1, headset, SD card slot |
| Operating System | Windows 11 Pro, Copilot+ PC |
| Chassis | Aluminum and magnesium, Magnetite |
| Systems Management | Intel vPro Enterprise |
| Certifications | ENERGY STAR, EPEAT Gold with Climate+, TCO Certified |
| Warranty | 36 months ProSupport Next Business Day Onsite Service after Remote Diagnosis |
| Price | $3,293 base / approximately $8,245 as shipped |
Build and Design
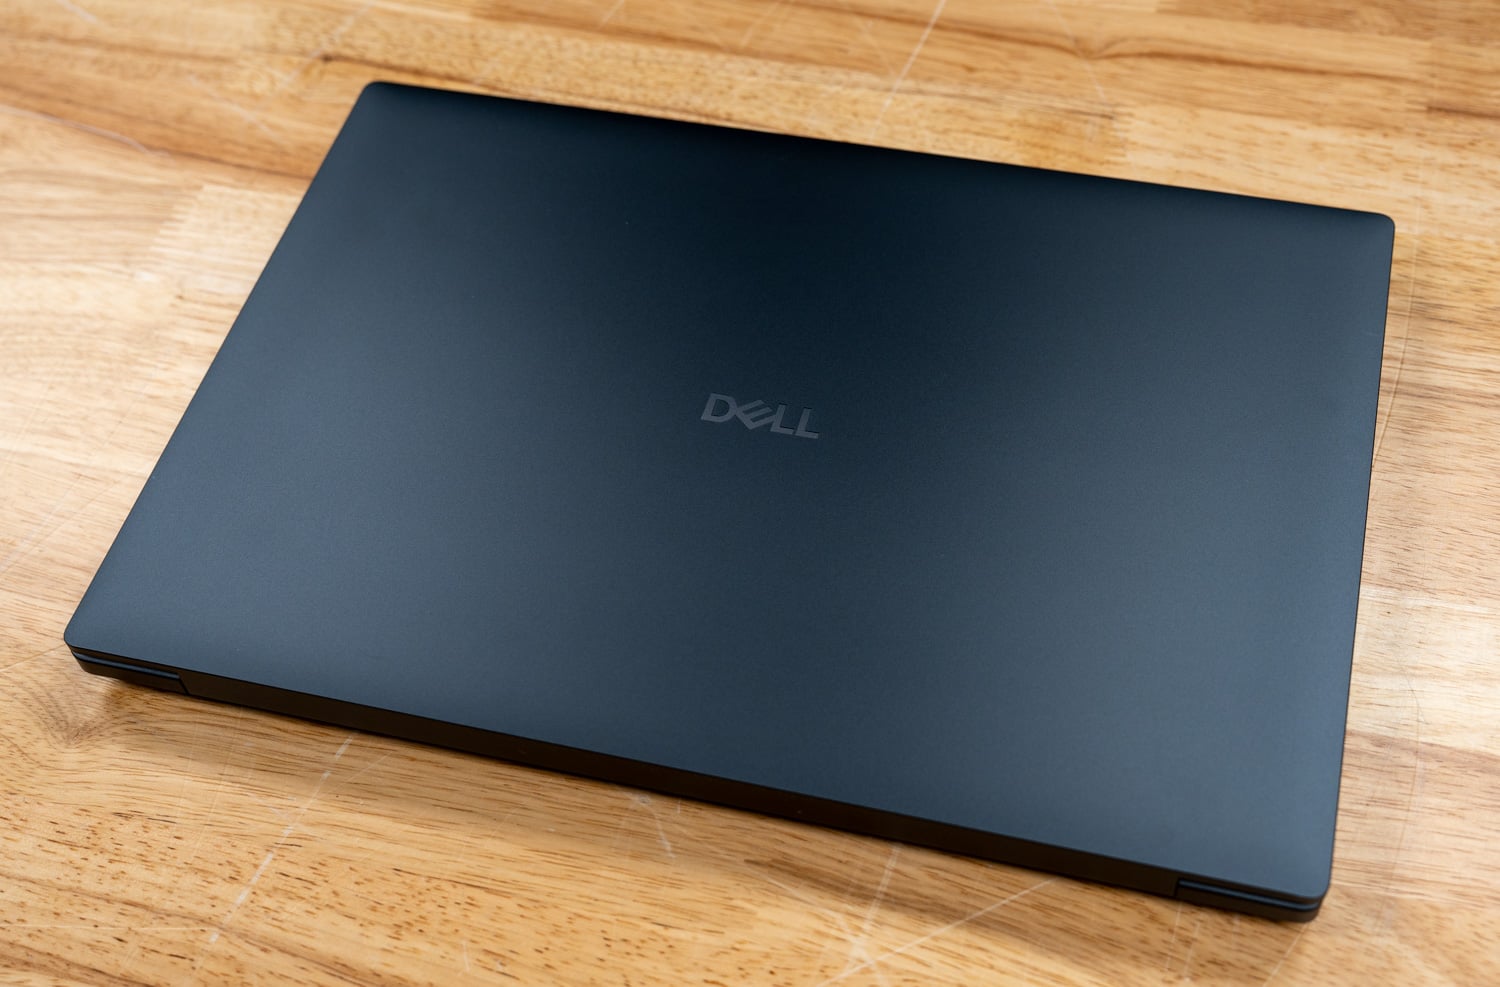
The Dell Pro Precision 7 16 has a noticeably more substantial design than the 5 Series models, featuring aluminum and magnesium construction with Dell’s dark Magnetite finish. Our configuration remains fairly portable for a 16-inch workstation with RTX PRO 3000 graphics and a 96Wh battery, with Dell listing a starting weight of 4.78 lb. The OLED configuration measures 13.93 x 9.46 inches and ranges from 0.80 to 0.83 inches thick. Next to the Pro Precision 5 16s, the differences are easy to see: the 7 16 drops the numeric keypad in favor of a centered keyboard, a large haptic trackpad, and speaker grilles running along both sides of the deck.
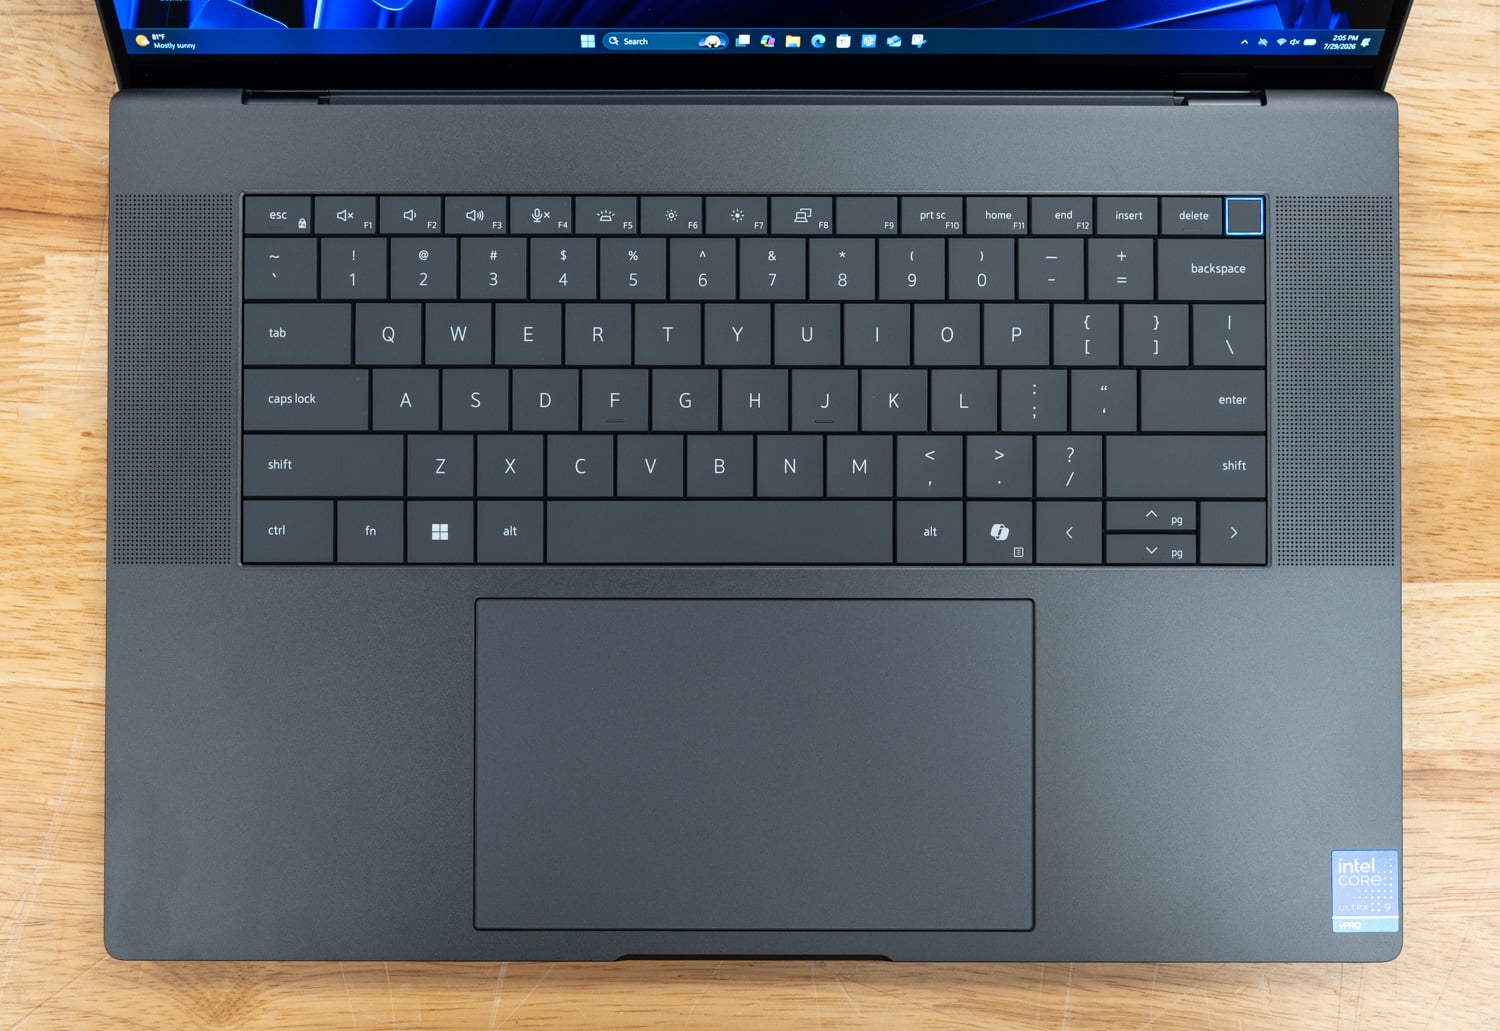 The keyboard uses Dell’s zero-lattice design with mini-LED backlighting, and the centered layout makes good use of the wider 16-inch chassis. Removing the numeric keypad gives the main keyboard and trackpad a more symmetrical position in front of the display, while the large speaker grilles fill the space along either side. Dell uses two 2.5W woofers and two 2.5W tweeters for a total peak output of 10W, a much larger audio configuration than the basic stereo setup in the 5 16s. The keyboard also includes the dedicated Copilot key used across Dell’s current commercial lineup.
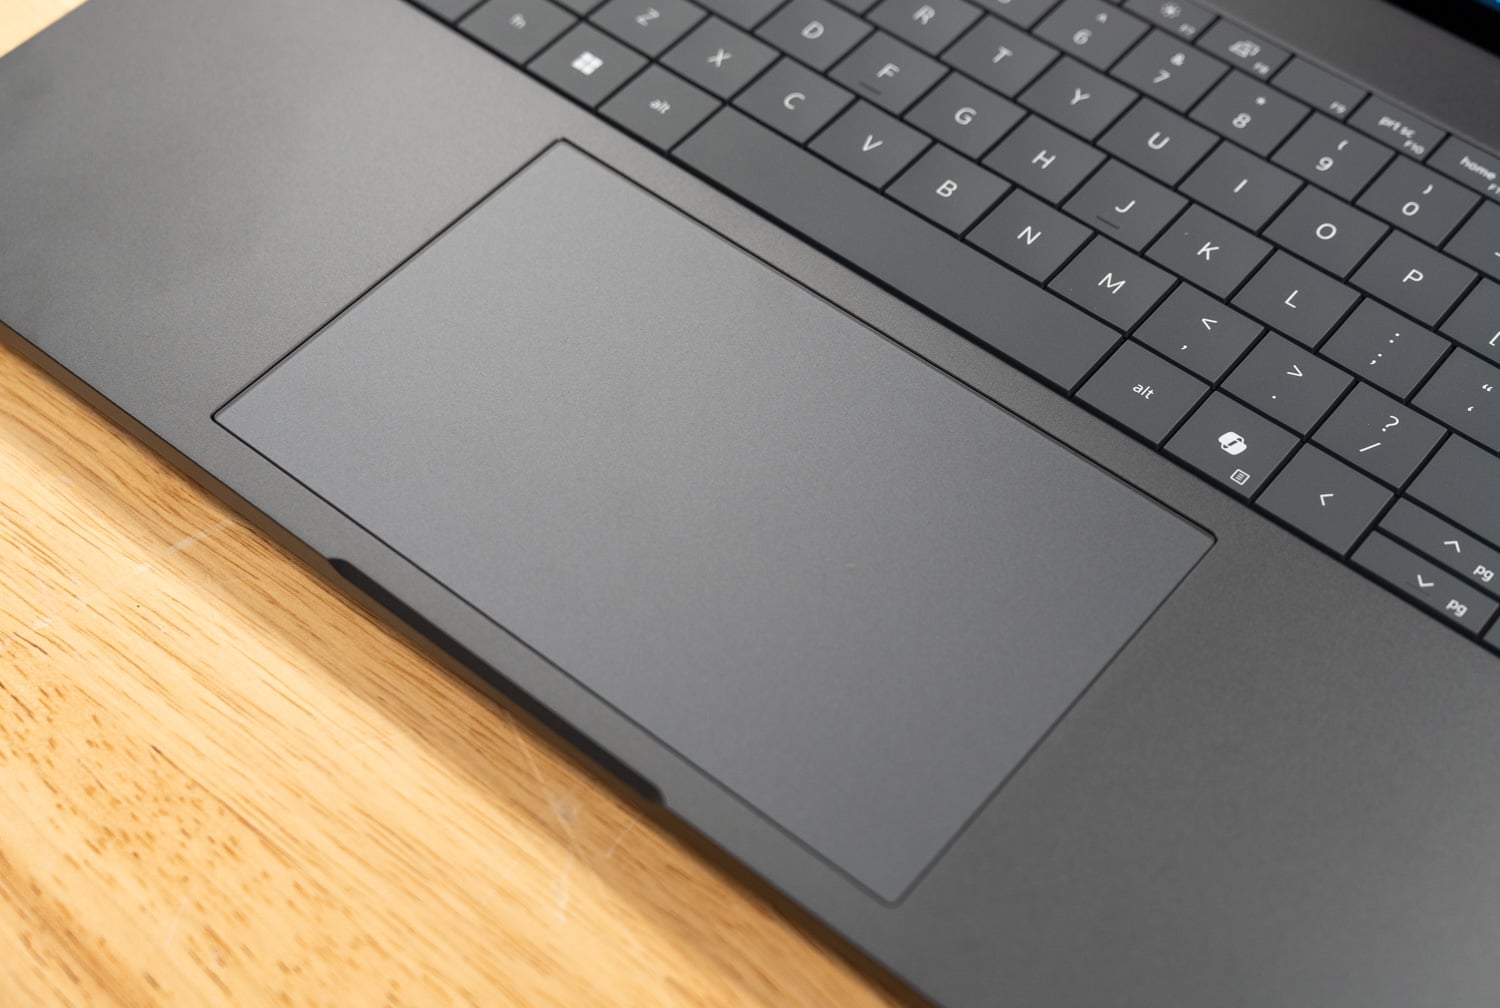 Below the keyboard is one of the Pro Precision 7 16’s more distinctive features: a large haptic trackpad that takes up a substantial portion of the palm rest. Instead of using the hinged mechanism found in a conventional trackpad, the click response is generated electronically, allowing the surface to provide a similar click response across a much larger area. Combined with the centered keyboard layout, it gives the 7 16 a noticeably different feel from the Pro Precision 5 systems we have been testing.
Dell equips the Precision 7 16 with an 8MP HDR RGB and IR camera above the display, with User Presence Detection and ExpressSign-In available for automatic Windows locking and sign-in behavior. The camera supports Windows Hello facial recognition and is paired with dual-array microphones, although this camera configuration does not include a physical privacy shutter.
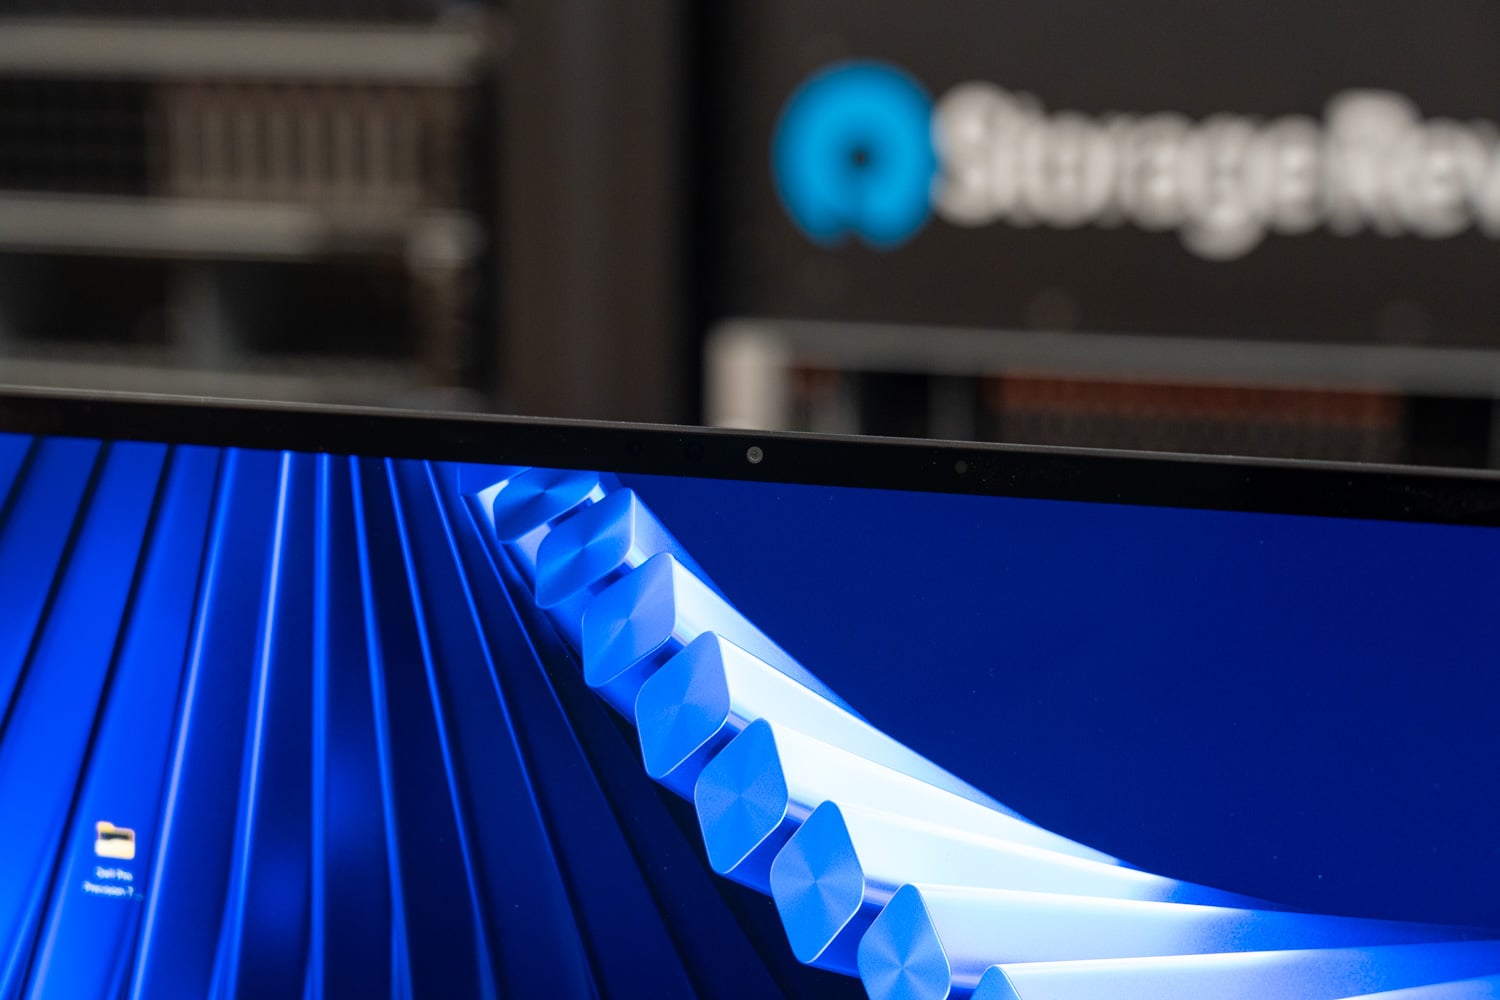 The 16-inch Tandem OLED display is a substantial upgrade over the IPS panels used in the Pro Precision 5 systems, particularly for creators and other users working with high-resolution visual content. Our configuration has a 3840 x 2400 resolution, 120Hz variable refresh rate, 500-nit brightness, 100% DCI-P3 coverage, anti-reflection treatment, and VESA DisplayHDR True Black 1000 certification. The combination of 4K-class resolution and a 16:10 aspect ratio gives applications a large working area, while the 120Hz refresh rate makes scrolling, window movement, and cursor motion noticeably smoother than on a conventional 60Hz workstation panel. OLED also delivers very deep blacks and strong contrast, which is useful when working with HDR media, photography, and other color-sensitive content.
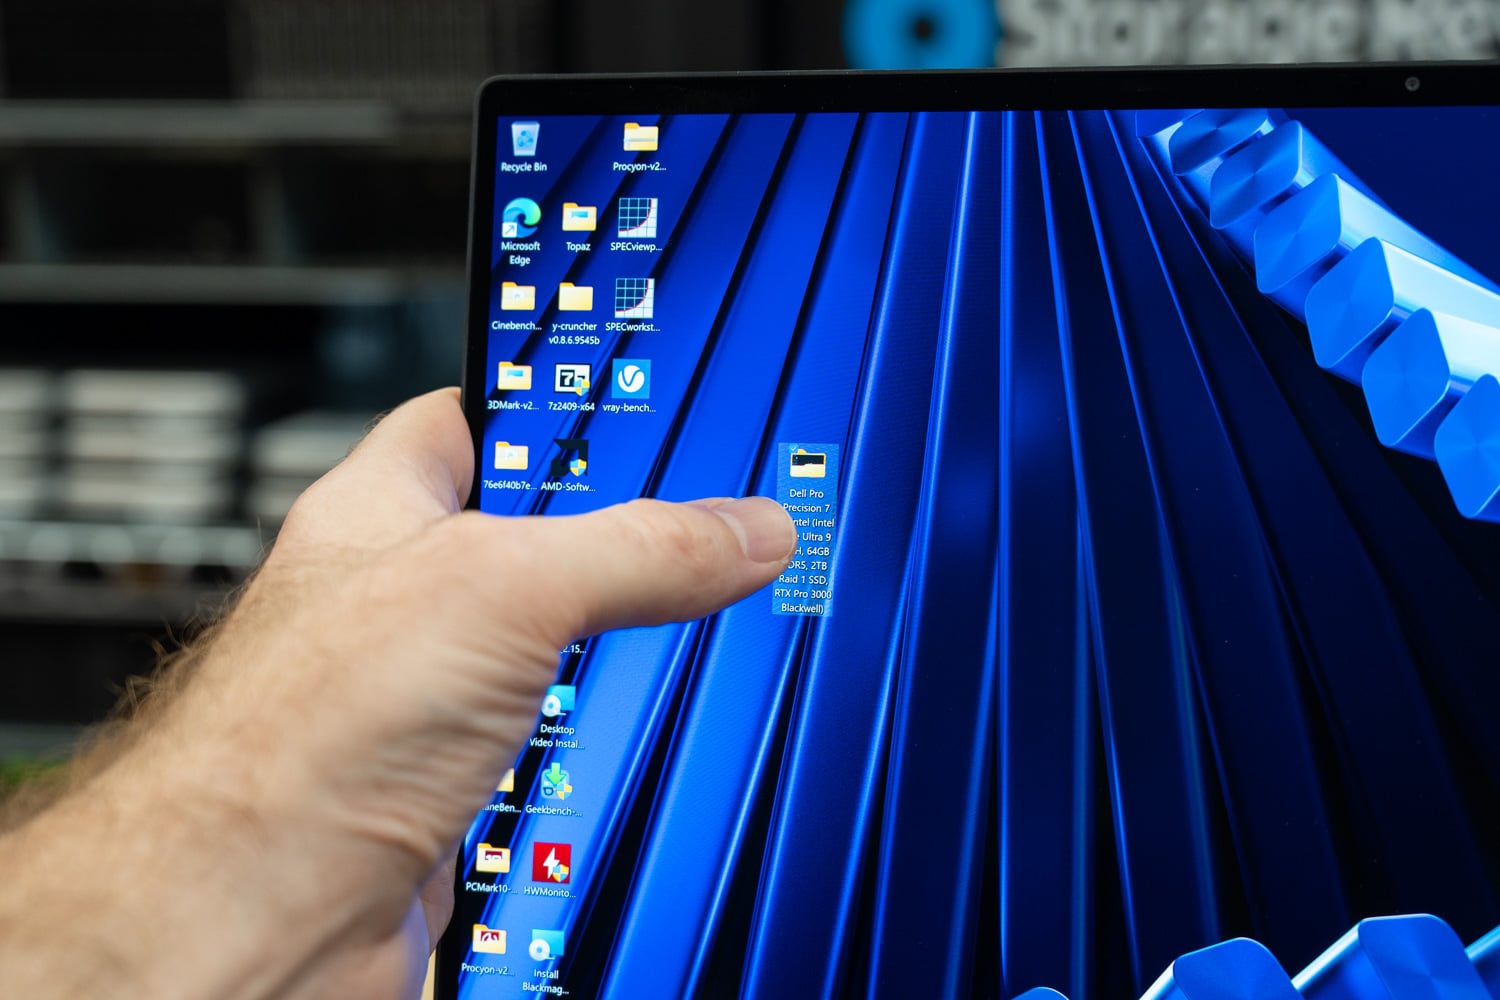 Our OLED configuration also supports touch, which works particularly well on a display this large for quick navigation, selecting items, or moving through visual content. The conventional clamshell hinge limits the system’s usefulness for extended pen-style input compared with a convertible, since the display cannot fold flat against the keyboard. For occasional direct interaction, however, having touch available on a 16-inch workstation panel is a useful addition, especially with the high-resolution OLED display.
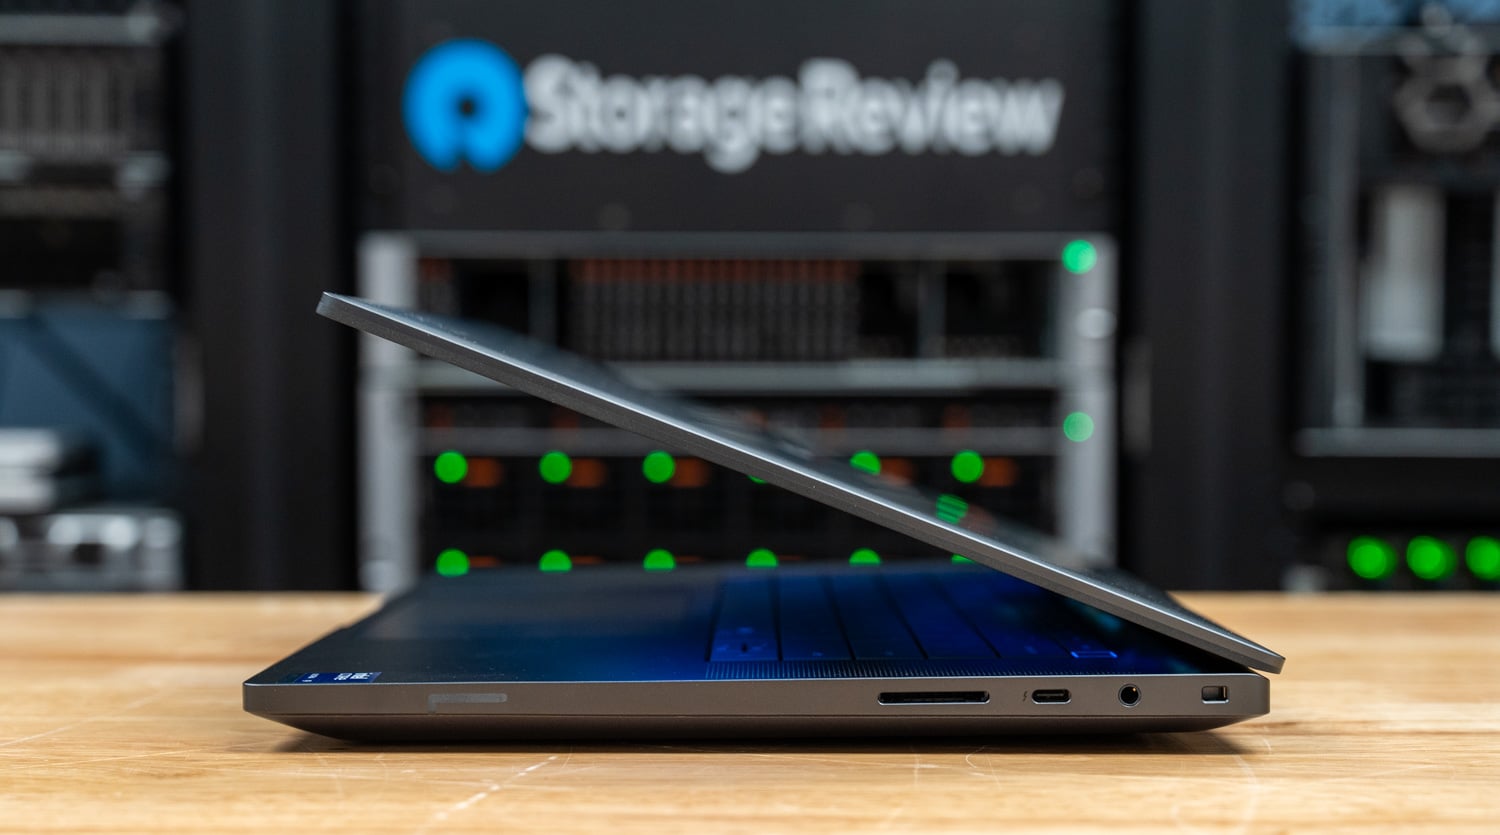 For I/O and connectivity, the right side has a full-size SD card slot, one Thunderbolt 4 USB-C port, the 3.5mm headset connection, and a wedge-shaped lock slot. Having two Thunderbolt 5 ports plus a third Thunderbolt 4 connection gives the 7 16 an unusually strong USB-C layout, although Dell leaves out both USB-A and built-in Ethernet. So, users working with older USB peripherals or wired networks will need an adapter or dock, which is an important difference from the Pro Precision 5 16s and its wider selection of legacy ports.
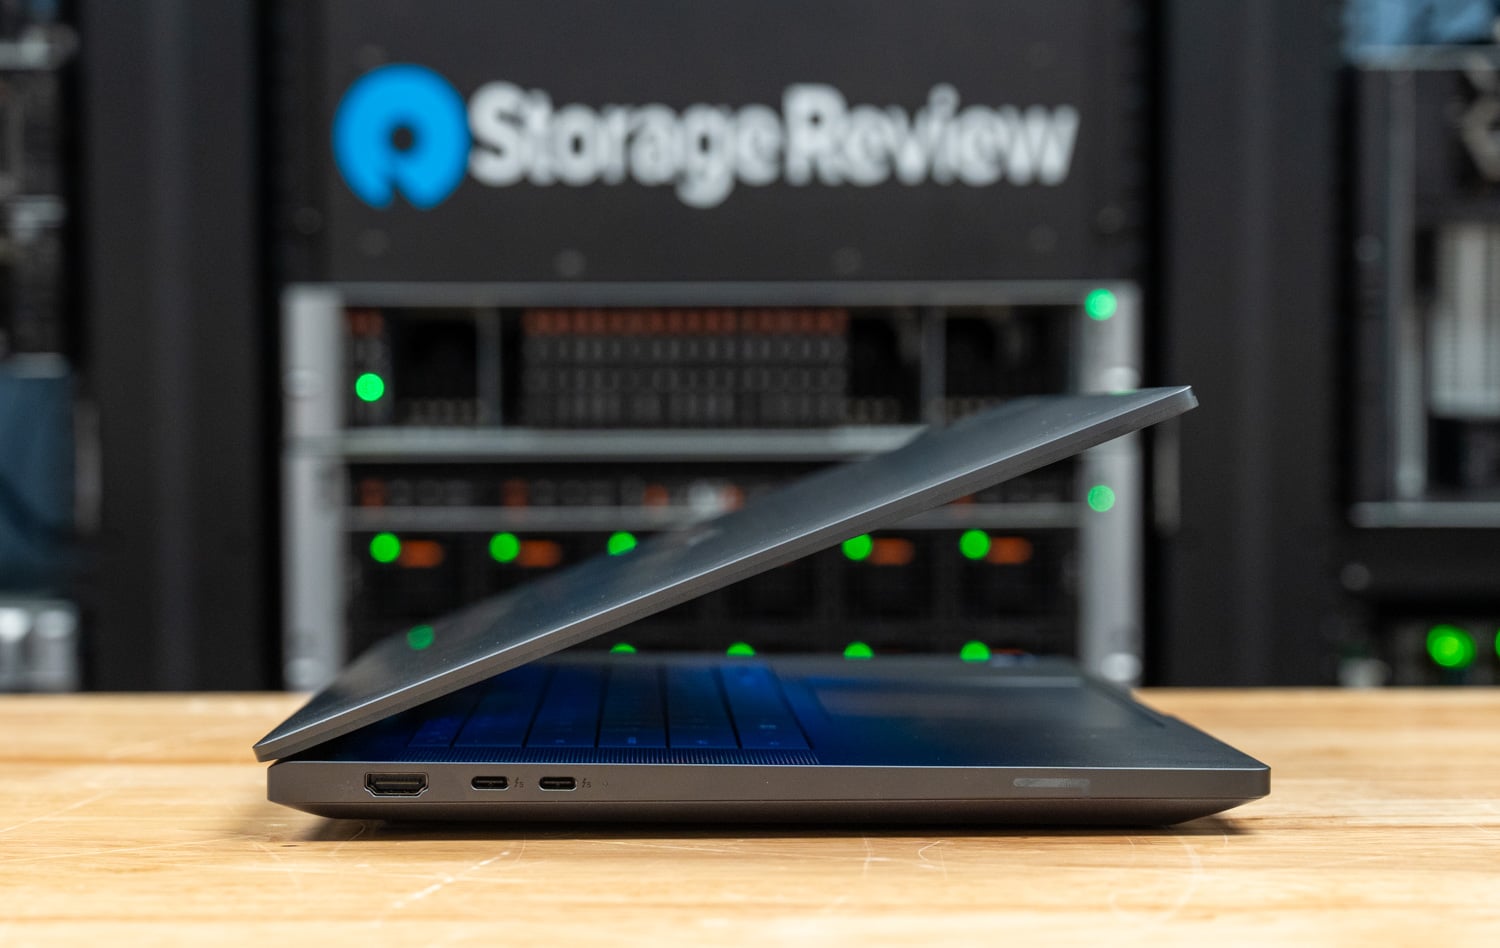 Moving over to the left side, you’ll see that connectivity is heavily centered on Thunderbolt, with HDMI 2.1 alongside two Thunderbolt 5 USB-C ports. Those Thunderbolt 5 connections support Power Delivery and DisplayPort 2.1, with bandwidth reaching up to 120 Gbps for supported devices, giving the 7 16 a lot more external I/O bandwidth for fast storage, docks, and high-resolution displays. The two ports are positioned beside the HDMI connection, keeping most desk-oriented display and docking cables together on the same side.
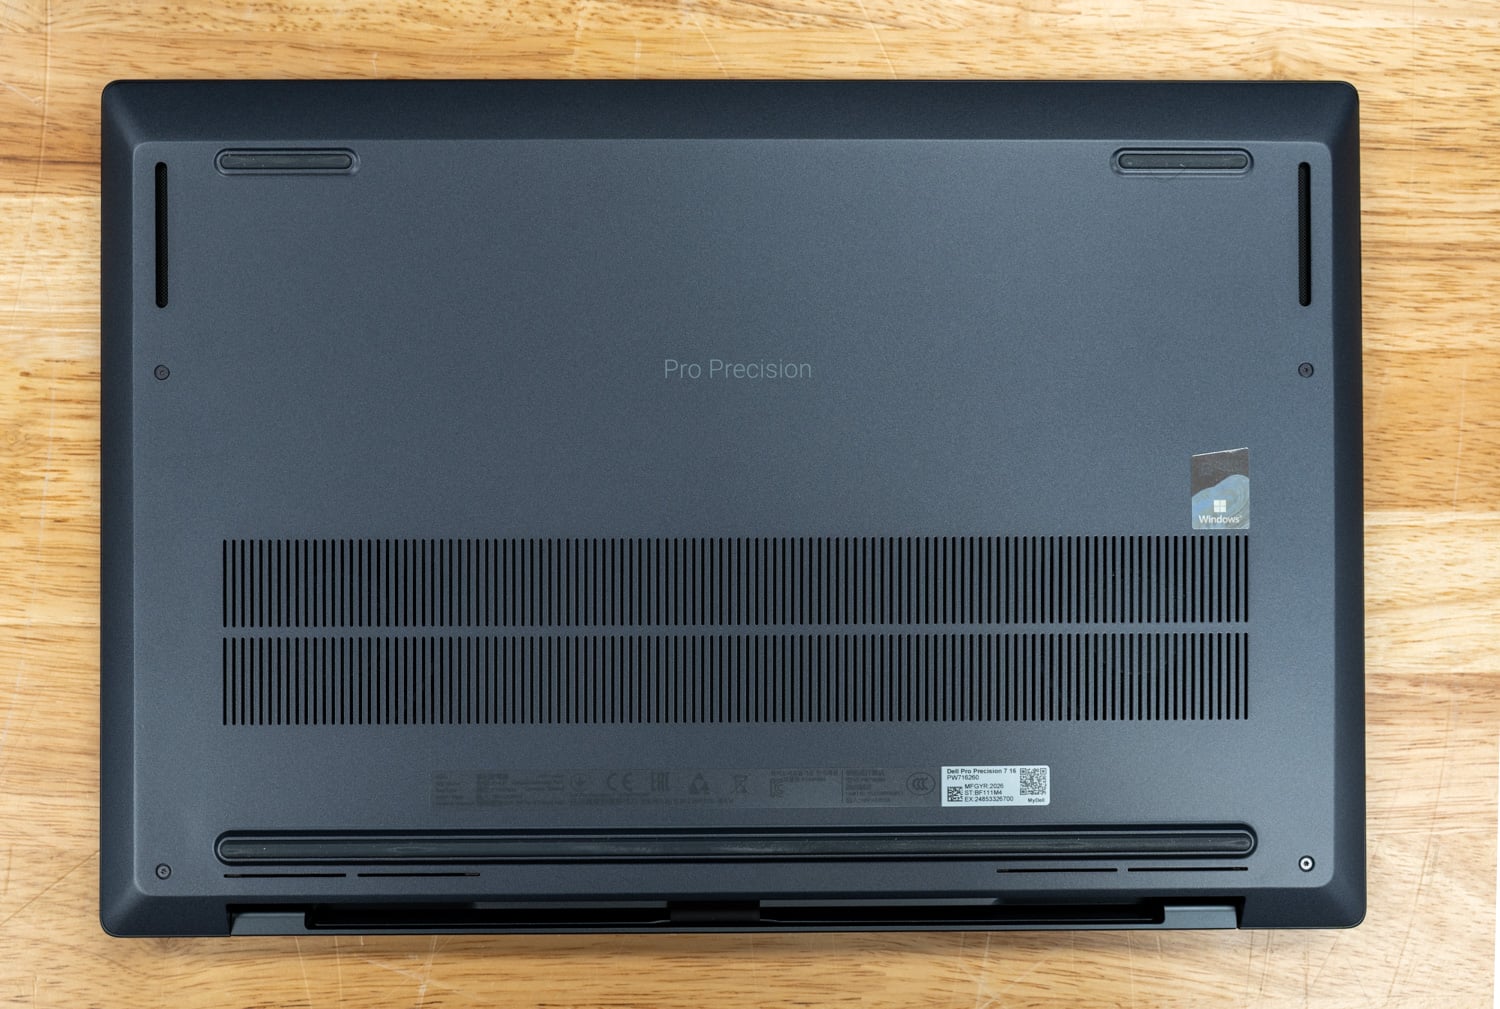
The underside of the Pro Precision 7 16 features a broad two-row intake grille that feeds the dual-fan cooling system directly above it. The long, narrow rubber feet maintain clearance beneath the chassis for airflow, while the rear edge provides additional space for the cooling system to exhaust heat behind the display. Dell keeps access to the internals relatively simple, with the entire bottom panel secured by just four T5 screws. Once those are removed, the cover can be released from the recesses near the hinges and lifted away.
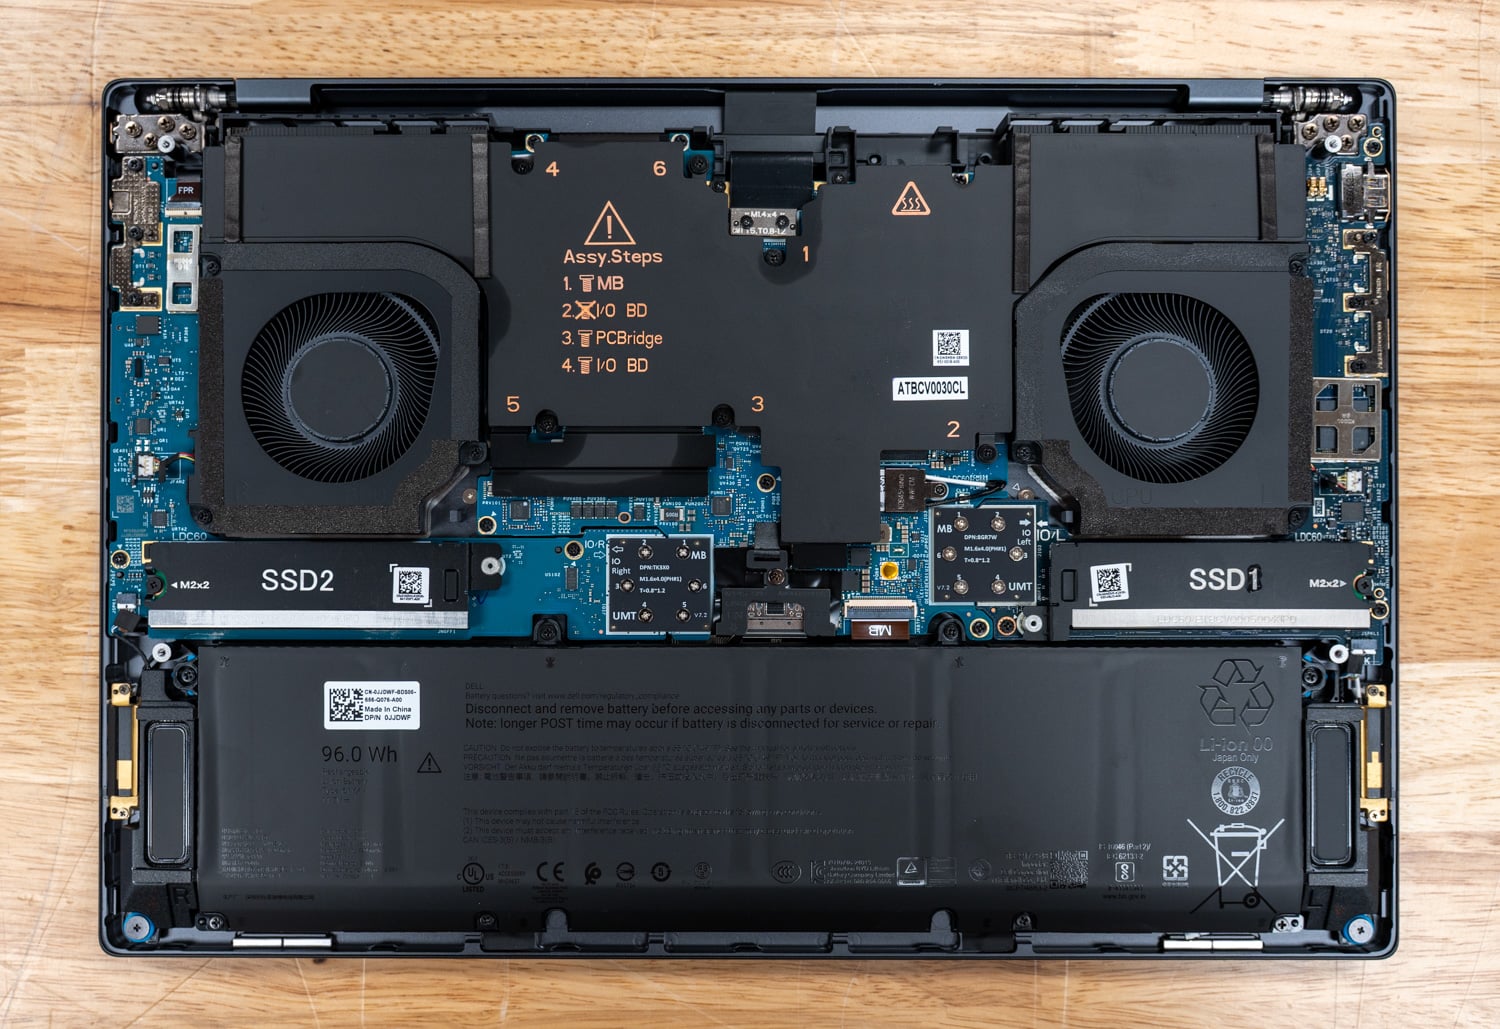 Here, there is direct access to the 96Wh battery, both SSD positions, and the dual-fan cooling system. Our configuration uses two 1TB Gen5 SSDs in RAID 0, with SSD1 and SSD2 in separate positions on opposite sides of the motherboard. Dell classifies the battery, SSDs, cooling fans, wireless card, and speaker assembly as customer-replaceable components, while hardware such as the heatsink, I/O boards, display assembly, touchpad, and keyboard assembly is intended for technician service. The 64GB of LPDDR5x memory is integrated into the system board, so the memory capacity must be selected when the system is ordered.
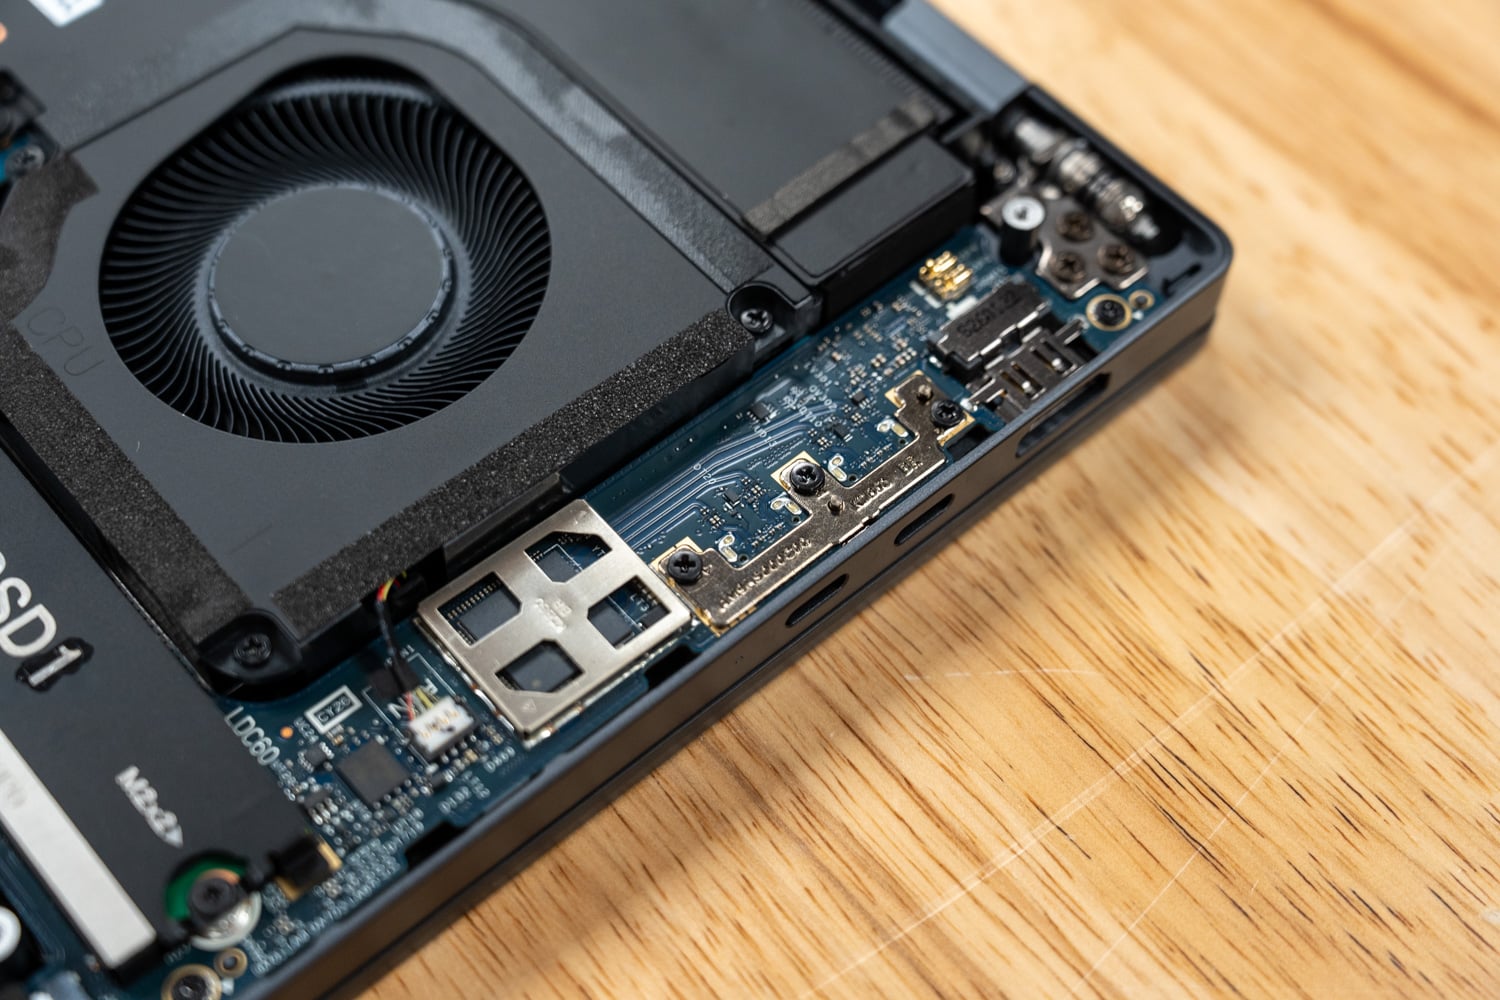 The Pro Precision 7 16 uses a much beefier cooling setup than the single-fan design in the 5 16s, which is appropriate given the RTX PRO 3000 and higher power demands. Two large fans fill the rear corners and work with a wide thermal assembly covering the CPU and GPU, with hot air exhausted out the back of the chassis. Both SSDs are positioned outside that central cooling area and have their own covers, so either drive is easy to reach once the bottom panel is off. The large 96Wh battery takes up most of the lower half, but Dell still leaves the storage, cooling system, and other serviceable components easily accessible.
Dell Pro Precision 7 16 Performance
Our review unit runs the Core Ultra 9 386H with NVIDIA RTX PRO 3000 Blackwell graphics, 64GB of LPDDR5x at 8533 MT/s, and two 1TB Gen5 SSDs in RAID 0 on Windows 11 Pro, with benchmarks tested on the Best Performance power mode. For battery life testing, we configure systems into Balanced power mode and set the screen brightness to 50%.
For comparables, we included the Dell Pro Precision 5 16s Intel (Core Ultra X9 388H, Arc Pro B390, 64GB), the Dell Pro Precision 5 16s AMD (Ryzen AI 9 HX PRO 475, Radeon 890M, 64GB), and the Lenovo ThinkPad P14s Gen 7 (Core Ultra 7 366H, RTX PRO 1000, 64GB) as the external workstation reference.
PCMark 10
PCMark 10 measures general system performance across everyday work such as web browsing, video conferencing, spreadsheets, writing, photo editing, and rendering. The overall score is supported by the Essentials, Productivity, and Digital Content Creation subscores, which indicate where a system’s strengths lie. Higher scores are better.
| PCMark 10 | Dell Pro Precision 7 16 | Dell Pro Precision 5 16s Intel | Dell Pro Precision 5 16s AMD | Lenovo ThinkPad P14s Gen 7 |
| Overall Score | 8,901 | 9,994 | 8,627 | 9,083 |
| Essentials | 9,671 | 12,106 | 10,744 | 10,686 |
| Productivity | 16,381 | 15,505 | 14,574 | 16,501 |
| Digital Content Creation | 12,081 | 14,433 | 11,127 | 11,534 |
PCMark 10 was one of the weaker results for the Pro Precision 7 16, with an overall score of 8,901, trailing both the 5 16s Intel and the ThinkPad P14s Gen 7. Essentials came in at 9,671, the lowest result of the four systems, while Productivity was much closer at 16,381 compared with 16,501 for the ThinkPad. These general productivity workloads do not take full advantage of the RTX PRO 3000, which becomes much more important in the GPU-focused tests later on.
PCMark 10 Modern Office Battery
The PCMark 10 Modern Office battery test repeatedly runs common office tasks until the battery reaches the test’s cutoff point, in Balanced mode at 50% display brightness. This is a rundown of the whole system rather than a synthetic idle drain, so it tracks closely with what a full day of productivity work does to the battery. Longer runtimes are better.
| Modern Office Battery | Dell Pro Precision 7 16 | Dell Pro Precision 5 16s Intel | Dell Pro Precision 5 16s AMD | Lenovo ThinkPad P14s Gen 7 |
| Runtime (higher is better) | 11 hours 43 minutes | 24 hours 43 minutes | 15 hours 5 minutes | 15 hours 52 minutes |
This is the bill for the configuration. Eleven hours and 43 minutes is the shortest run of any Pro Precision we have tested, less than half the 24 hours and 43 minutes the 5 16s Intel manages, and that is with a 96Wh pack against the 5 series 70Wh. A discrete GPU, a 4K OLED at 120Hz, and two Gen5 drives all draw power from the same battery. It still clears a working day, but all-day-and-then-some belongs to the 5 series.
Geekbench 6
Geekbench 6 measures processor performance using a mix of common tasks, with separate scores for single-core and multi-core workloads, plus GPU compute scores through OpenCL and Vulkan. Higher scores are better. Our review unit’s CPU run was flagged as invalid by the benchmark’s tamper detection. We reviewed it and treated the flag as a false positive, so the scores are included below.
| Geekbench 6 | Dell Pro Precision 7 16 (RTX PRO 3000) | Dell Pro Precision 5 16s Intel (Arc Pro B390) | Dell Pro Precision 5 16s AMD (Radeon 890M) | Lenovo ThinkPad P14s Gen 7 (RTX PRO 1000) |
| CPU Single-Core | 2,915 | 2,969 | 2,854 | 2,808 |
| CPU Multi-Core | 17,280 | 17,401 | 14,169 | 16,319 |
| GPU OpenCL | 131,492 | 57,998 | 37,520 | 87,537 |
| GPU Vulkan | 104,344 | 63,015 | 53,969 | 73,204 |
The two Intel Precisions are effectively tied on CPU, with the 5 16s Intel a fraction ahead at 2,969 and 17,401 against 2,915 and 17,280. Everything that separates them is on the GPU side, where the RTX PRO 3000 returns 131,492 in OpenCL, 2.3 times the Arc Pro B390 and 50% clear of the RTX PRO 1000 in the ThinkPad.
Geekbench 7
Geekbench 7 joins the suite alongside Geekbench 6 as comparison data builds. Its CPU scores are calibrated against a baseline of 2,500, set by the AMD Ryzen 7700, while GPU scores are calibrated against a baseline of 100,000, set by the NVIDIA GeForce RTX 4060. Higher scores are better, and double the score indicates double the performance. Because Geekbench 7 uses new workloads and new baselines, its scores are not comparable to Geekbench 6 results.
| Geekbench 7 | Dell Pro Precision 7 16 (RTX PRO 3000) | Dell Pro Precision 5 16s Intel (Arc Pro B390) | Dell Pro Precision 5 16s AMD (Radeon 890M) | Lenovo ThinkPad P14s Gen 7 (RTX PRO 1000) |
| CPU Single-Core | 2,652 | 2,733 | 2,659 | 2,533 |
| CPU Multi-Core | 18,648 | 18,965 | 16,641 | 17,651 |
| GPU OpenCL | 96,919 | 54,247 | 31,874 | 75,340 |
| GPU Vulkan | 104,229 | 47,436 | * | 70,067 |
| GPU CUDA | 174,559 | N/A | N/A | 114,469 |
Geekbench 7 repeats the pattern. The 386H trails its own 5 16s sibling slightly on both CPU metrics, then leads every GPU metric, topping out at 174,559 in CUDA against 114,469 for the RTX PRO 1000. Neither integrated system can run CUDA at all, which is the practical argument for the card.
Cinebench 2026
Cinebench 2026 is the current release in the Cinebench line and the only version we report. It tests CPU and GPU performance using Maxon’s Redshift render engine. It is built on the latest Cinema 4D 2026 code and is designed to show whether a machine is stable under high CPU load, whether a notebook’s cooling can sustain longer render tasks, and how it handles demanding real-world 3D work. Because code and compiler changes accelerated scene rendering, Cinebench 2026 scores use an adjusted range and should not be compared to scores from previous Cinebench versions. Its GPU test supports current NVIDIA and AMD hardware but does not yet run on Intel integrated graphics, and our review unit’s CPU results were confirmed by a repeat run.
| Cinebench 2026 | Dell Pro Precision 7 16 | Dell Pro Precision 5 16s Intel | Dell Pro Precision 5 16s AMD | Lenovo ThinkPad P14s Gen 7 |
| CPU Single Thread | 518 | 535 | 471 | 502 |
| CPU Multiple Threads | 3,873 | 4,618 | 4,767 | 4,492 |
| GPU | 51,517 | N/A | 5,667 | 34,437 |
The GPU result is the headline here: 51,517 for the Radeon 890M versus 5,667, with the Arc Pro B390 unable to run the test. The CPU side is less flattering. Single thread at 518 sits mid-pack, and the multi-thread 3,873 is the lowest of the four, 16% behind the 5 16s Intel on a comparable 16-core, 16-thread part. We repeated the run and reproduced the same figure.
7-Zip Compression
The built-in 7-Zip benchmark measures how quickly the processor can compress and decompress data using multiple threads, run with a 128MB dictionary across ten passes. Decompression tends to scale with thread count while compression leans on memory latency, so the two halves often tell different stories. Higher GIPS scores are better.
| 7-Zip 24.09 (GIPS) | Dell Pro Precision 7 16 | Dell Pro Precision 5 16s Intel | Dell Pro Precision 5 16s AMD | Lenovo ThinkPad P14s Gen 7 |
| Compressing | 96.202 | 96.281 | 85.627 | 90.364 |
| Decompressing | 95.896 | 97.246 | 117.863 | 90.526 |
| Total Rating | 96.049 | 96.764 | 101.745 | 90.445 |
Compression was essentially tied between the two Intel Precisions, with the 7 16 scoring 96.202 GIPS compared with 96.281 GIPS from the 5 16s Intel. Decompression favors the 24-thread AMD system, which reached 117.863 GIPS and finished with the highest total rating at 101.745. The 7 16 placed second overall at 96.049, ahead of the ThinkPad but behind both the 5 16s Intel and AMD systems in total performance.
y-cruncher
y-cruncher measures how quickly the processor can calculate large numbers of digits of Pi, placing a heavy load on the CPU and memory subsystem. At the same time, the BBP runs to extract hexadecimal digits of Pi. Results are in seconds, so lower times are better. The AMD unit could not complete the 5-billion- and 10-billion-digit runs because its memory reservation for the integrated GPU reduces the available pool below the amount required for those sizes.
| y-cruncher (seconds, lower is better) | Dell Pro Precision 7 16 | Dell Pro Precision 5 16s Intel | Dell Pro Precision 5 16s AMD | Lenovo ThinkPad P14s Gen 7 |
| Pi 1B | 31.557 | 26.422 | 22.840 | 26.685 |
| Pi 2.5B | 101.524 | 80.463 | 64.242 | 76.787 |
| Pi 5B | 226.255 | 183.822 | N/A | 172.994 |
| Pi 10B | 500.875 | 407.658 | N/A | 392.083 |
| Pi BBP 1B | 1.639 | 1.635 | 1.100 | 1.621 |
| Pi BBP 10B | 21.512 | 19.036 | 12.277 | 18.200 |
| Pi BBP 100B | 291.628 | 234.797 | 140.284 | 219.969 |
y-cruncher is the clearest CPU loss in the review. The 7 16 is the slowest of the four on every computation, taking 500.875 seconds at Pi 10B, compared with 392.083 for the ThinkPad and 407.658 for the 5 16s Intel, and the BBP runs repeat it exactly. There is no GPU component here, so the discrete card contributes nothing, and the sustained-clock behavior is left exposed.
Blender
The Blender benchmark measures rendering performance using three different 3D scenes: Monster, Junkshop, and Classroom. Results are reported in samples per minute, so higher scores are better. We test on both the CPU and GPU. Scores are not comparable across Blender versions, so we have trimmed the older releases from the suite and report the current Blender 5.2 results here. The GPU figures represent each system’s fastest renderer: the discrete card on the two NVIDIA systems and the integrated GPU on the 5 16s pair.
| Blender 5.2 (samples/min) | Dell Pro Precision 7 16 (RTX PRO 3000) | Dell Pro Precision 5 16s Intel (Arc Pro B390) | Dell Pro Precision 5 16s AMD (Radeon 890M) | Lenovo ThinkPad P14s Gen 7 (RTX PRO 1000) |
| GPU | ||||
| Monster | 1,555.53 | 572.84 | 123.00 | 922.95 |
| Junkshop | 1,257.01 | 468.85 | 101.21 | 795.65 |
| Classroom | 1,000.62 | 420.48 | 82.84 | 625.62 |
| CPU | ||||
| Monster | 137.49 | 138.88 | 130.86 | 131.08 |
| Junkshop | 101.34 | 94.97 | 99.74 | 97.76 |
| Classroom | 69.26 | 65.39 | 74.18 | 68.45 |
This is what the card is for. The RTX PRO 3000 renders Monster at 1,555.53 samples per minute, 2.7 times the Arc Pro B390 and 69% ahead of the RTX PRO 1000, and the margin holds across Junkshop and Classroom. CPU rendering is a different picture, with all four within a few percent of each other; the 7 16 takes Junkshop at 101.34 and loses to the 24-thread AMD part in Classroom.
LuxMark
LuxMark measures GPU compute performance by rendering complex scenes through OpenCL, based on LuxCoreRender. We run the Food and Hall scenes on all available OpenCL devices in each system, so single-GPU systems are scored on that GPU while the dual-GPU systems render on the discrete and integrated GPUs together, as noted in the column headers. Higher scores are better.
| LuxMark v4 | Dell Pro Precision 7 16 (RTX PRO 3000 + iGPU) | Dell Pro Precision 5 16s Intel (Arc Pro B390) | Dell Pro Precision 5 16s AMD (Radeon 890M) | Lenovo ThinkPad P14s Gen 7 (RTX PRO 1000 + iGPU) |
| Hall | 19,300 | 3,505 | 2,058 | 11,342 |
| Food | 7,624 | 1,713 | 1,034 | 4,103 |
LuxMark scales the same way. Hall at 19,300 is 5.5 times the Arc Pro B390 and 70% ahead of the ThinkPad, and Food widens that to 4.5 times and 86%. These are the margins that justify the chassis for anyone running OpenCL renderers.
V-Ray
Chaos V-Ray measures ray-traced rendering throughput, reported in vpaths, where higher is better. We run the CUDA-compatible engine on every system so results remain comparable to notebooks with only integrated graphics; on systems without a discrete GPU, that path executes on the integrated graphics, even though V-Ray reports the processor name in its device field. On dedicated NVIDIA hardware, we also capture V-Ray’s RTX engine, which engages the card’s ray tracing cores and is reported separately.
| V-Ray GPU (vpaths) | Dell Pro Precision 7 16 (RTX PRO 3000) | Dell Pro Precision 5 16s Intel (Arc Pro B390) | Dell Pro Precision 5 16s AMD (Radeon 890M) | Lenovo ThinkPad P14s Gen 7 (RTX PRO 1000) |
| CUDA Engine | 2,469 | 946 | 1,039 | 1,568 |
| RTX Engine | 3,891 | N/A | N/A | 2,589 |
V-Ray shows a significant advantage for the two systems with dedicated NVIDIA graphics, especially when the RTX engine is used. The Pro Precision 7 16 reached 3,891 vpaths in the RTX test, compared with 2,589 for the RTX PRO 1000, while its CUDA result of 2,469 was 57% higher than that of the ThinkPad. The integrated systems can use only the CUDA path here, with both finishing at less than half of the 7 16’s score.
3DMark CPU Profile
The 3DMark CPU Profile benchmark measures CPU performance at fixed thread counts, from a single thread up to the maximum available, showing how performance scales as more cores are engaged. Higher scores are better.
| 3DMark CPU Profile | Dell Pro Precision 7 16 | Dell Pro Precision 5 16s Intel | Dell Pro Precision 5 16s AMD | Lenovo ThinkPad P14s Gen 7 |
| Max Threads | 10,557 | 10,748 | 9,267 | 10,500 |
| 8 Threads | 5,996 | 6,818 | 6,573 | 6,550 |
| 4 Threads | 4,261 | 4,483 | 4,238 | 4,219 |
| 1 Thread | 1,185 | 1,210 | 1,178 | 1,165 |
The three Intel systems finish within about 2% of each other at max threads, with the 7 16 second at 10,557. The eight-thread result is the outlier, with 5,996 the lowest in the group by a clear margin, even behind the ThinkPad. Single-thread is a four-way tie inside 4%.
3DMark Storage and Blackmagic Disk Speed Test
3DMark Storage measures how an SSD performs during gaming-related tasks such as loading games, installing software, saving progress, and moving game files. Blackmagic Disk Speed Test measures an SSD’s sequential read and write speeds using large media files. Higher is better in both.
| Storage | Dell Pro Precision 7 16 | Dell Pro Precision 5 16s Intel | Dell Pro Precision 5 16s AMD | Lenovo ThinkPad P14s Gen 7 |
| 3DMark Storage | 2,189 | 2,804 | 2,325 | 3,094 |
| Blackmagic Write (MB/s) | 7,387.8 | 7,660.2 | 5,070.5 | 8,262.3 |
| Blackmagic Read (MB/s) | 6,776.2 | 8,418.1 | 5,071.2 | 8,511.5 |
On paper, the RAID 0 array does not deliver what the configuration implies. 3DMark Storage returns 2,189, the lowest of the four comparison systems and well behind the ThinkPad’s single drive at 3,094, and SPECworkstation independently puts Storage at 1.30, second lowest. The sequential numbers are healthier in absolute terms, with Blackmagic writes of 7,387.8 MB/s and reads of 6,776.2 MB/s, though both still trail the single-drive 5 16s Intel and ThinkPad. Those results are consistent with how striping behaves rather than a sign of a faulty array. Lightly threaded storage tests split a single queue across two drives, which adds overhead without adding parallelism, and RAID 0’s benefits only appear as demand climbs. We verified that the array is configured and performing as intended.
As always, we tested the system as it shipped, and this one shipped in RAID 0, which is a somewhat unusual factory choice. Buyers are not locked into it. The two Gen5 drives can be split into separate OS and data volumes, mirrored in RAID 1 for redundancy, or simply run as independent drives, and several of those layouts may net better storage performance in scenarios like the ones tested here. The catch is that moving away from the factory RAID 0 means reinstalling the operating system, so the storage layout is worth deciding at deployment time rather than after the machine is in service.
Blackmagic RAW Speed Test
The Blackmagic RAW Speed Test measures how many frames per second a system can decode Blackmagic RAW video on the CPU and on the GPU. We quote the 8K results at 12:1 compression, and higher is better.
| Blackmagic RAW Speed Test | Dell Pro Precision 7 16 (RTX PRO 3000) | Dell Pro Precision 5 16s Intel (Arc Pro B390) | Dell Pro Precision 5 16s AMD (Radeon 890M) | Lenovo ThinkPad P14s Gen 7 (RTX PRO 1000) |
| 8K 12:1 CPU (fps) | 77 | 77 | 74 | 77 |
| 8K 12:1 GPU (fps) | 137 | 87 | 49 | 96 |
CPU decode is identical across the three Intel systems at 77fps. The GPU path is where the card shows up, reaching 137fps, 57% ahead of the Arc Pro B390 and 43% ahead of the RTX PRO 1000.
Topaz Video AI
The Topaz Video AI benchmark measures AI video upscaling and frame-interpolation performance in frames per second across the application’s enhancement models, run here at 1080p input, where higher is better. The 16X Slowmo Aion model failed to complete on our review unit and on the 5 16s Intel, while the 5 16s AMD ran it without issue.
| Topaz Video AI (fps) | Dell Pro Precision 7 16 (RTX PRO 3000) | Dell Pro Precision 5 16s Intel (Arc Pro B390) | Dell Pro Precision 5 16s AMD (Radeon 890M) | Lenovo ThinkPad P14s Gen 7 (RTX PRO 1000) |
| Artemis 1X / 2X / 4X | 12.38 / 8.94 / 3.15 | 6.24 / 5.21 / 1.90 | 3.72 / 2.21 / 0.78 | 5.17 / 3.19 / 1.12 |
| Iris 1X / 2X / 4X | 13.06 / 7.49 / 2.32 | 5.29 / 3.19 / 0.96 | 4.91 / 2.72 / 0.92 | 5.91 / 3.12 / 1.01 |
| Proteus 1X / 2X / 4X | 12.06 / 8.60 / 2.66 | 6.45 / 6.09 / 2.47 | 3.99 / 2.70 / 1.18 | 4.78 / 3.14 / 1.05 |
| Gaia 1X / 2X / 4X | 3.73 / 2.66 / 2.02 | 3.30 / 2.26 / 1.51 | 1.87 / 1.34 / 0.96 | 1.62 / 1.13 / 0.79 |
| Nyx 1X / 2X | 3.59 / 3.08 | 1.56 / 1.57 | 1.87 / 1.53 | 2.40 / 2.09 |
| Hyperion HDR 1X | 15.58 | 3.23 | 11.48 | 14.56 |
| 4X Slowmo Apollo / APFast | 18.04 / 30.60 | 8.48 / 22.00 | 6.08 / 17.59 | 10.39 / 29.94 |
| 16X Slowmo Aion | DNF | DNF | 9.05 | N/A |
The 7 16 leads every model it completed, roughly doubling the 5 16s Intel on Artemis and Iris and better than doubling the ThinkPad. The one gap in the row is the 16X Slowmo Aion model, which did not finish (the same failure we recorded on the 5 16s Intel).
UL Procyon AI Text Generation
The Procyon AI Text Generation Benchmark streamlines LLM performance testing by providing a concise, consistent evaluation method. It enables repeated testing across four local models (Phi, Mistral, Llama3, and Llama2) while minimizing the complexity of large models and the number of variables. Developed with AI hardware leaders, it optimizes the use of local AI accelerators to deliver more reliable, efficient performance assessments. All four systems ran the models through ONNX Runtime with DirectML on their GPUs.
| Procyon AI Text Generation | Dell Pro Precision 7 16 (RTX PRO 3000) | Dell Pro Precision 5 16s Intel (Arc Pro B390) | Dell Pro Precision 5 16s AMD (Radeon 890M) | Lenovo ThinkPad P14s Gen 7 (RTX PRO 1000) |
| Phi | 2,244 | 893 | 434 | 1,618 |
| Mistral | 2,062 | 646 | 403 | 1,397 |
| Llama3 | 1,859 | 669 | 357 | 1,252 |
| Llama2 | 1,990 | 750 | 390 | DNF |
Local LLM inference is the widest AI margin in the review. The 7 16 leads every model, 2,244 on Phi against 893 for the Arc Pro B390, and it still holds a 39% lead over the ThinkPad on the same test. The ThinkPad did not complete Llama2.
UL Procyon AI Computer Vision
The Procyon AI Computer Vision Benchmark measures AI inference performance across CPUs, GPUs, and dedicated accelerators using a range of neural networks, evaluating tasks such as image classification, object detection, segmentation, and super-resolution with models including MobileNet V3, Inception V4, YOLO V3, DeepLab V3, Real ESRGAN, and ResNet 50. The WinML runs use float32 on CPU and GPU, giving a like-for-like view across vendors. We also run the newer Computer Vision 2 suite through each vendor’s native path: OpenVINO in int8 on the Intel NPUs and fp16 on their iGPUs, TensorRT in fp16 on the RTX PRO 3000, and Ryzen AI on the AMD NPU; those results are listed separately since precision and runtime differ by platform. Higher scores are better.
| Procyon AI Computer Vision (WinML) | Dell Pro Precision 7 16 | Dell Pro Precision 5 16s Intel | Dell Pro Precision 5 16s AMD | Lenovo ThinkPad P14s Gen 7 |
| CPU | 122 | 143 | 114 | 134 |
| GPU | 553 | 410 | 245 | 426 |
| Procyon AI Computer Vision 2 (native runtimes) | Dell Pro Precision 7 16 | Dell Pro Precision 5 16s Intel | Dell Pro Precision 5 16s AMD |
| NPU (int8) | 1,614 | 1,630 | 1,189 |
| iGPU (fp16) | 837 | 1,529 | N/A |
| dGPU (TensorRT fp16) | 3,470 | N/A | N/A |
The WinML float32 path puts the 7 16 last on CPU at 122 and first on GPU at 553, 35% ahead of the Arc Pro B390 and 30% ahead of the ThinkPad. Running each vendor native runtime instead, the discrete card more than doubles anything the integrated silicon manages at 3,470 through TensorRT. The NPU result of 1,614 is a virtual tie with the 5 16s Intel, which is expected since both use the same 50 TOPS engine, and the 837 on integrated graphics reflects the smaller iGPU in the 386H rather than the Arc Pro B390.
UL Procyon AI Image Generation
The Procyon AI Image Generation Benchmark provides a consistent method for measuring AI inference performance from low-power NPUs to high-end GPUs, with three tests: Stable Diffusion XL FP16 for high-end GPUs, Stable Diffusion 1.5 FP16 for moderately powerful GPUs, and Stable Diffusion 1.5 INT8 for low-power devices. The benchmark uses the optimal inference path for each platform: OpenVINO on Intel systems, the AMD-optimized DirectML pipeline on Radeon GPUs, and TensorRT on NVIDIA GPUs. The INT8 test uses Intel’s quantized SD 1.5 model where supported; the AMD pipeline does not offer a comparable quantized run. Our review unit runs this suite through TensorRT on the RTX PRO 3000. New with this round, we also ran the INT8 workload on the Intel NPU.
| Procyon AI Image Generation | Dell Pro Precision 7 16 (RTX PRO 3000) | Dell Pro Precision 5 16s Intel (Arc Pro B390) | Dell Pro Precision 5 16s AMD (Radeon 890M) | Lenovo ThinkPad P14s Gen 7 (RTX PRO 1000) |
| SD 1.5 FP16 | 1,424 | 638 | 316 | 943 |
| SD 1.5 INT8 | 17,287 | 7,778 | 2,855 | 12,403 |
| SDXL FP16 | 1,273 | 738 | 200 | 765 |
| SD 1.5 INT8 NPU | 2,870 | 2,881 | N/A | N/A |
TensorRT leads every row. The INT8 workload returns 17,287 against 12,403 for the ThinkPad and 7,778 for the Arc Pro B390, and SDXL comes in at 1,273, where the two integrated systems sit at 738 and 200. The NPU score of 2,870 is effectively identical to the 5 16s Intel score of 2,881, again, the same Intel accelerator doing the same work.
SPECviewperf 15
SPECviewperf 15 measures graphics performance using viewsets derived from professional applications in CAD, 3D modeling, rendering, engineering, and medical visualization. Our review unit ran the suite at its native 4K and produced scores in all 11 viewsets. The comparison systems ran at 1080p, which is not comparable to a 4K run, so this table includes only the review unit.
| SPECviewperf 15 (4K) | Dell Pro Precision 7 16 (RTX PRO 3000) |
|---|---|
| 3dsmax-08 | 32.38 |
| blender-01 | 30.20 |
| catia-07 | 42.71 |
| creo-04 | 114.70 |
| energy-04 | 26.28 |
| enscape-01 | 11.65 |
| maya-07 | 71.18 |
| medical-04 | 50.48 |
| snx-05 | 82.27 |
| solidworks-08 | 63.99 |
| unreal_engine-01 | 50.42 |
Run at the panel native 4K, the 7 16 completed all 11 viewsets. creo-04 at 114.70 and snx-05 at 82.27 are the strongest results, and enscape-01 at 11.65 is the weakest. Because the comparison systems ran these viewsets at 1080p, these figures should not be read against the other tables in this review.
SPECworkstation 4
SPECworkstation 4 measures workstation performance across CPU, graphics, storage, AI, product design, engineering, financial services, and other professional workloads, using real applications grouped into seven industry verticals. Higher scores are better, and N/A means the system did not complete every workload required for that category. The standalone 7-Zip workload inside SPECworkstation failed on our review unit and on the 5 16s AMD, which suppresses the CPU subsystem and Productivity and Development scores for both; reruns reproduced the same failure on each, and our separate 7-Zip section above covers that ground.
| SPECworkstation 4 | Dell Pro Precision 7 16 | Dell Pro Precision 5 16s Intel | Dell Pro Precision 5 16s AMD | Lenovo ThinkPad P14s Gen 7 |
| Hardware Subsystems | ||||
| Graphics | 6.54 | 2.67 | 2.65 | 4.51 |
| Accelerator | 3.88 | 2.25 | 2.31 | 3.26 |
| Storage | 1.30 | 1.80 | 1.00 | 1.67 |
| CPU | N/A | 1.34 | N/A | 1.35 |
| Industry Verticals | ||||
| AI & Machine Learning | 1.76 | 1.47 | 1.45 | 1.65 |
| Energy | 1.87 | 1.55 | 1.38 | 1.69 |
| Financial Services | 1.03 | 0.94 | 1.29 | 0.96 |
| Life Sciences | 2.03 | 1.84 | 1.47 | 1.82 |
| Media & Entertainment | 1.87 | 1.60 | 1.48 | 1.81 |
| Product Design | 1.87 | 1.75 | 1.41 | 1.89 |
| Productivity & Development | N/A | 1.35 | N/A | 1.34 |
The Graphics subsystem score of 6.54 is 2.4 times that of the integrated system and 45% higher than the ThinkPad, while the 7 16 leads four of the six industry verticals it completed. Product Design goes to the ThinkPad by a narrow 1.89 to 1.87 margin, while the AMD system leads Financial Services. The CPU and Productivity and Development scores are N/A because the standalone 7-Zip workload failed, the same failure recorded on the 5 16s AMD. Storage finished at 1.30, the second-lowest result of the group, which also follows the relatively weak storage performance recorded in 3DMark Storage.
Conclusion
The Dell Pro Precision 7 16 is built around a very different set of priorities than the Pro Precision 5 16s Intel, and the RTX PRO 3000 is the reason to spend the extra money. GPU rendering was where the gap became especially large, with the 7 16 producing 1,555.53 samples per minute in Blender Monster compared with 572.84 from the Arc Pro B390, with similarly large gains in Junkshop and Classroom. V-Ray, local AI text generation, Topaz Video AI, and Blackmagic RAW also benefited heavily from the discrete GPU, including 137 fps in the BRAW GPU test compared with 87 fps from the 5 16s Intel. CPU performance does not provide the same advantage; however, the less expensive 5 16s Intel was as fast or faster in several processor-heavy tests, including Geekbench, Cinebench, and y-cruncher.
The additional hardware also comes with a substantial battery penalty, even with the 7 16 carrying a much larger 96Wh brick. Its 11 hours and 43 minutes in the Modern Office test is less than half the 24 hours and 43 minutes delivered by the 5 16s Intel, which is a major difference for anyone regularly working away from a desk. There are some excellent upgrades beyond the RTX PRO 3000, including the 3840 x 2400 Tandem OLED with 120Hz VRR, the large haptic trackpad, two Thunderbolt 5 ports, a full-size SD card reader, and room for two Gen5 SSDs. Dell also keeps the battery, SSDs, and cooling fans accessible once the bottom cover is removed, although the 64GB of LPDDR5x memory is soldered and cannot be upgraded later. Our RAID 0 configuration was also light in storage testing, as the two Gen5 drives did not outperform the single-drive systems, contrary to what their configuration would suggest.
Pricing ultimately makes the choice between these two systems fairly easy. Our exact dual-drive configuration works out to approximately $8,245 based on the hardware Dell shipped, putting the 7 16 roughly $1,900 to $2,300 above the 5 16s Intel, depending on how the configurations are compared. Engineers, 3D artists, visualization professionals, video editors, and users running GPU-accelerated local AI workloads can see enormous performance gains from the RTX PRO 3000, and those workloads give the added cost a valuable purpose. Users spending most of their time in CPU-heavy applications, development work, office workloads, or anything that does not benefit substantially from NVIDIA graphics should look closely at the 5 16s Intel instead. It offers similar or better CPU performance, more than twice the battery life, and a considerably lower price, while the Pro Precision 7 16 earns its premium specifically for users who can put its much faster GPU to work.
For configuration options and current pricing, visit the Dell Pro Precision 7 Series 16 product page.
Leaderboard: The Dell Pro Precision 7 16 Intel ranks #19 on our Laptop Battery Life Leaderboard and appears in the field on our Best Mobile Workstations and Best Laptops for Local AI pages.


 Amazon